 Brian DellaValle1,2,3*
 Alba Manresa-Arraut4
 Henrik Hasseldam4
 Allan Stensballe5Jørgen Rungby1,6
 Agnete Larsen1†
 Casper Hempel2,3,7†
- 1Department of Biomedicine/Pharmacology, Aarhus University, Aarhus, Denmark
- 2Department of Clinical Microbiology, Copenhagen University Hospital, Copenhagen, Denmark
- 3Department of Immunology and Microbiology, Faculty of Health and Medical Sciences, University of Copenhagen, Copenhagen, Denmark
- 4Department of Biomedical Sciences, Faculty of Health, University of Copenhagen, Copenhagen, Denmark
- 5Department of Health Science and Technology, Aalborg University, Aalborg, Denmark
- 6Department of Endocrinology, Bispebjerg Hospital Copenhagen, Copenhagen, Denmark
- 7Department of Micro- and Nanotechnology, Technical University of Denmark, Kongens Lyngby, Denmark
Introduction: Multiple sclerosis (MS) is a devastating autoimmune disease, afflicting people in the prime of their lives. Presently, after initial clinical presentation, there are no reliable markers for whether a patient will develop MS, or whether their prognosis will be aggressive or relapsing–remitting. Furthermore, many MS patients do not respond to treatment. Thus, markers for diagnosis, prognosis, and treatment-responsiveness are lacking for a disease, where a precision medicine approach would be valuable. The glycocalyx (GLX) is the carbohydrate-rich outer surface of the blood vessel wall and is the first interaction between the blood and the vessel. We hypothesized that cleavage of the GLX may be an early stage predictor of immune attack, blood–brain barrier (BBB) breakdown, and disease severity in MS.
Methods: Two experimental models of MS, experimental autoimmune encephalitis (EAE), were included in this study. EAE was induced in C57BL/6J mice and Lewis rats, which were monitored for weight loss and clinical presentation in comparison to healthy controls. Plasma samples were obtained longitudinally from mice until peak disease severity and at peak disease severity in rats. Soluble GLX-associated glycosaminoglycans (GAG) and proteoglycans (PG) were detected in plasma samples.
Results: All animals receiving EAE emulsion developed fulminant EAE (100% penetrance). Increased plasma levels of chondroitin sulfate were detected before the onset of clinical symptoms and remained elevated at peak disease severity. Hyaluronic acid was increased at the height of the disease, whereas heparan sulfate was transiently increased during early stages only. By contrast, syndecans 1, 3, and 4 were detected in EAE samples as well as healthy controls, with no significant differences between the two groups.
Discussion: In this study, we present data supporting the shedding of the GLX as a new class of biomarker for MS. In particular, soluble, sugar-based GLX components are associated with disease severity in two models of MS, molecules that would not be detected in proteomics-based screens of MS patient samples. Patient studies are presently underway.
Introduction
Multiple sclerosis (MS) is a devastating autoimmune disease, often afflicting those in the prime of their lives. In the US alone, 200 new cases are diagnosed each week; however, current MS treatments are non-curative, side-effect prone, and expensive, highlighting the need for expanded treatment options (1, 2). Despite the advent of proteomics for assessing plasma biomarkers, treatment strategies are challenged by the lack of pathognomonic biomarkers predicting disease severity, early signs of new disease flares, and response-to-treatment (3, 4). For those diagnosed with clinically isolated syndrome, who have a 50% risk of progressing to MS, improved tools would evaluate their need for side-effect prone medical treatment. In this study, we utilize two variations of a well-described rodent model of MS, experimental autoimmune encephalitis (EAE) to identify a new and easily detectable class of potential biomarkers associated with disease debut and progression.
The glycocalyx (GLX) is a wide-spectrum term encompassing the diverse, carbohydrate-rich outer surface of the majority of cells in the body, including the luminal endothelium (5). Since this layer is the first interaction between the blood and the vessel wall, both throughout the body and specifically at the blood–brain barrier (BBB), we hypothesized that shedding of the GLX may be an early stage predictor of immune attack, BBB breakdown, disease severity, and treatment efficacy. Indeed, plasma detection of GLX shedding has been shown to be relevant for vascular permeability and overall disease progression for other inflammatory disease, such as sepsis, cerebral malaria, stroke, and trauma (6–11).
Due in part to an underestimation on its size, the biological and pathophysiological importance of GLX has been largely overlooked. Moreover, in the search for plasma biomarkers, sugar-based, GLX components would not be detected in large-scale protein-based assays, such as mass spectrometry. Indeed, proteomics studies have identified a plethora of plasma biomarkers associated with EAE and MS yet, to our knowledge, there have been no studies focused on the shedding of the GLX, in particular, glycosaminoglycans (GAGs) and proteoglycans (PGs). Chondroitin sulfate (CS), heparan sulfate (HS), and hyaluronic acid (HA) are GAGs shed from the GLX earlier than their membrane-anchored PG ectodomains, and thus may represent an early stage biomarker for attack or severity (12). In this study, we assess a timeline of GLX shedding of specific GAGs and syndecan (Syn) PGs over the course of EAE progression. We present the first evidence of early shedding of GAGs at different time points before and after disease debut. This data suggest that GAG detection should be investigated further as a potential biomarker for attack and severity in MS and response-to-treatment and could be valuable for increased minimally invasive disease monitoring.
Materials and Methods
EAE Induction
Myelin Oligodendrocyte Glycoprotein (MOG)-Induced EAE in C57BL6 Mice
Female C57Bl/6 mice {Taconic, Denmark (DK) aged 17 weeks [22.8 ± 0.4 g; early adulthood (13)]} were housed under standard conditions. EAE was induced in C57Bl/6 mice by active immunization with myelin oligodendrocyte glycoprotein (MOG) 35–55 using the kit EK-2110 from Hooke labs (MA, USA), following the manufacturer’s protocol. Briefly, mice were injected subcutaneously (s.c.) at two flanks with 200 µg of MOG 35–55 emulsified in Complete Freund’s adjuvant (CFA; N = 9), or 100 µl of PBS in case of the control mice (N = 6). At 2 and 24 h post-immunization the mice were injected i.p. with 100 µl of 4 µg/ml pertussis toxin (PTX) or 100 µl PBS for the control mice. Mice were monitored daily for clinical signs of disease and assigned a disease score according to the EAE clinical scoring system devised by the Danish Animal Experiments Inspectorate (see below).
Myelin Basic Protein (MBP)-Induced EAE in Lewis Rats
Female Lewis rats (Charles River, Germany) aged 14 weeks (219 ± 1 g) were administered an emulsion consisting of: 100 µl complete Freund’s adjuvant (CFA; BD 263810, DK), 200 µg Mycobacterium tuberculosis H37Ra (BD, 231141, DK), 100 µg guinea pig myelin basic protein (MBP; Sigma-Aldrich, DK, M2295), and 100 µl 0.9% saline (14).
Directly after preparation, a total of 200 μl emulsion was administered intradermally to animals for EAE under isoflurane anesthesia at three sites at the base of the tail, totaling 200 µl in volume (N = 10). MBP-EAE and control rats (N = 8) were treated with a small volume of saline twice-daily (100 μl), in accordance with the design of another study in order to limit the use of experimental animals. Since this set of animals was used as controls for a separate therapeutic intervention study, we could not sample blood longitudinally. Therefore, we obtained only terminal plasma samples at peak disease severity.
Studies were conducted to minimize suffering and were approved by the Danish Animal Inspectorate (2015-15-0201-00647 and 2012-DY-2934-00001). Weight was monitored daily throughout the experiment.
Clinical Scoring
Clinical scoring was performed twice daily using the following scale relating to progressive degrees of paralysis: 0, no clinical signs of EAE; 1, abolished tail tone; 2, mild paresis of one or both hind legs; 3, moderate paresis of one or both hind legs; 4, severe paresis of one or both hind legs; 5, paresis of one or both hind legs and incipient paresis of one or both forelegs are deemed moribund. Animals were deemed terminally ill according to predefined humane endpoints designed in consultation with the Danish Animal Inspectorate: animals registering a clinical score of ≥4, or a ≥20% loss of initial body weight.
Timeline Sampling (MOG-EAE)
Before induction and from day 3 post-induction of EAE-MOG, a small volume of blood was collected from the facial vein into EDTA-powdered tubes for longitudinal samples. Blood was spun at 4°C and plasma isolated, flash frozen in liquid nitrogen, and stored at −80°C for analyses.
At the termination of the experiment (defined as “peak EAE scoring”), whole blood was isolated under 2% isoflurane anesthesia from the orbital plexus (C57Bl/6; anticoagulant, EDTA) or transcardially (Lewis Rat; anticoagulant: citrate), spun at 4°C, and plasma isolated, flash frozen in liquid nitrogen, and stored at −80°C for analyses.
Enzyme-Linked Immunosorbent Assay (ELISA)
Hyaluronic acid in plasma was quantified with a commercially available ELISA kit (Echelon Biosciences, K-1200, Roskilde, Denmark).
Plasma Dot Blotting
Due to the small volumes of plasma available with serial sampling, dot blots were used to assess GLX markers longitudinally, similar to our previous work (10). Two microliters of plasma were dotted in duplicate on a cationic nitrocellulose membrane (Hybond N+, Amersham, GE Healthcare, Brondby, Denmark) and allowed to dry. The membrane was incubated for 60 min at room temperature in blocking buffer: 5% skim milk powder (Sigma-Aldrich) in tris-buffered saline (Tris-buffered saline) + 0.05% Tween20 [Tris-buffered saline (TBS-T); Sigma-Aldrich]. The membrane was incubated thereafter with primary antibodies at their respective dilutions overnight, at 4°C. Membranes were thereafter washed in TBS-T and incubated with secondary antibodies conjugated to horseradish peroxidase, diluted at respective dilutions in blocking buffer, and raised against the source of the primary for 60 min. Membranes were washed thoroughly with TBS-T and finally in TBS. Membranes were visualized with Supersignal West femto luminescent substrate and Chemidoc XRS CCD camera (Bio-Rad Laboratories). Chemiluminescence was quantified with densitometry after normalizing to background with ImageJ software. Membranes were thereafter stripped with Restore Stripping Buffer (ThermoScientific, 21509) for 10 min at room temperature, washed in TBS and stripping was confirmed with identical development protocol (Femto, CCD camera). Membranes were blocked again with blocking buffer and probed for different antigens of interest (Second probe).
Primary and Secondary Antibodies
First Probing: HS (1:1,000, 10E4, cat no H1890, US Biological, MA, USA), Syn-1 (1:750, 281-1, cat no 553712, BD Pharmingen, Brøndby, Denmark), Syn-4 (1:750, KY8/2, cat no 550350, BD Pharmingen), CD44 (1:200, DAKO, Glostrup, Denmark). Second probing: CS (1:1,000, CS-56, cat no C8035, Sigma-Aldrich, Brøndby, Denmark), syndecan-3 (1:1,000, cat no AF3539, R&D Systems, UK). HRP-conjugated secondary antibodies: anti-rabbit (1:2,000), anti-rat (1:4,000), and anti-mouse (1:3,000) (DAKO, Glostrup, Denmark). All syndecan antibodies detect the syndecan protein structure and not carbohydrates.
Data Analysis
Data sets were tested for normality (Shapiro–Wilk) and equal variance before statistical analyses were performed. Weight and dot blot data (MOG-EAE) were assessed with two-way ANOVA or Student’s t-test (MBP-EAE), ELISA data were assessed with Student’s t-test, and clinical scoring (MOG-EAE) was tested with Wilcoxon signed-rank test to determine when the median clinical score was statistically above 0. A p-value of <0.05 was reported as statistically significantly different. Data are presented as mean ± SEM for normal data and median ± interquartile range for non-normal data. Longitudinal data from MOG-EAE are presented as normalized to day −1, the day before the EAE emulsion was administered.
Results
EAE Induction
All animals receiving EAE emulsions developed clinical symptoms of paresis and experienced weight loss throughout the experiment representing a penetrance of 100% (Figure 1). As expected, an EAE-induced weight loss occurred 1–2 days prior to the additional signs of disease in both MOG-EAE (Figures 1A,B) and in MBP-EAE (Figures 1C,D). In MOG-EAE, clinical scoring was significantly above 0 from day 14 until termination (day 20) with a peak, median clinical score of 2.5 (day 19), and weight loss was significantly different from healthy controls from day 13.
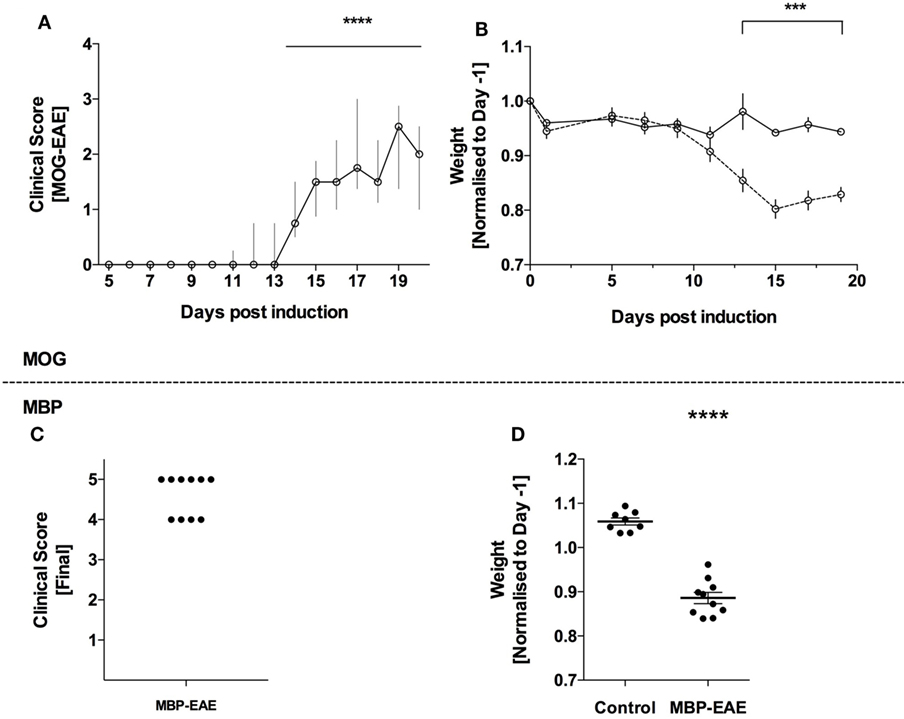
Figure 1. Full penetrance of experimental autoimmune encephalitis (EAE) induction in two models of multiple sclerosis. EAE was induced in C57Bl/6 mice with myelin oligodendrocyte glycoprotein (MOG-EAE) and in Lewis rats with myelin basic protein (MBP-EAE). (A) Clinical symptoms of increasing caudal–rostral CNS paralysis were significantly above zero from day 14 until peak disease. The experiment was terminated (day 20), coinciding with concomitant weight loss (B) in all mice that received MOG-EAE emulsion. MBP-EAE also induced clinical symptoms (C) and weight loss (D) in all rats receiving MBP-EAE emulsion. Data are presented as: (A) median with interquartile range; (B) average weight normalized to weight-before-emulsion (day −1); (C) dot blot of MBP-EAE rats included; (D) dot plot of weight normalized to weight-before-emulsion (day −1). Statistical differences were reported as *** or **** representing a p-value <0.001 and 0.0001, respectively, after testing for normality (Shaprio–Wilk) and equal variance and running the following statistical analysis: (A) Wilcoxon signed-rank test against the hypothetical value of 0; (B) two-way ANOVA; and (D) Student’s t-test. (A,B) N = control (6), MOG-EAE (9); (C,D) N = control (8) and MBP-EAE (10).
Detection of GLX Shedding in Plasma: GAGs Vary at Early- and Late-Stage of Disease
Due to constitutive turnover of GLX components, as expected, all soluble GLX markers tested were present in control plasma (15–17).
In MOG-injected mice, HS levels were significantly above healthy controls from an early time point, day 5, and remained significantly above until day 11 (Figure 2A). Thereafter HS was no longer significantly above controls. Relating to Figure 1, HS peaked and returned to baseline before significant weight loss and clinical scoring occurred.
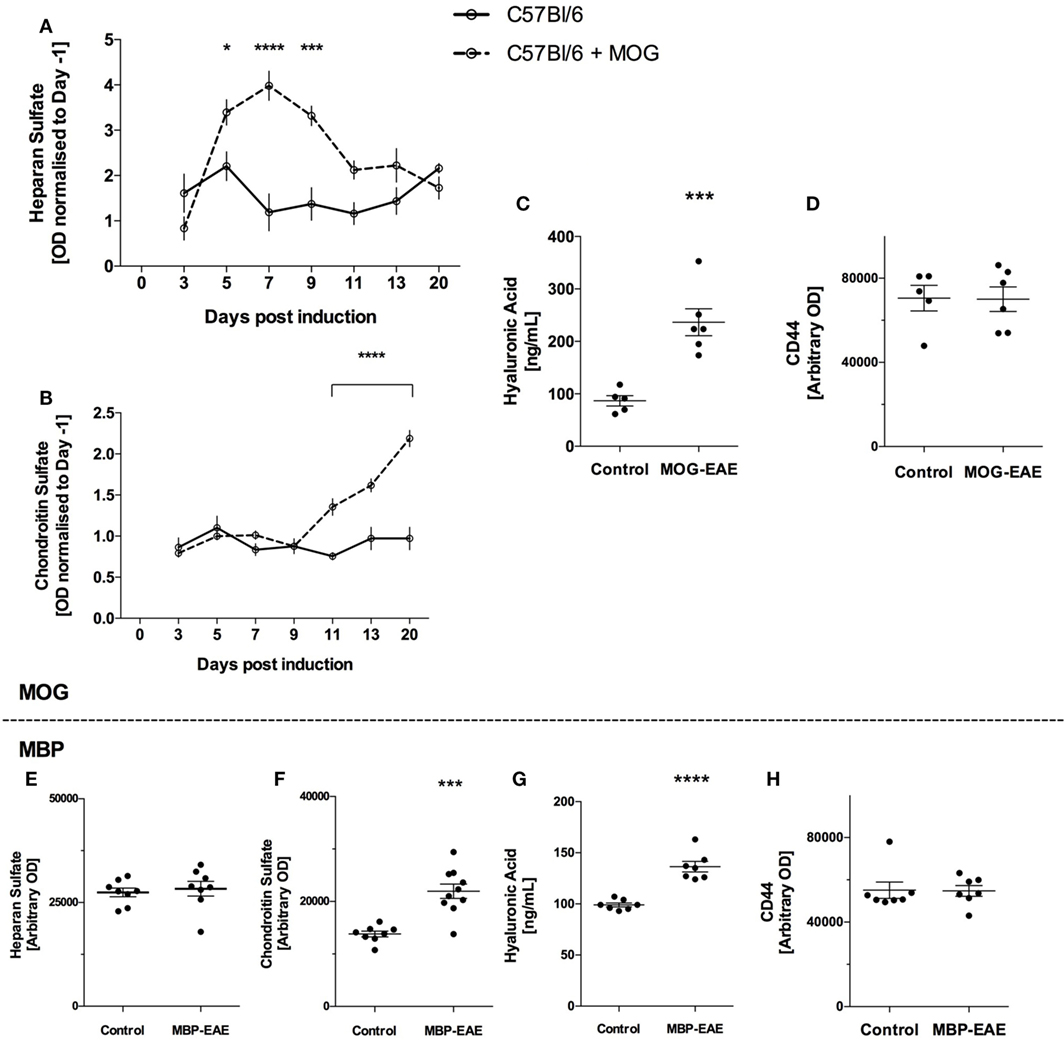
Figure 2. Sugar-based glycocalyx (GLX) markers significantly increased in plasma with disease course in myelin oligodendrocyte glycoprotein (MOG)-experimental autoimmune encephalitis (EAE) and are increased in late-stage myelin basic protein (MBP)-EAE. Sugar-based glycosaminoglycans heparan sulfate (HS), chondroitin sulfate (CS), and hyaluronic acid (HA) follow disease course in MOG- and MBP-EAE. (A) HS increases in the plasma at an early time point and returns to baseline are present manifest (Figure 1A). (B) Conversely, CS increases significantly in the plasma approximately ~2 days before clinical symptoms present in MOG-EAE. Detection of CS in the plasma proceeds to increase ~2-fold above controls at peak disease severity (day 20). (C) HA is ~2.5-fold higher in peak severity MOG-EAE when compared to controls. (D) CD44, an endothelial hyaluronate receptor did not vary between groups. Similar to MOG-EAE at peak disease severity, plasma from MBP-EAE at peak disease severity shows unchanged HS levels between diseased and control rats (E), and significantly higher CS and HA levels when compared to controls (F,G). CD44 (H) did not vary between groups. Data are presented as line graphs (A,B) normalized to pre-EAE levels (day 1) and (C–H) dot plots of control vs. EAE. Statistical significance is reported when p-value is <0.05 where *, ***, and **** refer to p < 0.05, 0.001, and 0.0001, respectively, after testing for normality (Shaprio–Wilk) and equal variance and running the following statistical analysis: (A,B) two-way ANOVA, (C–E) Student’s t-test.
In contrast, CS levels were detected at similar levels to controls until day 11 where CS increased significantly (Figure 2B). This difference progressed steadily until the termination of the experiment, where CS levels in MOG-EAE mice were ~2-fold above controls. Control CS levels were relatively stable throughout the experiment. Relating to Figure 1, CS increased significantly ~2 days prior to weight loss and clinical scoring and steadily increased until peak disease activity.
Due to the volume required for ELISA, HA was only detected at termination of the experiment. As shown in Figure 2C, MOG-EAE resulted in significantly increased concentrations in plasma relative to controls (~2.5-fold from 86.8 ± 9.8 to 236.6 ± 25.7 ng/ml). Due the potential for binding of HA to the endothelial hyaluronate receptor CD44 (18), CD44 levels in plasma were also tested to assess whether potential CD44-HA complexes contribute to the observed difference. As shown in Figure 2D, CD44 did not vary in plasma from control and MOG-EAE mice (p = 0.95).
In late-stage MBP-EAE in Lewis rats, similar results were obtained for each GAG: HS levels were not different from controls (Figure 2E), whereas CS and HA levels were ~1.5-fold significantly above control levels (Figures 2F,G). CD44 was not different in plasma (p = 0.9, Figure 2H).
Detection of GLX Shedding in Plasma: Proteoglycans
Syndecan-1, 3, and 4 were detected in plasma of MOG-EAE and control mice throughout the experiment (Figure 3) and all three markers were relatively stable throughout the MOG-EAE disease course, albeit inclusive of day-to-day fluctuation (Figure 3A). Syn-1 was significantly above controls at day 13; however, it was not significantly different at the termination of the experiment.
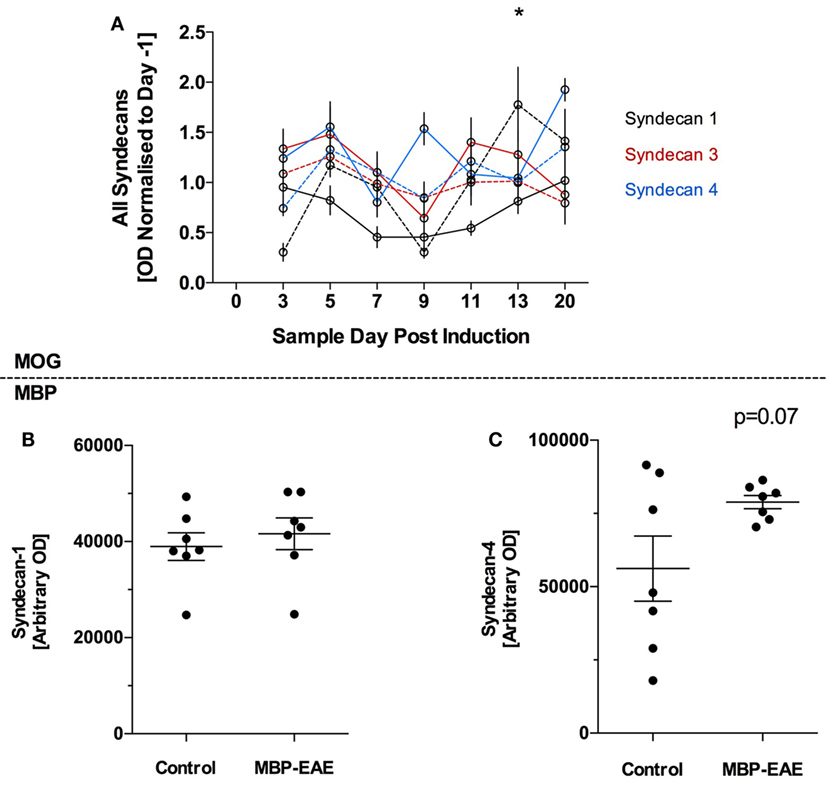
Figure 3. Protein-based glycocalyx (GLX) markers are largely unchanged in myelin oligodendrocyte glycoprotein (MOG)- and myelin basic protein (MBP)-experimental autoimmune encephalitis (EAE) in the initial stage of disease from induction until peak disease severity. GLX-based proteoglycans of the syndecan family were detected in the plasma of MOG- and MBP-EAE-induced rodents. In the MOG-EAE model (A), levels of Syn-1 (black), Syn-2 (red), and Syn-4 (blue) were determined in controls (full line) and longitudinally until and at peak severity in disease (dotted line). In MBP-EAE, levels of Syn-1 (B) and Syn-4 (C) in controls and at disease peak severity were determined. (A) Inclusive of some day-to-day fluctuation, all three markers were relatively stable throughout the MOG-EAE disease course (A). Nevertheless, Syn-1 was significantly increased in MOG-EAE at day 13. Syn-1 and -4 were not different in MBP-EAE at peak disease severity (B,C). Syn-4 (C) tended to be higher than the control group but not significantly (p = 0.07), wherein the control group had a high internal variability. Data are presented as line graphs (A) normalized to pre-EAE levels (day −1) and (B,C) dot plots of control vs. EAE. Statistical significance is reported when p-value is <0.05, where * refers to p < 0.05 after testing for normality (Shapiro–Wilk) and equal variance and running the following statistical analysis: (A) two-way ANOVA, (B,C) Student’s t-test.
In late-stage MBP-EAE, a similar pattern was observed: no differences were detected between MBP-EAE and controls (Figures 3B,C), albeit a trend was detected in favor of higher shedding of Syn-4 in late-stage MBP-EAE (Figure 3C, p = 0.07).
Discussion
With this study, we propose that the shedding of the polysaccharide-rich GLX may be a useful marker for disease activity in MS. This is based on the first evidence that distinct, soluble GAGs of the GLX are responsive to experimental myelin-based autoimmunity in the plasma of rodents. Rodent EAE models have many pathophysiological similarities to human MS and have contributed to the understanding of MS pathology and the development of therapeutic interventions (19).
In the search of pathognomonic biomarkers of MS, a plethora of candidate molecules have been proposed, generated through both targeted studies and large-scale proteomic- and transcriptomic studies. Potential markers include chemokines, cytokines, cholesterols, growth factors, microRNAs, brain-derived proteins, proteases, autoantibodies, and anti-viral antibodies (3, 4, 20, 21). The present golden standard for MS diagnosis remains an assessment of expanded disability status scale, brain volume/lesion size MRI, and, in some facilities, cerebrospinal oligoclonal/immunoglobulin index (2, 4). Interestingly, the distinct glycan molecules in this study would not be detected in proteomic screens of plasma, and thus represents a new class of candidate biomarkers readily available through simple antibody-based testing of small volumes of plasma or serum.
Glycans in the Peripheral Blood: Promising New Class of Biomarker in MS?
Longitudinally, MOG-EAE showed differing shedding curves with respect to the distinct glycans studied (Figure 2A–C). HS shed significantly higher than controls at an early phase, before presentation of clinical symptoms, and returned to baseline by day 11 as the clinical symptoms began to present. Contrasting, CS shedding closely followed the development of clinical symptoms and peaked at study termination. HA was significantly higher in MOG-EAE than controls at the peak of disease. This difference was not related to CD44 levels in the plasma and can, therefore, be attributed to unbound plasma HA (18). Furthermore, this indicates that HS and CS/HA shedding reflect different parts of the disease pathology. As the EAE model system is known to induce a T-cell response to a myelin protein, it is interesting to further investigate if animals exposed solely to the adjunctive elements, i.e., the CFA/PTX, would indeed mimic the early HS response. Nevertheless, CS and HA are indeed the most EAE-specific elements of the GAGs.
Glycans in the Peripheral Blood: Increased Sheddase Activity?
Specific cleavage of HS is mediated by different types of endogenous heparanases: one located in the endothelium and others located in circulating immune cells and platelets (22, 23). We suggest that heparanase activity is increased as response to CFA, since PTX was previously shown to inhibit G-protein coupled receptor-mediated shedding (12). Thus, with CFA being immunostimulatory it is likely that the injection leads to heparanase secretion from leukocytes. CFA/PTX does not seem to stimulate other sheddases, since the other markers assessed were unaffected by this injection. Nevertheless, it could be expected that plasma HS would increase during a later phase of EAE where glial expression of heparanase is increased (24). Since we followed the disease course only until peak disease, this effect may emerge in the peripheral blood after a longer time interval.
Heparan sulfate is the most abundantly present GAG in the endothelial GLX followed by HA and CS (5). In contrast, CS levels in tissues are generally higher than HS. Intriguingly, increased plasma levels of CS coincided with clinical symptoms. Moreover, HA levels in plasma were substantially increased. The enzyme hyaluronidase is found in platelets and leukocytes, has specificity for both of these GAGs, and thus, may be involved in the shedding we observe (25, 26). Furthermore, increased plasma levels of HA could also be a result of the inflammatory conditions present in EAE which stimulates HA synthesis (27), however, endothelial coverage decreases overall, suggesting that HA turnover under some inflammatory conditions is not fully compensated by synthesis. Both CS and HA were previously shown to be involved in CNS injury (28). In addition to endothelial origin, the source of these markers in the blood could also be the CNS proper, due to an increased BBB permeability. PTX injection has been shown to induce a transient BBB opening, whereas an EAE-induced opening coincides with leukocyte entering the nervous tissue and initiation of the clinical phase thereafter (29). This is reflected in the CS response, where increased levels in the MOG-EAE animals were seen 2–3 days before clinical disease debut.
Beyond their compositional differences, GAGs are produced in different ways: HS and CS are produced in the Golgi compartment, polymerized and transported to the cell surface anchored to its respective proteoglycan; whereas HA is synthesized at the cell surface and not covalently attached to any cell surface proteins (5, 28). This has importance for interpretation of the shedding. Detecting HA in the plasma suggest hyaluronidase activity, while detection of CS could be the result of both hyaluronidase activity and protease activity. Therefore, as we do not observe an increase in the endothelial-specific PGs, we interpret this to be a result of increased hyaluronidase activity in the cerebrovascular compartment and/or in the cerebral parenchyma proper (25, 28, 29).
Glycans in the Peripheral Blood: MOG-EAE vs. MBP-EAE
Glycosaminoglycans levels at the peak-stage of EAE were similar in result and magnitude in both rodent models: MOG-EAE increased CS and HA by 2- to 2.5-fold, respectively with no change in HS, and MBP-EAE increased CS and HA by 1.5-fold with no change in HS, compared to respective controls. However, MBP-EAE rats show higher disease severity than MOG-EAE mice [~4.5 vs. 2.5, respectively (Figure 1)].
Proteoglycans in the Peripheral Blood
In the disease phase of this study, shedding of the GLX ectodomains of Syn-1, 3, and 4 seemed to be unaffected by inflammation, endothelial activation, and nervous tissue damage. Our data suggest that loss of PG itself is not extensive at these time points. Since this study involves only the induction phase and first clinical peak of EAE we cannot rule out that PG ectodomains may begin to shed above control levels at a more advanced time after EAE induction.
GAGs and Pathogenesis of EAE
Glycosaminoglycans play multiple important roles in EAE pathogenesis. Initial leukocyte rolling and infiltration into the CNS can be reduced by removing GAGs from the vasculature (30, 31). This is further substantiated by i.v. injections of soluble GAGs that serve as an extra reservoir of binding partners for leukocytes, resulting in decreased neuroimmunity (32–34). Moreover, GAGs play a key role in controlling neuroinflammation, where HA accumulation has been shown to increase in demyelinated lesions and impair remyelination (35) and pharmacological removal of HA reduces spinal cord demyelination (30). Also, CS accumulation has been shown to impair remyelination (36). Furthermore, GAGs can activate and recruit immune cells and are thought to be endogenous signals for damage (37, 38). Therefore, the use as biomarkers for CNS inflammation, and possibly MS, is highly promising, further underlined by this study. Interestingly, others have shown that Syn-1 knockout animals have a worse prognosis in MOG-EAE and that Syn-1 is increased in the cerebrospinal fluid of mice at peak EAE (39). Moreover, it has been reported from polymorphism studies that the gene for another PG, glypican-5, is associated with MS development (40) and with responders to interferon-beta treatment (41) albeit, the pathogenic significance of this finding is unclear.
Conclusion
We present evidence of glycan shedding in experimental MS and a longitudinal course of shedding that appears relevant as a potential new class of biomarker for autoimmune inflammation. Ideally, a biomarker would be absent in healthy individuals and present in diseased patients. Indeed, the power of glycan shedding to detect difference in disease vs. non-diseased animals from two models of MS is a strong indicator that further, detailed studies of these molecules in patients are warranted. We are presently assessing the translational relevance of this finding in MS patients with the ultimate goal of improving disease monitoring and predictability, and providing a reliable complementary diagnostic tool for treatment response.
Ethics Statement
Female C57Bl/6 mice (Taconic, Denmark) aged 17 weeks (22.8 g) and female Lewis rats (Charles River, Germany) aged 14 weeks weighing (219 g) were housed under standard conditions. Studies were conducted to minimize suffering and were approved by the Danish Animal Inspectorate (2015-15-0201-00647 and 2012-DY-2934-00001). Weight was monitored daily throughout the experiment. Animals were monitored daily for clinical signs of disease and assigned a disease score according to the EAE clinical scoring system devised by the Danish Animal Experiments Inspectorate. Animals were deemed terminally ill according to predefined humane endpoints designed in consultation with the Danish Animal Inspectorate: animals registering a clinical score of ≥4, or a ≥20% loss of initial body weight.
Author Contributions
Designed, conducted, analysis, interpretation, and drafted manuscript: BV. Designed, analysis, interpretation, and drafted manuscript: AL and CH. Designed, conducted, and drafted manuscript: AM. Analysis, interpretation, and drafted manuscript: HH, AS, and JR.
Conflict of Interest Statement
Aarhus University and Technical University of Denmark are owners of a patent related to this work wherein BV, AM-L, and CH are inventors.
Acknowledgments
The authors would like to acknowledge the technical abilities of the animal caretakers at the Biocenter animal stables KU, and the Department of Biomedicine, AU, and Bente Klarlund for the use of the CCD camera.
Funding
Authors would like to thank ScleroseForeningen, Dagmar Marshall Fund, AP Møller fund for financial support.
Abbreviations
BBB, blood–brain barrier; CFA, complete freund’s adjuvant; CS, chondroitin sulfate; DK, Denmark; EAE, experimental autoimmune encephalitis; ELISA, enzyme-linked immunosorbent assay; GAG, glycosaminoglycans; GLX, glycocalyx; HA, hyaluronic acid; HS, heparan sulfate; MBP, myelin basic protein; MOG, myelin oligodendrocyte glycoprotein; MS, multiple sclerosis; PG, proteoglycans; PTX, pertussis toxin; Syn, syndecan; TBS-T, Tris-buffered saline.
References
1. GBD 2015 Neurological Disorders Collaborator Group. Global, regional, and national burden of neurological disorders during 1990-2015: a systematic analysis for the Global Burden of Disease Study 2015. Lancet Neurol (2017) 16:877–97. doi:10.1016/S1474-4422(17)30299-5
2. Reich DS, Lucchinetti CF, Calabresi PA. Multiple sclerosis. N Engl J Med (2018) 378:169–80. doi:10.1056/NEJMra1401483
3. Teunissen CE, Malekzadeh A, Leurs C, Bridel C, Killestein J. Body fluid biomarkers for multiple sclerosis – the long road to clinical application. Nat Rev Neurol (2015) 11:585–96. doi:10.1038/nrneurol.2015.173
4. Raphael I, Webb J, Stuve O, Haskins W, Forsthuber T. Body fluid biomarkers in multiple sclerosis: how far we have come and how they could affect the clinic now and in the future. Expert Rev Clin Immunol (2015) 11:69–91. doi:10.1586/1744666X.2015.991315
5. Reitsma S, Slaaf DW, Vink H, van Zandvoort MA, oude Egbrink MG. The endothelial glycocalyx: composition, functions, and visualization. Pflugers Arch (2007) 454:345–59. doi:10.1007/s00424-007-0212-8
6. Rahbar E, Cardenas JC, Baimukanova G, Usadi B, Bruhn R, Pati S, et al. Endothelial glycocalyx shedding and vascular permeability in severely injured trauma patients. J Transl Med (2015) 13:117. doi:10.1186/s12967-015-0481-5
7. Rehm M, Bruegger D, Christ F, Conzen P, Thiel M, Jacob M, et al. Shedding of the endothelial glycocalyx in patients undergoing major vascular surgery with global and regional ischemia. Circulation (2007) 116:1896–906. doi:10.1161/CIRCULATIONAHA.106.684852
8. Lipowsky HH, Gao L, Lescanic A. Shedding of the endothelial glycocalyx in arterioles, capillaries, and venules and its effect on capillary hemodynamics during inflammation. Am J Physiol Heart Circ Physiol (2011) 301:H2235–45. doi:10.1152/ajpheart.00803.2011
9. Jepsen CH, deMoya MA, Perner A, Sillesen M, Ostrowski SR, Alam HB, et al. Effect of valproic acid and injury on lesion size and endothelial glycocalyx shedding in a rodent model of isolated traumatic brain injury. J Trauma Acute Care Surg (2014) 77:292–7. doi:10.1097/TA.0000000000000333
10. Hempel C, Hyttel P, Kurtzhals JA. Endothelial glycocalyx on brain endothelial cells is lost in experimental cerebral malaria. J Cereb Blood Flow Metab (2014) 34:1107–10. doi:10.1038/jcbfm.2014.79
11. Chelazzi C, Villa G, Mancinelli P, De Gaudio AR, Adembri C. Glycocalyx and sepsis-induced alterations in vascular permeability. Crit Care (2015) 19:26. doi:10.1186/s13054-015-0741-z
12. Mulivor AW, Lipowsky HH. Inflammation- and ischemia-induced shedding of venular glycocalyx. Am J Physiol Heart Circ Physiol (2004) 286:H1672–80. doi:10.1152/ajpheart.00832.2003
13. Dutta S, Sengupta P. Men and mice: relating their ages. Life Sci (2016) 152:244–8. doi:10.1016/j.lfs.2015.10.025
14. DellaValle B, Brix GS, Brock B, Gejl M, Landau AM, Moller A, et al. Glucagon-like peptide-1 analog, liraglutide, delays onset of experimental autoimmune encephalitis in Lewis rats. Front Pharmacol (2016) 7:433. doi:10.3389/fphar.2016.00433
15. Manon-Jensen T, Itoh Y, Couchman JR. Proteoglycans in health and disease: the multiple roles of syndecan shedding. FEBS J (2010) 277:3876–89. doi:10.1111/j.1742-4658.2010.07798.x
16. Staprans I, Felts JM. Isolation and characterization of glycosaminoglycans in human plasma. J Clin Invest (1985) 76:1984–91. doi:10.1172/JCI112198
17. Nelson A, Berkestedt I, Schmidtchen A, Ljunggren L, Bodelsson M. Increased levels of glycosaminoglycans during septic shock: relation to mortality and the antibacterial actions of plasma. Shock (2008) 30:623–7. doi:10.1097/SHK.0b013e3181777da3
18. Culty M, Miyake K, Kincade PW, Sikorski E, Butcher EC, Underhill C. The hyaluronate receptor is a member of the CD44 (H-CAM) family of cell surface glycoproteins. J Cell Biol (1990) 111:2765–74. doi:10.1083/jcb.111.6.2765
19. Robinson AP, Harp CT, Noronha A, Miller SD. The experimental autoimmune encephalomyelitis (EAE) model of MS: utility for understanding disease pathophysiology and treatment. Handb Clin Neurol (2014) 122:173–89. doi:10.1016/B978-0-444-52001-2.00008-X
20. Tejera-Alhambra M, Casrouge A, de Andres C, Seyfferth A, Ramos-Medina R, Alonso B, et al. Plasma biomarkers discriminate clinical forms of multiple sclerosis. PLoS One (2015) 10:e0128952. doi:10.1371/journal.pone.0128952
21. Comabella M, Montalban X. Body fluid biomarkers in multiple sclerosis. Lancet Neurol (2014) 13:113–26. doi:10.1016/S1474-4422(13)70233-3
22. Ishai-Michaeli R, Eldor A, Vlodavsky I. Heparanase activity expressed by platelets, neutrophils, and lymphoma cells releases active fibroblast growth factor from extracellular matrix. Cell Regul (1990) 1:833–42. doi:10.1091/mbc.1.11.833
23. Stoler-Barak L, Petrovich E, Aychek T, Gurevich I, Tal O, Hatzav M, et al. Heparanase of murine effector lymphocytes and neutrophils is not required for their diapedesis into sites of inflammation. FASEB J (2015) 29:2010–21. doi:10.1096/fj.14-265447
24. Lively S, Schlichter LC. The microglial activation state regulates migration and roles of matrix-dissolving enzymes for invasion. J Neuroinflammation (2013) 10:75. doi:10.1186/1742-2094-10-75
25. Girard N, Maingonnat C, Bertrand P, Tilly H, Vannier JP, Delpech B. Human monocytes synthesize hyaluronidase. Br J Haematol (2002) 119:199–203. doi:10.1046/j.1365-2141.2002.03733.x
26. Albeiroti S, Ayasoufi K, Hill DR, Shen B, de la Motte CA. Platelet hyaluronidase-2: an enzyme that translocates to the surface upon activation to function in extracellular matrix degradation. Blood (2015) 125:1460–9. doi:10.1182/blood-2014-07-590513
27. Vigetti D, Genasetti A, Karousou E, Viola M, Moretto P, Clerici M, et al. Proinflammatory cytokines induce hyaluronan synthesis and monocyte adhesion in human endothelial cells through hyaluronan synthase 2 (HAS2) and the nuclear factor-kappaB (NF-kappaB) pathway. J Biol Chem (2010) 285:24639–45. doi:10.1074/jbc.M110.134536
28. Sherman LS, Back SA. A ‘GAG’ reflex prevents repair of the damaged CNS. Trends Neurosci (2008) 31:44–52. doi:10.1016/j.tins.2007.11.001
29. Barkauskas DS, Dixon Dorand R, Myers JT, Evans TA, Barkauskas KJ, Askew D, et al. Focal transient CNS vessel leak provides a tissue niche for sequential immune cell accumulation during the asymptomatic phase of EAE induction. Exp Neurol (2015) 266:74–85. doi:10.1016/j.expneurol.2015.02.018
30. Winkler CW, Foster SC, Matsumoto SG, Preston MA, Xing R, Bebo BF, et al. Hyaluronan anchored to activated CD44 on central nervous system vascular endothelial cells promotes lymphocyte extravasation in experimental autoimmune encephalomyelitis. J Biol Chem (2012) 287:33237–51. doi:10.1074/jbc.M112.356287
31. Takeuchi H. Midkine and multiple sclerosis. Br J Pharmacol (2014) 171:931–5. doi:10.1111/bph.12499
32. Rolls A, Cahalon L, Bakalash S, Avidan H, Lider O, Schwartz M. A sulfated disaccharide derived from chondroitin sulfate proteoglycan protects against inflammation-associated neurodegeneration. FASEB J (2006) 20:547–9. doi:10.1096/fj.05-4540fje
33. Willenborg DO, Parish CR. Inhibition of allergic encephalomyelitis in rats by treatment with sulfated polysaccharides. J Immunol (1988) 140:3401–5.
34. Lider O, Baharav E, Mekori YA, Miller T, Naparstek Y, Vlodavsky I, et al. Suppression of experimental autoimmune diseases and prolongation of allograft survival by treatment of animals with low doses of heparins. J Clin Invest (1989) 83:752–6.
35. Back SA, Tuohy TM, Chen H, Wallingford N, Craig A, Struve J, et al. Hyaluronan accumulates in demyelinated lesions and inhibits oligodendrocyte progenitor maturation. Nat Med (2005) 11:966–72. doi:10.1038/nm1279
36. Keough MB, Rogers JA, Zhang P, Jensen SK, Stephenson EL, Chen T, et al. An inhibitor of chondroitin sulfate proteoglycan synthesis promotes central nervous system remyelination. Nat Commun (2016) 7:11312. doi:10.1038/ncomms11312
37. Sorokin L. The impact of the extracellular matrix on inflammation. Nat Rev Immunol (2010) 10:712–23. doi:10.1038/nri2852
38. Taylor KR, Gallo RL. Glycosaminoglycans and their proteoglycans: host-associated molecular patterns for initiation and modulation of inflammation. FASEB J (2006) 20:9–22. doi:10.1096/fj.05-4682rev
39. Zhang X, Wu C, Song J, Gotte M, Sorokin L. Syndecan-1, a cell surface proteoglycan, negatively regulates initial leukocyte recruitment to the brain across the choroid plexus in murine experimental autoimmune encephalomyelitis. J Immunol (2013) 191:4551–61. doi:10.4049/jimmunol.1300931
40. Lorentzen AR, Melum E, Ellinghaus E, Smestad C, Mero IL, Aarseth JH, et al. Association to the glypican-5 gene in multiple sclerosis. J Neuroimmunol (2010) 226:194–7. doi:10.1016/j.jneuroim.2010.07.003
Keywords: glycocalyx, multiple sclerosis, precision medicine, biomarkers, glycosaminoglycans, proteoglycans, EAE, BBB
Citation: DellaValle B, Manresa-Arraut A, Hasseldam H, Stensballe A, Rungby J, Larsen A and Hempel C (2018) Detection of Glycan Shedding in the Blood: New Class of Multiple Sclerosis Biomarkers? Front. Immunol. 9:1254. doi: 10.3389/fimmu.2018.01254
Received: 27 February 2018; Accepted: 18 May 2018;
Published: 04 June 2018
Edited by:
Fabienne Brilot, University of Sydney, AustraliaReviewed by:
Carole L. Wilson, Medical University of South Carolina, United StatesChiara Cordiglieri, Istituto Nazionale Genetica Molecolare (INGM), Italy
Copyright: © 2018 DellaValle, Manresa-Arraut, Hasseldam, Stensballe, Rungby, Larsen and Hempel. This is an open-access article distributed under the terms of the Creative Commons Attribution License (CC BY). The use, distribution or reproduction in other forums is permitted, provided the original author(s) and the copyright owner are credited and that the original publication in this journal is cited, in accordance with accepted academic practice. No use, distribution or reproduction is permitted which does not comply with these terms.
*Correspondence: Brian DellaValle, YnJpYW5kZWxsYXZhbGxlQGdtYWlsLmNvbQ==
†Shared last authorship.