 Francesco Nicoli1,2*†
 Laura Papagno1
 Justin J. Frere3
 Mariela Pires Cabral-Piccin1
 Emmanuel Clave4,5
 Emma Gostick6
 Antoine Toubert4,5David A. Price6Antonella Caputo2†
 Victor Appay1,7*
- 1INSERM, Centre d'Immunologie et des Maladies Infectieuses, Sorbonne Université, Paris, France
- 2Department of Molecular Medicine, University of Padua, Padua, Italy
- 3Department of Immunobiology and the Arizona Center on Aging, University of Arizona College of Medicine Tucson, Tucson, AZ, United States
- 4Institut Universitaire d'Hématologie, Université Paris Diderot, Sorbonne Paris Cité, Paris, France
- 5INSERM UMR 1160, Laboratoire d'Immunologie et d'Histocompatibilité, Hôpital Saint-Louis, AP-HP, Paris, France
- 6Division of Infection and Immunity, Cardiff University School of Medicine, Cardiff, United Kingdom
- 7International Research Center of Medical Sciences, Kumamoto University, Kumamoto, Japan
Background: Characterization of the intracellular biochemical processes that regulate the generation and maintenance of effector and memory CD8+ T-cells from naïve precursors is essential for our understanding of adaptive immune responses and the development of immunotherapies. However, the metabolic determinants of antigen-driven activation and differentiation remain poorly defined, especially in humans.
Methods: We used a variety of different approaches, including gene expression profiling and measurements of nutrient flux, to characterize the basal and activation-induced energetic requirements of naïve and phenotypically-defined subsets of human memory CD8+ T-cells.
Findings: Profound metabolic differences were apparent as a function of differentiation status, both at rest and in response to stimulation via the T cell receptor (TCR). Of particular note, resting naïve CD8+ T cells were largely quiescent, but rapidly upregulated diverse energetic pathways after ligation of surface-expressed TCRs. Moreover, autophagy and the mechanistic target of rapamycin (mTOR)-dependent glycolytic pathway were identified as critical mediators of antigen-driven priming in the naïve CD8+ T cell pool, the efficiency of which was dampened by the presence of neutral lipids and fatty acids.
Interpretation: These observations provide a metabolic roadmap of the CD8+ T-cell compartment in humans and reveal potentially selective targets for novel immunotherapies.
Introduction
CD8+ T-cells play a key role in the adaptive immune system, enabling the recognition and elimination of intracellular pathogens and various cancers (1). Protective immunity in this lymphocyte compartment originates from antigen-driven priming events, which trigger the activation and differentiation of naïve precursors, seeding qualitatively diverse populations of memory CD8+ T-cells. The kinetics of expansion and the acquisition of effector functions within the emergent antigen-experienced pool can also be manipulated using targeted interventions to beneficial effect (2–5). However, our knowledge of the intracellular biochemical processes that govern the behavior of human lymphocytes as a function of lineage and differentiation status remains incomplete. It is established that naïve CD8+ T-cells undergo a metabolic transition in response to activation, switching from a primary reliance on mitochondrial respiration to a primary reliance on aerobic glycolysis (6–8). In vivo mouse studies have further shown that the bioenergetics of CD8+ T-cell activation vary as a function of antigen exposure (9), suggesting that metabolic reprogramming is regulated across the differentiation spectrum via cognate engagement of surface-expressed T-cell receptors (TCRs). To consolidate this paradigm, especially in light of current efforts to augment immune efficacy using nutrient-based strategies (10, 11), it is necessary to extend these studies into humans (8, 12–14).
In this study, we investigated the basal and activation-induced energetic requirements of naïve and memory CD8+ T-cells, aiming to create a metabolic roadmap spanning the lymphocyte differentiation spectrum in humans (15). Considerable metabolic heterogeneity was observed among phenotypically-defined subsets of human CD8+ T-cells. Moreover, autophagy and mechanistic target of rapamycin (mTOR)-induced glycolysis cooperatively regulated the expansion and functionality of antigen-specific CD8+ T-cells, and TCR-induced activation was influenced by neutral lipids and fatty acids (FAs).
Materials and Methods
Human Subjects and Samples
This study was approved by the Comité de Protection des Personnes of the Pitié Salpétrière Hospital (Paris). All participants provided written informed consent in accordance with the Declaration of Helsinki. Venous blood samples were collected from 41 healthy volunteers (median age 39 years, age range 19–65 years, 56% females). Peripheral blood mononuclear cells (PBMCs) were isolated from acid citrate dextrose collection tubes via density gradient centrifugation according to standard protocols and cryopreserved in complete medium supplemented with 10% dimethyl sulfoxide and 20% fetal calf serum (FCS). Complete medium (R+) consisted of RPMI 1640 supplemented with non-essential amino acids, penicillin-streptomycin (100 U/mL), L-glutamine (2 mM), and sodium pyruvate (1 mM).
Flow Cytometry and Cell Sorting
PBMCs were surface stained in the dark for 15 min at room temperature with directly conjugated monoclonal antibodies. αCD3, αCD4, αCD8, αCD27, αCD45RA, αCD49d, αCD57, and αCCR7 were used to identify different CD8+ T-cell subsets (Figure S1; Table S1). Non-viable cells were eliminated from the analysis using LIVE/DEAD Fixable Aqua (Life Technologies). Activation status was assessed using αCD38, αCD40L, αCD69, αCD134, αHLA-DR, and αPD-1. In priming assays, cells were stained first in the dark with PE-conjugated ELA/HLA-A2 tetramers for 15 min at 37°C. Intracellular staining for granzyme B and Tbet was performed using a Transcription Factor Buffer Set (BD Pharmingen). Samples were acquired using a Fortessa flow cytometer (BD Biosciences). CD8+ T-cell subsets were sorted using a FACSAria II flow cytometer (BD Biosciences). Data were analyzed using FACSDiva version 7.0 (BD Biosciences) and FlowJo version 10 (Tree Star Inc.).
RNA Extraction, Retrotranscription, and qPCR Analysis
PBMCs were activated for 5 h with plate-bound αCD3, stained as described above, and sorted at 300 cells/subset directly into lysis buffer (Macherey-Nagel). After RNA extraction and cDNA synthesis, specific targets were amplified using PreAmp Master Mix (Fluidigm). Gene expression profiling was conducted using a Biomark (Fluidigm) with EvaGreen Supermix (Bio-Rad). Relative levels of each RNA species were calculated using the 2−ΔΔCT method with reference to a housekeeping gene (human 18S). Heatmaps were constructed using Omics Explorer software (Qlucore).
Metabolic Profiling by Flow Cytometry
To determine glucose uptake, neutral lipid content, or FA uptake, PBMCs were incubated in PBS with 50 μM 2′-(N-(7-nitrobenz-2-oxa-1,3-diazol-4-yl)amino)-2-deoxyglucose (2-NBDG), 10 μM 4,4-difluoro-1,3,5,7,8-pentamethyl-4-bora-3a,4a-diaza-s-indacene (BODIPY™ 493/503), or 1μM 4,4-difluoro-5,7-dimethyl-4-bora-3a,4a-diaza-s-indacene-3-hexadecanoic acid (BODIPY™ FL C16), respectively, for 20 min at 37°C (all reagents from Thermo Fisher Scientific). To determine cholesterol uptake or mitochondrial mass, PBMCs were incubated in R+ with 22-(N-(7-nitrobenz-2-oxa-1,3-diazol-4-yl)amino)-23,24-bisnor-5-cholen-3β-ol(NDB-cholesterol) as per the manufacturer's instructions (Cayman Chemical) or with 500 nM Mitotracker Deep Red (Thermo Fisher Scientific), respectively, for 30 min at 37°C. To determine the production of reactive oxygen species (ROS), PBMCs were incubated in R+ with 5 μM CellROX Green Reagent (Thermo Fisher Scientific) for 15 min at room temperature. To determine mitochondrial membrane potential, PBMCs were incubated in R+ with 25 nM tetramethylrhodamine, methyl ester, perchlorate (TMRM, Thermo Fisher Scientific) for 30 min at 37°C. To determine autophagic activity, PBMCs were stained using a CYTO-ID Autophagy Detection Kit as per the manufacturer's instructions (Enzo Life Sciences) for 30 min at 37°C. To determine mTOR activity, PBMCs were incubated in BD Cytofix Fixation Buffer (BD Biosciences) for 10 min at 37°C, washed, incubated in BD Phosflow Perm Buffer III (BD Biosciences) for 30 min on ice, washed again, and stained for phospho-S6 ribosomal protein (Ser235/236, Cell Signaling Technology) for 1 h at room temperature. Additional stains were used as described above to characterize the metabolic profile of distinct CD8+ T-cell subsets in each assay.
Assessment of Metabolic Pathways Involved in T-Cell Activation
PBMCs were incubated overnight with the following compounds to inhibit specific metabolic pathways: glycolysis, 5 nM 2-deoxy-D-glucose (2-DG, Sigma-Aldrich); glutaminolysis, 10 μM bis-2-(5-phenylacetamido-1,3,4-thiadiazol-2-yl)ethyl sulfide (BPTES, Sigma-Aldrich); mTOR, 5 nM rapamycin (Sigma-Aldrich); autophagy, 10 μM spautin-1 (a kind gift from Dr. Stephanie Graff-Dubois); FA oxidation, 100 μM etomoxir (Sigma-Aldrich); FA synthesis, 25 μM irgasan (Sigma-Aldrich); and cholesterol synthesis, 1 μM simvastatin (Sigma-Aldrich). Pre-treated cells were cultured under resting conditions or activated for 24 h with plate-bound αCD3, then surface stained as described above to measure the expression of activation markers by flow cytometry. The activation/inhibition ratio was measured for each T-cell subset using the following formula: 1 – (% HLA-DR+ on activated cells with inhibitors – % HLA-DR+ on resting cells)/(% HLA-DR+ on activated cells – % HLA-DR+ on resting cells). Spanning-tree progression analysis of density-normalized events (SPADE) was conducted using three activation markers (CD134, HLA-DR, and PD-1), and t-distributed stochastic neighbor embedding (t-SNE) was used to check the clustering generated via SPADE.
In vitro Priming of Antigen-Specific CD8+ T-Cell Precursors
Naïve precursors specific for the HLA-A2-restricted epitope ELAGIGILTV (ELA) were primed in vitro as described previously (16, 17). Briefly, thawed PBMCs were resuspended in AIM medium (Invitrogen), plated at 2.5 × 10⁶ cells/well in a 48-well tissue culture plate in the absence or presence of different metabolic inhibitors, and stimulated with the peptide YTAAEELAGIGILTVILGVL, which contains the optimal epitope in heteroclitic form, at a concentration of 1 μM together with FLT3 ligand (50 ng/mL, R&D Systems). After 24 h (day 1), maturation was induced via the addition of TLR8L (0.5 μg/mL), L-carnitine (20 μM), or a cytokine cocktail incorporating TNF-α (1,000 U/mL), IL-1β (10 ng/mL), IL-7 (0.5 ng/mL), and PGE2 (1 μM) (all reagents from R&D Systems). On day 2, the medium was supplemented at a volume ratio of 10% with FCS (Gibco). On days 5 and 8, the medium was replaced with fresh RPMI 1640 containing 10% FCS (Gibco). The frequency and phenotype of ELA-specific CD8+ T-cells were determined on day 10.
Results
Resting Naïve and Memory CD8+ T-Cells Exhibit Distinct Energetic Requirements
It has been established that resting and activated T-cells rely on different biochemical and signal-transduction pathways (8, 18). However, it is less clear if such differences also exist among resting subpopulations at various stages of differentiation. To address this issue, we analyzed the expression profile of a selection of genes in naïve and distinct subsets of memory CD8+ T-cells (Figure S1).
As expected, several genes associated with differentiation were poorly expressed in naïve CD8+ T-cells and highly expressed in effector memory (EM) and terminally differentiated effector memory (EMRA) CD8+ T-cells. Differentially regulated products included transcription factors (Eomes, Tbet, Stat4, and IRF1), intracellular signaling molecules (Rictor), Fas ligand, and the IL-2 receptor (Figure 1A; Table S2). Notably, five genes involved in glucose metabolism (ARNT, aryl hydrocarbon receptor nuclear translocator, also known as hypoxia-inducible factor HIF-1β; HIF1A, HIF-1α; LDHA, lactate dehydrogenase A; SLC2A1, solute carrier family 2 member 1, also known as GLUT1; and TPI1, triosephosphate isomerase 1) and the transcription factor ID2 (inhibitor of DNA binding 2), which controls lipid metabolism (19), were expressed at progressively higher levels along the T-cell differentiation pathway (Figure 1B; Table S2). Naïve CD8+ T-cells also expressed higher levels of ACACB (acetyl-CoA carboxylase-β) and SREBF1 (sterol regulatory element binding transcription factor 1), which are involved in lipid biosynthesis and cholesterol transport, compared with memory CD8+ T-cells (Figure 1C; Table S2). These data confirmed previous observations in mice showing that metabolism is controlled as a function of differentiation within the CD8+ T-cell lineage (20). An irreversible program of genetically regulated metabolic changes therefore accompanies the transition from quiescent naïve to antigen-experienced memory status in the human adaptive immune system.
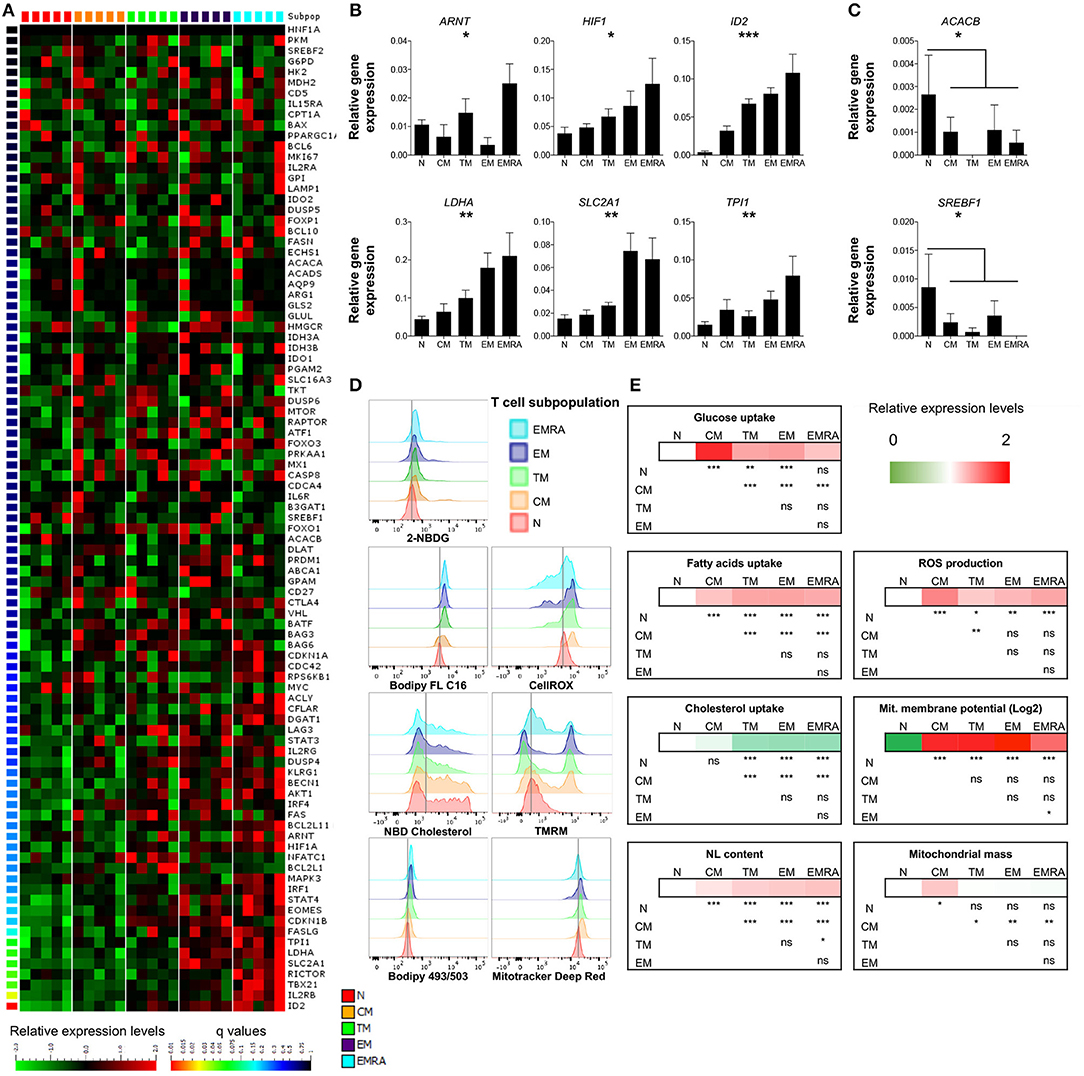
Figure 1. Basal energetic requirements of distinct CD8+ T-cell subsets. (A) Heatmap showing the gene expression profile (according to q-value) of resting CD8+ T-cell subsets. N (CCR7+, CD45RA+, CD27+); CM (CCR7+, CD45RA−, CD27+); TM (CCR7−, CD45RA−, CD27+); EM (CCR7−, CD45RA−, CD27−); EMRA (CCR7−, CD45RA+, CD27−). N = 5. (B,C) Relative mean expression of metabolism-related genes with significant differences among T-cell subsets (B) or in comparisons of N vs. the whole memory compartment (C). N = 5. (D,E) Representative examples (D) and heatmaps showing relative mean expression levels (E) of various metabolic properties measured by flow cytometry (glucose uptake with 2-NBDG; FA uptake with Bodipy FL C16; cholesterol uptake with NDB cholesterol; neutral lipid (NL) content with Bodipy 493/503; ROS production with CellROX; mitochondrial membrane potential with TMRM; mitochondrial mass with Mitotracker Deep Red). N = 10. Statistical significance was determined using a one-way paired ANOVA with Bonferroni's post-test (A–C) or a paired Student's t-test (E). *P < 0.05, **P < 0.01, ***P < 0.001; ns, not significant.
To extend these observations, we assessed the metabolic properties of different CD8+ T-cell subsets by measuring the uptake and storage of various nutrients, as well as mitochondrial functions and the production of ROS. Glucose uptake was minimal among resting CD8+ T-cells, especially within the naïve compartment (Figures 1D,E; Table S3). Naïve CD8+ T-cells also displayed lower levels of neutral lipids and FA uptake compared with memory CD8+ T-cells (Figures 1D,E; Table S3). In contrast, cholesterol uptake was higher among naïve CD8+ T-cells compared with transitional memory (TM), EM, and EMRA CD8+ T-cells, but not significantly different compared with central memory (CM) CD8+ T-cells (Figures 1D,E; Table S3). Mitochondrial membrane potential was very low among naïve CD8+ T-cells, which likewise produced small amounts of ROS relative to memory CD8+ T-cells (Figures 1D,E; Table S3).
Among the different memory subsets, CM CD8+ T-cells were notably distinct from TM, EM, and EMRA CD8+ T-cells, which exhibited broadly similar metabolic properties (Figures 1D,E; Table S3). In particular, glucose and cholesterol uptake were significantly higher, mitochondrial mass was significantly greater, and FA uptake was significantly lower among CM CD8+ T-cells compared with other resting memory CD8+ T-cells (Figures 1D,E; Table S3). Higher levels of ROS production were also observed among CM CD8+ T-cells compared with naïve and TM CD8+ T-cells (Figures 1D,E; Table S3).
Collectively, these findings suggested that: (i) naïve CD8+ T-cells exist in a low energy state, based on minimal nutrient uptake and mitochondrial activity; and (ii) memory CD8+ T-cells exhibit metabolic variability across the differentiation spectrum.
Activation of Naïve CD8+ T-Cells Triggers a Rapid Metabolic Switch
To investigate the link between antigen-driven priming events and basal metabolic requirements, we stimulated PBMCs via generic ligation of TCRs and measured the upregulation of early (CD69 after 3 h) and intermediate activation markers (CD134 after 24 h). Naïve CD8+ T-cells expressed higher levels of these activation markers at the corresponding time points compared with memory CD8+ T-cells (Figure 2A; Table S4). In addition, PD-1 was strongly upregulated on the surface of naïve CD8+ T-cells in response to activation (Figure S2; Table S4). This rapid phenotypic transformation was associated with markedly increased expression of several genes (Figure 2B), including IL2RA and IL2RB, as well as the mTOR-induced transcription factors HIF1A and IRF1 (interferon regulatory factor 1), which support a metabolic switch to glycolysis (21), and MYC, which plays a key role in activation-induced metabolic reprogramming across multiple pathways (22). These data confirmed previous studies (21, 23) suggesting that naïve CD8+ T-cell activation triggers a metabolic switch regulated via mTOR.
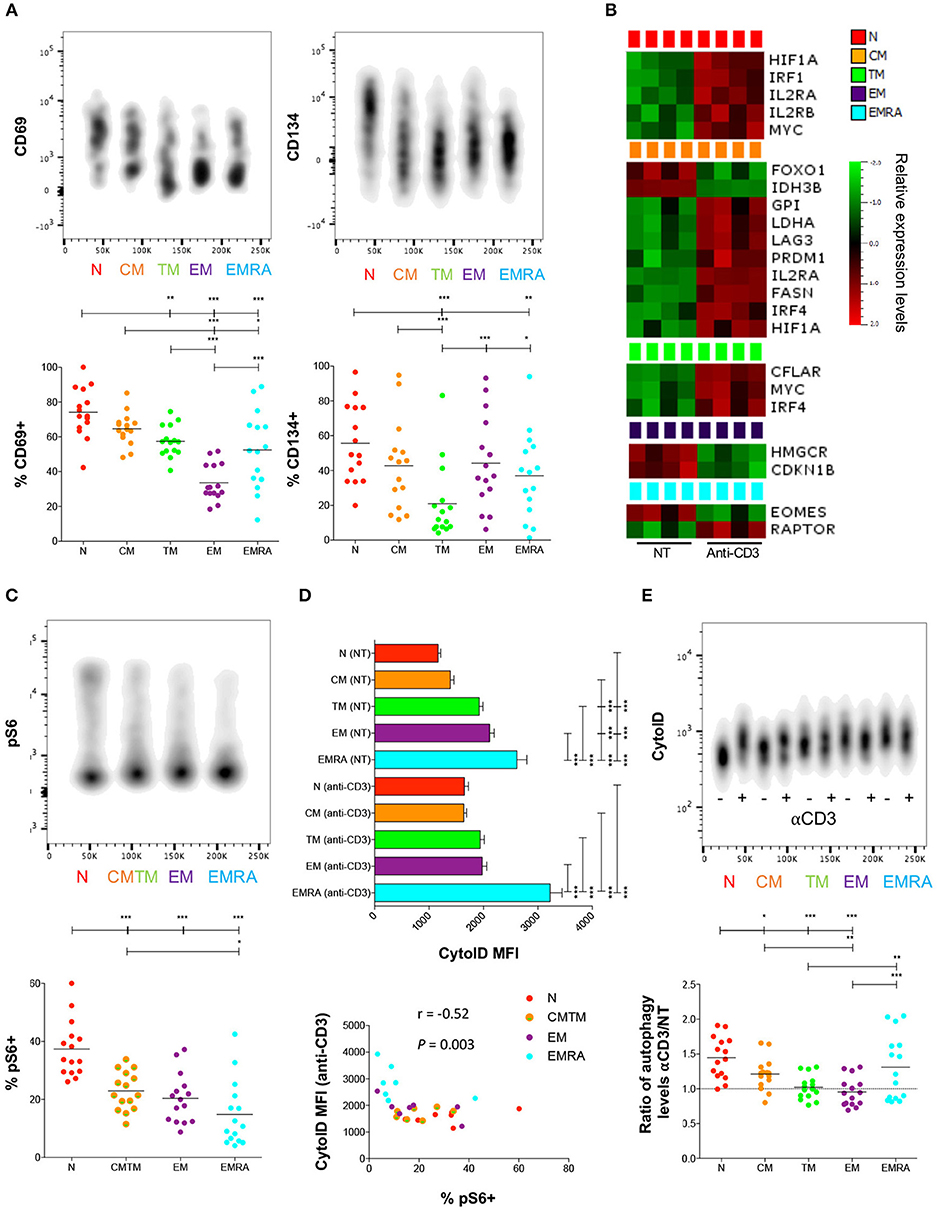
Figure 2. Metabolic switch in activated naïve CD8+ T-cells. (A) PBMCs were activated with plate-bound αCD3. Expression of CD69 and CD134 was measured by flow cytometry after 3 h and 24 h, respectively. Upper panels: one representative example is shown for each stain. Lower panels: horizontal lines depict mean values. N = 15. (B) Heatmap showing significant differences in gene expression between resting (NT) and αCD3-activated CD8+ T-cells after 3 h. N = 4. (C) PBMCs were activated with plate-bound αCD3. Expression of pS6 was measured by flow cytometry after 3 h. Upper panel: one representative example is shown. Lower panel: horizontal lines depict mean values. N = 15. (D) PBMCs were activated with plate-bound αCD3. Autophagic activity was measured by flow cytometry after 24 h. Upper panel: autophagic activity in resting (NT) or αCD3-activated CD8+ T-cells. Error bars depict mean ± SEM. Lower panel: correlation between autophagy and mTOR activity upon activation. N = 15. (E) PBMCs were activated with plate-bound αCD3. Activation-induced autophagic activity is shown as a ratio (αCD3/NT). Upper panel: one representative example is shown. Lower panel: horizontal lines depict mean values. N = 15. Statistical significance was determined using a one-way paired ANOVA with Bonferroni's post-test (A,C–E), a paired Student's t-test (B), or Spearman's rank correlation (D). *P < 0.05, **P < 0.01, ***P < 0.001.
On this basis, we quantified the phosphorylated form of ribosomal protein S6 (pS6), a key downstream target of mTOR. Naïve CD8+ T-cells contained significantly higher levels of pS6 compared with memory CD8+ T-cells (Figure 2C; Table S5). In addition, we measured autophagic activity, which is commonly downregulated in association with activation of the mTOR pathway (24). Naïve CD8+ T-cells displayed significantly lower levels of autophagic activity compared with highly differentiated memory CD8+ T-cells (Figure 2D). Activation-induced autophagic activity further correlated inversely with pS6 levels across all CD8+ T-cell subsets (Figure 2D). Nonetheless, autophagic activity was markedly upregulated in naïve CD8+ T-cells after stimulation, whereas less pronounced activation-induced shifts were observed in CM, TM, and EM CD8+ T-cells (Figure 2E; Table S5).
Among the different memory subsets, CM CD8+ T-cells responded more vigorously to stimulation compared with TM, EM, and EMRA CD8+ T-cells, most notably at the early time point (Figure 2A), and upregulated several genes associated with activation and differentiation (Figure 2B), including IL2RA, LAG3, and the transcription factors IRF4 and PRDM1 (Blimp-1) (25). These changes were linked with increased levels of autophagy and mTOR activity (Figure 2C; Table S5), which mirrored the expression of activation markers induced via TCR-mediated signals (Figure 2A). Activated CM CD8+ T-cells also upregulated genes involved in glycolysis, such as GPI (glucose-6-phosphate isomerase), LDHA, and HIF1A, and FA synthesis (FASN, fatty acid synthase) (Figure 2B). In contrast, activated EM and EMRA CD8+ T-cells exhibited minimal changes in gene expression and limited upregulation of mTOR, in line with the findings of a recent study (12).
Collectively, these findings suggested that resting naïve CD8+ T-cells and, to a lesser extent, resting CM CD8+ T-cells, rapidly upregulate diverse metabolic pathways in response to activation signals transduced via surface-expressed TCRs.
Activation of Naïve CD8+ T-Cells Relies on Autophagy and Glycolysis
To determine which metabolic pathways are necessary for the activation of naïve and memory CD8+ T-cells, we treated PBMCs with various inhibitors prior to stimulation and monitored subsequent upregulation of the activation marker HLA-DR. Inhibition of glycolysis with 2-DG dramatically impacted CD8+ T-cell activation as an inverse function of differentiation (Figure 3A; Table S6). Naïve CD8+ T-cells were inhibited to the greatest extent. Partially differentiated memory CD8+ T-cells were also more susceptible to 2-DG than EMRA CD8+ T-cells, consistent with the findings of a recent study (12). CM CD8+ T-cells were likewise inhibited to a comparable extent after blockade of glutaminolysis with BPTES or autophagy with spautin-1, indicating the concurrent use of different metabolic pathways (Figure 3A; Table S6).
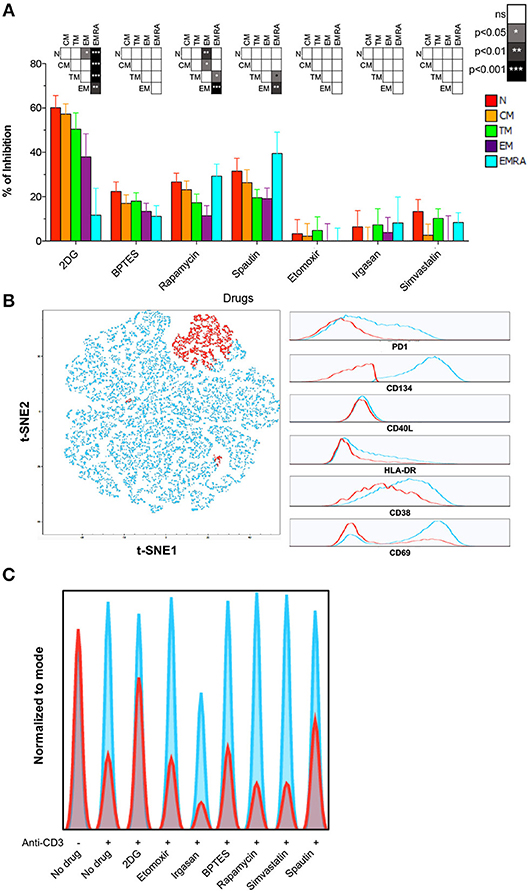
Figure 3. Role of autophagy and glycolysis in naïve CD8+ T-cell activation. (A) PBMCs were incubated for 24 h with different metabolic inhibitors and activated with plate-bound αCD3. Inhibition of HLA-DR upregulation was measured by flow cytometry after 24 h. Bars depict mean ± SEM. Statistical significance was determined using a one-way paired ANOVA with Bonferroni's post-test. N = 10. (B) PBMCs were activated as in (A). Expression of CD38, CD40L, CD69, CD134, HLA-DR, and PD-1 was measured after 24 h. Left panel: a t-SNE depiction of SPADE is shown for one representative sample. Right panel: expression of each marker is shown for the two clusters defined by SPADE. Highly activated (HA) CD8+ T-cells are shown in blue; poorly activated (PA) CD8+ T-cells are shown in red. (C) Histogram plots showing the proportion of HA (blue) and PA (red) among naïve CD8+ T-cells activated in the presence of different metabolic inhibitors (data from one representative donor).
To confirm these results, we measured activation using five additional markers (CD38, CD40L, CD69, CD134, and PD-1) 24 h after ligation of surface-expressed TCRs. Flow cytometric data were analyzed using an unsupervised approach, namely a combination of SPADE and t-SNE. This strategy allowed the identification of highly activated (HA) and poorly activated (PA) cells in clusters based on the composite expression of CD38, CD40L, CD69, CD134, HLA-DR, and PD-1 (Figure 3B). The effect of each inhibitor was then assessed using the HA/PA ratio (Figure 3C). Inhibition of autophagy and glycolysis again showed the most dramatic effect on naïve CD8+ T-cell activation (Figure 3C). In contrast, inhibition of the mevalonate pathway with simvastatin or inhibition of FA oxidation or synthesis with etomoxir or irgasan, respectively, did not prevent naïve CD8+ T-cell activation (Figure 3C).
Collectively, these findings demonstrated that naïve CD8+ T-cells rely primarily on autophagy and glycolysis for activation, whereas memory CD8+ T-cells display more complex and plastic metabolic requirements in response to functional engagement of surface-expressed TCRs.
Antigen-Specific Priming of Naïve CD8+ T-Cells Depends on Autophagy and mTOR
To probe the biological relevance of these findings, we conducted in vitro priming experiments with the model antigen Melan-A (MelA) (17). Inhibition of mTOR with rapamycin dramatically impaired the expansion of MelA-specific CD8+ T-cells (Figures 4A, S3A). Analogous effects were observed with spautin-1 and chloroquine, both of which block autophagic activity (Figure 4A). Moreover, granzyme B production was significantly inhibited in cultures pre-treated with spautin-1, but not in cultures pre-treated with rapamycin (Figures 4B, S3B). A comparable trend was observed in parallel analyses of Tbet expression (Figures 4C, S3C). These data suggested that antigen-driven priming of naïve CD8+ T-cell precursors depends on autophagy and the activity of mTOR.
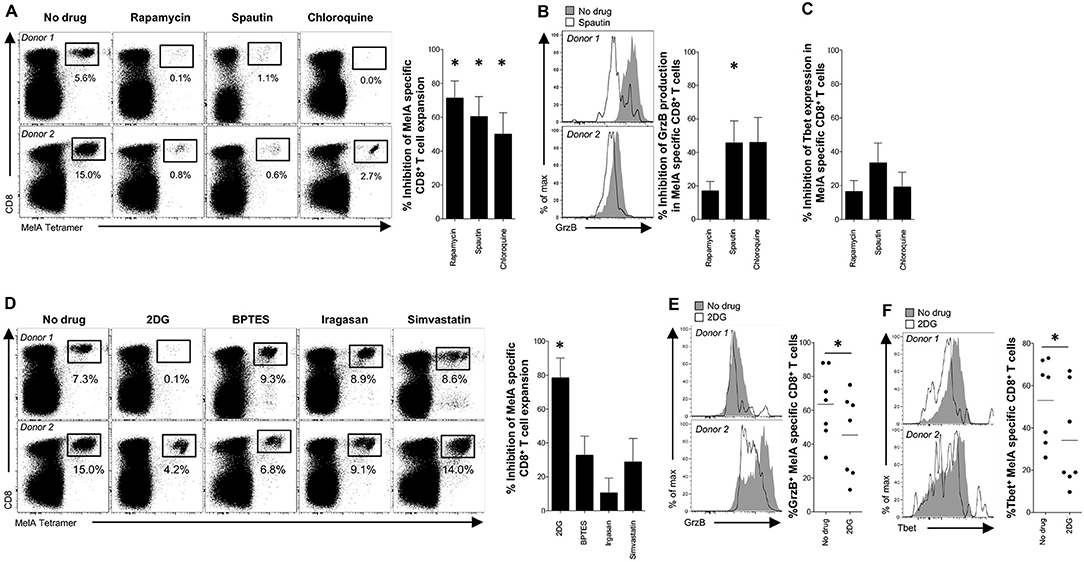
Figure 4. Engagement of autophagy and mTOR during antigen-specific priming of naïve CD8+ T-cells. (A–F) MelA-specific naïve CD8+ T-cells were primed in the absence or presence of various metabolic inhibitors. (A,D) MelA-specific CD8+ T-cells were quantified by flow cytometry after 10 days using cognate PE-conjugated ELA/HLA-A2 tetramers. Left panels: representative data are shown as dot plots. Right panels: percent inhibition of expansion is shown as mean ± SEM. (B,E) Expression of granzyme B in primed MelA-specific CD8+ T-cells was measured by flow cytometry after 10 days. Left panels: representative data are shown as histogram plots. Right panel (B): percent inhibition of granzyme B expression is shown as mean ± SEM. Right panel (E): percent expression of granzyme B is shown. Horizontal lines depict mean values. (C,F) Expression of Tbet in primed MelA-specific CD8+ T-cells was measured by flow cytometry after 10 days. (C) Percent inhibition of Tbet expression is shown as mean ± SEM. Left panel (F): representative data are shown as histogram plots. Right panel (F): percent expression of Tbet is shown. Horizontal lines depict mean values. Statistical significance was determined using the Wilcoxon signed rank test (A–F). N = 7 (A–C); N = 8 (D); N = 7 (E,F). *P < 0.05.
Several activation-induced metabolic pathways, including glycolysis, glutaminolysis, and lipid synthesis, are known to be regulated by mTOR (26). In line with a key role for glycolysis, we found that pre-treatment with 2-DG, but not BPTES, irgasan, or simvastatin, markedly inhibited the in vitro expansion of MelA-specific CD8+ T-cells (Figures 4D, S3D). MelA-specific CD8+ T-cells primed in the presence of 2-DG also displayed low levels of granzyme B production and Tbet expression relative to MelA-specific CD8+ T-cells primed in the absence of inhibitors (Figures 4E,F). These results indicated that mTOR regulates naïve CD8+ T-cell priming via the glycolysis pathway (6–8).
Fatty Acid Oxidation Enhances Effector Functions in Primed CD8+ T-Cells
To synthesize these findings, we correlated basal energetic parameters with activation-induced mTOR activity. Neutral lipid content and FA uptake in the resting state correlated inversely with mTOR activity, even when naïve CD8+ T-cells were excluded from the analysis (Figure 5A). This observation was reminiscent of a previous study, which linked high concentrations of neutral lipids and FAs with altered lymphocyte fitness (27).
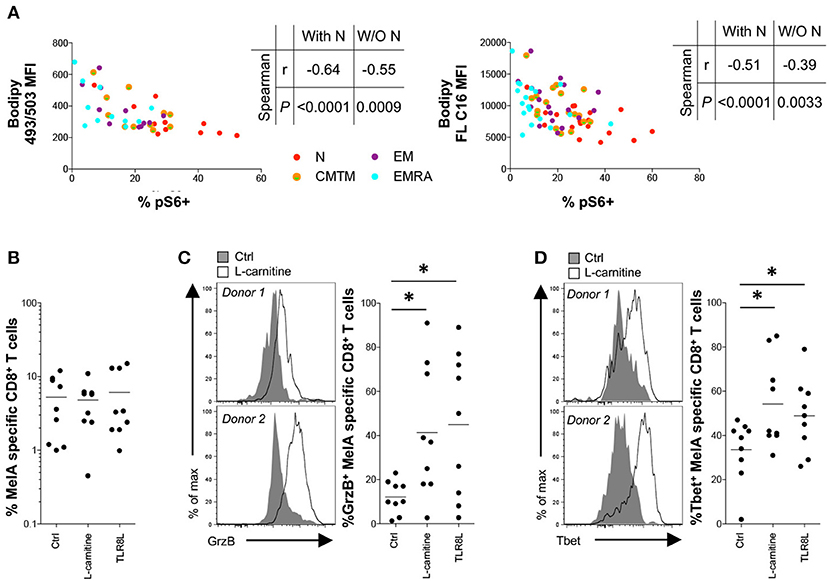
Figure 5. Effect of L-carnitine on the functionality of primed antigen-specific CD8+ T-cells. (A) Correlation between pS6 expression after activation for 3 h with plate-bound αCD3 and basal neutral lipid (NL) content (left panel) or fatty acid (FA) uptake (right panel). (B–D) MelA-specific naïve CD8+ T-cells were primed in the absence or presence of L-carnitine or TLR8L. MelA-specific CD8+ T-cells were quantified by flow cytometry after 10 days using cognate PE-conjugated ELA/HLA-A2 tetramers (B). Expression of granzyme B (C) and Tbet (D) in primed MelA-specific CD8+ T-cells was measured by flow cytometry after 10 days. Left panels: representative data are shown as histogram plots. Right panels: percent expression of granzyme B or Tbet is shown. Horizontal lines depict mean values. N = 9. Statistical significance was determined using Spearman's rank correlation (A) or the Wilcoxon signed rank test (B–D). *P < 0.05.
To assess the functional implications of this observation, we conducted in vitro priming experiments in the presence of L-carnitine, which promotes FA transport into the mitochondrial matrix. Pharmacological enhancement of fatty acid oxidation (FAO) has been shown previously to improve tumor-specific CD8+ T-cell reactivity in mice (28–30). Although L-carnitine exerted no detectable effects on the expansion of MelA-specific CD8+ T-cells (Figure 5B), it significantly increased granzyme B production and Tbet expression in primed MelA-specific CD8+ T-cells (Figures 5C,D). Of note, these mTOR-dependent molecules were upregulated in the presence of L-carnitine to levels observed in the presence of TLR8L, a potent adjuvant that enhances the de novo generation of effector CD8+ T-cells (17).
Collectively, these findings suggested that neutral lipids and FAs can impede the activation of mTOR.
Discussion
It has been shown previously that resting naïve and memory CD8+ T-cells exist in a low energy state maintained primarily via FAO (6, 18, 31–33). Our dataset confirmed and extended these observations. In particular, we found that resting naïve CD8+ T-cells displayed lower levels of glucose uptake, lesser mitochondrial mass, and diminished uptake of FAs compared with resting memory CD8+ T-cells. Moreover, we observed increased expression of glycolysis-related genes along the CD8+ T-cell differentiation pathway, consistent with previous reports (12, 20). Resting CM CD8+ T-cells exhibited higher levels of glucose uptake, greater mitochondrial mass, and lower levels of FA uptake compared with more differentiated subsets of resting memory CD8+ T-cells. In line with these findings, earlier work showed that CM CD8+ T-cells rely primarily on FAO, fueled by the conversion of glucose into FAs (31). Differentiation therefore governs the bioenergetic requirements of CD8+ T-cells in a subset-specific manner (Figure 6). It is tempting to speculate that such diverse energy programs reflect the contrasting homeostatic processes that regulate T-cell survival (34). For example, maintenance of the naïve CD8+ T-cell pool uniquely depends on tonic contacts with major histocompatibility complex class I molecules (35), and weak stimuli delivered via the TCR activate phospholipase C to generate inositol-1,4,5-trisphosphate (IP3) (36). Naïve CD8+ T-cells demonstrated relatively efficient uptake of cholesterol, which is necessary for activation of the IP3 receptor (37) and nanoclustering of TCRs (38).
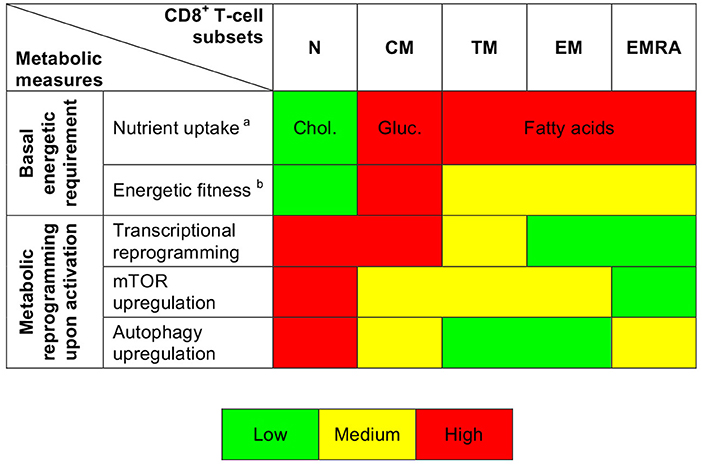
Figure 6. Summary depiction of the metabolic properties of CD8+ T-cell subsets. aindicates the predominantly uptaken nutrient. bis based on ROS production and mitochondrial measurements.
Earlier studies have shown that T-cells undergo an mTOR-driven metabolic transition from oxidative phosphorylation to glycolysis during activation (6, 7). We found evidence of parallel roles for other metabolic pathways across the differentiation spectrum. For example, activation-induced upregulation of glycolysis-related genes and mTOR activity was most prominent among poorly differentiated CD8+ T-cells, which were also relatively susceptible to the inhibitory effects of 2-DG compared with EM and EMRA CD8+ T-cells (Figure 6). Moreover, highly differentiated CD8+ T-cells exhibited only moderate activation-induced upregulation of MYC, which is required for the classical metabolic switch (i.e., enhanced glycolysis) (22). The activation of EMRA CD8+ T-cells instead relied primarily on autophagy, consistent with previous observations showing that highly differentiated human T-cells downregulate components of the TCR signaling cascade and upregulate AMPK (AMP-activated protein kinase), which inhibits mTOR (39). The basal and activation-induced energetic profiles of human CD8+ T-cells therefore vary as a function of lineage and differentiation status (40).
Naïve CD8+ T-cells displayed a profound response to TCR-mediated activation, supported by autophagy and mTOR activity. This exceptional metabolic program may account for some of the functional qualities attributed to naïve CD8+ T-cells, such as the potential to generate more potent cancer-specific effector CD8+ T-cells (41, 42). However, it remains to be determined how this metabolic switch relates to basal quiescence, low levels of FA uptake and storage, enhanced stemness, which is associated with low mitochondrial membrane potential (43), and/or the influx of free cholesterol, which is required for T-cell activation (10).
To confirm a role for certain metabolic processes in the activation of naïve CD8+ T-cells, we exploited an in vitro priming model that recapitulates the complex interactions among immune cells in vivo. Using this approach, we were able to evaluate the impact of various metabolic inhibitors on the generation of antigen-experienced CD8+ T-cells, both in terms of magnitude and quality. However, it should be noted that we focused specifically on early priming events, potentially limiting our ability to detect metabolic processes that could affect subsequent expansion, such as lipid synthesis (44). Despite this caveat, in vitro priming experiments showed that the expansion and maturation of naïve CD8+ T-cells were strongly dependent on glycolysis, consistent with earlier observations in murine models (45). The activity of mTOR is known to support glycolysis (23). Of note, we found that rapamycin inhibited the expansion of naïve CD8+ T-cells, but not the acquisition of effector functions. In addition, inhibition of glycolysis had more profound effects on the expression of activation markers compared with inhibition of mTOR. These data are compatible with a role for mTOR-independent pathways in the control of lymphocyte effector functions, supported by previous observations showing that immediate-early glycolysis is mTOR-independent in CD8+ T-cells (8). Indeed, aerobic glycolysis may control effector functionality via epigenetic and post-transcriptional mechanisms (46, 47) and signaling intermediates (48). It is also important to recognize that mTOR is a master regulator of metabolism, such that rapamycin pre-treatment may both inhibit glycolysis and favor the upregulation of other pathways that support T-cell activation. In line with this notion, we found that autophagy was also essential for the expansion and maturation of naïve CD8+ T-cells. This observation contrasts with the findings of previous studies using Atg7-deficient mice, suggesting an inter-species difference in the metabolic processes that control antigen-driven responses among naïve CD8+ T-cells (49, 50). Our findings are nonetheless consistent with previous work in humans showing that TCR-mediated stimulation can induce both autophagy and mTOR activity in early differentiated CD8+ T-cells (51), and that mTOR activity is supported by the induction of autophagosomes (52). Moreover, mTOR does not always impair autophagy, which is rather p38-dependent, at least in terminally differentiated T-cell subsets (53), and our results do not exclude the possibility that mTOR activation may suppress autophagic flux at later time points (24).
Our data further revealed that FA uptake and storage in the resting state correlated inversely with mTOR activity, and that L-carnitine promoted the effector differentiation of naïve CD8+ T-cells. FAO may therefore favor the expression of mTOR-dependent molecules, such as the transcription factor Tbet, leading to enhanced functionality and greater immune efficacy (28–30). In line with this interpretation, high concentrations of neutral lipids and FAs, as well as inhibition of FA metabolism, have been shown to suppress proliferation, increase apoptosis, and alter mitochondrial metabolism in lymphocytes (27, 54, 55). These effects may be amenable to therapeutic manipulation, potentially enhancing suboptimal immune responses, for example in nutrient-poor tumor microenvironments (28–30).
In conclusion, we have demonstrated that substantial metabolic heterogeneity exists among phenotypically-defined subsets of human CD8+ T-cells. These observations hold potential biological relevance in light of previous reports showing that natural and vaccine-induced T-cells mediate protection against different pathogens as a function of differentiation (56–58) and that dysfunctional T-cells accumulate in many pathological conditions (59, 60). Metabolic regulators may therefore play a key role in novel strategies designed to correct lymphocytic anomalies and/or optimize the efficacy of vaccines and immunotherapies (61).
Author Contributions
FN and VA: conceptualization; FN and MC-P: methodology; FN and JF: formal analysis; FN, LP, JF, and MC-P: investigation; EC, EG, AT, and DP: resources; FN and VA: writing and original draft; FN, JF, AT, DP, AC, and VA: writing, review, and editing; VA: supervision; AT, DP, AC, and VA: funding acquisition.
Funding
This work was supported by the ANR (Project ANR-14-CE14-0030-01) and by Università ItaloFrancese/Université FrancoItalienne (Galileo Project G10-718; PHC Galilee Project 39582TJ). DP is a Wellcome Trust Senior Investigator (100326/Z/12/Z). The funding sources had no role in designing the study, in collecting, analyzing, interpreting, or reporting the data, or in deciding to submit the article for publication.
Conflict of Interest Statement
The authors declare that the research was conducted in the absence of any commercial or financial relationships that could be construed as a potential conflict of interest.
Acknowledgments
We are very grateful to Veronique Morin, Rima Zoorob (CIMI INSERM U1135, Paris, France), Silvia Menegatti, and Lars Rogge (Institut Pasteur, Paris, France) for assistance with gene expression analyses and the use of Qlucore software.
Supplementary Material
The Supplementary Material for this article can be found online at: https://www.frontiersin.org/articles/10.3389/fimmu.2018.02736/full#supplementary-material
References
1. Appay V, Douek DC, Price DA. CD8+ T cell efficacy in vaccination and disease. Nat Med. (2008) 14:623–8. doi: 10.1038/nm.f.1774
2. Badovinac VP, Porter BB, Harty JT. Programmed contraction of CD8(+) T cells after infection. Nat Immunol. (2002) 3:619–26. doi: 10.1038/ni804
3. Joshi NS, Cui W, Chandele A, Lee HK, Urso DR, Hagman J, et al. Inflammation directs memory precursor and short-lived effector CD8(+) T cell fates via the graded expression of T-bet transcription factor. Immunity (2007) 27:281–95. doi: 10.1016/j.immuni.2007.07.010
4. Nolz JC, Harty JT. Protective capacity of memory CD8+ T cells is dictated by antigen exposure history and nature of the infection. Immunity (2011) 34:781–93. doi: 10.1016/j.immuni.2011.03.020
5. Nicoli F, Finessi V, Sicurella M, Rizzotto L, Gallerani E, Destro F, et al. The HIV-1 Tat protein induces the activation of CD8(+) T cells and affects in vivo the magnitude and kinetics of antiviral responses. PLoS ONE (2013) 8:e77746. doi: 10.1371/journal.pone.0077746
6. Almeida L, Lochner M, Berod L, Sparwasser T. Metabolic pathways in T cell activation and lineage differentiation. Semin Immunol. (2016) 28:514–24. doi: 10.1016/j.smim.2016.10.009
7. van der Windt GJ, Pearce EL. Metabolic switching and fuel choice during T-cell differentiation and memory development. Immunol Rev. (2012) 249:27–42. doi: 10.1111/j.1600-065X.2012.01150.x
8. Gubser PM, Bantug GR, Razik L, Fischer M, Dimeloe S, Hoenger G, et al. Rapid effector function of memory CD8+ T cells requires an immediate-early glycolytic switch. Nat Immunol. (2013) 14:1064–72. doi: 10.1038/ni.2687
9. Fraser KA, Schenkel JM, Jameson SC, Vezys V, Masopust D. Preexisting high frequencies of memory CD8+ T cells favor rapid memory differentiation and preservation of proliferative potential upon boosting. Immunity (2013) 39:171–83. doi: 10.1016/j.immuni.2013.07.003
10. Yang W, Bai Y, Xiong Y, Zhang J, Chen S, Zheng X, et al. Potentiating the antitumour response of CD8(+) T cells by modulating cholesterol metabolism. Nature (2016) 531:651–5. doi: 10.1038/nature17412
11. Jagannath C, Lindsey DR, Dhandayuthapani S, Xu Y, Hunter RL Jr., Eissa NT. Autophagy enhances the efficacy of BCG vaccine by increasing peptide presentation in mouse dendritic cells. Nat Med. (2009) 15:267–76. doi: 10.1038/nm.1928
12. Jeng MY, Hull PA, Fei M, Kwon HS, Tsou CL, Kasler H, et al. Metabolic reprogramming of human CD8(+) memory T cells through loss of SIRT1. J Exp Med. (2018) 215:51–62. doi: 10.1084/jem.20161066
13. Bantug GR, Fischer M, Grahlert J, Balmer ML, Unterstab G, Develioglu L, et al. Mitochondria-endoplasmic reticulum contact sites function as immunometabolic hubs that orchestrate the rapid recall response of memory CD8(+) T cells. Immunity (2018) 48:542–55 e6. doi: 10.1016/j.immuni.2018.02.012
14. Geiger R, Rieckmann JC, Wolf T, Basso C, Feng Y, Fuhrer T, et al. L-arginine modulates T cell metabolism and enhances survival and anti-tumor activity. Cell (2016) 167:829–42 e13. doi: 10.1016/j.cell.2016.09.031
15. Zhang L, Romero P. Metabolic control of CD8(+) T cell fate decisions and antitumor immunity. Trends Mol Med. (2018) 24:30–48. doi: 10.1016/j.molmed.2017.11.005
16. Briceno O, Lissina A, Wanke K, Afonso G, von Braun A, Ragon K, et al. Reduced naive CD8(+) T-cell priming efficacy in elderly adults. Aging Cell (2016) 15:14–21. doi: 10.1111/acel.12384
17. Lissina A, Briceno O, Afonso G, Larsen M, Gostick E, Price DA, et al. Priming of qualitatively superior human effector CD8+ T cells using TLR8 ligand combined with FLT3 ligand. J Immunol. (2016) 196:256–63. doi: 10.4049/jimmunol.1501140
18. Pearce EL, Walsh MC, Cejas PJ, Harms GM, Shen H, Wang LS, et al. Enhancing CD8 T-cell memory by modulating fatty acid metabolism. Nature (2009) 460:103–7. doi: 10.1038/nature08097
19. Hou TY, Ward SM, Murad JM, Watson NP, Israel MA, Duffield GE. ID2 (inhibitor of DNA binding 2) is a rhythmically expressed transcriptional repressor required for circadian clock output in mouse liver. J Biol Chem. (2009) 284:31735–45. doi: 10.1074/jbc.M109.013961
20. Crompton JG, Narayanan M, Cuddapah S, Roychoudhuri R, Ji Y, Yang W, et al. Lineage relationship of CD8(+) T cell subsets is revealed by progressive changes in the epigenetic landscape. Cell Mol Immunol. (2016) 13:502–13. doi: 10.1038/cmi.2015.32
21. Finlay DK, Rosenzweig E, Sinclair LV, Feijoo-Carnero C, Hukelmann JL, Rolf J, et al. PDK1 regulation of mTOR and hypoxia-inducible factor 1 integrate metabolism and migration of CD8+ T cells. J Exp Med. (2012) 209:2441–53. doi: 10.1084/jem.20112607
22. Wang R, Dillon CP, Shi LZ, Milasta S, Carter R, Finkelstein D, et al. The transcription factor Myc controls metabolic reprogramming upon T lymphocyte activation. Immunity (2011) 35:871–82. doi: 10.1016/j.immuni.2011.09.021
23. Palmer CS, Ostrowski M, Balderson B, Christian N, Crowe SM. Glucose metabolism regulates T cell activation, differentiation, and functions. Front Immunol. (2015) 6:1. doi: 10.3389/fimmu.2015.00001
24. Kim YC, Guan KL. mTOR: a pharmacologic target for autophagy regulation. J Clin Invest. (2015) 125:25–32. doi: 10.1172/JCI73939
25. Sforza F, Nicoli F, Gallerani E, Finessi V, Reali E, Cafaro A, et al. HIV-1 Tat affects the programming and functionality of human CD8(+) T cells by modulating the expression of T-box transcription factors. AIDS (2014) 28:1729–38. doi: 10.1097/QAD.0000000000000315
26. Jones RG, Pearce EJ. MenTORing immunity: mTOR signaling in the development and function of tissue-resident immune cells. Immunity (2017) 46:730–42. doi: 10.1016/j.immuni.2017.04.028
27. de Jong AJ, Kloppenburg M, Toes RE, Ioan-Facsinay A. Fatty acids, lipid mediators, and T-cell function. Front Immunol. (2014) 5:483. doi: 10.3389/fimmu.2014.00483
28. Zhang Y, Kurupati R, Liu L, Zhou XY, Zhang G, Hudaihed A, et al. Enhancing CD8+ T cell fatty acid catabolism within a metabolically challenging tumor microenvironment increases the efficacy of melanoma immunotherapy. Cancer Cell (2017) 32:377–91 e9. doi: 10.1016/j.ccell.2017.08.004
29. Chowdhury PS, Chamoto K, Honjo T. Combination therapy strategies for improving PD-1 blockade efficacy: a new era in cancer immunotherapy. J Intern Med. (2018) 283:110–20. doi: 10.1111/joim.12708
30. Chowdhury PS, Chamoto K, Kumar A, Honjo T. PPAR-induced fatty acid oxidation in T cells increases the number of tumor-reactive CD8(+) T cells and facilitates anti-PD-1 therapy. Cancer Immunol Res. (2018) 6:1375–87. doi: 10.1158/2326-6066.CIR-18-0095
31. O'Sullivan D, van der Windt GJ, Huang SC, Curtis JD, Chang CH, Buck MD, et al. Memory CD8(+) T cells use cell-intrinsic lipolysis to support the metabolic programming necessary for development. Immunity (2014) 41:75–88. doi: 10.1016/j.immuni.2014.06.005
32. Green WD, Beck MA. Obesity altered T cell metabolism and the response to infection. Curr Opin Immunol. (2017) 46:1–7. doi: 10.1016/j.coi.2017.03.008
33. Raud B, McGuire PJ, Jones RG, Sparwasser T, Berod L. Fatty acid metabolism in CD8(+) T cell memory: challenging current concepts. Immunol Rev. (2018) 283:213–31. doi: 10.1111/imr.12655
34. Hamilton SE, Jameson SC. CD8 T cell quiescence revisited. Trends Immunol. (2012) 33:224–30. doi: 10.1016/j.it.2012.01.007
35. Tanchot C, Lemonnier FA, Perarnau B, Freitas AA, Rocha B. Differential requirements for survival and proliferation of CD8 naive or memory T cells. Science (1997) 276:2057–62.
36. Mueller P, Massner J, Jayachandran R, Combaluzier B, Albrecht I, Gatfield J, et al. Regulation of T cell survival through coronin-1-mediated generation of inositol-1,4,5-trisphosphate and calcium mobilization after T cell receptor triggering. Nat Immunol. (2008) 9:424–31. doi: 10.1038/ni1570
37. Tovey SC, Taylor CW. Cyclic AMP directs inositol (1,4,5)-trisphosphate-evoked Ca2+ signalling to different intracellular Ca2+ stores. J Cell Sci. (2013) 126:2305–13. doi: 10.1242/jcs.126144
38. Molnar E, Swamy M, Holzer M, Beck-Garcia K, Worch R, Thiele C, et al. Cholesterol and sphingomyelin drive ligand-independent T-cell antigen receptor nanoclustering. J Biol Chem. (2012) 287:42664–74. doi: 10.1074/jbc.M112.386045
39. Lanna A, Henson SM, Escors D, Akbar AN. The kinase p38 activated by the metabolic regulator AMPK and scaffold TAB1 drives the senescence of human T cells. Nat Immunol. (2014) 15:965–72. doi: 10.1038/ni.2981
40. Cao Y, Rathmell JC, Macintyre AN. Metabolic reprogramming towards aerobic glycolysis correlates with greater proliferative ability and resistance to metabolic inhibition in CD8 versus CD4 T cells. PLoS ONE (2014) 9:e104104. doi: 10.1371/journal.pone.0104104
41. Nguyen HH, Kim T, Song SY, Park S, Cho HH, Jung SH, et al. Naive CD8(+) T cell derived tumor-specific cytotoxic effectors as a potential remedy for overcoming TGF-beta immunosuppression in the tumor microenvironment. Sci Rep. (2016) 6:28208. doi: 10.1038/srep28208
42. Hinrichs CS, Borman ZA, Gattinoni L, Yu Z, Burns WR, Huang J, et al. Human effector CD8+ T cells derived from naive rather than memory subsets possess superior traits for adoptive immunotherapy. Blood (2011) 117:808–14. doi: 10.1182/blood-2010-05-286286
43. Sukumar M, Liu J, Mehta GU, Patel SJ, Roychoudhuri R, Crompton JG, et al. Mitochondrial membrane potential identifies cells with enhanced stemness for cellular therapy. Cell Metab. (2016) 23:63–76. doi: 10.1016/j.cmet.2015.11.002
44. Angela M, Endo Y, Asou HK, Yamamoto T, Tumes DJ, Tokuyama H, et al. Fatty acid metabolic reprogramming via mTOR-mediated inductions of PPARγ directs early activation of T cells. Nat Commun. (2016) 7:13683. doi: 10.1038/ncomms13683
45. Cham CM, Driessens G, O'Keefe JP, Gajewski TF. Glucose deprivation inhibits multiple key gene expression events and effector functions in CD8+ T cells. Eur J Immunol. (2008) 38:2438–50. doi: 10.1002/eji.200838289
46. Chang CH, Curtis JD, Maggi LB Jr, Faubert B, Villarino AV, O'Sullivan D, et al. Posttranscriptional control of T cell effector function by aerobic glycolysis. Cell (2013) 153:1239–51. doi: 10.1016/j.cell.2013.05.016
47. Peng M, Yin N, Chhangawala S, Xu K, Leslie CS, Li MO. Aerobic glycolysis promotes T helper 1 cell differentiation through an epigenetic mechanism. Science (2016) 354:481–4. doi: 10.1126/science.aaf6284
48. Ho PC, Bihuniak JD, Macintyre AN, Staron M, Liu X, Amezquita R, et al. Phosphoenolpyruvate is a metabolic checkpoint of anti-tumor T cell responses. Cell (2015) 162:1217–28. doi: 10.1016/j.cell.2015.08.012
49. Puleston DJ, Zhang H, Powell TJ, Lipina E, Sims S, Panse I, et al. Autophagy is a critical regulator of memory CD8(+) T cell formation. Elife (2014) 3:1–21. doi: 10.7554/eLife.03706
50. Xu X, Araki K, Li S, Han JH, Ye L, Tan WG, et al. Autophagy is essential for effector CD8(+) T cell survival and memory formation. Nat Immunol. (2014) 15:1152–61. doi: 10.1038/ni.3025
51. Arnold CR, Pritz T, Brunner S, Knabb C, Salvenmoser W, Holzwarth B, et al. T cell receptor-mediated activation is a potent inducer of macroautophagy in human CD8(+)CD28(+) T cells but not in CD8(+)CD28(-) T cells. Exp Gerontol. (2014) 54:75–83. doi: 10.1016/j.exger.2014.01.018
52. Whang MI, Tavares RM, Benjamin DI, Kattah MG, Advincula R, Nomura DK, et al. The ubiquitin binding protein TAX1BP1 mediates autophagasome induction and the metabolic transition of activated T cells. Immunity (2017) 46:405–20. doi: 10.1016/j.immuni.2017.02.018
53. Henson SM, Lanna A, Riddell NE, Franzese O, Macaulay R, Griffiths SJ, et al. p38 signaling inhibits mTORC1-independent autophagy in senescent human CD8(+) T cells. J Clin Invest. (2014) 124:4004–16. doi: 10.1172/JCI75051
54. Zeyda M, Szekeres AB, Saemann MD, Geyeregger R, Stockinger H, Zlabinger GJ, et al. Suppression of T cell signaling by polyunsaturated fatty acids: selectivity in inhibition of mitogen-activated protein kinase and nuclear factor activation. J Immunol. (2003) 170:6033–9. doi: 10.4049/jimmunol.170.12.6033
55. Shriver LP, Manchester M. Inhibition of fatty acid metabolism ameliorates disease activity in an animal model of multiple sclerosis. Sci Rep. (2011) 1:79. doi: 10.1038/srep00079
56. Khan AA, Srivastava R, Spencer D, Garg S, Fremgen D, Vahed H, et al. Phenotypic and functional characterization of herpes simplex virus glycoprotein B epitope-specific effector and memory CD8+ T cells from symptomatic and asymptomatic individuals with ocular herpes. J Virol. (2015) 89:3776–92. doi: 10.1128/JVI.03419-14
57. Nicoli F, Gallerani E, Skarlis C, Sicurella M, Cafaro A, Ensoli B, et al. Systemic immunodominant CD8 responses with an effector-like phenotype are induced by intravaginal immunization with attenuated HSV vectors expressing HIV Tat and mediate protection against HSV infection. Vaccine (2016) 34:2216–24. doi: 10.1016/j.vaccine.2016.03.022
58. Appay V, Dunbar PR, Callan M, Klenerman P, Gillespie GM, Papagno L, et al. Memory CD8+ T cells vary in differentiation phenotype in different persistent virus infections. Nat Med. (2002) 8:379–85. doi: 10.1038/nm0402-379
59. Sauce D, Larsen M, Fastenackels S, Duperrier A, Keller M, Grubeck-Loebenstein B, et al. Evidence of premature immune aging in patients thymectomized during early childhood. J Clin Invest. (2009) 119:3070–8. doi: 10.1172/JCI39269
60. Alanio C, Nicoli F, Sultanik P, Flecken T, Perot B, Duffy D, et al. Bystander hyperactivation of preimmune CD8+ T cells in chronic HCV patients. Elife (2015) 4:1–20. doi: 10.7554/eLife.07916
Keywords: immunometabolism, mTOR, naïve T-cells, priming, CD8+ T-lymphocytes
Citation: Nicoli F, Papagno L, Frere JJ, Cabral-Piccin MP, Clave E, Gostick E, Toubert A, Price DA, Caputo A and Appay V (2018) Naïve CD8+ T-Cells Engage a Versatile Metabolic Program Upon Activation in Humans and Differ Energetically From Memory CD8+ T-Cells. Front. Immunol. 9:2736. doi: 10.3389/fimmu.2018.02736
Received: 24 August 2018; Accepted: 06 November 2018;
Published: 21 December 2018.
Edited by:
Loretta Tuosto, La Sapienza University of Rome, ItalyReviewed by:
Hu Zeng, Mayo Clinic, United StatesJacques A. Nunes, INSERM U1068 Centre de recherche en cancérologie de Marseille, France
Copyright © 2018 Nicoli, Papagno, Frere, Cabral-Piccin, Clave, Gostick, Toubert, Price, Caputo and Appay. This is an open-access article distributed under the terms of the Creative Commons Attribution License (CC BY). The use, distribution or reproduction in other forums is permitted, provided the original author(s) and the copyright owner(s) are credited and that the original publication in this journal is cited, in accordance with accepted academic practice. No use, distribution or reproduction is permitted which does not comply with these terms.
*Correspondence: Francesco Nicoli, bmNsZm5jMUB1bmlmZS5pdA==
Victor Appay, dmljdG9yLmFwcGF5QHVwbWMuZnI=
†Present Address: Francesco Nicoli and Antonella Caputo, Department of Chemical and Pharmaceutical Sciences, University of Ferrara, Ferrara, Italy