 Vanessa M. Beutgen
 Natarajan Perumal
 Norbert Pfeiffer
- Experimental and Translational Ophthalmology, Department of Ophthalmology, University Medical Center of the Johannes Gutenberg–University Mainz, Mainz, Germany
Glaucoma is an optic neurological disorder and the leading cause of irreversible blindness worldwide, with primary open angle glaucoma (POAG) as its most prevalent form. An early diagnosis of the disease is crucial to prevent loss of vision. Mechanisms behind glaucoma pathogenesis are not completely understood, but disease related alterations in the serological autoantibody profile indicate an immunologic component. These changes in immunoreactivity may serve as potential biomarkers for glaucoma diagnostics. We aimed to identify novel disease related autoantibodies targeting antigens in the trabecular meshwork as biomarkers to support early detection of POAG. We used serological proteome analysis (SERPA) for initial autoantibody profiling in a discovery sample set. The identified autoantibodies were validated by protein microarray analysis in a larger cohort with 60 POAG patients and 45 control subjects. In this study, we discovered CALD1, PGAM1, and VDAC2 as new biomarker candidates. With the use of artificial neural networks, the panel of these candidates and the already known markers HSPD1 and VIM was able to classify subjects into POAG patients and non-glaucomatous controls with a sensitivity of 81% and a specificity of 93%. These results suggest the benefit of these potential autoantibody biomarkers for utilization in glaucoma diagnostics.
Introduction
Glaucoma describes a group of optic neuropathies and is the leading cause of irreversible blindness. Primary open angle glaucoma (POAG) is the most common form of the disease (1), with a prevalence of 3.05% in people aged 40–80 years worldwide (2). Characteristic for glaucoma is the loss of retinal ganglion cells (RGCs) and their axons by apoptosis, leading to constant impairment of the visual field and finally complete loss of sight. Alongside old age, a major risk factor for this disorder is an elevated intraocular pressure (IOP), leading to the onset of glaucoma in 10% of affected people over the course of 5 years (3). As of today, the reduction of the IOP is the only therapy available that can prevent glaucoma progression. Cause of the IOP elevation is a deficiency in the drainage of aqueous humor (AH) from the eye via the trabecular meshwork (TM). Under normal conditions, TM cells also show fibroblast like properties, allowing them to contract and actively modulate outflow resistance. The TM in POAG is characterized by an extensive accumulation of extracellular matrix (4), the reorganization of the actin cytoskeleton (5, 6) and a decreased cellularity. This causes an overall increase of tissue rigidity leading to diminishing capability to adapt to changing IOP levels. Malfunction of the AH outflow facility finally causes an increase of IOP above physiological levels, inducing mechanical stress to the optic nerve head. The constant stress to the RGCs is thought to be one major factor in glaucoma pathogenesis, leading to apoptosis of the nervous cells (7). Albeit, molecular mechanisms behind pathological changes in the TM are not fully understood.
The subtle onset of the disease usually leads to a late diagnosis, since visual field defects are often first detectable by visual field testing when 25–35% of RGCs are already lost (8). This clearly shows the need for new diagnostic tools, capable of an early detection of reliable markers in easy accessible body fluids, like tear or serum.
Previous studies indicate an autoimmune component to the pathogenesis of glaucoma (9–11). Autoantibodies show altered levels in serum and aqueous humor of glaucoma patients. The quantity of autoantibodies against various heat shock proteins (11–14), α-fodrin (10), γ-enolase (15), vimentin (11), myelin basic protein (16), glial fibrillary acidic protein (16), and more have been found to be altered in a disease specific manner. Increased and decreased autoantibody reactivities could be detected, indicating an autoaggressive potential along with the loss of putative neuroprotective effects (17) of some autoantibodies, which could contribute to the pathogenesis of the disease.
With the goal of improving the diagnostic potential of serological biomarkers for glaucoma diagnosis, we sought to find new immunological biomarkers for POAG. To this end we used a serological proteome analysis (SERPA) approach. This technique has already been successfully applied for the identification of potential autoantibodies in other diseases, such as diabetes type 1 (18), multiple sclerosis (19), and different forms of cancer (20–22). Validation of the findings from the discovery stage SERPA are achieved by the use of the protein microarray technique, a high-throughput method for the simultaneously analysis of multiple samples (23, 24).
This work includes the discovery stage and the early validation stage of the biomarker pipeline (25) in search of reliable diagnostic biomarkers for POAG. Although several candidate biomarkers have been suggested in other studies, their diagnostic power is not sufficient yet. Based on its role in the elevation of IOP in the course of the disease, we expect to find novel autoantibodies directing target proteins in the TM.
Materials and methods
Sera
All samples were collected in accordance to the Declaration of Helsinki on biomedical research involving human subjects. Written informed consent was obtained from each subject to use serum samples for research purposes. The study was approved by the ethics committee of the Landesärztekammer Rheinland-Pfalz [Vote: 827.228.11 (7770)]. The subjects included in this study underwent an ophthalmic examination at the ophthalmic department of the university medical center in Mainz, Germany. For the initial screening using SERPA, six POAG samples were compared to six age and gender matched controls. In the microarray analysis, 60 sera from POAG patients and 45 sera from controls were analyzed. Inclusion criteria for POAG subjects was a diagnosis based on the European Glaucoma Society guidelines (26), according to characteristic optic nerve appearance and clinical parameters with elevated IOP, optic nerve cupping and/or characteristic visual field defects. The samples used in this study were randomly selected from available samples, only ensuring an even distribution of male and female patients using stratified random sampling with all available cases as sampling frame. Samples for the SERPA screening and for the microarray analysis were independently drawn from the same sampling pool. As control, a group of non-glaucomatous, age and gender matched subjects was used. This group comprises patients with other eye diseases and eye-healthy volunteers. Subjects with a reported autoimmune disease or other forms of glaucoma were excluded from the analysis. Other systemic diseases were not an exclusion criterion. In detail, the control group comprises 25 subjects with other eye diseases, 5 subjects with a systemic disease, 6 subjects with systemic and another eye disease, as well as 9 healthy subjects. Characteristics of the study population in the discovery and validation stage are demonstrated in Table 1. The POAG group includes patients with mild/early (MD < −6 db; 36.7%) and advanced (MD > −6 db; 63.3%) glaucomatous visual field defects, as observed by perimetry. Thereby, early POAG was regarded as a subgroup of special interest. All blood samples were allowed to clog for 30 min and were centrifuged for 10 min at 4°C and 1,000 g. The supernatant was collected and serum samples were stored at −80°C until further use.
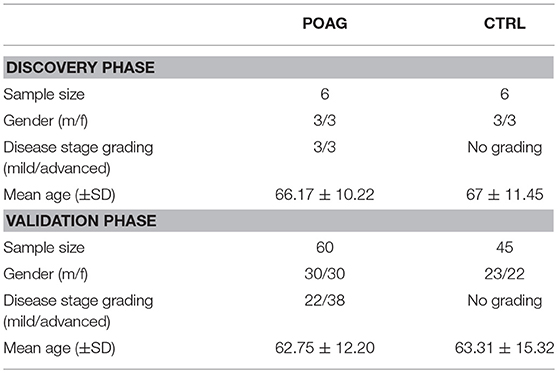
Table 1. Descriptive statistics of the study population.
TM Tissue Procurement
Porcine eyes are a commonly used ex vivo model for ophthalmic research with a morphology analog to the human eye (27, 28) and therefore were used as protein source for the experiments in this study. The eye balls were collected from a local abattoir, immersed in phosphate buffered saline (PBS, Sigma) and kept on ice during transition. Eyes were processed within 5 h after enucleation. TM tissue was dissected according to Bachmann et al. (29). Briefly, eyes were opened with an equatorial cut, the posterior segment and the vitreous were discarded. Lens, iris, and ciliary body were removed with a forceps by a gentle pull. The anterior segment of the eye was washed with PBS to remove remaining iris pigment. The following steps were executed under a dissecting microscope. After removing the remnants of the pectinate ligaments, two incisions were made, flanking the TM. One was set adjacent to the line of Schwalbe, another one adjacent to the scleral spur, leading to exposure of the TM. The tissue was excised using fine scissors, avoiding contaminations with sclera and neighboring tissue. Since preparation of this tissue is a delicate task, contaminations with other tissues cannot entirely be ruled out. TM tissue of five eyes was pooled in one tube and stored in lysis buffer at −80°C until further processing.
Protein Extraction and Precipitation
TM tissue of five eyes was disrupted, using a sonicator, in 100 μL lysis buffer [125 mM Tris-HCl, pH 7; 100 mM NaCl; 0.1% Triton-X 100; 0.1% Tween 20; 0.5% Protease Inhibitor Cocktail (Sigma)]. After 1 h incubation on ice, tissue lysates were centrifuged at 20,000 g and 4°C. Soluble proteins were collected in a new vial, the cell pellet was resuspended in fresh lysis buffer and centrifuged at 20,000 g and 4°C for additional two times. Supernatants were pooled in one tube.
Seventy-five microliters of 72% trichloroacetic acid were added to the soluble protein fraction, and incubated for 30 min on ice. Precipitated protein was centrifuged at 20,000 g and 4°C for 30 min. The supernatant was discarded and the protein pellet was washed one time with HPLC grade water and two times with Acetone. After the last washing step, the pellet was air dried and resuspended in resolubilization buffer (8M Urea; 400 mM Tris; 4% CHAPS). Total extracted protein amount was determined using a BCA Assay kit (Thermo Scientific).
2D PAGE
For first dimension protein separation, according to the isoelectric point, 7 cm NL pH 3–10 IPG-strips (GE Healthcare) were used. One microliter Protease Inhibitor Cocktail (Sigma), 1 μL Bromophenol blue, 1.25 μL 2M dithiothreitol (DTT) and 2.5 μL IPG buffer (pH 3–10) were added to 100 μg TM protein. Volume was adjusted to 125 μL by adding resolubilization buffer + 0.12% DeStreak Reagent (GE Healthcare). Samples were incubated at 4°C with light agitation for 30 min, applied to IPG strip holders together with the respective IPG strips. Isoelectric focusing protocols were used as previously described (30). Briefly, proteins were allowed to rehydrate for 2 h at room temperature, followed by a 12 h step at 20 V and 20°C. Afterwards proteins were focused by increasing voltage gradually over 1 h to 500 V and holding this voltage for another hour. Afterwards voltage was increased again using a gradient to 1,000 V in 0.5 h and staying at this voltage for one additional hour. This step was followed by a 0.5 h gradient to 4,000 V and 2 h a holding step at 4,000 V. The final focusing step included voltage increase to 8,000 V during a 2 h gradient followed by a 2 h holding step.
After focusing, IPG strips were equilibrated for 2 × 15 min with slight agitation in 10 mL equilibration buffer (6M Urea; 75 mM Tris; 2%SDS; 34.5% Glycerol) containing 100 mg DTT for first equilibration and 250 mg iodoacetamid for the second.
For the second dimension SDS-PAGE, 4–12% precast gradient gels were used (NuPage, Novex; Bis-Tris gels) with MES running buffer (NuPage, MES SDS running buffer, Invitrogen). The IPG strip was briefly washed in MES buffer prior to application to the gel. The strip was fixed by adding a 0.5% Agarose solution, stained with bromophenol blue. Proteins were separated at 150 V for approximate 2 h.
Gels for the creation of the fusion image spot map and preparative gels were stained using the Invitrogen colloidal blue staining kit.
2D Western Blot
Proteins from the 2D gels were transferred for 2 h to a nitrocellulose membrane using a wet blot system (Mini Trans-Blot Cell; Bio Rad) using a standard Towbin buffer (31). Proteins were fixed and transfer efficiency was validated by ponceau S staining (Thermo Scientific). Unspecific binding sites on the blot were blocked by incubation of the membrane in 4% non-fat dry milk in TBST (Tris buffer saline + 0.5% Tween 20) for 1 h at room temperature. After washing the membrane three times with TBST, it was incubated with patients serum (1:40 in TBST) overnight under slight agitation at 4°C. After three more washing steps, the membranes were incubated with an anti-human IgG Fc HRP secondary antibody (Goat anti-human IgG H&L (HRP); Abcam) for 1 h at room temperature with slight agitation. Following three additional washing steps with TBST, the detection of the antibody reaction was achieved by a colorimetric approach, incubating the blots with a 3,3′,5,5′-tetramethylbenzidine substrate solution (1-Step™ TMB-Blotting Substrate Solution; Thermo Fisher Scientific) for 30 s. The reaction was quenched by washing the blots in HPLC grade water.
Imaging
Stained gels and western blots were imaged using a flatbed scanner (Epson V600). Images were scanned as 16 bit grayscale files. Spot detection, creation of the 2D fusion map and quantitative analysis was achieved by using the software Delta2D (Decodon). Spot quantities were analyzed as relative quantity of the spot, excluding background, where the total quantity of all spots on a 2D western blot is 100%. Thereby, the bias from different absolute staining intensities on individual blots is minimized.
Total Protein Stain
After imaging, the western blot membranes were washed for 5 min in water and another 5 min in PBS. Afterwards, the membranes were incubated in PBST (PBS + 0.5% Tween 20) for 1 h. After washing three times for 2 min in water, the membranes were incubated for 2 h in colloidal gold staining solution (Colloidal Gold Total Protein Stain, Biorad). Following three further washing steps with water, the membranes were allowed to dry and scanned using a flatbed scanner system.
LC-ESI-MS/MS
Spots of interest were cut out of three colloidal blue stained gels using a scalpel. Each protein spot was pooled with its corresponding spot from two other identical gels to allow the detection of less abundant proteins by MS. In-gel digestion was carried out according to the protocols of Shevchenko et al. (32). Gel pieces were destained, reduced and alkylated before tryptic digestion of the proteins. Prior to MS analysis, the samples were cleaned up using C18 Resin ZipTip pipette tips (Millipore), as described earlier (30, 33). The LC-system consisted of a Rheos Allegro pump (Thermo Scientific, Rockford, USA) and a PAL HTC autosampler (CTC Analytics, Zwingen, Switzerland), as described elsewhere (34). The system comprised of a 30 × 0.5 mm BioBasic C18 column (Thermo Scientific). Solvent A was LC-MS grade water with 0.1% (v/v) formic acid and solvent B was LC-MS grade acetonitrile with 0.1% (v/v) formic acid. The gradient was run for 90 min per gel spot as follows: 0–50 min, 10–35% B; 50–70 min, 35–55% B; 70–75 min, 55–90% B; 75–80 min, 90% B; 80–83 min, 90–10% B; and 83–90 min, 10% B. Continuum mass spectra data were acquired on an ESI-LTQ-Orbitrap-XL MS (Thermo Scientific, Bremen, Germany). The LTQ-Orbitrap was operated in a data-dependent mode of acquisition to automatically switch between Orbitrap-MS and LTQ-MS/MS acquisition. Survey full scan MS spectra (from m/z 300 to 2,000) were acquired in the Orbitrap with a resolution of 30,000 at m/z 400 and a target automatic gain control (AGC) setting of 1.0 × 10⁶ ions. The lock mass option was enabled in MS mode and the polydimethylcyclosiloxane (PCM) m/z 445.120025 ions were used for internal recalibration in real time (35). The five most intense precursor ions were sequentially isolated for fragmentation in the LTQ with a collision-induced dissociation (CID) fragmentation, the normalized collision energy (NCE) was set to 35% with activation time of 30 ms with repeat count of 10 and the dynamic exclusion segment was disabled. The resulting fragment ions were recorded in the LTQ.
The acquired continuum MS spectra were analyzed by Thermo Proteome Discoverer software (ver. 1.1.0.263; Thermo scientific). The tandem MS spectra were searched against Uniprot database (combined Homo sapiens and Sus scrofa, date:20.04.2018) using settings with peptide mass tolerance of ±50 ppm, fragment mass tolerance of ±0.5 Da and peptide charge state 1+ to 4+, using MASCOT server version 2.2.7. FDR for peptide and protein identification was set to 0.01. Carbamidomethylation of cysteine was set as a static modification, while protein oxidation of methionine were defined as dynamic modifications, enzyme: trypsin and maximum number of missed cleavages: 1. The mass spectrometry proteomics data have been deposited to the ProteomeXchange Consortium via the PRIDE partner (36) repository with the dataset identifier PXD011752.
Microarray Fabrication
Microarrays were manufactured in our lab using a non-contact piezo-dispenser (SciFLEXARRAYER S3, Scienion, Berlin, Germany). The selected candidate antigens were purchased as recombinant human proteins (Table S1) and spotted in triplicates onto nitrocellulose coated microarray slides (AVID Oncyte, 16 Pad NC slides, Grace Biolabs, Bend, Oregon, USA). As positive and negative control spots, human IgG (Sigma), secondary antibody conjugated to alexa flour 647 and spotting buffer (PBS) were included on each array. The spotting process was carried out in a humidity chamber with humidity set to 60%. To allow optimal immobilization of the proteins on the microarray surface, slides were kept on the spotter platform to dry overnight prior to incubation.
Microarray Incubation and Image Acquisition
Slides were incubated using incubation chambers (ProPlate Multiwell chambers, Grace Biolabs, Bend, USA), that divide the slide in 16 subarrays. The following incubation steps were performed at 4°C on an orbital shaker. To decrease background signals, the arrays were incubated with blocking buffer (Super G, Grace Biolabs, Bend, Oregon, USA) for 1 h. After removing the blocking buffer, residual buffer was washed away three times with phosphate-buffered saline containing 0.5% Tween-20 (PBST). The arrays then were incubated with 100 μL serum samples in a 1:250 dilution in PBS overnight. One subarray on each slide was incubated with PBS to serve as a negative control. Slides were washed again three times with PBST followed by incubation for 1 h at room temperature with a secondary anti-human antibody conjugated with Alexa flour 647 (Alexa Fluor® 647 AffiniPure Goat Anti-Human IgG, Fcγ fragment specific, 109-605-008, Jackson Immunoresearch) in a 1:500 dilution in PBS. After the incubation with the secondary antibody, the slides were washed two times with PBST and two times with ultrapure water. The microarray slides were dried for 2 min in a vacuum concentrator (SpeedVac, Thermo Scientific, Waltham, Massachusetts, USA).
Slides were scanned with a high resolution confocal laser scanner (428 Array Scanner, Affymetrix, Santa Clara, California, USA), yielding 16 bit TIFF images. Spot intensities were quantified with the image analysis software Imagene (Imagene 5.5, BioDiscovery Inc., Los Angeles, California, USA). Spots with poor quality were manually flagged and removed from further analysis.
Microarray Data Pre-procession
Local background was subtracted from the median spot intensities. Negative background subtracted intensities were set to zero. Low quality spots were flagged and excluded from analysis. To correct for the unspecific binding of the secondary antibody, the signal of the negative control included on each slide was subtracted from each spot. The replicate spot intensities were averaged, yielding one mean fluorescence intensity. To correct for technical variability, the signal intensities were normalized to the IgG control spots on each subarray by median centering. To this end, the IgG median signal intensities were divided by the overall IgG signal median, yielding a normalization factor. All signal intensities on one subarray were multiplied with their correspondent normalization factor. The resulting normalized fluorescence intensities (NFI) were forwarded to statistical analysis.
Statistical Analysis
Normality of the obtained data was assessed using one-sample Kolmogorov–Smirnov (K-S) test. Data obtained by SERPA was normally distributed (K-S test not significant at alpha = 0.05), therefore, differences in spot quantities in the SERPA discovery phase were assessed using student's t-test. Some variables in the microarray data did not follow a normal distribution (K-S p < 0.05) and consequently changes in autoantibody levels were assessed using Mann–Whitney U-test. A p-value of <0.05 was considered statistical significant. In order to obtain a more robust statistic and reduce the influence of outliers in the microarray data set, values below the 5th and above the 95th percentile in each group were excluded from analysis. Kruskal–Wallis H test was used for multiple group comparisons. ROC curves were computed using artificial neural networks (ANN). The multilayer perceptron (MLP) networks were trained by randomly using 70% of the cases as training set and 30% as test set. ROC curves and AUROCC values refer to test performance only on the test set. Missing data in the microarray data set was replaced by the respective group mean for the ANN model building. The statistical data analysis was performed using Statistica (Statistica 13, Statsoft, Tulsa, Oklahoma, USA).
Results
Discovery of Candidate Autoantigens by SERPA
The aim of this analysis was the identification of potential autoantibodies to antigens in the TM. In this discovery phase study, serum of six POAG patients and six age and gender matched controls (CTRL) were analyzed for autoreactive antibodies against proteins derived from porcine TM tissue lysates. To this end, we used SERPA as a widely used immunoproteomic method for the identification of serological autoantibodies (Figure 1). TM tissue lysates were separated by 2DE and transferred onto nitrocellulose membranes. Membranes were subsequently incubated with individual serum samples from the POAG or the control group. As shown in Figure 2, a broad range of antigen-autoantibody-complexes were detected in both groups, but autoantibody profiles also strongly varied amongst individuals. To find differences in the autoantibody repertoire of the two groups, protein spots on the immunoblots were analyzed and spot intensities were quantified using Delta2D (Decodon). Raw spot quantities were normalized to the equalized total signal intensities of the immunoblots to prevent bias from blot incubation. A spot map was created of three colloidal blue stained 2DE gels using TM tissue lysates. In Delta2D images of these gels were computed to obtain a single master image showing the average spot pattern of the three gels (Figure 3A). Spots that showed differences between groups in the quantity of their average gray value (Figure 3B) and could be visually identified on colloidal blue stained gels were selected for identification by MS. The spots of interest from the 2DE western blots were matched with the correspondent spot on the spot map. To help the identification of the spots on the spot map, a total protein stain using colloidal gold was applied to the western blot membranes. This allowed for the application of the image warping option in Delta2D, were spot pattern of two different images can be aligned. This enabled a reliable identification of the immunoreactive spots on the preparative gels used for the MS analysis. The spots of interest were cut out in three preparative gels and pooled to increase the protein amount for MS analysis. Spots were identified by MS analysis as shown in Table 2.
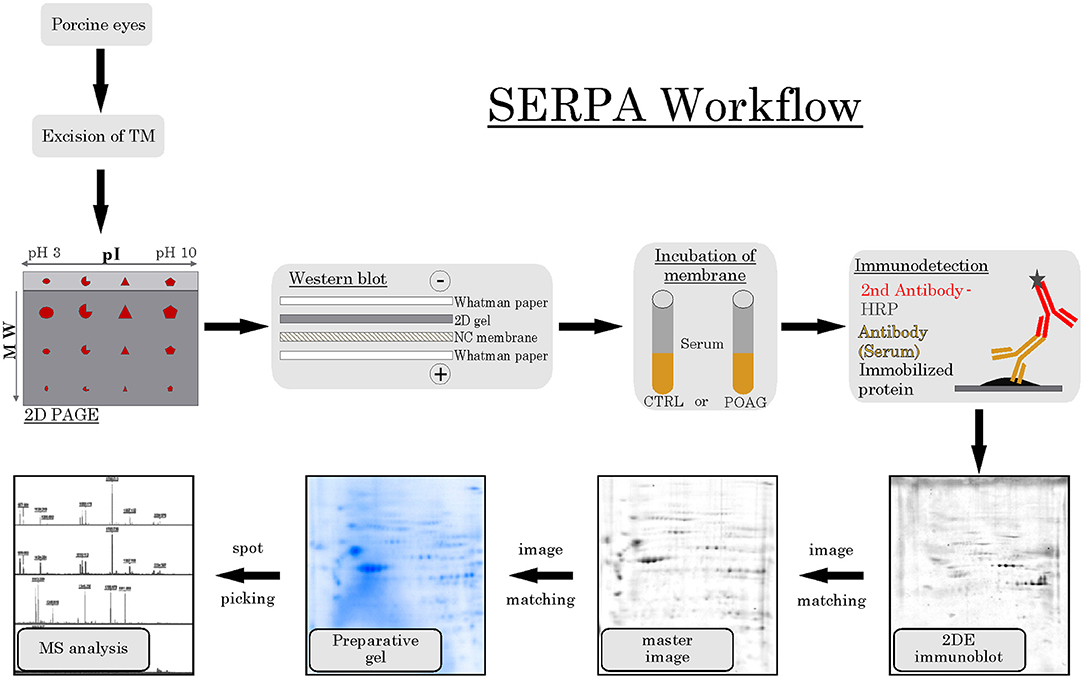
Figure 1. SERPA workflow. TM tissue was excised from porcine eyes and analyzed by 2DE PAGE, separating the proteins according to their isoelectric point (pI) and their molecular weight (MW). Next, proteins were transferred to a nitrocellulose (NC) membrane using a wet blot system. Then, the membranes containing the immobilized protein were incubated with either CTRL or POAG serum, using the contained autoantibodies as primary antibodies. As secondary detection antibody, anti-human antibodies conjugated to horse radish peroxidase (HRP) were used and visualized by a colorimetric detection. The resulting 2DE immunoblots were matched to their corresponding spots on a colloidal blue stained master image, computed as average pattern from three independent 2DE gels. Spots of interest were then identified on preparative gels and prepared for MS analysis.
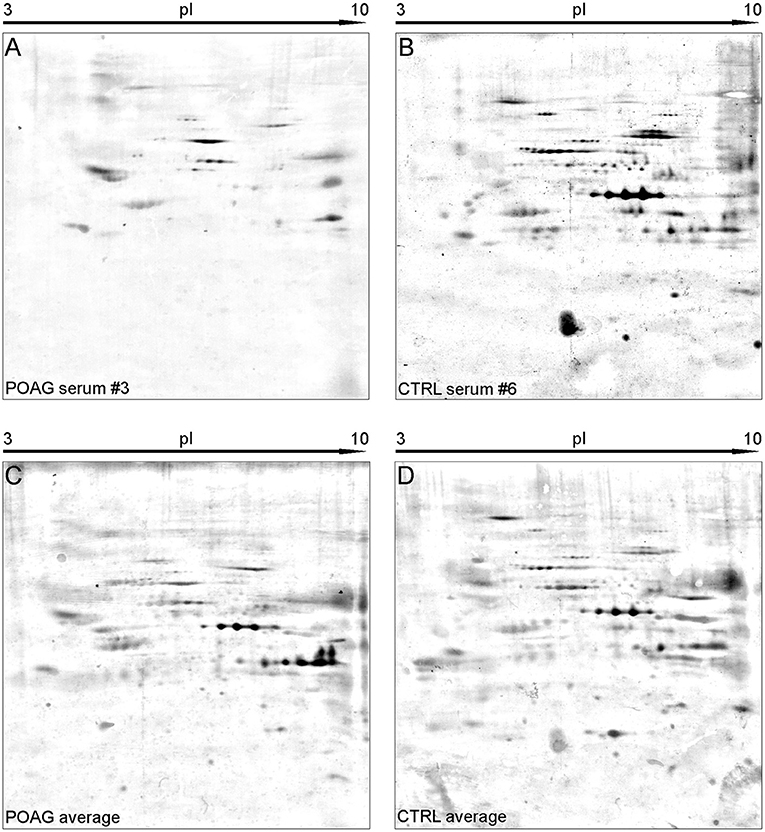
Figure 2. Representative SERPA immunoblots. (A,B) Show 2DE immunoblots of individual sera form either POAG (A) or CTRL group (B). (C,D) Show the average pattern for the POAG and the CTRL group computed from all immunoblots by Delta2D. A high abundance of diverse autoantibodies could be detected in both groups. Interesting spots were selected upon their different gray intensity between the two groups and forwarded to MS analysis.
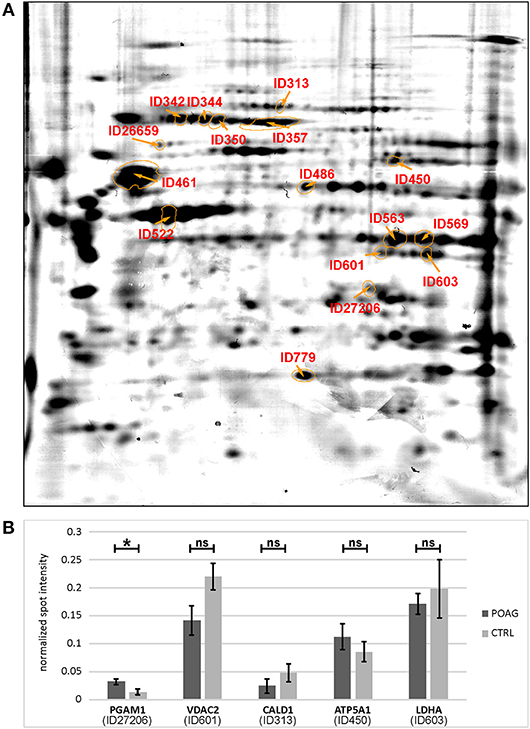
Figure 3. Quantification of spot intensities and protein identification. (A) The picture shows a spot map computed of three individual colloidal blue stained 2DE gels, reflecting an average image of the porcine TM proteome. Spots of interest were labeled with IDs and identified by MS analysis (Table 2). (B) Comparison of immunoblot spot intensities between groups. Normalized spot intensities are shown for PGAM1, VDAC2, CALD1, ATP5A1, and LDHA. Asterisk indicates significance at p < 0.05, ns, not significant.
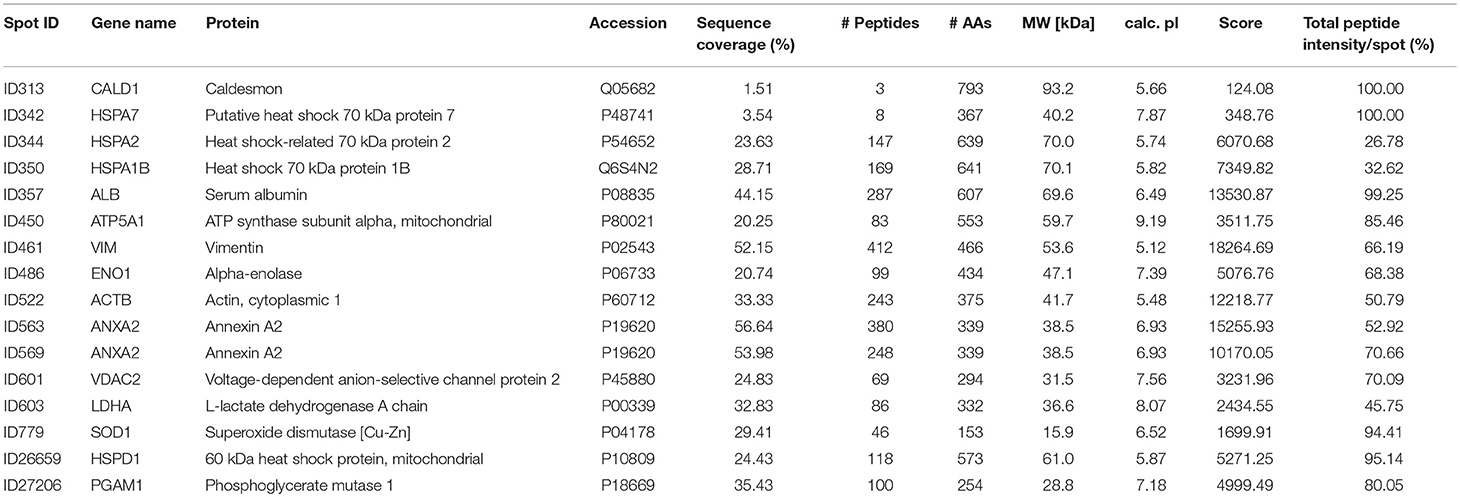
Table 2. Identified 2DE spots by MS analysis.
A total of 16 autoantigens could be identified by LC-ESI-MS/MS. They all showed variations in mean autoantibody levels between groups, with in- and decreased signal intensities, but only one spot showed significant changes (Table 3). The spot identified as phosphoglycerate mutase 1 (PGAM1) showed significant differences between groups (p = 0.03), as analyzed by student's t-test. Other autoantigens that have not yet been described in the context of glaucoma were identified as ATP synthase subunit alpha (ATP5A1), Caldesmon (CALD1), Voltage-dependent anion-selective channel protein 2 (VDAC2), and L-lactate dehydrogenase A (LDHA) but failed to show significant group differences. Furthermore, some previous identified glaucoma autoantigens including heat shock protein 60 dDA (HSPD1) (12, 13), heat shock protein 70 kDa (HSPA1B) (11), vimentin (VIM) (11), α-enolase (ENO1) (37) and superoxide dismutase 1 (SOD1) (38) could be detected (Table 2). Considering the caveats of the colorimetric detection used in this approach and the low statistical power of this discovery screening approach, it has been decided to include all detected autoantigens in the microarray validation step to analyze the respective autoantibody levels in a method providing a higher dynamic range and capable to process a larger number of samples. Thus, this enables the detection of smaller effects that might be missed in the initial discovery.
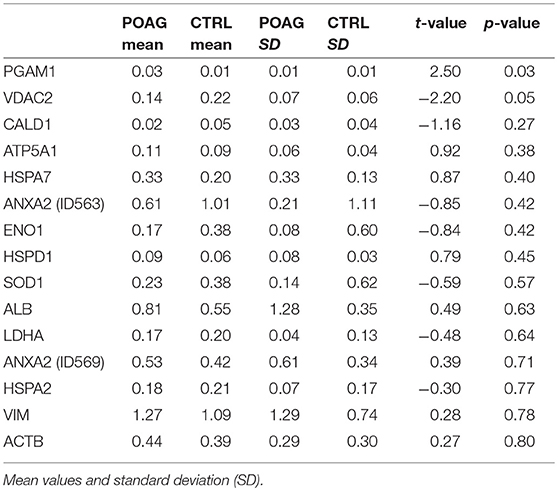
Table 3. Quantification of normalized signal intensities from SERPA immunoblots and statistical significance (p-value t-test).
Protein Microarray Analysis for the Validation of Putative Autoantibodies
To analyze the autoantibody distribution of the detected candidates in a larger sample size, customized microarray slides were fabricated using commercially available recombinant proteins (Table S1). This approach yields fluorescence intensities for each tested autoantigen that correlate with the serological autoantibody level. Autoantibody levels of the selected candidates were analyzed in serum samples of 60 POAG patients and compared to an age and gender matched control group of 45 individuals. The received data was pre-processed and normalized to IgG control spots on each subarray. Descriptive statistics of the obtained data are shown in Table 4. Kolmogorov-Smirnov one-sample test for normality indicated, that the data is not normally distributed. Therefore, non-parametric Mann-Whitney U test was applied to analyze the data for alternating autoantibody distributions in POAG patients and the control group. This analysis revealed a significant increase of autoantibody levels against VIM, HSPD1, PGAM1, VDAC2, and CALD1 (p < 0.05, Figures 4A–E) in POAG compared to the control group. To investigate, whether the presence of other eye or systemic diseases has an influence on the tested autoantibody levels, we further analyzed the control group. To this end we divided the control group into four subgroups with regard to other diseases, comprising subjects with “other eye disease” (n = 25), “systemic disease” (n = 5), “systemic + other eye disease” (n = 6) and “none” (n = 9). Kruskal–Wallis H-test revealed no significant (p ≥ 0.05) difference among these subgroups.
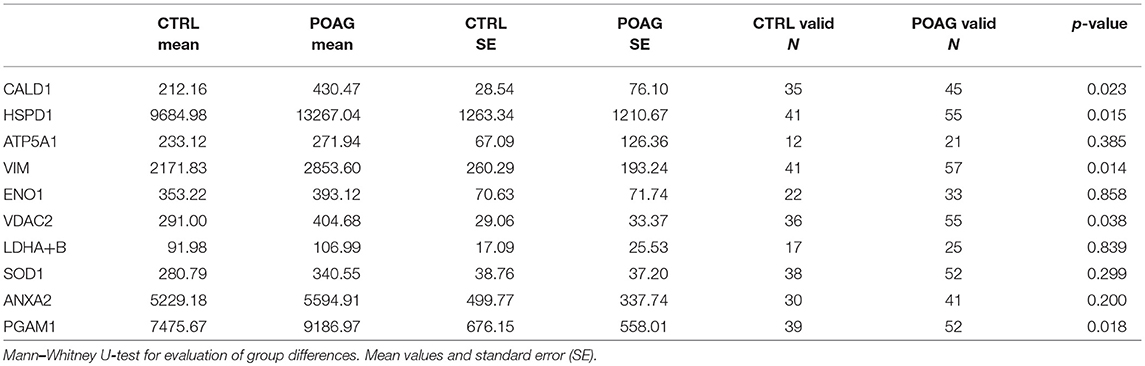
Table 4. Normalized fluorescence intensities (NFI) obtained by protein microarray analysis.
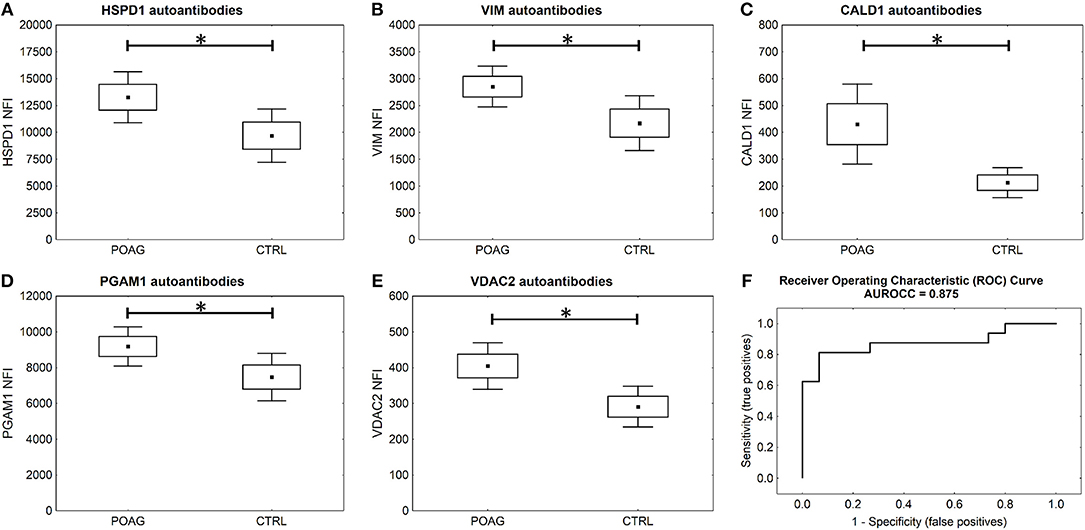
Figure 4. Microarray results and ROC curve. (A–E) Microarray analysis shows significant higher serological levels of HSPD1, VIM, CALD1, PGAM1, and VDAC2 antibodies in POAG (U test p < 0.05). Small squares indicate mean fluorescent intensities, boxes present the standard error of the mean (SE), whiskers show 1.96 times SE. * p < 0.05; ns “not significant” (F) ROC curve for five autoantibody-marker panel by use of ANNs.
To evaluate the potential of the identified markers to discriminate between POAG and non-glaucomatous subjects we used ANNs. The MLP network was trained using a training set consisting of 70% randomly selected samples from the microarray data set of these five markers. To assess the classification power, the network was deployed on the remaining 30% of the data, the test set. Specifications of the ANN can be found in Table S2.The trained network was able to classify the POAG patients from the control group with a sensitivity of 81% and a specificity of 93% (Figure 4F). With an area under the roc curve (AUROCC) of 0.875 the test yields a good accuracy.
It is further of special interest to enhance glaucoma diagnostics at an early stage of disease progression, when glaucomatous visual field damage is still minor. Therefore, a subgroup of POAG subjects, being at an early disease stage with mild visual field defects, was analyzed separately. The autoantibody levels of PGAM1, VDAC2, CALD1, and VIM are significantly higher in the subgroup of patients with mild POAG (p < 0.05) (Figures 5B–E). HSPD1 autoantibody levels showed no significant difference in mild POAG (Figure 5A). Kruskal-Wallis H test however, revealed a significant change in HSPD1 autoantibodies between different POAG gradations (p = 0.017). The mean level increases with visual field damage progression (Figure 5F).
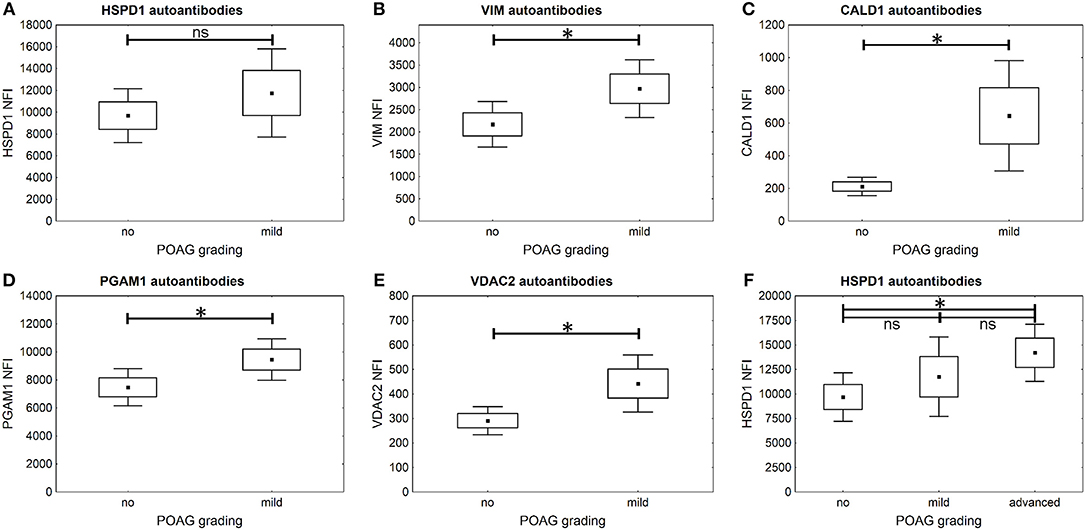
Figure 5. Comparison of autoantibody levels in mild POAG and CTRL (no). Small squares indicate mean fluorescent intensities, boxes present the standard error of the mean (SE), whiskers show 1.96 times SE. * p < 0.05; ns “not significant” (A–E) The microarray analysis shows that autoantibodies to VIM (B), CALD1 (C), PGAM1 (D), and VDAC2 (E) already show significantly higher levels in early POAG (p < 0.05), but not autoantibodies to HSPD1 (A) (p = 0.38). (F) Kruskal–Wallis H-test shows significant differences in HSPD1 autoantibody levels between different POAG gradations. The mean HSPD1 autoantibody levels increase with glaucoma progression and show significant differences between CTRL (no) and advanced POAG (p = 0.013).
Discussion
Glaucoma diagnostic as it is today is time and cost intensive. Only experienced ophthalmic medical staff can evaluate glaucomatous damages of the optic nerve and even then, the diagnosis often is a matter of subjective interpretation. Clinical signs of the damage regularly only show, when the disease is far in progression. In most cases, 25–35% of the retinal ganglion cells underwent apoptosis before glaucoma is first diagnosed. To help the medical staff with the assessment of glaucoma and to provide a fast and objective test that can be included in routine examinations, reliable biomarkers need to be established in easy monitorable body fluids, such as tear or serum. Regarding autoantibody levels as potential biomarkers fulfilling these requirements, there is the caveat that no single marker is specific enough to classify healthy subjects from diseased. As already shown in cancer diagnostics (39–41), a set of markers needs to be established to enable sufficient discrimination, since fluctuations of autoantibody levels can occur in higher magnitude, even in healthy individuals. In an earlier study, the data of nine autoantibody biomarkers in serum and aqueous humor samples was used to train an ANN. The created network was able to classify the subjects in the test set with an AUROCC of 0.93 (38). But the translation of this biomarkers to an actual diagnostic test to be used in clinical routine is no trivial task, since multiplexing analysis of autoantibody concentration in a point-of-care device (POCD) with up to nine analytes has not been established yet. The challenge now is to find a set of biomarkers that is small enough to be deployed in a POCD but robust enough to allow testing with high specificity and sensitivity.
In this study, our goal was to identify novel glaucoma specific biomarkers by SERPA. To this end, we analyzed sera of six POAG patients and six non-glaucomatous individuals. With this approach, we were able to identify 16 autoantigens, but only PGAM1 autoantibodies showed significant elevated levels in POAG. To validate the observations made in this discovery phase, the identified candidates were subjected to a protein microarray analysis. Sera of 60 POAG patients and 45 controls were tested for their autoantibody levels against these target antigens. Here, VDAC2, CALD1, and PGAM1 autoantibodies have shown to be elevated in serum of POAG patients and also in the subgroup of POAG patients with an early disease stage. Therefore, they might be used as novel serological biomarkers that improve early glaucoma diagnosis.
VDAC2 is a voltage-dependent anion channel in the outer mitochondrial membrane. It is a ~30 kDa transmembrane protein (42) and is important for the translocation of small molecules across the membrane. The porin does not only act as channel for ATP and ions but can also release the apoptosis inducing cytochrome c by interacting with proteins of the Bcl-2 family (43, 44). Although, the mechanisms behind RGC death in glaucoma are not yet understood entirely, it is suggested, that the vast majority of RGCs undergo apoptosis, thereby underlining a potential role for this mitochondrial porin in the pathogenesis. Moreover, apoptosis triggered by various mechanisms can also be observed in the glaucomatous TM (45). VDAC2 was also found to be upregulated in glaucomatous rat RGCs (46), strongly demonstrating the role of apoptosis in RGC death. The deregulation of VDAC2 is a possible trigger for the onset of autoimmunity, hence the elevation of VDAC2 antibodies might be the result of the overexpression of this protein, as well as apoptotic events (47, 48). Antibodies to VDAC can also be found in sera of autistic children and have shown to induce apoptosis in human neuroblastoma cells (49), suggesting that the presence of these autoantibodies could not only be a mere expression of the pathological changes, but also enforces their progression in a synergetic manner.
Caldesmon, the gene product of CALD1, acts as a modulator of the actomyosin network by interacting with actin and cadherin, involved in cell-cell and cell-matrix adhesions. It regulates the cell contractility in a Ca2+–dependent manner. CALD1 overexpression in TM cells leads to actin cytoskeleton reorganization and in high abundance to disruption of adherens junctions (50). These molecular changes cause a relaxation of the tissue and thereby an increase of TM outflow facility. Therefore, CALD1 has been proposed for gene therapy of glaucoma (50, 51). Reorganization of the actin cytoskeleton has been observed in glaucomatous TM (5, 6) leading to increased tissue rigidity and failure to actively regulate IOP. Thus, we hypothesize that a participation of CALD1 deregulation in these processes cannot be ruled out. Pathologic changes in CALD1 expression, incomplete protein folding or post-translational modification could induce autoimmunity to this antigen. However, the effects and the origin of the identified CALD1 autoantibodies remain elusive and need to be addressed in further studies.
PGAM1 encodes the protein phosphoglycerate mutase 1 and is involved in the glycolytic pathway. Here it acts as an enzyme catalyzing the reaction from 3-phosphoglycerate to 2-phosphoglycerate (52). Autoantibodies to PGAM1 have been found increased in multiple sclerosis and neuromyelitis optica and have been suggested as marker for neuroinflammatory diseases (53, 54). Inflammatory processes are also prevalent in glaucoma as shown in experimental glaucoma models and in clinical studies, as reviewed by Russo et al. (55) and Soto et al. (56). This leads to the hypothesis, that PGAM1 autoimmunity can be triggered by neuroinflammatory conditions also appearing in glaucoma pathogenesis.
Levels of HSPD1 and VIM antibodies have already been described to be altered in glaucomatous diseases. Antibodies against the 60 kDa heat shock protein, encoded by HSPD1, were amongst the first to be detected in connection with glaucoma (12, 13) and are consistently increased throughout different study populations (57). The results obtained in the present study further confirm these findings. The increased VIM antibody levels detected in the present study however, are inconsistent with an earlier study from 2008 (16), in which antibody levels against optic nerve antigens were found to be downregulated in POAG and normal tension glaucoma using western blot analysis.
Overall, training of ANNs using a 5-biomarker-panel of the three new biomarker candidates with HSPD1 and VIM yielded a test that was able to classify POAG from CTRL with 81% sensitivity at 93% specificity and an AUROCC of 0.875.
The findings of this study are a further step to the development of a glaucoma rapid test that will identify early stage POAG showing only minor clinical signs. This would allow diagnostic testing not only for trained glaucoma specialists and would therefore be suitable for general health examinations. This can promote an early detection of the disease and allow an earlier start of treatment, thereby preventing glaucoma progression and preserve patients from severe vision loss. Autoantibodies as serological markers are accessible using minimal invasive methods and therefor provide a promising approach to enhance diagnostics.
Although the alteration of autoantibody levels to several ocular antigens in glaucoma has also been shown in different other studies (9–16, 58), it remains elusive, whether they are causative for pathological changes or just a byproduct that arises from them. Some studies provide evidence that endogenous antibodies can enter living cells and even promote or protect from apoptosis (59–61). Also, accumulation of IgG in the TM has been shown (62) and antibody levels in the aqueous humor are widely consistent with serum levels (38). The specific effects of autoantibodies to this tissue however, have not yet been analyzed. The hypothesis of the detected autoantibodies being an epiphenomenon seems to be more obvious. The TM in POAG suffers from a loss in cellularity (63) but the mechanisms of cell loss have not been clarified conclusively. Besides autophagy and necrosis, apoptosis has been discussed to induce cell death in glaucomatous TM (64, 65). An increased number of apoptotic and (postapoptotic) necrotic events can be a trigger for the emergence of autoantibodies to intracellular proteins (48). The cleavage of cellular components during apoptosis can even lead to the generation of neoepitopes (66). Furthermore, disease related post-translational modifications of the proteins can be an additional trigger for the occurrence of highly specific autoantibodies (67). In this case, the autoantibodies are an epiphenomenon of the damage of the tissue and/or induced by related modifications of the antigen. Both possibilities are supported by multiple circumstantial evidences and the concluding proof, of which mechanism is applicable in POAG remains a task for future studies. But regardless of their origin or effect, autoantibodies may serve as valuable disease biomarkers, as has also been demonstrated in other neurodegenerative diseases as Parkinson's disease (68) or Alzheimer's disease (69, 70). However, an important task for future evaluation studies to improve the reliability of the identified biomarkers is their investigation in other chronic and acute diseases. Also, it needs to be defined if they have a role in the natural autoantibody repertoire to gain further insights into their function in health and disease.
Conclusion
With VDAC2, PGAM1, and CALD1, new autoantibodies have been identified in association with POAG by the application of immunoproteomic methods. A combination of these and former known autoantibodies have shown to be suitable biomarker candidates for the diagnosis of POAG, even in early disease stages. The application of advanced bioinformatic analysis using artificial neural networks improves the value of these biomarkers by building models based on a panel of five candidate biomarkers. Applied in a rapid test, available not only to glaucoma specialists, they could help to promote early POAG detection and reduce the probability of severe vision loss by timely onset of treatment. To this end however, the evaluation of test results in larger, more heterogeneous study populations is necessary. Likewise, the search for even better biomarkers and biomarker combinations needs to continue, to enable the development of reliable rapid test immunoassays as a new standard tool in glaucoma diagnostics.
Data Availability
The MS dataset is publicly available at the PRIDE database (https://www.ebi.ac.uk/pride/archive/) with the identifier PXD011752.
Author Contributions
VB planned the experimental design of this study, performed SERPA and microarray analysis, interpreted the data, and wrote the manuscript. NaP performed mass spectrometric analysis. FG and NaP critically revised the manuscript. FG and NoP contributed to conception of the study and provided resources.
Funding
Supported by the German Federal Ministry of Education and Research (Bundesministerium für Bildung und Forschung); KMU-innovativ: Medizintechnik (FKZ: 13GW0193B).
Conflict of Interest Statement
The authors declare that the research was conducted in the absence of any commercial or financial relationships that could be construed as a potential conflict of interest.
Acknowledgments
The authors would like to thank Britta Haberkamp and Katharina Träger for excellent technical assistance.
Supplementary Material
The Supplementary Material for this article can be found online at: https://www.frontiersin.org/articles/10.3389/fimmu.2019.00381/full#supplementary-material
Abbreviations
ANN, artificial neural network; AUROCC, area under ROC curve; IOP, intraocular pressure; MS, mass spectrometry; MLP, multilayer perceptron; POAG, primary open angle glaucoma; POCD, point-of-care device; RGC, retinal ganglion cells; ROC, receiver operator characteristic; SERPA, serological proteome analysis; TM, trabecular meshwork.
References
1. Rudnicka AR, Mt-Isa S, Owen CG, Cook DG, Ashby D. Variations in primary open-angle glaucoma prevalence by age, gender, and race: a Bayesian meta-analysis. Invest Ophthalmol Vis Sci. (2006) 47:4254–61. doi: 10.1167/iovs.06-0299
2. Tham YC, Li X, Wong TY, Quigley HA, Aung T, Cheng CY. Global prevalence of glaucoma and projections of glaucoma burden through 2040: a systematic review and meta-analysis. Ophthalmology. (2014) 121:2081–90. doi: 10.1016/j.ophtha.2014.05.013
3. Pfeiffer N. [Results of the “Ocular hypertension treatment study”]. Der Ophthalmol. (2005) 102:230–4. doi: 10.1007/s00347-004-1150-x
4. Yang YF, Sun YY, Acott TS, Keller KE. Effects of induction and inhibition of matrix cross-linking on remodeling of the aqueous outflow resistance by ocular trabecular meshwork cells. Sci Rep. (2016) 6:30505. doi: 10.1038/srep30505
5. Montecchi-Palmer M, Bermudez JY, Webber HC, Patel GC, Clark AF, Mao W. TGFbeta2 induces the formation of cross-linked actin networks (CLANs) in human trabecular meshwork cells through the smad and non-smad dependent pathways. Invest Ophthalmol Vis. Sci. (2017) 58:1288–95. doi: 10.1167/iovs.16-19672
6. Junglas B, Kuespert S, Seleem AA, Struller T, Ullmann S, Bösl M, et al. Connective tissue growth factor causes glaucoma by modifying the actin cytoskeleton of the trabecular meshwork. Am J Pathol. (2012) 180:2386–403. doi: 10.1016/j.ajpath.2012.02.030
7. Guo L, Moss SE, Alexander RA, Ali RR, Fitzke FW, Cordeiro MF. Retinal ganglion cell apoptosis in glaucoma is related to intraocular pressure and IOP-induced effects on extracellular matrix. Invest Ophthalmol Vis Sci. (2005) 46:175–82. doi: 10.1167/iovs.04-0832
8. Kerrigan-Baumrind LA, Quigley HA, Pease ME, Kerrigan DF, Mitchell RS. Number of ganglion cells in glaucoma eyes compared with threshold visual field tests in the same persons. Invest Ophthalmol Vis Sci. (2000) 41:741–8. Available online at: https://iovs.arvojournals.org/article.aspx?articleid=2199893
9. Grus FH, Joachim SC, Hoffmann EM, Pfeiffer N. Complex autoantibody repertoires in patients with glaucoma. Mol Vis. (2004) 10:132–7. Available online at: http://www.molvis.org/molvis/v10/a17/
10. Grus FH, Joachim SC, Bruns K, Lackner KJ, Pfeiffer N, Wax MB. Serum autoantibodies to alpha-fodrin are present in glaucoma patients from Germany and the United States. Invest Ophthalmol Vis Sci. (2006) 47:968–76. doi: 10.1167/iovs.05-0685
11. Joachim SC, Bruns K, Lackner KJ, Pfeiffer N, Grus FH. Antibodies to alpha B-crystallin, vimentin, and heat shock protein 70 in aqueous humor of patients with normal tension glaucoma and IgG antibody patterns against retinal antigen in aqueous humor. Curr Eye Res. (2007) 32:501–9. doi: 10.1080/02713680701375183
12. Wax MB, Barrett DA, Pestronk A. Increased incidence of paraproteinemia and autoantibodies in patients with normal-pressure glaucoma. Am J Ophthalmol. (1994) 117:561–8. doi: 10.1016/S0002-9394(14)70059-5
13. Wax MB, Tezel G, Saito I, Gupta RS, Harley JB, Li Z, et al. Anti-Ro/SS-A positivity and heat shock protein antibodies in patients with normal-pressure glaucoma. Am J Ophthalmol. (1998) 125:145–57. doi: 10.1016/S0002-9394(99)80084-1
14. Tezel G, Seigel GM, Wax MB. Autoantibodies to small heat shock proteins in glaucoma. Invest Ophthalmol Vis Sci. (1998) 39:2277–87.
15. Maruyama I, Ohguro H, Ikeda Y. Retinal ganglion cells recognized by serum autoantibody against gamma-enolase found in glaucoma patients. Invest Ophthalmol Vis Sci. (2000) 41:1657–65. Available online at: https://iovs.arvojournals.org/article.aspx?articleid=2123542
16. Joachim SC, Reichelt J, Berneiser S, Pfeiffer N, Grus FH. Sera of glaucoma patients show autoantibodies against myelin basic protein and complex autoantibody profiles against human optic nerve antigens. Graefe Arch Clin Exp Ophthalmol. (2008) 246:573–80. doi: 10.1007/s00417-007-0737-8
17. Shoenfeld Y, Toubi E. Protective autoantibodies: role in homeostasis, clinical importance, and therapeutic potential. Arthritis Rheumat. (2005) 52:2599–606. doi: 10.1002/art.21252
18. Massa O, Alessio M, Russo L, Nardo G, Bonetto V, Bertuzzi F, et al. Serological Proteome Analysis (SERPA) as a tool for the identification of new candidate autoantigens in type 1 diabetes. J Proteomics. (2013) 82:263–73. doi: 10.1016/j.jprot.2013.02.030
19. Almeras L, Lefranc D, Drobecq H, de Seze J, Dubucquoi S, Vermersch P, et al. New antigenic candidates in multiple sclerosis: identification by serological proteome analysis. Proteomics. (2004) 4:2184–94. doi: 10.1002/pmic.200300732
20. Lin LH, Xu YW, Huang LS, Hong CQ, Zhai TT, Liao LD, et al. Serum proteomic-based analysis identifying autoantibodies against PRDX2 and PRDX3 as potential diagnostic biomarkers in nasopharyngeal carcinoma. Clin Proteomics. (2017) 14:6. doi: 10.1186/s12014-017-9141-5
21. Mustafa MZ, Nguyen VH, Le Naour F, De Martin E, Beleoken E, Guettier C, et al. Autoantibody signatures defined by serological proteome analysis in sera from patients with cholangiocarcinoma. J Transl Med. (2016) 14:17. doi: 10.1186/s12967-015-0751-2
22. Klade CS, Voss T, Krystek E, Ahorn H, Zatloukal K, Pummer K, et al. Identification of tumor antigens in renal cell carcinoma by serological proteome analysis. Proteomics. (2001) 1:890–8. doi: 10.1002/1615-9861(200107)1:7<890::AID-PROT890>3.0.CO;2-Z
23. Tu S, Jiang HW, Liu CX, Zhou SM, Tao SC. Protein microarrays for studies of drug mechanisms and biomarker discovery in the era of systems biology. Curr Pharmaceut Des. (2014) 20:49–55. doi: 10.2174/138161282001140113123707
24. Papp K, Prechl J. The use of antigen microarrays in antibody profiling. Methods Mol Biol. (2012) 815:175–85. doi: 10.1007/978-1-61779-424-7_14
25. Ioannidis JPA, Bossuyt PMM. Waste, Leaks, and Failures in the Biomarker Pipeline. Clin Chem. (2017) 63:963–72. doi: 10.1373/clinchem.2016.254649
26. Blanco AA, Bagnasco L, Bagnis A, Barton K, Baudouin C, Bengtsson B, et al. European Glaucoma Society Terminology and Guidelines for Glaucoma, 4th Edition—Chapter 2: classification and terminology supported by the EGS Foundation: Part 1: foreword; introduction; glossary; Chapter 2 classification and terminology. Br J Ophthalmol. (2017) 101:73–127. doi: 10.1136/bjophthalmol-2016-EGSguideline.002
27. Fernandez-Bueno I, Pastor JC, Gayoso MJ, Alcalde I, Garcia MT. Muller and macrophage-like cell interactions in an organotypic culture of porcine neuroretina. Mol Vis. (2008) 14:2148–56. Available online at: http://www.molvis.org/molvis/v14/a252/
28. Ruiz-Ederra J, García M, Hernández M, Urcola H, Hernández-Barbáchano E, Araiz J, et al. The pig eye as a novel model of glaucoma. Exp Eye Res. (2005) 81:561–9. doi: 10.1016/j.exer.2005.03.014
29. Bachmann B, Birke M, Kook D, Eichhorn M, Lütjen-Drecoll E. Ultrastructural and biochemical evaluation of the porcine anterior chamber perfusion model. Invest Ophthalmol Vis Sci. (2006) 47:2011–20. doi: 10.1167/iovs.05-1393
30. Perumal N, Funke S, Pfeiffer N, Grus FH. Characterization of lacrimal proline-rich protein 4 (PRR4) in human tear proteome. Proteomics. (2014) 14:1698–709. doi: 10.1002/pmic.201300039
31. Towbin H, Staehelin T, Gordon J. Electrophoretic transfer of proteins from polyacrylamide gels to nitrocellulose sheets: procedure and some applications. Proc Nat Acad Sci USA. (1979) 76:4350–4. doi: 10.1073/pnas.76.9.4350
32. Shevchenko A, Tomas H, Havlis J, Olsen JV, Mann M. In-gel digestion for mass spectrometric characterization of proteins and proteomes. Nat Protocols. (2006) 1:2856–60. doi: 10.1038/nprot.2006.468
33. Perumal N, Funke S, Wolters D, Pfeiffer N, Grus FH. Characterization of human reflex tear proteome reveals high expression of lacrimal proline-rich protein 4 (PRR4). Proteomics. (2015) 15:3370–81. doi: 10.1002/pmic.201400239
34. Funke S, Azimi D, Wolters D, Grus FH, Pfeiffer N. Longitudinal analysis of taurine induced effects on the tear proteome of contact lens wearers and dry eye patients using a RP-RP-Capillary-HPLC-MALDI TOF/TOF MS approach. J Proteomics. (2012) 75:3177–90. doi: 10.1016/j.jprot.2012.03.018
35. Olsen JV, de Godoy LM, Li G, Macek B, Mortensen P, Pesch R, et al. Parts per million mass accuracy on an Orbitrap mass spectrometer via lock mass injection into a C-trap. Mol Cell Proteomics. (2005) 4:2010–21. doi: 10.1074/mcp.T500030-MCP200
36. Vizcaino JA, Csordas A, del-Toro N, Dianes JA, Griss J, Lavidas I, et al. 2016 update of the PRIDE database and its related tools. Nucleic Acids Res. (2016) 44:D447–56. doi: 10.1093/nar/gkv1145
37. Joachim SC, Wuenschig D, Pfeiffer N, Grus FH. IgG antibody patterns in aqueous humor of patients with primary open angle glaucoma and pseudoexfoliation glaucoma. Mol Vis. (2007) 13:1573–9. Available online at: http://www.molvis.org/molvis/v13/a175/
38. Boehm N, Wolters D, Thiel U, Lossbrand U, Wiegel N, Pfeiffer N, et al. New insights into autoantibody profiles from immune privileged sites in the eye: a glaucoma study. Brain Behav Immun. (2012) 26:96–102. doi: 10.1016/j.bbi.2011.07.241
39. Zhong L, Ge K, Zu JC, Zhao LH, Shen WK, Wang JF, et al. Autoantibodies as potential biomarkers for breast cancer. Breast Cancer Res. (2008) 10:R40. doi: 10.1186/bcr2091
40. Chapman C, Murray A, Chakrabarti J, Thorpe A, Woolston C, Sahin U, et al. Autoantibodies in breast cancer: their use as an aid to early diagnosis. Ann Oncol. (2007) 18:868–73. doi: 10.1093/annonc/mdm007
41. Qiu J, Choi G, Li L, Wang H, Pitteri SJ, Pereira-Faca SR, et al. Occurrence of autoantibodies to annexin I, 14-3-3 theta and LAMR1 in prediagnostic lung cancer sera. J Clin Oncol. (2008) 26:5060–6. doi: 10.1200/JCO.2008.16.2388
42. Benz R. Porin from bacterial and mitochondrial outer membranes. CRC Crit Rev Biochem. (1985) 19:145–90. doi: 10.3109/10409238509082542
43. Youle RJ, Strasser A. The BCL-2 protein family: opposing activities that mediate cell death. Nat Rev Mol Cell Biol. (2008) 9:47–59. doi: 10.1038/nrm2308
44. Plötz M, Gillissen B, Hossini AM, Daniel PT, Eberle J. Disruption of the VDAC2-Bak interaction by Bcl-x(S) mediates efficient induction of apoptosis in melanoma cells. Cell Death Diff. (2012) 19, 1928–38. doi: 10.1038/cdd.2012.71
45. Saccà SC, Pulliero A, Izzotti A. The dysfunction of the trabecular meshwork during glaucoma course. J Cell Physiol. (2015) 230:510–25. doi: 10.1002/jcp.24826
46. Crabb JW, Yuan X, Dvoriantchikova G, Ivanov D, Crabb JS, Shestopalov VI. Preliminary quantitative proteomic characterization of glaucomatous rat retinal ganglion cells. Exp Eye Res. (2010) 91:107–10. doi: 10.1016/j.exer.2010.04.004
47. Anderson KS, LaBaer J. The sentinel within: exploiting the immune system for cancer biomarkers. J Proteome Res. (2005) 4:1123–33. doi: 10.1021/pr0500814
48. Elkon K, Casali P. Nature and functions of autoantibodies. Nat Clin Pract. Rheumatol. (2008) 4:491–8. doi: 10.1038/ncprheum0895
49. Gonzalez-Gronow M, Cuchacovich M, Francos R, Cuchacovich S, Fernandez Mdel P, Blanco A, et al. Antibodies against the voltage-dependent anion channel (VDAC) and its protective ligand hexokinase-I in children with autism. J Neuroimmunol. (2010) 227:153–61. doi: 10.1016/j.jneuroim.2010.06.001
50. Grosheva I, Vittitow JL, Goichberg P, Gabelt BT, Kaufman PL, Borrás T, et al. Caldesmon effects on the actin cytoskeleton and cell adhesion in cultured HTM cells. Exp Eye Res. (2006) 82:945–58. doi: 10.1016/j.exer.2006.01.006
51. Gabelt BT, Hu Y, Vittitow JL, Rasmussen CR, Grosheva I, Bershadsky AD, et al. Caldesmon transgene expression disrupts focal adhesions in HTM cells and increases outflow facility in organ-cultured human and monkey anterior segments. Exp Eye Res. (2006) 82:935–44. doi: 10.1016/j.exer.2005.12.002
52. Fothergill-Gilmore LA, Watson HC. The phosphoglycerate mutases. Adv Enzymol Relat Areas Mol Biol. (1989) 62:227–313. doi: 10.1002/9780470123089.ch6
53. Kimura A, Sakurai T, Koumura A, Yamada M, Hayashi Y, Tanaka Y, et al. High prevalence of autoantibodies against phosphoglycerate mutase 1 in patients with autoimmune central nervous system diseases. J Neuroimmunol. (2010) 219:105–8. doi: 10.1016/j.jneuroim.2009.11.014
54. Sakurai T, Kimura A, Yamada M, Koumura A, Hayashi Y, Tanaka Y, et al. Identification of antibodies as biological markers in serum from multiple sclerosis patients by immunoproteomic approach. J Neuroimmunol. (2011) 233:175–80. doi: 10.1016/j.jneuroim.2010.11.003
55. Russo R, Varano GP, Adornetto A, Nucci C, Corasaniti MT, Bagetta G, et al. Retinal ganglion cell death in glaucoma: exploring the role of neuroinflammation. Eur J Pharmacol. (2016) 787:134–42. doi: 10.1016/j.ejphar.2016.03.064
56. Soto I, Howell GR. The complex role of neuroinflammation in glaucoma. Cold Spring Harbor Perspect Med. (2014) 4:a017269. doi: 10.1101/cshperspect.a017269
57. Wax MB, Tezel G, Kawase K, Kitazawa Y. Serum autoantibodies to heat shock proteins in glaucoma patients from Japan and the United States. Ophthalmology. (2001) 108:296–302. doi: 10.1016/S0161-6420(00)00525-X
58. Joachim SC, Pfeiffer N, Grus FH. Autoantibodies in patients with glaucoma: a comparison of IgG serum antibodies against retinal, optic nerve, and optic nerve head antigens. Graefe Arch Clin Exp Ophthalmol. (2005) 243:817–23. doi: 10.1007/s00417-004-1094-5
59. Bell K, Wilding C, Funke S, Pfeiffer N, Grus FH. Protective effect of 14-3-3 antibodies on stressed neuroretinal cells via the mitochondrial apoptosis pathway. BMC Ophthalmol. (2015) 15:64. doi: 10.1186/s12886-015-0044-9
60. Tezel G, Wax MB. The mechanisms of hsp27 antibody-mediated apoptosis in retinal neuronal cells. J Neurosci. (2000) 20:3552–62. doi: 10.1523/JNEUROSCI.20-10-03552.2000
61. Yanase K, Smith RM, Puccetti A, Jarett L, Madaio MP. Receptor-mediated cellular entry of nuclear localizing anti-DNA antibodies via myosin 1. J Clin Invest. (1997) 100:25–31. doi: 10.1172/JCI119517
62. Becker B, Keates EU, Coleman SL. Gamma-globulin in the trabecular meshwork of glaucomatous eyes. Arch Ophthalmol. (1962) 68:643–7. doi: 10.1001/archopht.1962.00960030647013
63. Alvarado J, Murphy C, Juster R. Trabecular meshwork cellularity in primary open-angle glaucoma and nonglaucomatous normals. Ophthalmology. (1984) 91:564–79. doi: 10.1016/S0161-6420(84)34248-8
64. Baleriola J, García-Feijoo J, Martínez-de-la-Casa JM, Fernández-Cruz A, de la Rosa EJ, Fernández-Durango R. Apoptosis in the trabecular meshwork of glaucomatous patients. Mol Vis. (2008) 14:1513–6. Available online at: http://www.molvis.org/molvis/v14/a180/
65. Aktas Z, Karaca EE, Gonul II, Hasanreisoglu M, Onol M. Apoptosis in the iris and trabecular meshwork of medically treated and untreated primary open angle glaucoma patients. Int J Ophthalmol. (2013) 6:827–30. doi: 10.3980/j.issn.2222-3959.2013.06.15
66. Jakob S, Corazza N, Diamantis E, Kappeler A, Brunner T. Detection of apoptosis in vivo using antibodies against caspase-induced neo-epitopes. Methods. (2008) 44:255–61. doi: 10.1016/j.ymeth.2007.11.004
67. Anderton SM. Post-translational modifications of self-antigens: implications for autoimmunity. Curr Opin Immunol. (2004) 16:753–8. doi: 10.1016/j.coi.2004.09.001
68. DeMarshall CA, Han M, Nagele EP, Sarkar A, Acharya NK, Godsey G, et al. Potential utility of autoantibodies as blood-based biomarkers for early detection and diagnosis of Parkinson's disease. Immunol Lett. (2015) 168:80–8. doi: 10.1016/j.imlet.2015.09.010
69. Giil LM, Kristoffersen EK, Vedeler CA, Aarsland D, Nordrehaug JE, Winblad B, et al. Autoantibodies toward the angiotensin 2 type 1 receptor: a novel autoantibody in Alzheimer's disease. J Alzheimer Dis. (2015) 47:523–9. doi: 10.3233/JAD-150053
Keywords: autoantibodies, biomarker, glaucoma, immunoproteomics, microarray, trabecular meshwork
Citation: Beutgen VM, Perumal N, Pfeiffer N and Grus FH (2019) Autoantibody Biomarker Discovery in Primary Open Angle Glaucoma Using Serological Proteome Analysis (SERPA). Front. Immunol. 10:381. doi: 10.3389/fimmu.2019.00381
Received: 20 November 2018; Accepted: 14 February 2019;
Published: 07 March 2019.
Edited by:
Robert Weissert, University of Regensburg, GermanyReviewed by:
Stephanie C. Joachim, Ruhr-Universität Bochum, GermanyReinhild Klein, University of Tübingen, Germany
Copyright © 2019 Beutgen, Perumal, Pfeiffer and Grus. This is an open-access article distributed under the terms of the Creative Commons Attribution License (CC BY). The use, distribution or reproduction in other forums is permitted, provided the original author(s) and the copyright owner(s) are credited and that the original publication in this journal is cited, in accordance with accepted academic practice. No use, distribution or reproduction is permitted which does not comply with these terms.
*Correspondence: Franz H. Grus, Z3J1c0BleWUtcmVzZWFyY2gub3Jn