 Julio E. Molineros1†
 Bhupinder Singh1†
 Chikashi Terao2,3Yukinori Okada4Jakub Kaplan1
 Barbara McDaniel1
 Shuji Akizuki3
 Celi Sun1
 Carol F. Webb5
 Loren L. Looger6
 Swapan K. Nath1*
- 1Arthritis and Clinical Immunology Research Program, Oklahoma Medical Research Foundation, Oklahoma City, OK, United States
- 2Laboratory for Statistical Analysis, RIKEN Center for Integrative Medical Sciences, Yokohama, Japan
- 3Department of Rheumatology and Clinical Immunology, Graduate School of Medicine, Kyoto University, Kyoto, Japan
- 4Department of Statistical Genetics, Osaka University Graduate School of Medicine, Osaka, Japan
- 5Departments of Medicine, Microbiology and Immunology, University of Oklahoma Health Sciences Center, Oklahoma, OK, United States
- 6Howard Hughes Medical Institute, Janelia Research Campus, Ashburn, VA, United States
Systemic lupus erythematosus (SLE) is an autoimmune disease with a strong genetic component. We recently identified a novel SLE susceptibility locus near RASGRP1, which governs the ERK/MAPK kinase cascade and B-/T-cell differentiation and development. However, precise causal RASGRP1 functional variant(s) and their mechanisms of action in SLE pathogenesis remain undefined. Our goal was to fine-map this locus, prioritize genetic variants likely to be functional, experimentally validate their biochemical mechanisms, and determine the contribution of these SNPs to SLE risk. We performed a meta-analysis across six Asian and European cohorts (9,529 cases; 22,462 controls), followed by in silico bioinformatic and epigenetic analyses to prioritize potentially functional SNPs. We experimentally validated the functional significance and mechanism of action of three SNPs in cultured T-cells. Meta-analysis identified 18 genome-wide significant (p < 5 × 10⁻⁸) SNPs, mostly concentrated in two haplotype blocks, one intronic and the other intergenic. Epigenetic fine-mapping, allelic, eQTL, and imbalance analyses predicted three transcriptional regulatory regions with four SNPs (rs7170151, rs11631591-rs7173565, and rs9920715) prioritized for functional validation. Luciferase reporter assays indicated significant allele-specific enhancer activity for intronic rs7170151 and rs11631591-rs7173565 in T-lymphoid (Jurkat) cells, but not in HEK293 cells. Following up with EMSA, mass spectrometry, and ChIP-qPCR, we detected allele-dependent interactions between heterogeneous nuclear ribonucleoprotein K (hnRNP-K) and rs11631591. Furthermore, inhibition of hnRNP-K in Jurkat and primary T-cells downregulated RASGRP1 and ERK/MAPK signaling. Comprehensive association, bioinformatics, and epigenetic analyses yielded putative functional variants of RASGRP1, which were experimentally validated. Notably, intronic variant (rs11631591) is located in a cell type-specific enhancer sequence, where its risk allele binds to the hnRNP-K protein and modulates RASGRP1 expression in Jurkat and primary T-cells. As risk allele dosage of rs11631591 correlates with increased RASGRP1 expression and ERK activity, we suggest that this SNP may underlie SLE risk at this locus.
Introduction
Systemic lupus erythematosus (SLE) is a complex autoimmune disease that disproportionately affects people of Asian, African, and Hispanic ethnicities and women, in particular, with higher incidence and disease severity (1). Much of SLE etiology remains mysterious. It has been proposed that complex interactions amongst numerous genes and their products with pathogens and other environmental factors promotes dysregulation of both the innate and adaptive immune responses in SLE. Over 80 SLE susceptibility loci have been identified so far across multiple ethnic groups by genome-wide association studies (GWAS) and candidate gene studies (2, 3). However, the precise underlying variants and functional mechanisms associated with disease are largely unidentified for the vast majority of these SLE-associated signals. Understanding SLE pathogenesis requires identification of true causal variants and the target genes and mechanisms by which they contribute to disease.
Previously, we reported a novel SLE susceptibility signal near the RAS guanyl-releasing protein 1 (RASGRP1) in Asians (4). We identified several associated variants, the most significant being an intergenic variant (rs12900339) between RASGRP1 and C15orf53 (4). However, the actual predisposing variants, target genes, and underlying mechanisms of action for this region are largely unknown. RASGRP1 belongs to a family of RAS guanyl nucleotide-releasing proteins (RASGRPs) comprising four members (RASGRP1 through RASGRP4), all with a diacylglycerol (DAG)-binding C1 catalytic domain. Upon antigen stimulation, DAG binding and phospholipase C (PLC) signaling drive RASGRPs to the membrane, where they play important roles in RAS activation (5, 6). RASGRP1, originally cloned from the brain (7), was later found highly expressed in T-lymphocytes (8); small amounts of RASGRP1 expression can also occur in B-lymphocytes, neutrophils, mast cells, and natural killer cells (9–11). RASGRP1 has been shown to be involved in B-cell development, activation and tolerance, in both mice and humans (12, 13). RASGRP1−/− mice have been reported for marked deficiency in thymocyte and lymphocyte development, which was associated with impaired proliferation in response to TCR stimulation (14). Deficiency in RASGRP1 in mice has been associated with CD4+ and CD8+ T cell lymphopenia (8). However, humans deficient in RASGRP1 show a decrease in CD4+T concurrent with a relative increase in CD8+T cells (15). RASGRP1 inhibition impairs T-cell expansion and increases susceptibility to Epstein-Barr virus infection, as well as suppressing proliferation of activated T-cells occurring in autoimmune conditions (16). A recent study reported a heterozygous mutation in RASGRP1 correlated with autoimmune lymphoproliferative syndrome (ALPS)-like disease (17). RASGRP1 expression in T-cells also correlated negatively with rheumatoid arthritis disease activity (18). Dysregulated expression of RASGRP1 has been observed in human SLE. The ratio of normal RASGRP1 isoforms to isoforms missing exon-11 could be linked to defective poly[ADP-ribose] polymerase 1 (PARP1) expression and reduced lymphocyte survival in SLE patients (19, 20). Aberrant splice variants accumulate in SLE patients and adversely affect T-cell function (21). There are conflicting reports of the effect of RASGRP1 on ERK signaling. On one hand, deficiency in RASGRP1 expression reportedly decreases ERK phosphorylation in B- and T-cells (15). Hydralazine, a drug that causes drug-induced lupus erythematosus, is reported to inhibit ERK signaling, inducing autoimmunity and the production of anti-dsDNA autoantibodies in mice (22). However, some reports found significantly higher levels of pERK and pJNK in SLE patients with active disease vs. controls and inactive SLE patients (23–25), contradicting earlier reports. In spite of these conflicting reports, the consensus is that RASGRP1 dysfunction is mechanistically associated with autoimmune phenotypes including SLE.
Here, we fine-mapped an SLE locus near RASGRP1 that we previously identified (4). Using trans-ethnic meta-analysis across six Asian and European cohorts followed by bioinformatic analyses and experimental validation, we identified potential SLE predisposing variants and defined mechanisms by which these functional variants contribute to SLE pathogenicity.
Materials and Methods
Patients and Data
We used all associated SNP data at this locus from six cohorts reported previously (Table 1). We began with our published Asian cohort report [see Supplementary Table 5 in Sun et al. (4)] and augmented this with two publicly available sets of GWAS summary statistics (26, 27) and a partially published Japanese cohort (28). Our original report contained three Asian cohorts (3AS: Korean, Han Chinese, and Malaya Chinese). Japanese samples included samples (456 cases and 1,102 controls) collected under support of the Autoimmune Disease Study Group of Research in Intractable Diseases, Japanese Ministry of Health, Labor and Welfare, and the BioBank Japan Project (28), and added samples obtained at Kyoto University, Japan. SLE classification followed the American College of Rheumatology criteria (29). All sample collections were approved by the Institutional Review Board of the Oklahoma Medical Research Foundation as well as by the collaborating institutions.
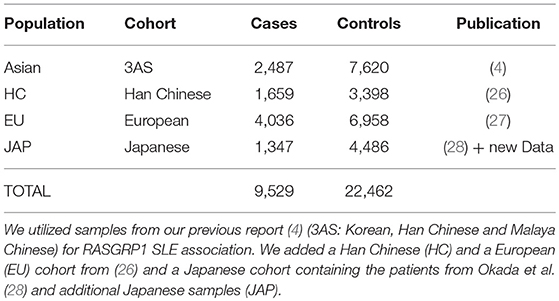
Table 1. Cohorts used in this study.
Quality Control
SNP quality control for our initial Asian cohort has been described elsewhere (4). Quality control for European, Han Chinese 2, and Japanese samples was described in the original publications (26–28). All SNPs in the study were in Hardy-Weinberg equilibrium (P > 1 × 10⁻⁶) and had minor allele frequency >0.5%. Genotypic missingness was <10%. In order to match risk alleles between cohorts, we compared their allele frequencies to the parent populations from the 1,000 Genomes Project. We used the SNP reference dbSNP142 as the SNP-naming convention in common for all variants. SNP imputation for all cohorts was described in their original publications. For this study, SNPs with r2 and imputation quality information <0.7 were dropped.
Study Design
In order to identify RASGRP1 functional variants and their mechanisms of action, our analysis followed the workflow presented in Figure 1. We first extracted all summary GWAS information in and around RASGRP1 (118 SNPs) from Supplementary Table 5 in our previous study of Asian SLE (4). We combined these results with a European (27), an Asian (26), and a partially published Japanese cohort (28), to perform meta-analysis. SNPs that passed the genome-wide significant association threshold (p = 5 × 10⁻⁸) were further annotated with functional information. A series of bioinformatics and epigenomic analyses was conducted for each of the candidate SNPs including their effects on gene expression (expression quantitative trait loci, eQTLs), transcription factor binding, promoter/enhancer activities, and chromatin interaction sites. Together, we prioritized and nominated SNPs with stronger association signals and with higher annotated likelihood of being functional (Supplementary Tables 1, 2). Finally, we experimentally validated predicted functions of the nominated SNPs in Jurkat and HEK293 cell lines. Following SNP prioritization, we performed electrophoretic mobility shift assays (EMSAs), followed by mass spectrometry, chromatin immuno-precipitation quantitative PCR (ChIP-qPCR), and inhibition-based expression assays.

Figure 1. Framework of study design. Our study followed our bioinformatics-prioritized potential functional SNPs with laboratory validation along many different dimensions.
Association Analysis and Trans-Ethnic Meta-Analysis
Association analysis for all cohorts was performed using PLINK (30) and SNPTEST. Meta-analysis for all cohorts was performed in METAL (31) using cohort sample size correction and standard error correction to estimate the 95% confidence interval for odds ratios. Heterogeneity of odds ratios was estimated and informed the use of Pmeta values in the study. Variants with Pmeta < 5 × 10⁻³ were selected for further study.
Bioinformatic Analysis
Given that candidate SNPs were located in non-coding regions of the genome, we performed a thorough epigenetic annotation of the variants. Initial annotation of epigenetic features was performed in Haploreg (32). Each SNP in the region was collocated with active and regulatory histone marks including H3K27ac, H3K4me1, and H3K4me3, and DNase hypersensitivity sites (DHS) in GM12878, and CD4+ and CD8+ T cells (Supplementary Figure 1). Histone modifications and DHS data were obtained from the ENCODE project (33) and the BLUEPRINT epigenome project (34).
SNP Prioritization
We used a prioritization algorithm to narrow down the large list of SNPs for further validation. Our strategy consisted of two Bayesian algorithms to score each SNP [3dSNP (35) and RegulomeDB (36)], as well as additional expression, epigenetic, and preferential allele-specific information about each SNP. First, we used the 3dSNP (35) tool to assign functional weights based on the presence of enhancers, promoters, experimentally determined (ChIP-seq) transcription factor binding sites (TFBSs), TFBS motif matching, evolutionary conservation, and presence of 3D chromatin interactions. We assigned a 3dSNP weight of 2 to SNPs >2 standard deviations above the mean, a weight of 1 for scores above the mean, and a weight of 0 for the rest. RegulomeDB (36) scores were also assigned for each candidate SNP and converted to an associated weight. Each functional category, i.e., eQTL, enhancer/super-enhancer, rSNP (37), capture Hi-C, TFBS, and allele-specific expression/binding, was assigned a weight of 1 if the SNP had this feature. Finally, we summed all weights for each SNP and nominated the top SNPs for further experimental validation.
Expression Quantitative Trait Loci (eQTLs)
All the candidate SNPs were annotated for the presence of eQTLs changing expression of RASGRP1 and its surrounding genes in multiple tissues. We used expression databases for whole blood (38, 39), immune cell lines (40), and multiple tissues (41) (GTEx Analysis Release V6p). In order to identify quantitative changes in methylation in blood cell lines, we used the WP10 database from the Blueprint epigenome project (42).
Transcription Factor Binding Sites (TFBSs)
In order to identify allele-specific effects on transcription factor binding (TFBSs), we used the motifBreakr (43) algorithm implemented in R, as well as the PERFECTOS-APE algorithm that identifies fold-changes in binding affinity of SNPs against HOCOMOCO10, HOMER, JASPER, Swiss Regulon, and HT-Selex motif databases. We selected only TFBSs that had at least 5-fold change in affinity.
Assessing SNP Effects on Enhancer/Promoter Sequences
We assessed whether each SNP was located within regulatory (enhancer/promoter) regions across multiple cell lines using active histone marks (H3K27ac, H3K4me1, and H3K4me3) collocation implemented in the 3dSNP application (35). Super-enhancers were annotated using the dbSuper (44), Prestige (45), and EnhancerAtlas (46) databases.
Chromatin Interactions
Chromatin looping was identified using capture Hi-C assays obtained from 3D Genome (47), 3DSNP (35) and CHiCP (48); as well as from Promoter-capture Hi-C (49–52) experiments.
Allele-Specific Binding
Candidate SNPs within the association peaks were further targeted to assess allele-specific binding (ASB) of histone marks H3K4me1 and H3K4me3 in and around them. ASB was calculated using seven heterozygous cell lines (GM10847, GM12890, GM18951, GM19239, GM19240, GM2610, and SNYDER). ASB was implemented in SNPhood (53).
Luciferase Reporter Assays
To test candidate SNP-containing regions for allele-specific enhancer activity, we cloned all three SNPs (rs1163159, rs7173565-rs7173565, and rs9920715) individually into the enhancer reporter plasmid pGL4.26[luc2/minP/Hygro] (Promega, USA). In brief, genomic DNA from the Coriell cell line having different genotypes for the SNP tested (obtained from NIGMS Human Genetic Cell Repository at the Coriell Institute for Medical Research) was amplified using specific primers containing KpnI and HindIII sites (Supplementary Table 3). These amplified PCR products surrounding rs11631591 (481 bp), rs7170151 (579 bp), and rs9920715 (455 bp) were digested with KpnI and HindIII restriction enzymes and ligated into the pGL4.26 plasmid. After cloning and transformation, the plasmids generated for each genotype were confirmed by direct Sanger DNA sequencing. To study cell type-dependence, we used two different cell types: human embryonic kidney HEK293 and T-lymphoid Jurkat cell lines. HEK293 cells were seeded in 24-well sterile plastic culture plates at a density of 1x10⁵ cells per well with complete growth medium. The cells were transfected with 500 ng of pGL4.26 (with or without insert) along with 50 ng Renilla plasmid as control vector to control for differences in transfection efficiency. LipofectAMINE 3000 (Invitrogen, USA) was used for transfection into HEK293 cells, according to the manufacturer's protocol. For Jurkat transfections, we used the Neon Transfection System (Thermo Fisher Scientific). A total of 5 × 10⁵ Jurkat cells was electroporated with a Neon Transfection System (Invitrogen) under the following conditions: voltage (1,050 V), width (30 ms), pulses (Two), 10-μl tip, and Buffer R. For transfection, we used 2 μg of each plasmid containing the insert with risk or non-risk allele, along with 50 ng Renilla plasmid. Firefly and Renilla luciferase activities were measured consecutively at 24 h after transfection using Dual-luciferase assays (Promega), according to the manufacturer's instructions. Luciferase activity was analyzed with Student's t-test implemented in GraphPad Prism7. Differences between relative luciferase activity levels were considered significant if Student's t-test P-value < 0.05.
Identification of DNA-Binding Proteins
Electrophoretic Mobility Shift Assays (EMSAs) and DNA Pulldown Assays
Jurkat cell lines were obtained from ATCC and maintained in RPMI 1640 medium with 2 mm L-glutamine, 100 μg/ml each of streptomycin and penicillin, and 10% fetal bovine serum at 37°C with 5% CO2. Cells were harvested at a density of 8 × 10⁵ cells/ml, and nuclear extracts were prepared using the NER nuclear extraction kit (Invitrogen) with complete protease inhibitors (Roche Diagnostics). Protein concentrations were measured using a BCA reagent. Biotinylated DNA sequence surrounding the candidate SNPs (rs7170151 and rs11631591) was prepared using a synthetic single-stranded DNA sequence (Integrated DNA Technologies, USA) (Supplementary Table 3). Biotinylated DNA sequence with a 5-bp deletion at the SNP region served as a control for the assay. Twenty-five pmol of each DNA product was bound to 1 mg Dynabeads® M-280 Streptavidin (Invitrogen, USA), as per the manufacturer's recommendations. Dynabeads M-280 Streptavidin (Dynal, Inc., Lake Success, NY, USA) were prepared by washing three times in phosphate-buffered saline (pH 7.4) containing 0.1% bovine serum albumin and two times with Tris-EDTA containing 1 M NaCl. Between each wash, beads were pulled down with a Dynal magnetic particle concentrator. Double-stranded, biotinylated oligonucleotides were added to the washed beads, and the mix was rotated for 20–30 min at 21 °C. Equal cpm of proteins translated in vitro were diluted to 1× with binding buffer and mixed with ~100 μg of Dynabeads containing 10 pmol of the individual oligonucleotide probe in a final volume of 250 μl. The mixture was rotated at room temperature for 20 min. Proteins bound to the beads were separated from unbound proteins by successive washes, three times with 0.5× binding buffer and once with 1× binding buffer. Higher stringency washes included two washes with 2× binding buffer. Beads and bound proteins were pulled down with a magnetic concentrator, suspended in 1× sample buffer, boiled for 5 min, and resolved on SDS-PAGE gels, followed by peptide mass fingerprint MALDI-MS analysis of single bands.
Mass Spectrometry Analysis
Mass spectrometry analysis was performed using a Thermo-Scientific LTQ-XL mass spectrometer coupled to an Eksigent splitless nanoflow HPLC system. Bands of interest were excised from the silver nitrate-stained Bis-Tris gel and de-stained with Farmer's reducer (50 mM sodium thiosulfate, 15 mM potassium ferricyanide). The proteins were reduced with dithiothreitol, alkylated with iodoacetamide, and digested with trypsin. Samples were injected onto a 10 cm × 75 mm inner diameter capillary column packed with Phenomenex Jupiter C18 reverse phase resin. The peptides were eluted into the mass spectrometer at a flow rate of 175 nl/min. The mass spectrometer was operated in a data-dependent mode acquiring one mass spectrum and four CID spectra per cycle. Data were analyzed by searching all acquired spectra against the human RefSeq databases using Mascot (Matrix Science Inc., Boston, MA, USA). Minimum identification criteria required two peptides with ion scores >50% and were verified by manual inspection. We verified the identity of the assayed proteins by Western blot.
Confirmation of Identified Protein by Western Blot
Mass spectrometry-identified proteins were confirmed by Western blot. Jurkat nuclear extracts after DNA pulldown assay were lysed in sample buffer [62.5 mM Tris·HCl (pH 6.8 at 25°C), 2% wt/vol SDS, 10% glycerol, 50 mM dithiothreitol, 0.01% wt/vol bromophenol blue]. Equal amounts of protein were loaded onto a 10% SDS-PAGE gel (GTX gel BioRad USA). After it resolved, samples were blotted to Nitrocellulose paper using the Trans-blot Turbo Transfer System (BioRad, USA). Membranes were blocked using LI-COR blocking buffer for 2 h and then incubated with primary antibody 1:1,000 dilution (hnRNP-K, Santa Cruz USA) at 4°C overnight, and with a donkey anti-mouse IR-Dye 800 (LI-COR, USA) secondary antibody for 1 h. The membrane was imaged with a LI-COR Odyssey using Auto-Scan. Background-subtracted signal intensity was quantified using Image Studio 4.0 software.
Chromatin Immuno-Precipitation (ChIP) Assay Followed by qPCR (ChiP-qPCR)
ChIP assays were performed using the MAGnify ChIP system (Life Technologies, NY), according to the manufacturer's protocol. Jurkat cells were fixed for 10 min with 1% formaldehyde to crosslink DNA-protein and protein-protein complexes. The cross-linking reaction was stopped using 1.25 M glycine for 5 min. The cells were lysed, sonicated to shear DNA, and sedimented. Then, their diluted supernatants were incubated with 5 μg hnRNP-K antibody. Ten percent of the diluted supernatants were saved as “input” for normalization. Several washing steps were followed by protein digestion using proteinase K. Reverse crosslinking was carried out at 65°C. DNA was subsequently purified and amplified by quantitative PCR on an SDS 7900 (Applied Biosystems) using specific primers. Because the Jurkat cell line is heterozygous for the SNPs rs11631591 and rs7170151, we performed Sanger DNA sequencing with the ChIP-eluted PCR product.
Isolation of CD3+ T-Cells From Human Blood
We used leukoreduction system chambers (LRS chambers) from human blood donors. LRS chambers were obtained from the Oklahoma Blood Institute (OK, USA) (Supplementary Table 12; Supplementary Figure 9). LRSCs were sterilized externally using 70% (v/v) ethanol and handled in a class 2 laminar flow cabinet. External tubing was cut, the chamber inverted over a 50 ml sterile centrifuge tube (Greiner Bio-One), and the contents allowed to drip through. The contents (usually 20 ml) were then diluted to 90 ml in RPMI medium. The peripheral blood mononuclear cells (PBMCs) were isolated by carefully layering 30 ml fractions over 17 ml of histopaque-1077 (Sigma-Aldrich), which was then centrifuged at 340 g for 45 min at 20°C. The PBMC layer was isolated and washed three times with culture medium with cells centrifuged at 340 g for 15 min for the first wash and 10 min for the subsequent two washes. The isolated PBMCs were counted and viability assessed with Trypan blue using a hemocytometer, then centrifuged at 340 g for 10 min. The untouched CD3+ T cells were collected using MojoSort™ Human CD3+ T-Cell Isolation Kit, as per manufacturer instructions (BioLegend, San Diego, CA).
Inhibition of hnRNP-K and ERK Phosphorylation
Inhibition of hnRNP-K was performed in CD3+ T cells from healthy controls, as well as in Jurkat T-cells using 5-Fluorouracil (5-FU) (Sigma Aldrich, USA), as described previously (54). Isolated CD3+ T-cells and Jurkat cells were cultured in RPMI-1640 medium containing 10% heat-inactivated fetal bovine serum (Invitrogen) and kept at 37°C in 5% CO2 conditions. For 5-FU treatment, the drug was first dissolved in dimethyl sulfoxide (DMSO) and further diluted in medium before use. Cells were treated with 20 ng/μl 5-FU, unless otherwise stated. Next, to examine whether hnRNP-K and/or RASGRP1 down-regulation by 5-FU led to inhibition of EKR phosphorylation of ERK, Jurkat and CD3+ T-cells were pretreated with PMA 5 μg/μl for 30 min, prior to drug (5-FU) treatment. Inhibition of hnRNP-K and RASGRP1 was detected using mRNA expression analysis with quantitative PCR (after 48 h) and by Western blot (after 72 h).
Results
Patients and Samples
We used five Asian cohorts and one cohort of European descent; sample sizes for the meta-analysis were 9,529 SLE cases and 22,462 controls (Table 1).
Fine-Mapping, Replication and Meta-Analysis of RASGRP1 Association
First, we probed our previously reported SLE-associated region (chr15: 38.4–39.2 MB, hg19) and extracted association results for six cohorts from the region containing the genes RASGRP1 (RAS guanyl-releasing protein 1, a diacylglycerol-regulated guanine nucleotide exchange factor) and C15orf53 [encoding a protein of unknown function linked to alcohol dependence (55)]. The strongest association signal among Asian cohorts localized to intron 2 of RASGRP1 (Figure 2; Table 2). Meta-analysis with all cohorts identified the largest signal at intronic SNP rs8032939 [Pmeta = 3.2 × 10⁻¹¹, OR (95%CI) = 0.88 (0.85–0.92)]. We identified 17 genome-wide significant (GWS) SNPs (Pmeta < 5 × 10⁻⁸). Our previously reported lead SNP rs12900339 (4) did not reach GWS (Pmeta = 9.2 × 10⁻⁷) (Table 2). Analysis of the association signals in the context of linkage disequilibrium (LD) of 1,000 Genome populations (EUR, ASN; Figure 2) identified two uncorrelated association signals (Supplementary Table 1). The main signal occurred at rs8032939 in intron 2 (Figure 2), while the second signal localized to the intergenic region between RASGRP1 and C15orf53: SNP rs9920715 [60 kb 5′ of RASGRP1; Pmeta = 5.1 × 10⁻⁹; OR (95%CI) = 0.89(0.86–0.93)]. Many (27 of 118 SNPs) variants were intronic (Figure 2). We then examined the 18 GWS SNPs with bioinformatic and epigenomic analysis (Table 2). Our top SNP (rs8032939) was previously reported as a rheumatoid arthritis (RA)-associated SNP (56). Within the intronic signal, we also identified rs8035957 (Pmeta = 1.3 × 10⁻¹⁰), associated with Type I Diabetes (57).
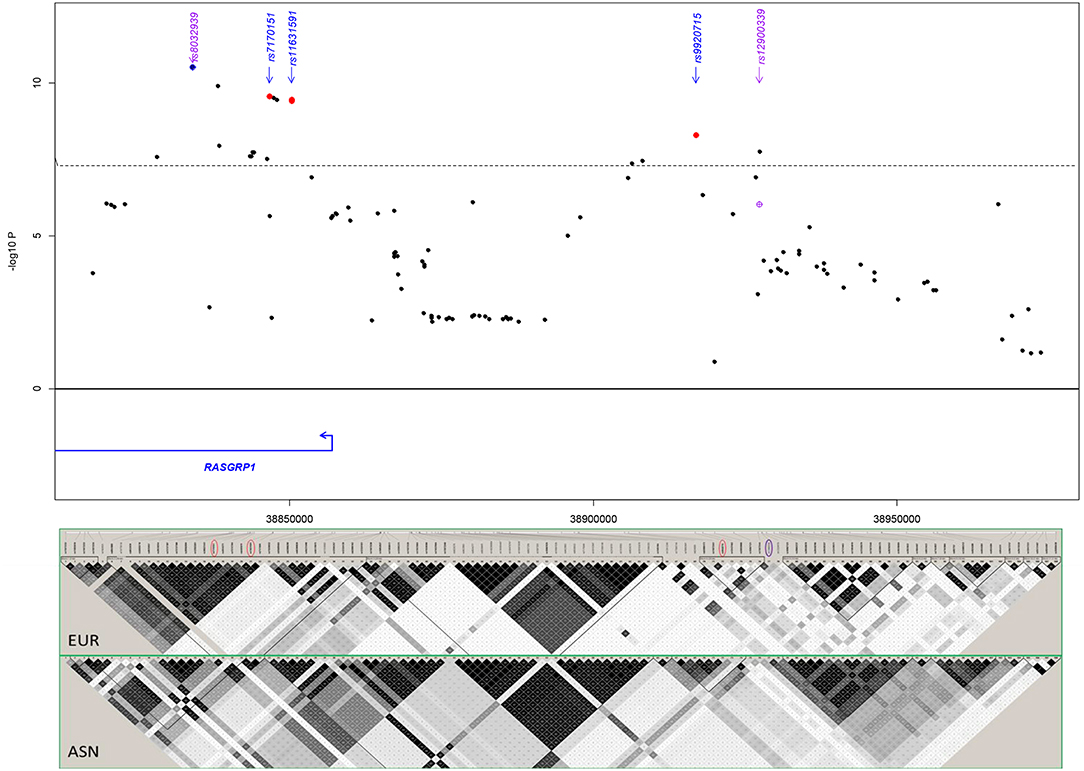
Figure 2. Meta-analysis in the RASGRP1 region. Blue diamond: lead SNP rs8032939 following initial meta-analysis. Red circles: SNPs chosen for experimental validation. rs11631591-rs7173565 are considered together due to their proximity; only rs11631591 is labeled. Purple diamond: our previously reported (4) lead SNP rs12900339. Linkage disequilibrium in the region (bottom) is notably different between European (EUR) and Asian (ASN) populations.
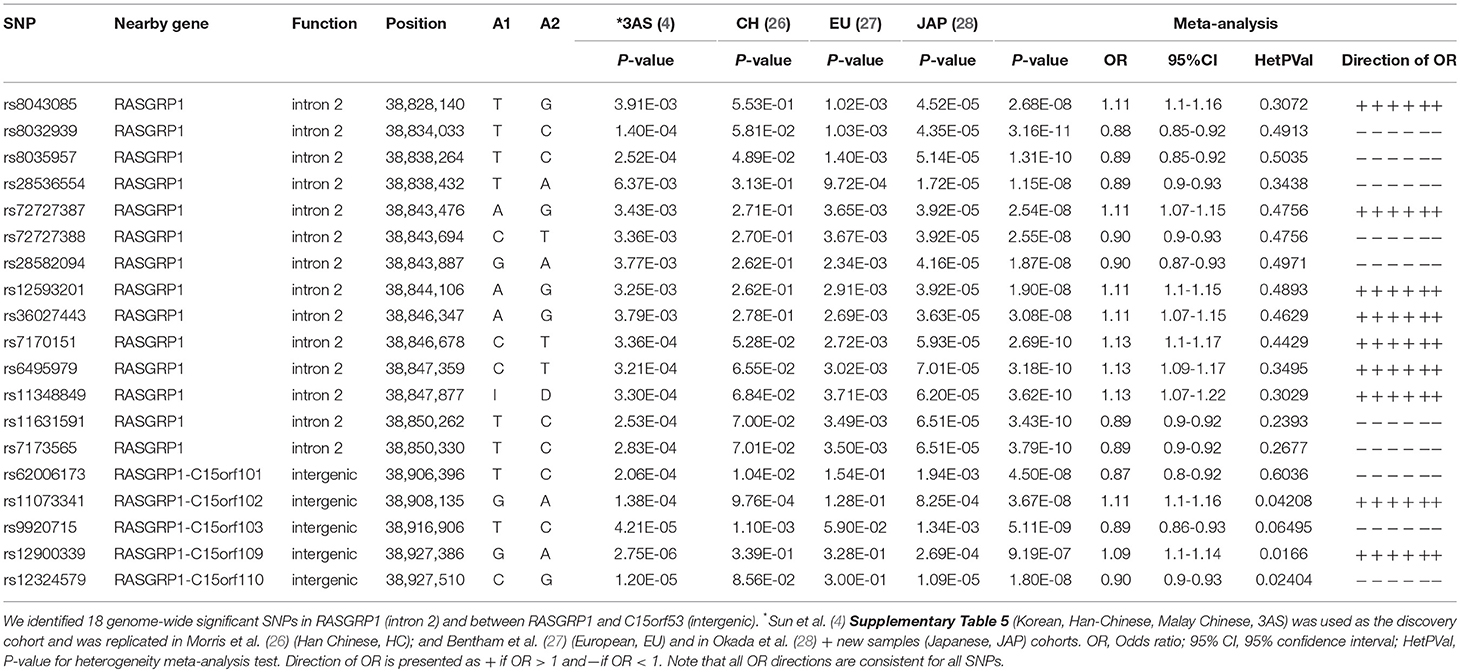
Table 2. Meta-analysis of the RASGRP1 region.
Evaluating Functional SNPs
To identify putative functional SLE SNPs in and around RASGRP1, we computed weighted scores for each SNP by integrating multiple sources of functional annotation, including allele-dependent gene expression, overlap with annotated enhancers and promoters, binding affinity to transcription factors, and collocation with anchors in promoter-enhancer-capture Hi-C experiments (Supplementary Table 2).
Gene Expression
We then identified allele-dependent changes in gene expression by annotating SNPs using expression quantitative trait locus (eQTL) databases for multiple tissues (Methods). All candidate LD SNPs were eQTLs in blood cell lines (3.2 × 10⁻³ > P > 1.9 × 10⁻⁴; Supplementary Table 4), as well as in skin, esophagus, and testis (Table 3). The intronic (main signal) SNPs affected expression of both RASGRP1 and C15orf53, while the intergenic (secondary) SNPs (in LD with rs9920715) altered expression of only RASGRP1. RASGRP1 SNPs also affected expression of long non-coding RNAs (lncRNAs) RP11-102L12.2 and RP11-275I4.2 in non-blood cell lines. All eQTL risk alleles increased expression of RASGRP1 in multiple cell lines (Supplementary Table 4; Supplementary Figure 2), but had opposing effects on the neighboring gene C15orf53 (Supplementary Table 4). We also found significant effects of two linked SNPs (rs11073344, rs11631591) on methylation of RASGRP1 in T-cells and neutrophils, respectively (Supplementary Table 5).
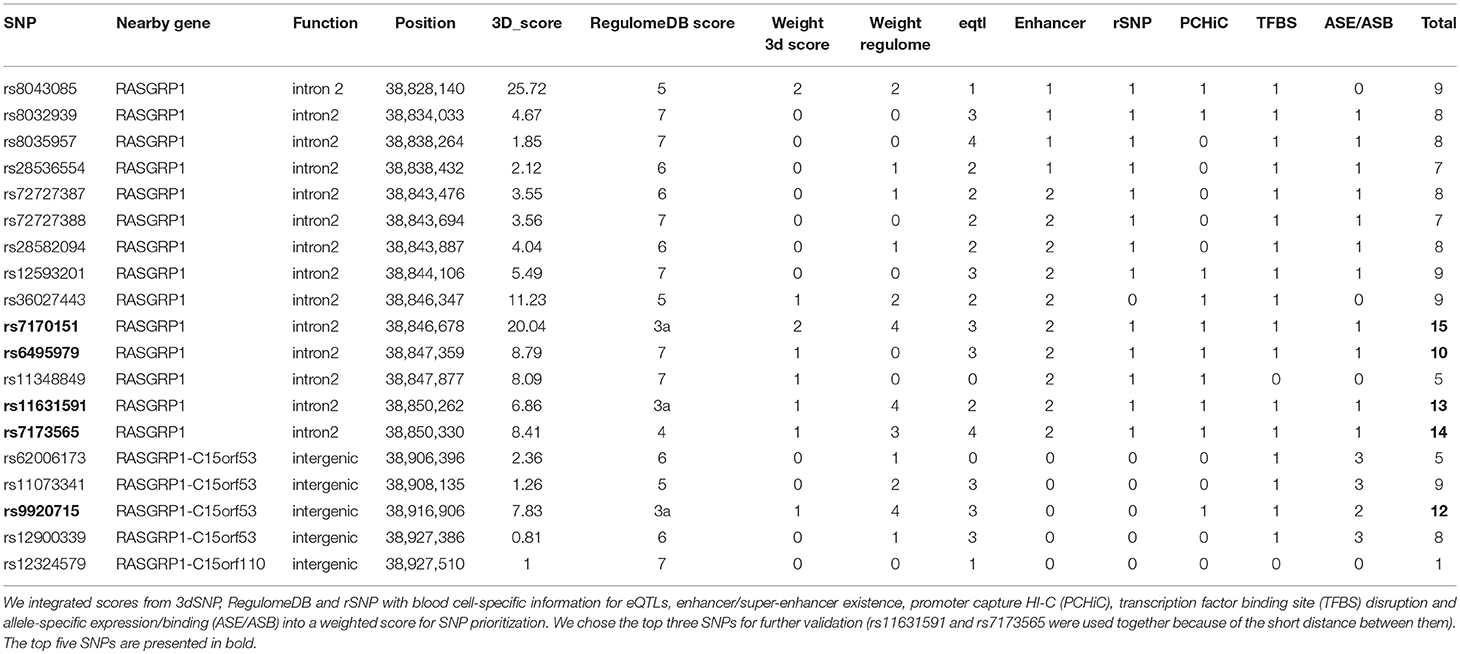
Table 3. Relevant epigenetic features of genome-wide significant SNPs.
Overlap With Enhancers and Super-Enhancers
Then, we investigated the potential of the candidate SNPs to act as enhancers of RASGRP1 expression. Three GWS SNPs (rs6495979, rs11631591, and rs7173565) overlapped with ENCODE-annotated enhancers for RASGRP1 in lymphoblastoid cells (GM12878, GM12892) and also in CD8+ T-cells. These three GWS SNPs (all intronic) localized to super-enhancers [i.e., collections of multiple contiguous enhancers (58)] for RASGRP1 in CD4+ CD25− CD45RA+ naïve cells, CD4+ CD25− CD45RO+ memory cells, CD8+ primary cells, CD4+ CD25− Il17+ phorbol myristate acetate (PMA)-stimulated Th17 cells, and CD4+ CD25− Il17− PMA-stimulated Th17 cells (Supplementary Table 6). This suggests that these SNPs may regulate RASGRP1 in T-lymphocytes.
Chromatin Interactions
Since all candidate SNPs reside outside of the RASGRP1 promoter, we investigated if the SNPs overlapped with anchors in promoter-enhancer connections through chromatin interactions. We used promoter-capture Hi-C data on blood cell lines, in particular T-cells, to identify physical interactions between the intronic signal and the RASGRP1 promoter (Supplementary Table 7; Supplementary Figure 3). We also examined the physical interaction between the intergenic region (represented by rs9920715) and the promoters of RASGRP1 and C15orf53. We identified multiple significant promoter-enhancer interactions between the intronic signal and RASGRP1, C15orf53, FAM98B, and SPRED1, and multiple interactions between the intergenic signal and the promoter of RASGRP1 (Supplementary Table 7).
Effect on Cytokine Production
A critical feature in SLE pathogenicity is cytokine production (59); thus, we investigated if these SNPs alter cytokine abundance. Our candidate SNPs significantly increased expression of interleukins IL6 and IL22 and tumor necrosis factor (TNFα), while SNP rs9920715 exclusively increased IL22 expression (Supplementary Table 8).
Allele-Specific Binding
We found that 14 of the candidate GWS SNPs also had allele-specific binding (ASB) to H2K27ac in monocytes, neutrophils, and T-cells (Supplementary Table 9), while rs9920715 showed ASB with H3K4me1 in T-cells and neutrophils. To characterize the regulatory mechanisms involved, we assessed ASB of histone marks H3K4me1 and H3K4me3 at and around candidate SNPs (Supplementary Table 9; Table 3). We identified a significant regulatory region associated with promoter mark H3K4me3 with a higher binding affinity to the extended region (~1 kb) containing the risk alleles (both C) of intronic SNPs rs11631591-rs7173565 (Supplementary Figure 4a). In addition, we identified marginally significant ASB to enhancer mark H3K4me1 at SNPs rs6495979 and rs7170151, which tagged a regulatory region within ~500 bp (Supplementary Figure 4b). These data indicate that allele-specific differences might affect chromatin interactions.
Validation of Enhancer by Luciferase Assays
When testing in a luciferase reporter assay, rs7170151 and rs11631591 showed marked (up to 10-fold over empty vector) enhancer activity in Jurkat cells (P = 3.0 × 10⁻⁴, P = 1.0 × 10⁻³, respectively) and less so (1.6-fold) in HEK293 cells (P = 4.0 × 10⁻², P = 3.0 × 10⁻³); on the other hand rs9920715 functioned as a very weak enhancer only in HEK293 (P = 4.1 × 10⁻²) (Figure 3). Furthermore, rs7170151 and rs11631591 showed dramatic allelic differences in enhancer function. Genomic regions containing homozygous risk alleles of rs7170151 (C) and rs11631591 (C) showed significantly higher enhancer activity (~50% increase; P = 1.0 × 10⁻² and P = 2.3 × 10⁻³, respectively; Figure 3A) compared to non-risk alleles, but only in Jurkat cells. This allele-dependent enhancer activity is consistent with the allele-specific expression we observed in the eQTL data. There were no significant differences in HEK293 cell lines (Figure 3B), suggesting that enhancer activity depends on white blood cell-specific factors. The third intergenic SNP (rs9920715) did not show enhancer activity in any assayed cell type (Figures 3A,B).
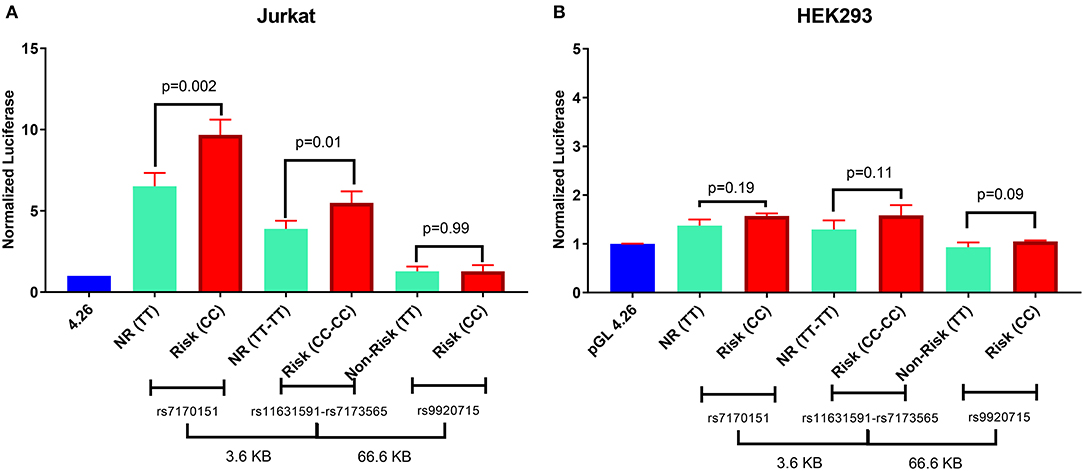
Figure 3. Luciferase reporter assay for rs7170151, rs11631591-rs7173565 and rs9920715. (A) Jurkat cells. (B) HEK293 cells. Empty vector pGL4.26 was used as reference. NR: non-risk. P-values are for Student's t-test.
Transcription Factor Binding
We next assessed allele-specific changes in transcription factor binding site (TFBS) affinity using five motif databases (Methods). We identified 256 TFBSs significantly affected by ten of our SNPs (Supplementary Table 10). Notably, we found 43-fold higher affinity of promoter-specific TF YY1 to the non-risk allele (T) of rs7173565 and 42-fold higher affinity of TF GATA (GATA1.3.p2 motif) to the risk (T) allele of rs6495979. Interestingly, SLE-risk ETS1 (60) binding had 10-fold higher affinity to the risk (C) allele of rs7173565, while SLE-risk IRF5 (61) bound 6-fold more tightly to the non-risk (C) allele of rs6495979.
Identification of DNA-Binding Proteins
We detected DNA-binding protein complexes using electrophoretic mobility shift assays (EMSAs) and DNA pulldown assays using a 41 bp-long dsDNA containing the rs11631591-rs7173565 (homozygous risk, CC; or homozygous non-risk, TT) alleles (Supplementary Table 11). We prepared nuclear extracts from Jurkat cells and incubated them with biotin-labeled dsDNA (risk vs. non-risk) bound to magnetic beads coated in streptavidin. EMSA showed multiple bands of DNA-bound proteins (Supplementary Figure 5). We observed allele-specific binding of a protein complex at 75 kDa. Although EMSA is not a quantitative assay, we observed in multiple independent experiments that the intensity of the band with the risk (CC) oligo was darker than with the non-risk (TT) oligo, suggesting allele-specific differential binding (Supplementary Figure 5). Using mass spectrometry analysis of bound proteins, we identified heterogeneous nuclear ribonucleoprotein K (hnRNP-K) isoform b as the most abundant bound protein (Supplementary Table 11). hnRNP-K was also the protein whose binding was most diminished by substitution of the risk CC by non-risk TT nucleotides. We also confirmed that the identified protein bound with the risk oligo for the region of rs11631591 was hnRNP-K through EMSA followed by Western blot (Supplementary Figure 6).
SNPs Bind to Different Transcription Factors in an Allele-Specific Manner
Using EMSA and mass spectrometry, we showed that hnRNP-K protein has tighter binding affinity to the risk genotype (CC) of SNP rs11631591-rs7173565. We validated these findings using Jurkat (heterozygous CT at rs11631591-rs7173565) to perform chromatin-immunoprecipitation (ChIP) followed by RT-qPCR (ChIP-qPCR). We observed significant enrichment in binding of the hnRNP-K antibody to the SNP region of rs11631591, but did not observe any binding of hnRNP-K antibody to either rs7170151 or rs9920715 (Figure 4A). To determine preferential or allele-specific binding, we performed Sanger sequencing on the region containing rs11631591-rs7173565. Both alleles were present in the original input sample; however, only the risk allele (C) was detected significantly higher than the non-risk allele (T) in chromatograms of the ChIP-eluted PCR product (Figure 4B). These data suggest preferential allele-specific binding of the rs11631591-rs7173565 risk locus to hnRNP-K.
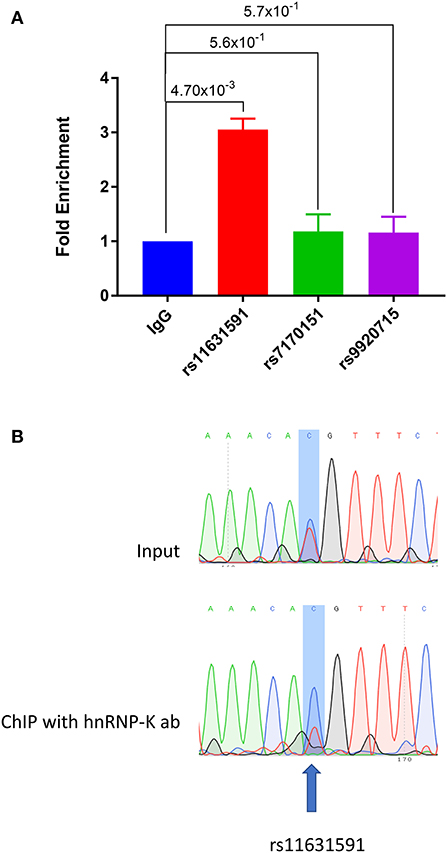
Figure 4. (A) ChIP-qPCR of sequences containing SNPs rs11631591-rs7173565, rs7170151 or rs9920715 in Jurkat cells. SNP rs11631591 showed 3-fold enrichment of hnRNP-K binding over IgG control. No significant enrichment at the other two SNPs was observed. P-values are for Student's t-test. (B) Sequence chromatographs from a heterozygous sample at rs11631591 showing difference in binding between the input (equal binding to the two alleles, above) and the ChIP assay at the risk allele (2–3× more binding to the risk C allele, below).
hnRNP-K Plays an Important Role in RASGRP1 Expression
To investigate the role of endogenous hnRNP-K in Jurkat and primary CD3+ T-cells, we transiently inhibited hnRNP-K using 5-fluorouracil (5-FU). After 5-FU treatment (48 h), we observed significantly reduced mRNA expression for both hnRNP-K (P = 1.4 × 10⁻³; Figure 5A) and RASGRP1 (P = 3.0 × 10⁻⁴; Figure 5B). 5-FU-induced hnRNP-K downregulation correlated with reduced expression of RASGRP1 (Figures 6A,B). This result suggests that hnRNP-K plays an important role in RASGRP1 expression in Jurkat cells as well as in primary T-cells. Furthermore, we observed the reduction of ERK phosphorylation with 5-FU after initial induction with PMA in Jurkat and primary T-cells (Figures 6A–D). It is of note that stimulation with PMA did not influence cell viability (Supplementary Figure 7).
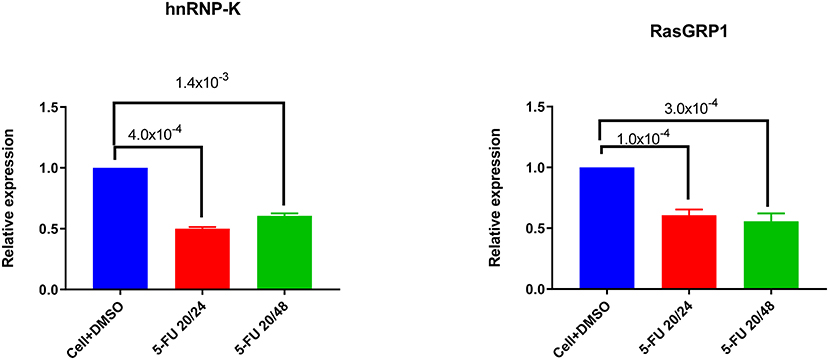
Figure 5. Downregulation of hnRNP-K by 5-FU treatment. 5-FU treatment reduces hnRNP-K expression levels in Jurkat cells. Jurkat cells were treated with DMSO vehicle or 5-FU (20 ng/μl) for 24 or 48 h. hnRNP-K (A) and RASGRP1 (B) were examined with GADPH as loading control.
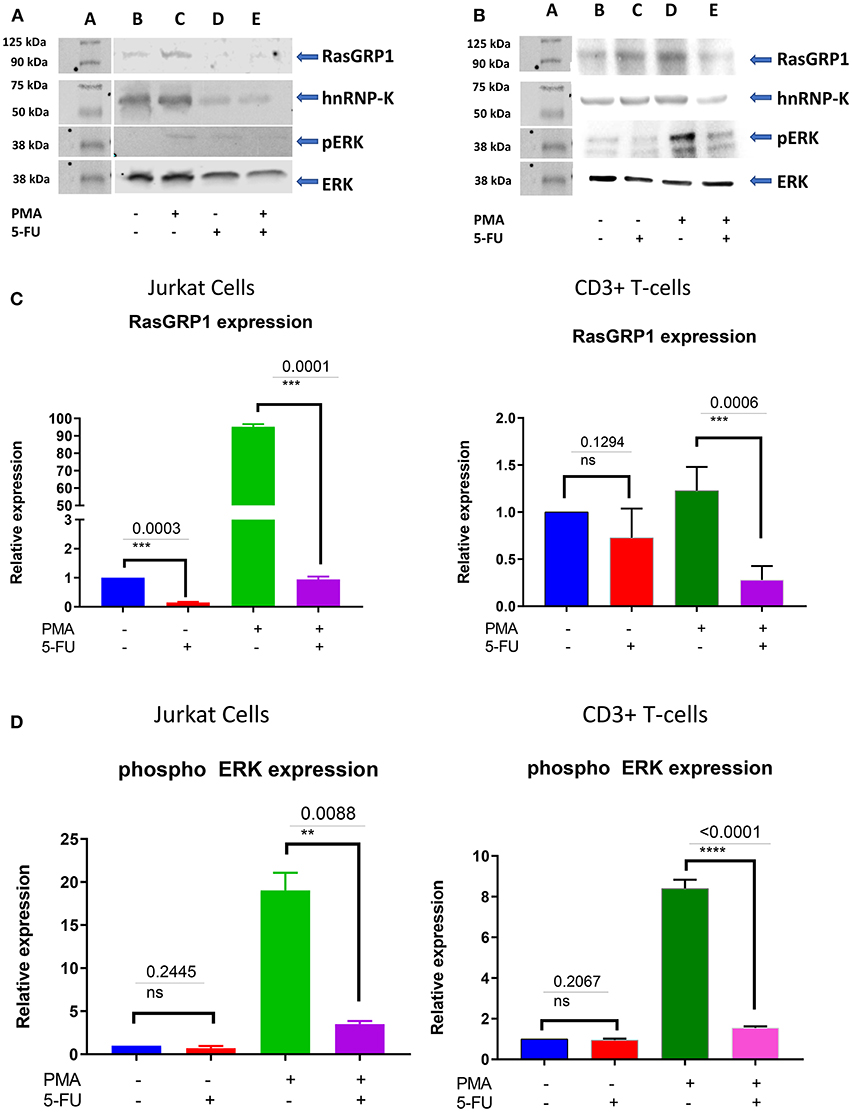
Figure 6. (A) RasGRP1 reduction influences the phosphorylation of ERK. 5-FU treatment reduces hnRNP-K and RasGRP1 expression levels in Jurkat and healthy human CD3+ T cells. Pretreatment with PMA increases levels of RasGRP1 and phospho-ERK. Inhibition of hnRNP-K with 5-FU decreases levels of RasGRP1 and phospho-ERK, even after PMA stimulation. (B) 5-FU treatment reduces hnRNP-K as well as RasGRP1 expression level in primary CD3+ T-cells. Pretreatment with PMA induces RasGRP1 expression and leads to phosphorylation of ERK and reduction of RasGRP1; treatment with 5-FU also leads to reduction of phosphorylation of ERK. (C) Densitometric analysis for RASGRP1 normalized to β-actin: primary T-cells and Jurkat cells. Results are presented as relative fold-change following drug treatment with and without stimulation. (D) Densitometry analysis for phospho-ERK normalized to β-actin: primary T-cells and Jurkat cells. Results are presented as relative fold-change following drug treatment with and without PMA stimulation. **P < 0.05; ***P < 0.005.
Discussion
In this study, we fine-mapped our previously reported SLE locus near RAS guanyl-releasing protein 1 (RASGRP1), a lynchpin of T-cell development and the RAS/MAP kinase signaling cascade following antigen exposure. We performed a trans-ethnic meta-analysis of the locus with cohorts of Asian and European descent, followed by multiple lines of bioinformatic analysis of its epigenetic context to prioritize SNPs as candidate causal variants. Experimental testing of the top candidates validated them as plausible variants underlying association of this locus with SLE (and perhaps other autoimmune phenotypes).
We identified two independently associated regions correlated with RASGRP1 regulation and expression. The first signal lies in RASGRP1 intron 2, represented by SNPs rs11631591-rs7173565 and rs7170151, which regulate RASGRP1 expression as eQTLs (esophageal mucosa and skin), enhancers (in CD8+ T-cells and thymic and lymphoblastoid cell lines), and as interaction anchors with the nearby C15orf53 promoter. The SNPs in this region are within a robust enhancer, with the risk alleles (rs7170151-C and rs11631591-C/rs7173565-C) greatly increasing RASGRP1 expression in multiple tissues (databases) and in Jurkat T-cells (our experiments). Furthermore, this enhancer is targeted by promoter interactions in CD8+ and CD4+ T-cells, B-cells, and monocytes (62) (Supplementary Figure 3). We also identified another intergenic signal around 60 kb 5′ of RASGRP1, at rs9920715, another SNP within promoter-interacting chromatin that acts as an eQTL for RASGRP1 in B- and T-cell lines (62). However, this SNP did not show enhancer activity in our assays.
Mammalian gene regulatory elements, especially those that are tissue-specific, show high in vivo nucleosome occupancy, which can effectively compete with TF binding (63, 64). This nucleosome-mediated restricted access to regulatory information is a key element for inducible or cell type-specific control of gene expression (65). In the current study, we observed strong enhancer activity at rs11631591-rs7173565 or rs7170151 only in Jurkat but not HEK293 cells. Furthermore, our candidate SNPs show allele-specific RASGRP1 expression, with the risk alleles driving substantially more (~50%) expression than the non-risk alleles. Other studies on numerous complex diseases have demonstrated enrichment of disease-associated loci in cell type-specific regulatory regions of corresponding disease-relevant cell types (58, 66–69). Additional studies now document the direct effects of common variation in enhancer elements on enhancer states (70–73), gene expression (70, 74), and disease (75–79). Risk alleles of rs11631591 also showed significant binding to hnRNP-K protein in an allele-specific manner.
DNA/protein interaction assays demonstrated that hnRNP-K preferentially binds to sequences containing the rs11631591 risk (C) allele. We confirmed this allele-specific binding by EMSA and ChIP DNA sequencing. We only observed allele-specific binding of hnRNP-K at SNP rs116311591-rs7173565, but not at rs7170151 or rs9920715. We also observed that inhibition of hnRNP-K correlates with RASGRP1 expression and ERK phosphorylation. In fact, expression of RASGRP1 and hnRNP-K (P = 9.8 × 10⁻⁵; P = 1.4 × 10⁻², respectively) in spleen (Supplementary Figure 8) shows a positive correlation between the risk allele of rs116311591 and both these genes. These data suggest that SNP rs11631591 is a functional SNP and may directly contribute to modulating RASGRP1 expression. Abnormal expression of RASGRP1 isoforms will perturb lymphocytes of SLE patients regardless of their clinical disease activity, and may contribute to impaired lymphocyte function and increased apoptosis in SLE patients (19). Abnormal RASGRP1 expression also induces ERK and JNK phosphorylation in the MAPK pathway, which in turn alters T-cell development, contributes to long-term organ damage, and ultimately increases SLE susceptibility (22, 24, 25). In the present study, we also observed the role of RASGRP1 expression in the phosphorylation of ERK activity. Altogether, our results indicate increased RASGRP1 expression correlates with the risk alleles in our functional SLE loci and T-cell dysfunction. However, our study did not examine the differences in RASGRP1 isoform expression reportedly associated with SLE and correlated with low RASGRP1 expression (19).
In this study, we characterized the genetic risk of SLE in RASGRP1. We also propose a mechanism by which functional SNPs could affect SLE pathogenesis. We identified two functional regions affecting expression and regulation of RASGRP1 in an intronic region including two SNPs (rs11631591 and rs7170151) and another in an intergenic region harboring SNP rs9920715. All identified SNPs are RASGRP1 eQTLs and exhibit regulatory potential through enhancer-promoter chromatin interactions. SNP rs11631591 showed T-cell-specific enhancer activity and an allele-specific interaction with hnRNP-K protein. Inhibition of hnRNP-K protein by 5-FU decreased expression of RASGRP1 in T-cells, suggesting that hnRNP-K plays an important role in RASGRP1 expression through interactions with the risk genotype of SNP rs11631591. These results are consistent with this SNP being an important factor contributing to SLE pathogenicity.
Heterogeneous nuclear ribonucleoproteins (hnRNPs) represent a large family of nucleic acid-binding proteins implicated in various cellular processes including transcription and translation (24, 80). hnRNP-K is a highly multifunctional protein, with annotated roles in chromatin remodeling, transcription, splicing and translation (80). It is primarily referred to as an RNA-binding protein specific for “poly-C” repeats (81), but it actually prefers single-stranded DNA and can bind to double-stranded DNA (82). hnRNP-K can act as a transcriptional activator or repressor (83); notable examples include transcriptional repression of CD43 in leukocytes (84) and transcriptional activation of c-myc in B-cells (85). Its DNA-binding preference is found to be repeats of the CT motif, separated by several base pairs (82), confirmed by structure determination (86). There are several CT motifs in the immediate environment of rs11631591, whose hnRNP-K binding could be affected by the SNP. It should also be noted that several of the other abundant proteins pulled down by the double-stranded DNA EMSA are primarily annotated as RNA-binding proteins, including hnRNP-M and splicing factor U2AF. Other transcription factors were also abundant, including far upstream element-binding protein 3, supporting the notion that this locus is indeed transcriptionally active.
Taken together, we have identified and mechanistically dissected a lupus risk locus in the 2nd intron of RASGRP1, which regulates T- and B-cell development and the MAP kinase pathway. Single SNPs were found to control transcriptional activation and binding to several proteins, including the transcription factor hnRNP-K. Experiments confirmed that both the single base-pair risk-to-non-risk substitutions and pharmacological inhibition of hnRNP-K decreased MAPK signaling in T-cells. Systematic refinement of large GWAS peaks to single SNPs, combined with experimental mechanistic analysis, is critical to understand the genetics of highly multigenic diseases and to drive therapeutic interventions to improve human health.
Web Resources
Bentham and Morris summary SLE GWAS: http://insidegen.com/.
Ethics Statement
All sample collections were approved by the Institutional Review Board of the Oklahoma Medical Research Foundation as well as by the collaborating institutions.
Author Contributions
SN conceived and supervised the project. JM performed the meta-analysis, bioinformatic, and epigenetic analyses, and prepared most of the tables and figures. BS performed most of the experiments and generated experimental figures. CT, YO, and SA ran the association analysis and provided the relevant data for replication of the Japanese samples. JK and BM helped and performed some experiments. CS helped in assembling and analyzing imputed data for association and performed some bioinformatics analysis and also helped in interpreting the results and contributed to the correction of manuscript. CW helped in planning experiments and revising the manuscript. LL provided expertise and helped in interpreting the results. JM, LL, and SN drafted and finalized the manuscript. All authors read and approved the submitted manuscript.
Funding
This work was supported by the grants from National Institutes of Health (AR073941, AR060366, AI132532, MD007909) to SN, AI18836 to CW.
Conflict of Interest Statement
The authors declare that the research was conducted in the absence of any commercial or financial relationships that could be construed as a potential conflict of interest.
Acknowledgments
The authors thank all of the lupus patients and unaffected controls who participated in this study. We thank the research assistants, coordinators, and physicians who helped in the recruitment of subjects, including the individuals in the coordinating projects.
Supplementary Material
The Supplementary Material for this article can be found online at: https://www.frontiersin.org/articles/10.3389/fimmu.2019.01066/full#supplementary-material
References
1. Alarcon GS, McGwin G Jr., Petri M, Reveille JD, Ramsey-Goldman R, Kimberly RP, et al. Baseline characteristics of a multiethnic lupus cohort: PROFILE. Lupus. (2002) 11:95–101. doi: 10.1191/0961203302lu155oa
2. Molineros JE, Yang W, Zhou XJ, Sun C, Okada Y, Zhang H, et al. Confirmation of five novel susceptibility loci for systemic lupus erythematosus (SLE) and integrated network analysis of 82 SLE susceptibility loci. Hum Mol Genet. (2017) 26:1205–16. doi: 10.1093/hmg/ddx026
3. Langefeld CD, Ainsworth HC, Cunninghame Graham DS, Kelly JA, Comeau ME, Marion MC, et al. Transancestral mapping and genetic load in systemic lupus erythematosus. Nat Commun. (2017) 8:16021. doi: 10.1038/ncomms16021
4. Sun C, Molineros JE, Looger LL, Zhou XJ, Kim K, Okada Y, et al. High-density genotyping of immune-related loci identifies new SLE risk variants in individuals with Asian ancestry. Nat Genet. (2016) 48:323–30. doi: 10.1038/ng.3496
5. Carrasco S, Merida I. Diacylglycerol-dependent binding recruits PKCtheta and RasGRP1 C1 domains to specific subcellular localizations in living T lymphocytes. Mol Biol Cell. (2004) 15:2932–42. doi: 10.1091/mbc.e03-11-0844
6. Beaulieu N, Zahedi B, Goulding RE, Tazmini G, Anthony KV, Omeis SL, et al. Regulation of RasGRP1 by B cell antigen receptor requires cooperativity between three domains controlling translocation to the plasma membrane. Mol Biol Cell. (2007) 18:3156–68. doi: 10.1091/mbc.e06-10-0932
7. Ebinu JO, Bottorff DA, Chan EY, Stang SL, Dunn RJ, Stone JC. RasGRP, a Ras guanyl nucleotide- releasing protein with calcium- and diacylglycerol-binding motifs. Science. (1998) 280:1082–6. doi: 10.1126/science.280.5366.1082
8. Dower NA, Stang SL, Bottorff DA, Ebinu JO, Dickie P, Ostergaard HL, et al. RasGRP is essential for mouse thymocyte differentiation and TCR signaling. Nat Immunol. (2000) 1:317–21. doi: 10.1038/79766
9. Liu Y, Zhu M, Nishida K, Hirano T, Zhang W. An essential role for RasGRP1 in mast cell function and IgE-mediated allergic response. J Exp Med. (2007) 204:93–103. doi: 10.1084/jem.20061598
10. Coughlin JJ, Stang SL, Dower NA, Stone JC. RasGRP1 and RasGRP3 regulate B cell proliferation by facilitating B cell receptor-Ras signaling. J Immunol. (2005) 175:7179–84. doi: 10.4049/jimmunol.175.11.7179
11. Shen S, Chen Y, Gorentla BK, Lu J, Stone JC, Zhong XP. Critical roles of RasGRP1 for invariant NKT cell development. J Immunol. (2011) 187:4467–73. doi: 10.4049/jimmunol.1003798
12. Bartlett A, Buhlmann JE, Stone J, Lim B, Barrington RA. Multiple checkpoint breach of B cell tolerance in Rasgrp1-deficient mice. J Immunol. (2013) 191:3605–13. doi: 10.4049/jimmunol.1202892
13. Guo B, Rothstein TL. RasGRP1 is an essential signaling molecule for development of B1a cells with autoantigen receptors. J Immunol. (2016) 196:2583–90. doi: 10.4049/jimmunol.1502132
14. Priatel JJ, Teh SJ, Dower NA, Stone JC, Teh HS. RasGRP1 transduces low-grade TCR signals which are critical for T cell development, homeostasis, and differentiation. Immunity. (2002) 17:617–27. doi: 10.1016/S1074-7613(02)00451-X
15. Salzer E, Cagdas D, Hons M, Mace EM, Garncarz W, Petronczki OY, et al. RASGRP1 deficiency causes immunodeficiency with impaired cytoskeletal dynamics. Nat Immunol. (2016) 17:1352–60. doi: 10.1038/ni.3575
16. Winter S, Martin E, Boutboul D, Lenoir C, Boudjemaa S, Petit A, et al. Loss of RASGRP1 in humans impairs T-cell expansion leading to Epstein-Barr virus susceptibility. EMBO Mol Med. (2018) 10:188–99. doi: 10.15252/emmm.201708292
17. Mao H, Yang W, Latour S, Yang J, Winter S, Zheng J, et al. RASGRP1 mutation in autoimmune lymphoproliferative syndrome-like disease. J Allergy Clin Immunol. (2018) 142:595–604 e516. doi: 10.1016/j.jaci.2017.10.026
18. Golinski ML, Vandhuick T, Derambure C, Freret M, Lecuyer M, Guillou C, et al. Dysregulation of RasGRP1 in rheumatoid arthritis and modulation of RasGRP3 as a biomarker of TNFalpha inhibitors. Arthritis Res Ther. (2015) 17:382. doi: 10.1186/s13075-015-0894-9
19. Rapoport MJ, Bloch O, Amit-Vasina M, Yona E, Molad Y. Constitutive abnormal expression of RasGRP-1 isoforms and low expression of PARP-1 in patients with systemic lupus erythematosus. Lupus. (2011) 20:1501–9. doi: 10.1177/0961203311418790
20. Yasuda S, Stevens RL, Terada T, Takeda M, Hashimoto T, Fukae J, et al. Defective expression of Ras guanyl nucleotide-releasing protein 1 in a subset of patients with systemic lupus erythematosus. J Immunol. (2007) 179:4890–900. doi: 10.4049/jimmunol.179.7.4890
21. Kono M, Kurita T, Yasuda S, Kono M, Fujieda Y, Bohgaki T, et al. Decreased expression of Serine/arginine-rich splicing factor 1 in T cells from patients with active systemic lupus erythematosus accounts for reduced expression of RasGRP1 and DNA methyltransferase 1. Arthritis Rheumatol. (2018) 70:2046–56. doi: 10.1002/art.40585
22. Deng C, Lu Q, Zhang Z, Rao T, Attwood J, Yung R, et al. Hydralazine may induce autoimmunity by inhibiting extracellular signal-regulated kinase pathway signaling. Arthritis Rheum. (2003) 48:746–56. doi: 10.1002/art.10833
23. Molad Y, Amit-Vasina M, Bloch O, Yona E, Rapoport MJ. Increased ERK and JNK activities correlate with disease activity in patients with systemic lupus erythematosus. Ann Rheum Dis. (2010) 69:175–80. doi: 10.1136/ard.2008.102780
24. Bloch O, Amit-Vazina M, Yona E, Molad Y, Rapoport MJ. Increased ERK and JNK activation and decreased ERK/JNK ratio are associated with long-term organ damage in patients with systemic lupus erythematosus. Rheumatology. (2014) 53:1034–42. doi: 10.1093/rheumatology/ket482
25. Rapoport MJ, Amit M, Aharoni D, Weiss M, Weissgarten J, Bruck N, et al. Constitutive up-regulated activity of MAP kinase is associated with down-regulated early p21Ras pathway in lymphocytes of SLE patients. J Autoimmun. (2002) 19:63–70. doi: 10.1006/jaut.2002.0596
26. Morris DL, Sheng Y, Zhang Y, Wang YF, Zhu Z, Tombleson P, et al. Genome-wide association meta-analysis in Chinese and European individuals identifies ten new loci associated with systemic lupus erythematosus. Nat Genet. (2016) 48:940–6. doi: 10.1038/ng.3603
27. Bentham J, Morris DL, Cunninghame Graham DS, Pinder CL, Tombleson P, Behrens TW, et al. Genetic association analyses implicate aberrant regulation of innate and adaptive immunity genes in the pathogenesis of systemic lupus erythematosus. Nat Genet. (2015) 47:1457–64. doi: 10.1038/ng.3434
28. Okada Y, Shimane K, Kochi Y, Tahira T, Suzuki A, Higasa K, et al. A genome-wide association study identified AFF1 as a susceptibility locus for systemic lupus eyrthematosus in Japanese. PLoS Genet. (2012) 8:e1002455. doi: 10.1371/journal.pgen.1002455
29. Hochberg MC. Updating the American College of Rheumatology revised criteria for the classification of systemic lupus erythematosus. Arthritis Rheum. (1997) 40:1725. doi: 10.1002/art.1780400928
30. Purcell S, Neale B, Todd-Brown K, Thomas L, Ferreira MA, Bender D, et al. PLINK: a tool set for whole-genome association and population-based linkage analyses. Am J Hum Genet. (2007) 81:559–75. doi: 10.1086/519795
31. Willer CJ, Li Y, Abecasis GR. METAL: fast and efficient meta-analysis of genomewide association scans. Bioinformatics. (2010) 26:2190–1. doi: 10.1093/bioinformatics/btq340
32. Ward LD, Kellis M. HaploReg: a resource for exploring chromatin states, conservation, and regulatory motif alterations within sets of genetically linked variants. Nucleic Acids Res. (2012) 40:D930–4. doi: 10.1093/nar/gkr917
33. Consortium EP. An integrated encyclopedia of DNA elements in the human genome. Nature. (2012) 489:57–74. doi: 10.1038/nature11247
34. Pradel LC, Vanhille L, Spicuglia S. The European Blueprint project: towards a full epigenome characterization of the immune system. Med Sci. (2015) 31:236–8. doi: 10.1051/medsci/20153103003
35. Lu Y, Quan C, Chen H, Bo X, Zhang C. 3DSNP: a database for linking human noncoding SNPs to their three-dimensional interacting genes. Nucleic Acids Res. (2017) 45:D643–9. doi: 10.1093/nar/gkw1022
36. Boyle AP, Hong EL, Hariharan M, Cheng Y, Schaub MA, Kasowski M, et al. Annotation of functional variation in personal genomes using RegulomeDB. Genome Res. (2012) 22:1790–7. doi: 10.1101/gr.137323.112
37. Guo L, Du Y, Chang S, Zhang K, Wang J. rSNPBase: a database for curated regulatory SNPs. Nucleic Acids Res. (2014) 42:D1033–9. doi: 10.1093/nar/gkt1167
38. Lappalainen T, Sammeth M, Friedlander MR, t Hoen PA, Monlong J, Rivas MA, et al. Transcriptome and genome sequencing uncovers functional variation in humans. Nature. (2013) 501:506–11. doi: 10.1038/nature12531
39. Westra HJ, Peters MJ, Esko T, Yaghootkar H, Schurmann C, Kettunen J, et al. Systematic identification of trans eQTLs as putative drivers of known disease associations. Nat Genet. (2013) 45:1238–43. doi: 10.1038/ng.2756
40. van der Wijst MGP, Brugge H, de Vries DH, Deelen P, Swertz MA, LifeLines Cohort S, et al. Single-cell RNA sequencing identifies celltype-specific cis-eQTLs and co-expression QTLs. Nat Genet. (2018) 50:493–7. doi: 10.1038/s41588-018-0089-9
41. Consortium GT. Human genomics. The Genotype-Tissue Expression (GTEx) pilot analysis: multitissue gene regulation in humans. Science. (2015) 348:648–60. doi: 10.1126/science.1262110
42. Chen L, Ge B, Casale FP, Vasquez L, Kwan T, Garrido-Martin D, et al. Genetic drivers of epigenetic and transcriptional variation in human immune cells. Cell. (2016) 167:1398–414 e1324. doi: 10.1016/j.cell.2016.10.026
43. Coetzee SG, Coetzee GA, Hazelett DJ. motifbreakR: an R/Bioconductor package for predicting variant effects at transcription factor binding sites. Bioinformatics. (2015) 31:3847–9. doi: 10.1093/bioinformatics/btv470
44. Khan A, Zhang X. dbSUPER: a database of super-enhancers in mouse and human genome. Nucleic Acids Res. (2016) 44:D164–71. doi: 10.1093/nar/gkv1002
45. Corradin O, Saiakhova A, Akhtar-Zaidi B, Myeroff L, Willis J, Cowper-Sallari R, et al. Combinatorial effects of multiple enhancer variants in linkage disequilibrium dictate levels of gene expression to confer susceptibility to common traits. Genome Res. (2014) 24:1–13. doi: 10.1101/gr.164079.113
46. Gao T, He B, Liu S, Zhu H, Tan K, Qian J. EnhancerAtlas: a resource for enhancer annotation and analysis in 105 human cell/tissue types. Bioinformatics. (2016) 32:3543–51. doi: 10.1093/bioinformatics/btw495
47. Li R, Liu Y, Li T, Li C. 3Disease Browser: a Web server for integrating 3D genome and disease-associated chromosome rearrangement data. Sci Rep. (2016) 6:34651. doi: 10.1038/srep34651
48. Schofield EC, Carver T, Achuthan P, Freire-Pritchett P, Spivakov M, Todd JA, et al. CHiCP: a web-based tool for the integrative and interactive visualization of promoter capture Hi-C datasets. Bioinformatics. (2016) 32:2511–3. doi: 10.1093/bioinformatics/btw173
49. Rao SS, Huntley MH, Durand NC, Stamenova EK, Bochkov ID, Robinson JT, et al. A 3D map of the human genome at kilobase resolution reveals principles of chromatin looping. Cell. (2014) 159:1665–80. doi: 10.1016/j.cell.2014.11.021
50. Sanborn AL, Rao SS, Huang SC, Durand NC, Huntley MH, Jewett AI, et al. Chromatin extrusion explains key features of loop and domain formation in wild-type and engineered genomes. Proc Natl Acad Sci USA. (2015) 112:E6456–65. doi: 10.1073/pnas.1518552112
51. Cairns J, Freire-Pritchett P, Wingett SW, Varnai C, Dimond A, Plagnol V, et al. CHiCAGO: robust detection of DNA looping interactions in Capture Hi-C data. Genome Biol. (2016) 17:127. doi: 10.1186/s13059-016-0992-2
52. Taberlay PC, Achinger-Kawecka J, Lun AT, Buske FA, Sabir K, Gould CM, et al. Three-dimensional disorganization of the cancer genome occurs coincident with long-range genetic and epigenetic alterations. Genome Res. (2016) 26:719–31. doi: 10.1101/gr.201517.115
53. Arnold C, Bhat P, Zaugg JB. SNPhood. investigate, quantify and visualise the epigenomic neighbourhood of SNPs using NGS data. Bioinformatics. (2016) 32:2359–60. doi: 10.1093/bioinformatics/btw127
54. Xiao Z, Ko HL, Goh EH, Wang B, Ren EC. hnRNP K suppresses apoptosis independent of p53 status by maintaining high levels of endogenous caspase inhibitors. Carcinogenesis. (2013) 34:1458–67. doi: 10.1093/carcin/bgt085
55. Wang JC, Foroud T, Hinrichs AL, Le NX, Bertelsen S, Budde JP, et al. A genome-wide association study of alcohol-dependence symptom counts in extended pedigrees identifies C15orf53. Mol Psychiatry. (2013) 18:1218–24. doi: 10.1038/mp.2012.143
56. Okada Y, Wu D, Trynka G, Raj T, Terao C, Ikari K, et al. Genetics of rheumatoid arthritis contributes to biology and drug discovery. Nature. (2014) 506:376–381. doi: 10.1038/nature12873
57. Grant SF, Qu HQ, Bradfield JP, Marchand L, Kim CE, Glessner JT, et al. Follow-up analysis of genome-wide association data identifies novel loci for type 1 diabetes. Diabetes. (2009) 58:290–5. doi: 10.2337/db08-1022
58. Hnisz D, Abraham BJ, Lee TI, Lau A, Saint-Andre V, Sigova AA, et al. Super-enhancers in the control of cell identity and disease. Cell. (2013) 155:934–47. doi: 10.1016/j.cell.2013.09.053
59. Davis LS, Hutcheson J, Mohan C. The role of cytokines in the pathogenesis and treatment of systemic lupus erythematosus. J Interferon Cytokine Res. (2011) 31:781–9. doi: 10.1089/jir.2011.0047
60. Han JW, Zheng HF, Cui Y, Sun LD, Ye DQ, Hu Z, et al. Genome-wide association study in a Chinese Han population identifies nine new susceptibility loci for systemic lupus erythematosus. Nat Genet. (2009) 41:1234–7. doi: 10.1038/ng.472
61. International Consortium for Systemic Lupus Erythematosus Group, Harley JB, Alarcon-Riquelme ME, Criswell LA, Jacob CO, Kimberly RP, Moser KL, et al. Genome-wide association scan in women with systemic lupus erythematosus identifies susceptibility variants in ITGAM, PXK, KIAA1542 and other loci. Nat Genet. (2008) 40:204–10. doi: 10.1038/ng.81
62. Javierre BM, Burren OS, Wilder SP, Kreuzhuber R, Hill SM, Sewitz S, et al. Lineage-specific genome architecture links enhancers and non-coding disease variants to target gene promoters. Cell. (2016) 167:1369–84 e1319. doi: 10.1016/j.cell.2016.09.037
63. Cairns BR. The logic of chromatin architecture and remodelling at promoters. Nature. (2009) 461:193–98. doi: 10.1038/nature08450
64. Tillo D, Kaplan N, Moore IK, Fondufe-Mittendorf Y, Gossett AJ, Field Y, et al. High nucleosome occupancy is encoded at human regulatory sequences. PLoS ONE. (2010) 5:e9129. doi: 10.1371/journal.pone.0009129
65. Wiench M, John S, Baek S, Johnson TA, Sung MH, Escobar T, et al. DNA methylation status predicts cell type-specific enhancer activity. EMBO J. (2011) 30:3028–39. doi: 10.1038/emboj.2011.210
66. Trynka G, Sandor C, Han B, Xu H, Stranger BE, Liu XS, et al. Chromatin marks identify critical cell types for fine mapping complex trait variants. Nat Genet. (2013) 45:124–30. doi: 10.1038/ng.2504
67. Pasquali L, Gaulton KJ, Rodriguez-Segui SA, Mularoni L, Miguel-Escalada I, Akerman I, et al. Pancreatic islet enhancer clusters enriched in type 2 diabetes risk-associated variants. Nat Genet. (2014) 46:136–43. doi: 10.1038/ng.2870
68. Raj T, Rothamel K, Mostafavi S, Ye C, Lee MN, Replogle JM, et al. Polarization of the effects of autoimmune and neurodegenerative risk alleles in leukocytes. Science. (2014) 344:519–23. doi: 10.1126/science.1249547
69. Heinz S, Romanoski CE, Benner C, Glass CK. The selection and function of cell type-specific enhancers. Nat Rev Mol Cell Biol. (2015) 16:144–54. doi: 10.1038/nrm3949
70. Degner JF, Pai AA, Pique-Regi R, Veyrieras JB, Gaffney DJ, Pickrell JK, et al. DNase I sensitivity QTLs are a major determinant of human expression variation. Nature. (2012) 482:390–4. doi: 10.1038/nature10808
71. Kasowski M, Kyriazopoulou-Panagiotopoulou S, Grubert F, Zaugg JB, Kundaje A, Liu Y, et al. Extensive variation in chromatin states across humans. Science. (2013) 342:750–2. doi: 10.1126/science.1242510
72. Kilpinen H, Waszak SM, Gschwind AR, Raghav SK, Witwicki RM, Orioli A, et al. Coordinated effects of sequence variation on DNA binding, chromatin structure, and transcription. Science. (2013) 342:744–7. doi: 10.1126/science.1242463
73. McVicker G, van de Geijn B, Degner JF, Cain CE, Banovich NE, Raj A, et al. Identification of genetic variants that affect histone modifications in human cells. Science. (2013) 342:747–9. doi: 10.1126/science.1242429
74. Gaffney DJ, Veyrieras JB, Degner JF, Pique-Regi R, Pai AA, Crawford GE, et al. Dissecting the regulatory architecture of gene expression QTLs. Genome Biol. (2012) 13:R7. doi: 10.1186/gb-2012-13-1-r7
75. Helgadottir A, Thorleifsson G, Manolescu A, Gretarsdottir S, Blondal T, Jonasdottir A, et al. A common variant on chromosome 9p21 affects the risk of myocardial infarction. Science. (2007) 316:1491–3. doi: 10.1126/science.1142842
76. Gaulton KJ, Nammo T, Pasquali L, Simon JM, Giresi PG, Fogarty MP, et al. A map of open chromatin in human pancreatic islets. Nat Genet. (2010) 42:255–9. doi: 10.1038/ng.530
77. Kasowski M, Grubert F, Heffelfinger C, Hariharan M, Asabere A, Waszak SM, et al. Variation in transcription factor binding among humans. Science. (2010) 328:232–5. doi: 10.1126/science.1183621
78. Cowper-Sal lari R, Zhang X, Wright JB, Bailey SD, Cole MD, Eeckhoute J, et al. Breast cancer risk-associated SNPs modulate the affinity of chromatin for FOXA1 and alter gene expression. Nat Genet. (2012) 44:1191–8. doi: 10.1038/ng.2416
79. Bauer DE, Kamran SC, Lessard S, Xu J, Fujiwara Y, Lin C, et al. An erythroid enhancer of BCL11A subject to genetic variation determines fetal hemoglobin level. Science. (2013) 342:253–7. doi: 10.1126/science.1242088
80. Bomsztyk K, Denisenko O, Ostrowski J. hnRNP K: one protein multiple processes. Bioessays. (2004) 26:629–38. doi: 10.1002/bies.20048
81. Leffers H, Dejgaard K, Celis JE. Characterisation of two major cellular poly(rC)-binding human proteins, each containing three K-homologous (KH) domains. Eur J Biochem. (1995) 230:447–53. doi: 10.1111/j.1432-1033.1995.tb20581.x
82. Tomonaga T, Levens D. Heterogeneous nuclear ribonucleoprotein K is a DNA-binding transactivator. J Biol Chem. (1995) 270:4875–81. doi: 10.1074/jbc.270.9.4875
83. Choi HS, Hwang CK, Song KY, Law PY, Wei LN, Loh HH. Poly(C)-binding proteins as transcriptional regulators of gene expression. Biochem Biophys Res Commun. (2009) 380:431–6. doi: 10.1016/j.bbrc.2009.01.136
84. Da Silva N, Bharti A, Shelley CS. hnRNP-K and Pur(alpha) act together to repress the transcriptional activity of the CD43 gene promoter. Blood. (2002) 100:3536–44. doi: 10.1182/blood.V100.10.3536
85. Michelotti GA, Michelotti EF, Pullner A, Duncan RC, Eick D, Levens D. Multiple single-stranded cis elements are associated with activated chromatin of the human c-myc gene in vivo. Mol Cell Biol. (1996) 16:2656–69. doi: 10.1128/MCB.16.6.2656
Keywords: RASGRP1, homology, ERK (extracellular-signal-regulated kinase), genetic variant, luciferase, ChIP-qPCR, EMSA (electrophoretic mobility shift assay)
Citation: Molineros JE, Singh B, Terao C, Okada Y, Kaplan J, McDaniel B, Akizuki S, Sun C, Webb CF, Looger LL and Nath SK (2019) Mechanistic Characterization of RASGRP1 Variants Identifies an hnRNP-K-Regulated Transcriptional Enhancer Contributing to SLE Susceptibility. Front. Immunol. 10:1066. doi: 10.3389/fimmu.2019.01066
Received: 02 November 2018; Accepted: 25 April 2019;
Published: 20 May 2019.
Edited by:
José Carlos Crispín, Instituto Nacional de Ciencias Médicas y Nutrición Salvador Zubirán (INCMNSZ), MexicoReviewed by:
Shinsuke Yasuda, Hokkaido University, JapanSergio Iván Valdés-Ferrer, Instituto Nacional de Ciencias Médicas y Nutrición Salvador Zubirán (INCMNSZ), Mexico
Copyright © 2019 Molineros, Singh, Terao, Okada, Kaplan, McDaniel, Akizuki, Sun, Webb, Looger and Nath. This is an open-access article distributed under the terms of the Creative Commons Attribution License (CC BY). The use, distribution or reproduction in other forums is permitted, provided the original author(s) and the copyright owner(s) are credited and that the original publication in this journal is cited, in accordance with accepted academic practice. No use, distribution or reproduction is permitted which does not comply with these terms.
*Correspondence: Swapan K. Nath, c3dhcGFuLW5hdGhAb21yZi5vcmc=
†These authors have contributed equally to this work