 Andres Garcia-Campos1
 Carolina N. Correia2
 Amalia Naranjo-Lucena1
 Laura Garza-Cuartero1
 Gabriella Farries2
 John A. Browne2
 David E. MacHugh2,3
 Grace Mulcahy1,3*
- 1UCD School of Veterinary Medicine, University College Dublin, Dublin, Ireland
- 2Animal Genomics Laboratory, UCD School of Agriculture and Food Science, University College Dublin, Dublin, Ireland
- 3UCD Conway Institute of Biomolecular and Biomedical Research, University College Dublin, Dublin, Ireland
The parasitic helminth Fasciola hepatica (liver fluke) causes economic loss to the livestock industry globally and also causes zoonotic disease. New control strategies such as vaccines are urgently needed, due to the rise of drug resistance in parasite populations. Vaccine development requires a comprehensive understanding of the immunological events during infection. Previous in vivo studies by our group have investigated global differentially expressed genes (DEGs) in ovine peripheral blood mononuclear cells (PBMC) in response to both acute and chronic F. hepatica infection. This work demonstrated that pathways involved in the pathogenesis of ovine fasciolosis included fibrosis, inhibition of macrophage nitric oxide production, and antibody isotype switching, among others. Transcriptomic changes in PBMC populations following F. hepatica infection in cattle, in which the disease phenotype is quite different, have not yet been examined. Using RNA sequencing we investigated gene expression changes in PBMC isolated from 9 non-infected and 11 F. hepatica-experimentally-infected calves immediately before infection, at 1 and at 14 weeks post-infection. Longitudinal time-course comparisons between groups revealed 21 and 1,624 DEGs driven exclusively by F. hepatica infection in cattle at acute and chronic stages, respectively. These results show that fewer DEGs at the acute stage of infection can be identified in cattle, as compared with sheep. In addition, the log2 fold-changes of these DEGs were relatively low (−1 to 3) reflecting the different clinical presentation of F. hepatica infection in cattle. Gene pathways for hepatic fibrosis and hepatic cholestasis along with apoptosis of antigen-presenting cells were enriched at chronic stages. Our results reflect the major differences in the disease phenotype between cattle and sheep and may indicate pathways to target in vaccine development.
Introduction
The liver flukes Fasciola hepatica and Fasciola gigantica are parasitic trematodes that affect cattle, sheep and goats, worldwide causing significant economic loses to agriculture (1, 2). These parasites also infect people, with most human fasciolosis cases concentrated in South America, Africa and Asia (3), although human fasciolosis has also been reported in other areas such as Turkey (4), Serbia (5), Denmark (6), and Germany (7). In addition, to ruminants and humans a wide range of other mammalian species can be infected.
Fasciola hepatica infection of the definitive host occurs after ingestion of metacercariae, the infective stage, dispersed on pasture. Once the metacercariae are in the small intestine, newly excysted juveniles (NEJs) hatch, and migrate via the peritoneum for 4–6 days (early stages of infection) until they reach the liver capsule. In the liver, juvenile flukes commence migrating and feeding throughout the liver parenchyma. In this phase, haemorrhagic tracts and also the early stages of tissue repair can be seen. Eight to ten weeks later, the flukes reach the bile ducts, where they become mature and commence egg-laying. For several decades, triclabendazole has been the drug of choice for the clearance of F. hepatica infection as it can target early immature, immature and mature flukes, unlike other flukicides. Nevertheless, the use of this drug is restricted for dairy cattle in certain countries. In addition, an increase in triclabendazole-resistant liver fluke populations is evident (8), and presents difficulties for the control of fasciolosis in farmed ruminants. Accordingly, several research projects are pursuing alternative prophylactic and therapeutic strategies including new active compounds (9) and vaccines (10). The latter are especially desirable as vaccines could reduce the use of flukicides, thus slowing the emergence of anthelmintic resistance in the future, and do not leave drug residues that present risks both to the environment and to consumers of animal products.
In order to develop an effective vaccine strategy, it is important to understand the key immunological features that the parasite triggers in the mammalian host. It has been shown that stimulation with liver fluke-derived extracts, such as excretory/secretory (ES) products and tegument, induce unbalanced Th1/Th2 responses (11–13), alternative activation of macrophages (14) and cell death (15). In addition, glycoconjugates derived from liver fluke extracts induce activation of peritoneal eosinophils (16) and apoptosis of macrophages (17). Transcriptional analysis revealed up-regulated TGFB1 following F. hepatica infection in ovine liver (18) and peripheral blood mononuclear cells (PBMC) (19, 20). This is consistent with the fibrosis seen in chronic infection in sheep, although there are indications that by 14 weeks post-infection this is limited via SMAD7 down-regulation (20). Sheep transcriptome studies also revealed differentially expressed genes (DEGs) involved in T-cell activation (19), activation of the death receptor signaling pathway and the inhibition of nitric oxide production in macrophages along with Toll-like receptor signaling pathways after F. hepatica infection (20, 21).
The use of RNA sequencing (RNA-seq) has also been useful in clarifying the underlying mechanisms involved in the immunology of fasciolosis, and in particular, how immunoregulation induced by the parasite can be overcome. For example, it has been hypothesized that the IL-18 and IL-12 complex, two important up-stream regulators, are inhibited during F. hepatica infection of sheep, and this could be responsible for switching the humoral response toward the production of IgG1 antibodies rather than IgG2 (20), as is seen during infection (22). In line with this observation, it has been shown that the involvement of genes associated with nitric oxide production, IL-12 signaling and IL-8 signaling could confer protective immunity when mice were vaccinated with T-cell epitopes derived from F. hepatica cathepsin B (23).
Cattle, along with sheep, are the primary target for a liver fluke vaccine. The disease phenotype in cattle differs significantly from that in sheep. Whereas, cattle may exhibit delayed growth and loss of productivity due to chronic infection, sheep can suffer from sudden death following heavy infection (24), as well as acute disease. Accordingly, we set out to carry out transcriptomic analysis of PBMC during the acute and chronic stages of F. hepatica infection in cattle, and to compare this with similar studies previously performed in sheep.
Materials and Methods
Ethics, Experimental Design, and Group Size Calculation
Animals and procedures carried out were approved by the UCD Animal Research Committee (AREC-16-23-Mulcahy) and licensed by the Health Products Regulatory Authority (AE18982/P098). Twenty castrated male Holstein-Friesian and crossbred Holstein-Friesian calves, 3–6 months of age, obtained from a small number of local farms with no history of F. hepatica infection were included in the study. Animals were divided into uninfected (n = 9; 4 Holstein-Friesian and 5 crossbred Holstein-Friesian) and infected (n = 11; 6 Holstein-Friesian and 5 crossbred Holstein-Friesian) groups and housed at UCD Lyons Research Farm throughout the experimental period. Calculation of the minimum number of animals required was based on Hart et al. (25) considering the following factors: two-tailed test with 90% power, minimum depth of coverage of 10 million reads per sample, fold change in expression between groups equal to 2, and the coefficient of variance of gene expression as an average of the variance of gene expression seen in the bovine atlas (26). Inclusion of animals in one group or another was based on blocking by age and breed in order to reduce confounding.
Animals were housed in two adjacent pens from 3 weeks prior to infection (W-3) to 15 weeks (W15) post-infection. In order to reduce pen housing as a confounding factor, animals from both uninfected and infected groups were mixed and allocated to each pen, while each also contained 5 Holstein-Friesian and 5 crossbred Holstein-Friesian animals. Throughout the experimental period animals were fed silage and had access to water ad libitum. Health checks were conducted daily during the study.
Experimental Infection
Sedimentation performed on fecal samples for F. hepatica eggs, and ELISA testing for the absence of F. hepatica cathepsin L1 (CL1) antibodies in sera as previously described (22) were used to demonstrate that animals were free from F. hepatica infection at the beginning of the study (W-3). Three weeks later (W0), each animal in the infected group was orally challenged with 200 F. hepatica metacercariae, Italian strain (Ridgeway Research Ltd, UK) suspended in 10 mL of distilled water. Animals in the uninfected group received 10 mL distilled water only. The viability of metacercariae was verified by excystation tests as described elsewhere (27).
Sampling Procedures
Blood samples were collected by jugular venepuncture at the day of infection (W0), but before the animals were infected; then at 1 week (W1) and at 14 weeks (W14) post-infection; using plain, EDTA, and lithium heparin-coated vacutainers. Clotted samples were centrifuged at 2,300 × g for 5 min, and the serum subsequently removed and frozen at −20°C until ELISA testing. Antibodies specific for F. hepatica CL1 were detected by ELISA as previously described (22). EDTA samples were used to obtain total and differential white cell counts using an ADVIA® 2120 hematology analyser (Siemens). Fecal samples were collected at W14 in order to detect fluke eggs, nematode eggs and lungworm larvae, using Sedimentation, McMaster and modified Baermann testing, respectively.
PBMC Isolation and RNA Extraction
Blood collected in lithium heparin tubes was used for PBMC isolation as previously described (20) with the substitution of 15 mL of Ficoll-Paque PLUS (GE Healthcare) for Histopaque 1.077 g/mL. Following evaluation of cell viability by trypan blue staining and cell counts, aliquots of 2 × 10⁷ PBMC per sample were washed and suspended in 600 μL of RLT buffer (Qiagen) supplemented with 10 μL/mL of β-mercaptoethanol. Cells were disrupted immediately by vortexing for 30 s and stored at −80°C. Total RNA was isolated using the RNeasy Plus Mini Kit (Qiagen) following the manufacturer's instructions. This kit includes a genomic DNA eliminator column. The quantity of RNA extracted was measured using a Nanodrop 1000 spectrophotometer (Thermo Fisher Scientific), and RNA quality was evaluated using an Agilent 2100 Bioanalyzer with an RNA 6000 Nano Lab Chip Kit (Agilent Technologies). All samples exhibited A260/280 ratio >2.0 and RNA integrity number (RIN) >8.
Sacrifice of Animals and Post-mortem Examination
At week 15, animals were sent to the abattoir, and livers were recovered. After gross examination of the liver parenchyma and the bile ducts the liver fluke burden was estimated for each animal as previously described (28). Mean fluke numbers collected from Holstein-Friesian and crossbred Holstein-Friesian calves of the infected group were compared with the Wilcoxon rank-sum test.
RNA Preparation and Sequencing
RNA-seq library preparation and sequencing was performed by the Brigham Young University (BYU) DNA Sequencing Center (https://dnasc.byu.edu, UT, USA). Sixty barcoded paired-end (PE) mRNA-seq libraries were prepared using a KAPA stranded mRNA-seq kit and KAPA Dual-Indexed Adapter Kit (Roche), following the manufacturer's instructions. After quality control, a pool of all 60 barcoded samples was loaded across 8 lanes of v4 chemistry high output flow cells at 2 × 125 nucleotide reads on an Illumina HiSeq 2500 Sequencing System. All RNA-seq data has been made available via the European Nucleotide Archive repository under the accession number PRJEB32022.
Differential Expression Analysis
Bioinformatics analyses were performed using scripts developed in GNU bash version 4.3.48 (http://ftp.gnu.org/gnu/bash), and R version 3.5.1 (29). All scripts can be accessed at a public GitHub repository (https://github.com/carolcorreia/Liver-Fluke-RNAseq). Deconvoluted FASTQ files were evaluated with FastQC v0.11.5 (www.bioinformatics.babraham.ac.uk/projects/fastqc). After filtering out adapter sequences, removing poor quality reads (those where more than 25% of the nucleotides had a Phred Score (Q) lower than 20) and removing PE reads which lengths were shorter than 100 nucleotides with ngsShoRT v2.2 (30), the clean FASTQ files were re-assessed with FASTQC as before. Filtered PE reads were then aligned and annotated to the bovine genome (Bos taurus_ ARS-UCD1.2) using the alignment software STAR v2.6.0c (31). After the 2-pass alignment and elimination of unmapped and multimapping reads, the gene counts were generated using the package featureCounts from the Subreads v1.5.1 software package (32). In addition, for each sample, filtered reads were subjected to variant calling for the evaluation of SNPs. The identity of samples was re-confirmed by the identity-by-state (IBS) comparison with PLINK v1.9 (33). The Z2 values between two samples were ranked and the first 60 Z2 values were used to verify whether they belonged to the same animal.
Prior to normalization of the libraries, lowly-expressed genes with <1 count per million in 9 or more libraries were discarded from further analysis. Normalization factors were then calculated using the trimmed mean of M-values with the R/Bioconductor EdgeR package v3.22.3 (34, 35). The overall data structure was reviewed with multidimensional scaling (MDS) at each time point to detect potential outliers. Two approaches were used for identification of DEGs (Figure 1A) non-paired comparisons between uninfected and infected groups at each time point and (Figure 1B) longitudinal time-course analysis of DEGs for each group and then selecting those obtained exclusively in the infected group. Model matrices were generated for each comparison. For the first approach, infection status and time point were modeled, including interaction and blocking by breed. For the second approach, separate design matrices were generated for infected vs. non-infected animals, examining interactions between infection status and time, whilst blocking by animal. For both approaches, common and trended dispersions were estimated using the Cox-Reid profile-adjusted likelihood function (36) and tagwise dispersion was estimated with the empirical Bayes method to fit negative binomial generalized linear models. DEGs were determined using the quasi-likelihood F-test (37) choosing a false discovery rate (FDR) cut-off of 5%.
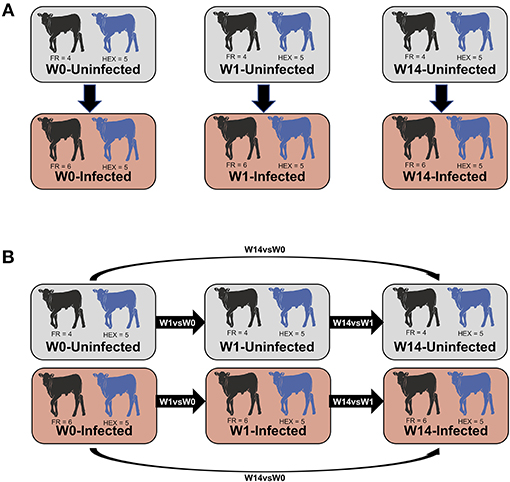
Figure 1. Summary of the comparisons used for the differential expression analysis. Non-paired comparisons between uninfected and infected groups at week 0 (W0), 1 week (W1), and 14 weeks (W14) post-experimental infection (A). Longitudinal time-course analysis of DEGs for each group between week 1 and week 0 (W1 vs. W0), week 14 and week 1 (W14 vs. W1), week 14 and week 0 (W14 vs. W0) (B). DEGs obtained exclusively in the infected group were employed for IPA downstream analysis.
Ingenuity Pathway Analysis of Differentially Expressed Genes
Genes identified as differentially expressed exclusively in the infected group using the second time course approach (Figure 1B) were analyzed using Ingenuity Pathway Analysis (IPA; Qiagen Inc., www.qiagenbioinformatics.com/products/ingenuitypathway-analysis). Human orthologs of bovine genes were searched and merged using the HGNC Comparison of Orthology Predictions (HCOP) (38). Where a bovine gene was annotated to multiple human genes just one human ortholog was used for the analysis. Detection of significant functional canonical pathways was established when the enrichment P-value was <0.05.
The IPA “upstream regulators” and “causal network” features were used to analyse upstream and master regulators. The Ingenuity Knowledge Base was used to predict the expected causal effects between upstream regulators and DEG targets. Ingenuity Knowledge Base was also used to predict the expected downstream effects due to the DEG targets by using the “disease and function” and “regulatory effect” functions. Hits were considered significant when the P-value of overlap was lower than 0.05. Z-score values > +2 or below −2 were used to predict the activation or inhibition status of the upstream and master regulator or of the increased or decreased representation of a disease or functions, as appropriate.
PCR Validation
Six genes involved in immunological or signaling pathways (IL17RB, IL1B, TNF, TGFB2, PRG3, and NOS2) were selected for validation using reverse transcription quantitative real-time PCR (RT-qPCR). For all 60 samples, cDNA was synthesized with 1.0 μg of total RNA from each sample used for the RNA-seq library preparation. The High-Capacity cDNA Reverse Transcription Kit (Applied Biosystems) was used for this purpose according to the manufacturer's instructions. After cDNA synthesis the 20.0 μL reaction was diluted 1:20 with distilled H2O prior to use. Primers were designed based on the corresponding cDNA sequences (obtained from the Ensembl database), and primer efficiencies were determined using a 1:4 dilution series over 7 points. PCR amplification specificity was assessed using melting curve analysis to confirm the presence of a single sharp peak. RT-qPCR was performed using SYBR Green Master Mix (Applied Biosystems) on a 7500 Real-Time PCR System (Applied Biosystems). All samples were analyzed in duplicate. Each 20 μL PCR reaction contained 5.0 μL diluted cDNA samples (or appropriate controls), 10.0 μL of SYBR Master Mix and 300 nM final concentration of each primer pair. Each RT-qPCR reaction was performed using the following cycling parameters: 2 min at 95°C (heat-activation step); 40 cycles of 15 s at 95°C, 1 min at 60°C. A dissociation curve was also included. The stability of eight potential reference genes (ACTB, GAPDH, H3F3A, PPIA, RPL19, RNF11, SDHA, and YWHAZ) was assessed using the GeNorm algorithm within the qBase+ software package (Biogazelle) (39, 40). H3F3A and RPL19 were shown to be the most stably expressed reference genes (M <0.14) and were used for subsequent normalization. Calibrated normalized relative quantities were calculated using the qBase+ software. Two-tailed paired sample t-tests were used to identify statistically significant gene expression changes using the same software.
Results
Confirmation of F. hepatica Infection by ELISA, Sedimentation, and Fluke Burden
Prior to the beginning of the experimental infection, all the animals were healthy and showed no signs of disease. Baermann tests were negative for all animals at W0 and W14 ruling out the presence of lungworm infection during the experimental period. Two animals, one from each group, were observed to have nematode eggs in their feces, with fecal egg counts (FECs) of 50 strongyle eggs per gram at W0. None of the animals showed evidence of anti-F. hepatica CL1 IgG1 antibodies or presence of liver fluke eggs at W0. After challenge with F. hepatica metacercariae, with viability and excystation confirmed by a 65% successful hatching rate in vitro, F. hepatica eggs were detected in nine out of eleven animals belonging to the infected group at W14. All 11 animals in the infected group seroconverted, as determined by ELISA, with O.D. values above the cut-off at W14 (Figure 2A).
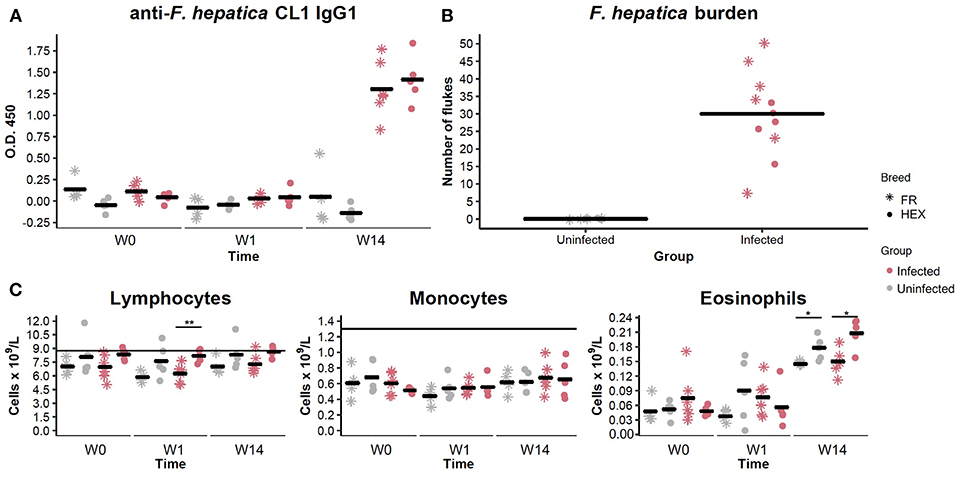
Figure 2. Evaluation of anti Fasciola hepatica Cathepsin L1 IgG1 antibodies in uninfected (shapes in gray) and infected (shapes in pink) animals by ELISA at week 0 (W0), 1 week (W1), and 14 weeks (W14) post-experimental infection. Each dot and star represents optical density (O.D.) values at 450 nm for each Holstein-Friesian crossbred and Holstein-Friesian individual, respectively. Horizontal lines represent the mean for each group and time point (A). Fluke burden found in livers and bile ducts of uninfected and infected animals 15 weeks post-infection. Each star represents numbers of F. hepatica flukes for each Holstein-Friesian animal. Each dot represents numbers of F. hepatica flukes for each Holstein-Friesian crossbred animal. Horizontal lines represent the mean for each group (B). Dynamics of the different PBMC sub-populations (lymphocytes, monocytes, and eosinophils) in uninfected (gray) and infected (pink) animals at W0, W1, and W14. Each dot and star represent absolute values that are expressed in cells × 109/L for each Holstein-Friesian crossbred and Holstein-Friesian individual, respectively. Horizontal line represents the mean for each group and time point. Dots and stars located above the horizontal line indicate that values are above the standard reference range (C). *P = 0.08 **P = 0.009.
When livers were recovered, all the infected animals were shown to harbor adult and immature F. hepatica specimens in bile ducts and liver parenchyma. Individual liver fluke counts are shown in Figure 2B. No significant differences were detected in fluke numbers between Holstein-Friesian and crossbred Holstein-Friesian animals of the infected group (Mann-Whitney U, P = 0.405). Hematological parameters were within the reference range for all the animals at W0. There were no significant differences in the numbers of lymphocytes, monocytes, and eosinophils between uninfected and infected groups at any time point. There was an increase in the eosinophil counts between W1 and W14 in both groups (Figure 2C), but values remained within the reference range. Lymphocyte numbers in infected crossbred Holstein-Friesian at W1, and eosinophil numbers in both infected and control crossbred Holstein-Friesian animals at W14, were significantly greater than comparator cohorts (Figure 2C). Infected animals showed thickening of bile ducts, fibrotic areas, and haemorrhagic tracts in the liver (Supplementary Figure S1).
Bioinformatics and Mapping to the Bovine Genome
Sequencing of the pooled RNA-seq libraries across the 8 lanes generated a mean of 29.94 million raw reads per library. From these, 87.72% (~26.24 million reads) of the reads passed the filtering steps, and a mean of 21.82 million reads uniquely mapped to the bovine genome (Supplementary Table S1). Calculation of the IBS distance between samples confirmed the correct labeling of samples throughout the experiment. Z2 values calculated between samples from different individuals were lower than 0.43 (Supplementary Table S2). Post-alignment quality control showed that libraries from all samples displayed a similar density of gene counts (Supplementary Figure S2).
Following the two approaches used for identification of DEGs (Figure 1A) non-paired comparisons between uninfected and infected groups at each time point and (Figure 1B) longitudinal time-course analysis of DEGs for each group and then selecting those obtained exclusively in the infected group, different insights were obtained. MDS showed no separation between uninfected and infected animals after F. hepatica infection at any time point. As shown in the MDS plot (Figure 3), there were clear overlaps between animals from uninfected and infected groups at each of the time-points, suggesting that infection was not the largest source of variation among animals. When the MDS plot was re-analyzed including breed as an additional factor, there was a clear separation between Holstein-Friesian and Holstein-Friesian crossbred cattle on the x-axis (BCV distance 1). Indeed, there were 3,410 DEG identified between Holstein-Friesians and crossbred Holstein-Friesian at W0 (Supplementary Table S3). Because breed was considered in the experimental design, sub-groups of each breed were analyzed separately in the MDS plot. Again, there was no separation between groups at W1 and W14, suggesting again that F. hepatica infection might not have had the largest impact on gene expression within PBMC.
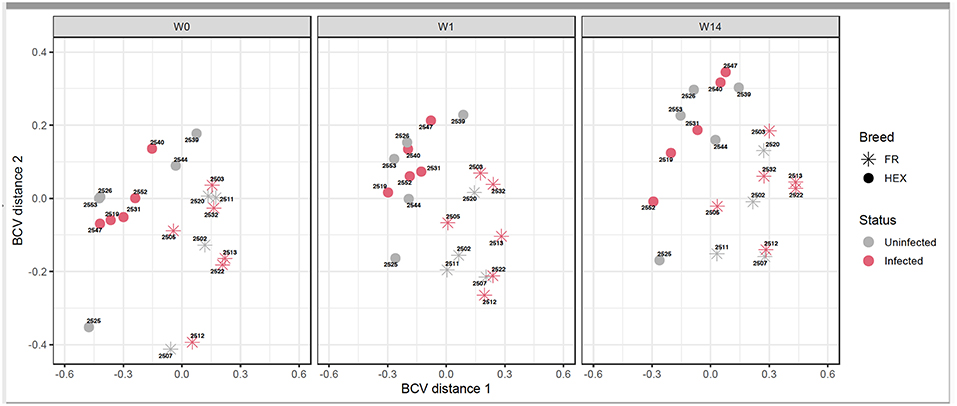
Figure 3. Multidimensional scaling of uninfected and infected Holstein-Friesian and Holstein-Friesian crossbred animals at week 0 (W0), week 1 (W1), and week 14 (W14) post F. hepatica infection. The BCV distance 1 (x-axis) and 2 (y-axis) represent the directions that separate the gene expression of the samples to the greatest extent.
Longitudinal Time-Course Contrasts Conducted Between Time-Points in Uninfected and Infected Groups Showed the Largest Numbers of DEGs at W14
For the first approach (Figure 1A), there was no distinction of DEGs between uninfected and infected animals at any time-point. Using the second approach (Figure 1B), which overcomes individual variability, we identified 21, 3,992 and 2,324 DEGs at the W1 vs. W0, W14 vs. W0, and W14 vs. W1 comparisons, respectively. The list of these DEGs is provided in Supplementary Table S4. After performing the same comparison in the uninfected group and removing the DEGs that overlapped in both groups for each of the time points (Supplementary Figure S3), 21, 1,624, and 551 DEGs were found exclusively in the infected group at W1 vs. W0, W14 vs. W0, and W14 vs. W1, suggesting that these are DEGs driven exclusively by F. hepatica infection (Supplementary Table S5). RT-qPCR results for the six genes selected confirmed the significance and trend of expression (Supplementary Table S6). For all comparisons, the magnitude of change in gene expression was relatively low. The log2 fold change (log2FC) values for the DEGs varied from −1.15 (FDR = 3.5E-04), for the nebulin gene (NEB) at the W14 vs. W0 comparison to +3.2 (FDR = 7.3E-05) for the proteoglycan 3-like gene (LOC781990) at the W14 vs. W1 comparison (Figure 4).
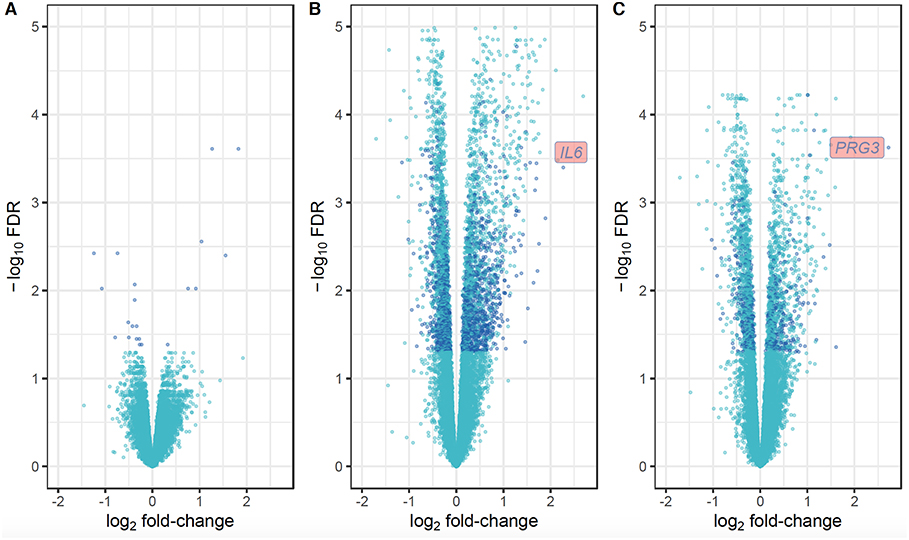
Figure 4. Volcano plots showing the extent of log2 fold-change (x-axis) and their −log10 FDR values (y-axis) for the DEGs identified in PBMC and their direction of expression driven specifically by F. hepatica infection (dark blue). Genes that did not pass the FDR threshold and those DEGs that were also identified in the uninfected group are represented in light blue. Comparison of DEGs at W1 vs. W0 (A), W14 vs. W0 (B), and W14 vs. W1 (C).
As shown in the Venn diagram (Figure 5A) there were 4 genes upregulated and 8 genes downregulated common to animals during both the acute (W1) and chronic phases (W14) of the infection compared to W0. These included the T-cell receptor alpha chain V region CTL-L17-like (LOC104970757), interleukin 1 receptor-like 1 (IL1RL1), choline dehydrogenase (CHDH), and the antioxidant 1 copper chaperone (ATOX1) genes, which were upregulated, and the transportin 2 (TNPO2), TGFB induced factor homeobox 1 (TGIF1), Ras association domain family member 1 (RASSF1), tubulin beta 2A class IIa (TUBB2A), LIM domains containing 1 (LIMD1), HIC ZBTB transcriptional repressor 1 (HIC1), TNF receptor superfamily member 13C (TNFRSF13C) and the SHC binding and spindle associated 1 like (SHCBP1L) genes, which were downregulated. As summarized in Table 1, although changes in the expression of these genes were already detected at the acute stage their expression did not change significantly during the course of the infection except for the T-cell receptor alpha chain V region CTL-L17-like gene. Indeed, this was the only gene whose expression significantly decreased from the acute to the chronic phase of infection (W1: log2FC = 1.26, FDR = 2.5E-04; W14: log2FC = 0.62, FDR = 6.6E-03; Figure 5B). Other DEGs such as the proteoglycan 3 gene (PRG3), the previously mentioned proteoglycan 3-like, arachidonate 15-lipoxygenate gene (ALOX15), the C-C motif chemokine ligand 20 gene (CCL20), interleukin genes (IL1B, IL2RA, and IL4I1) and nitric oxide synthase gene (NOS2) were also upregulated at this stage. The DEGs identified at the W14 vs. W0 comparison included upregulated interleukin genes (IL6, IL1B), TLR4, C-C chemokine ligand genes (CCL20, CCL3, CCL2, CCL8, CCL4), colony stimulation factor genes (CSF2) the transforming growth factor beta induced gene (TGFBI), tumor necrosis factor gene (TNF), COL7A1, COL14A1, and PLOD1, among others.
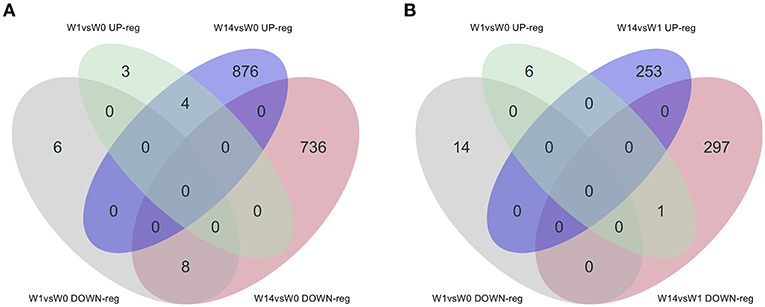
Figure 5. Venn diagrams showing the numbers of DEGs identified in PBMC and their direction of expression driven specifically by F. hepatica infection. Comparison of DEGs from W1 vs. W0 with W14 vs. W0 (A) and W1 vs. W0 with W14 vs. W1 (B). Downregulated genes are shown in gray and pink, upregulated genes in green and blue.
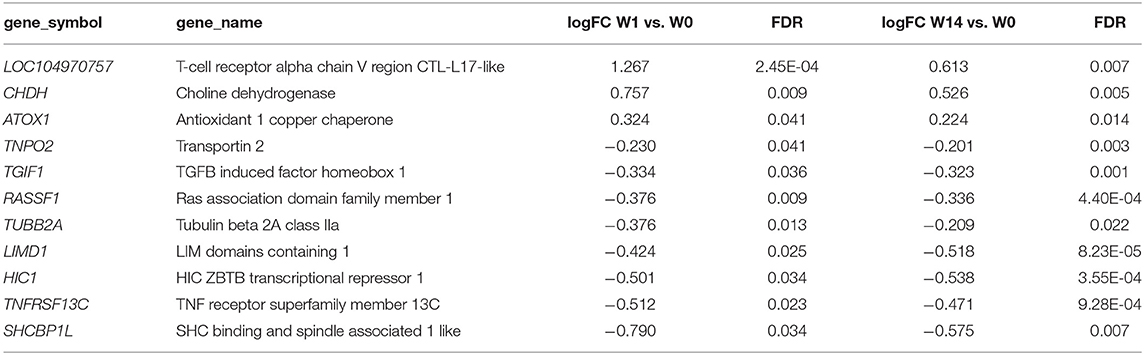
Table 1. Common DEGs identified in PBMC at acute (W1 vs. W0) and chronic (W14 vs. W0) stages of Fasciola hepatica infection in cattle.
Hepatic Fibrosis and Hepatic Cholestasis Are Some of the Canonical Pathways Detected at the Chronic Stage
The IPA analysis identified 27 and 98 enriched canonical pathways at W1 vs. W0 and W14 vs. W1, respectively, with 10 pathways in common for both comparisons (Supplementary Table S7). A list of the most relevant canonical pathways for each time-point are shown in Table 2. The 14-3-3-mediated signaling pathway, IL-10 signaling, Toll-like receptor signaling, TGF-β signaling, STAT3 pathways, IL-6 signaling and Th2 pathway were seen to be enriched for the W1 vs. W0 comparison, although their activation or inhibitory status could not be predicted. There were 8 pathways activated and 25 inhibited at W14 compared to W0. Ten canonical pathways that were also detected as enriched at W1, including IL-6, IL-10, and Toll-like receptor signaling, were also enriched at this stage. However, new enriched canonical pathways such as hepatic cholestasis and hepatic fibrosis/hepatic stellate cell activation were also identified. Within the inhibited canonical pathways were CD40, apoptosis signaling, TNFR1 signaling, hepatic growth factor (HGF) signaling and death receptor signaling. The production of nitric oxide and reactive oxygen species in macrophages had a trend toward inhibition with a z-score value very close to the threshold (−0.83).
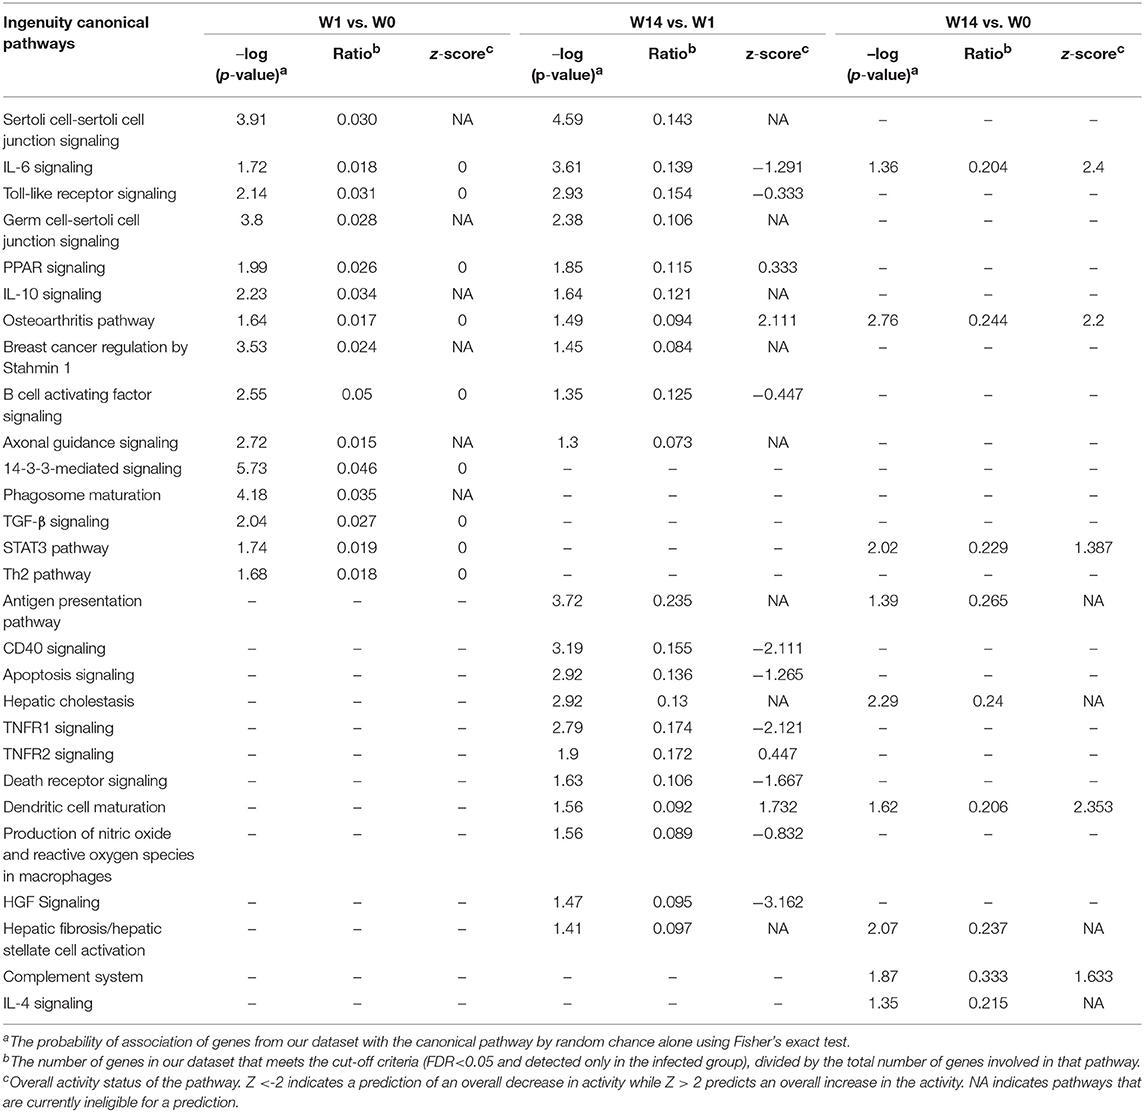
Table 2. Common canonical pathways in PBMC at acute (W1 vs. W0) and chronic (W14 vs. W1, W14 vs. W0) stages of F. hepatica infection in cattle.
Activation of Apoptosis of Antigen-Presenting Cells Is One the Main Regulator Effects Identified in the Chronicity of F. hepatica Infection
When the presence and nature of upstream and master regulators was evaluated, that is, genes that can interfere with the transcription of other genes at different levels, IL-10 was the only upstream regulator whose z-score value (1.715) was predicted in the W1 vs. W0 comparison. It was possible to identify the activation status of 105 and 27 genes at W14 vs. W0 and W14 vs. W1 (Supplementary Table S8). The upstream regulators common to both comparisons were the activation status of IL-1B, APP, TNF, and TLR7 and the inhibition of dual specificity phosphatase 1 (DUSP1) (Table 3). IL-10 was also predicted in both comparisons with an inhibitory trend but did not reach the z-score cut-off. In terms of prediction of regulatory effects, DEGs of the W14 vs. W1 comparison clustered within 5 primary groups (Table 4). The cluster with the highest consistency score predicted that the inhibition of the master regulator DUSP1, the inhibition of the upstream regulator mir-155 and the activation of the upstream regulators STAT3 and APP lead to the downstream effects of activation of apoptosis of antigen-presenting cells, migration of phagocytes and mononuclear leukocytes, recruitment of myeloid cells and phagocytes and chemotaxis (Figure 6).
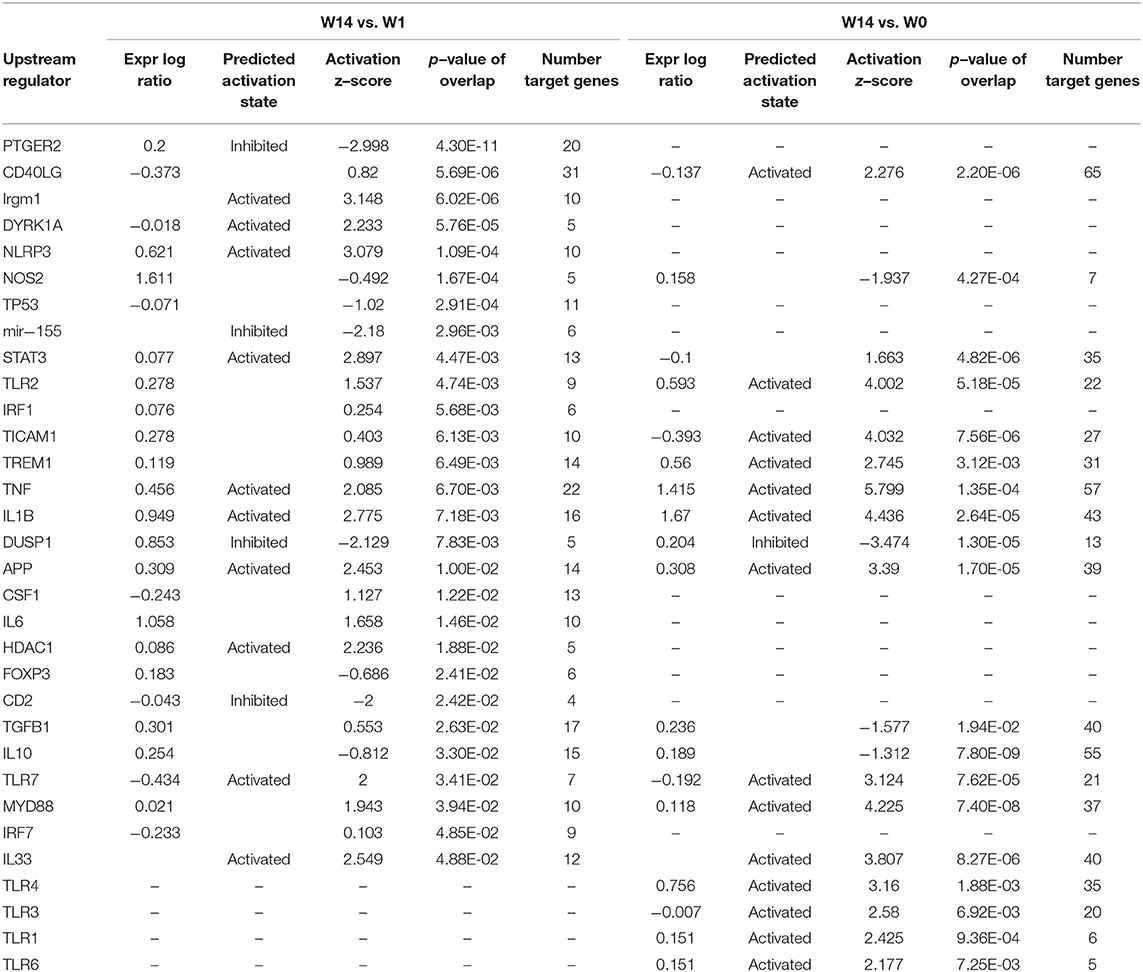
Table 3. Selection of upstream regulators in PBMC at chronic stages of F. hepatica infection.
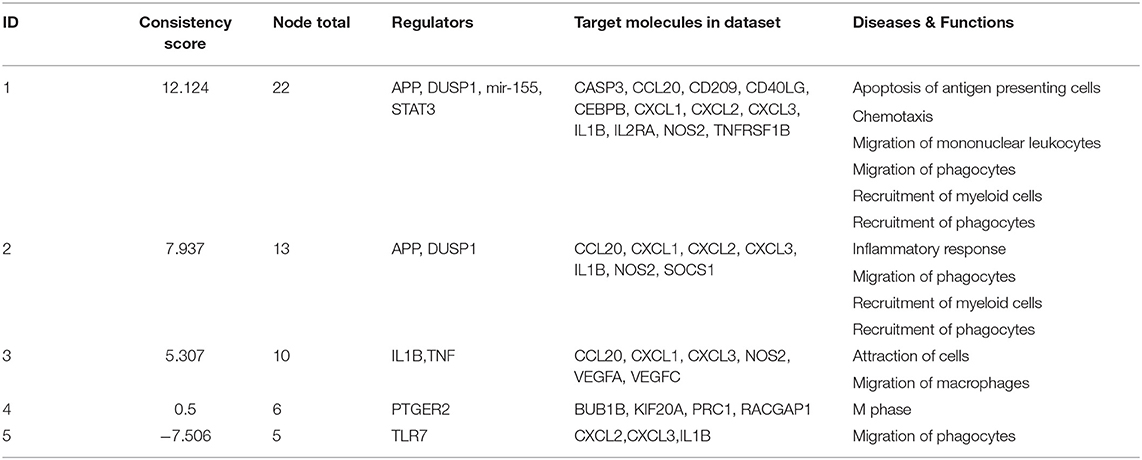
Table 4. Prediction of regulatory effects in PMBC during chronic (W14 vs. W1) F. hepatica infection.
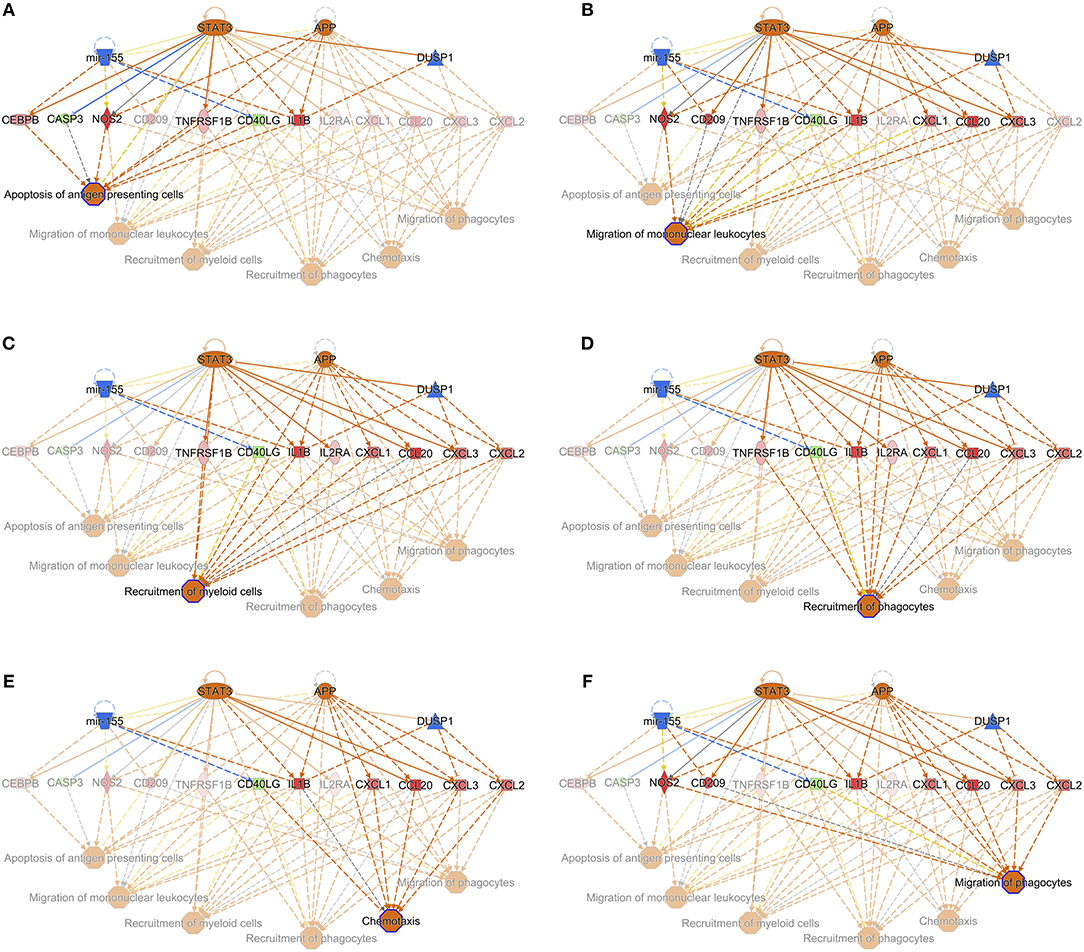
Figure 6. Interaction of the upstream regulators for the activation of apoptosis of antigen presenting cells (A), migration of mononuclear leukocytes (B), recruitment of myeloid cells (C), recruitment of phagocytes (D), chemotaxis (E), and migration of phagocytes (F) in PBMC of F. hepatica-infected animals at the W14 vs. W1 timepoint. STAT3 and APP are indicated as activated (orange), whereas mir-155 and DUSP1 are inhibited (blue). Downstream target genes are highlighted as upregulated (red) or downregulated (green) with color intensity increasing with degree of log2 fold-change. Arrowheads at the end of interactions (dotted lines) indicate activation, while bars indicate inhibitory effects. The color of lines represents predicted relationships based on gene expression, including orange (activation), blue (inhibition), yellow (findings inconsistent with state of downstream molecule), and gray (effect not predicted). © 2000–2019 QIAGEN. All rights reserved.
Discussion
Due to the economic importance of F. hepatica infection in animal agriculture, and anthelmintic resistance concerns, there is an urgent need for the development of novel control methods such as vaccination. To date, inconsistent results have been obtained in ruminant vaccine trials with a wide repertoire of recombinant proteins (10). Even though considerable work has been undertaken to understand the immune response to F. hepatica infection, along with the immunoregulatory effects induced in infected animals, there are still many gaps in our knowledge, which could be important for the design of new vaccine strategies. In this regard, transcriptomics using technologies such as RNA-seq, represents a key tool in bridging these knowledge gaps.
To the best of the authors' knowledge this is the first transcriptomics analysis conducted in cattle (Bos taurus) investigating the immunological changes in PBMC following F. hepatica infection. The immunological effects triggered by the parasite can be detected in PBMC as “echoes” of the events occurring locally in the peritoneal cavity and the liver at the acute and chronic phases of the infection, respectively.
In this study, the phenotypic hallmarks of hepatic fibrosis and cholestasis in the chronic phases of F. hepatica infection in cattle were reflected in the altered gene expression changes seen at W14 in the infected animals. Although no differences in the numbers of eosinophils in peripheral blood were seen between infected and uninfected groups, PRG3, whose transcription and translation leads to eosinophil major basic protein, was the second most highly upregulated gene observed at the W14 compared to W1. Up-regulation of PRG3 was also detected in ovine PBMC at 2 and 8 weeks post F. hepatica-infection (19) indicating a greater degree of eosinophil activation in infected animals.
It was somewhat surprising that the MDS plots in this study did not show a clear separation according to F. hepatica infection status. While sample identity verification tools have been widely used in humans and mice (41), no such tools have been developed for cattle as yet. Therefore, to validate that the ambiguous MDS plot results were not a consequence of sample mislabelling in our study SNPs derived from RNA-seq were used to calculate IBS distances and verify animal identity across time points. Animals were not exposed to F. hepatica previously and they only received one infective dose of metacercariae. It is known that small repeat infections, similar to those which occur naturally (12), produce more severe pathology than a single infective dose with equal numbers of metacercariae in cattle (42); therefore, stronger infection effect might have been observed on the MDS analysis if trickle infections had been used. MDS plots also suggest that there could be intrinsic confounders, such as breed (43), temporal changes affecting animal development, or additional environmental factors that could have had a higher impact on gene expression than infection status. This emphasizes the importance of including an uninfected time course control in these types of studies. Almost 50% of the DEGs identified at the time-course comparisons W14 vs. W0 and W14 vs. W1 were observed in both infected and uninfected animals, all of them with the same direction of expression. We consider that the use of animals aged 3–6 months of age, as a primary target group of any novel anti-fluke vaccine, was appropriate. However, it is possible that greater temporal variation in expression levels of genes related to growth and development in this cohort, as compared with adult animals, may be relevant to the interpretation of the results, and that decreases in γδ T-cell levels, for example, as animals age, may affect the immune response. As no concurrent diseases were detected and animals were housed and managed in identical conditions throughout the experimental period, we were able to identify a subset of DEGs due to F. hepatica infection. Particular attention must be attributed to breed as it is known that differences in animal susceptibility and immunological features vary across breeds. For example, differences in nitric oxide production by macrophages after in vitro stimulation of the Brown Swiss cattle breed compared to Holstein-Friesian have been demonstrated (44) and relative resistance of the Indonesian thin tail sheep breed against F. gigantica (45) has been documented. Changes in global gene expression involved in some biological pathways, including immune responses, from different cattle breeds in leukocytes (46) have also been demonstrated. In our study, 3,410 DEGs were identified between Holstein-Friesian and crossbred Holstein-Friesian cattle, and the MDS plot also confirmed breed as a significant driver of variation. However, this breed effect could be mitigated in the experimental design as equal numbers of animals of each breed per group were included. As there were no significant differences in the liver fluke burden between the two breeds (P = 0.405) no further evaluation of the DEGs between the Holstein-Friesian and crossbred Holstein-Friesian groups in response to infection was conducted. However, further studies should be designed, with more biological replicates per breed, in order to confirm whether breed should be considered as an important factor in investigating response to F. hepatica infection. This requirement is further highlighted by differences between the two breeds in terms of their lymphocyte eosinophil counts at specific timepoints.
The clinical consequences of fasciolosis differ markedly between cattle and sheep, with the latter suffering potential acute consequences, and mortality, whereas in cattle disease is usually chronic (2). In comparing the results of this study with those in a previous study in sheep (20), parallel differences between the transcriptomic responses in the two species are striking. It is not possible to conclude definitively that these differences do not arise, at least in part, from variation in experimental protocol (comparative level of challenge, for example). However, in neither case the level of challenge was sufficient to produce clinical signs, so we suggest that this evidence indicates two clear differences in the response to F. hepatica between cattle and sheep. The first key difference is the proportion of DEGs detected at acute vs. chronic phases with F. hepatica responsible for almost 5% of the total DEGs at the acute phase in cattle whereas in sheep this percentage increases to more than 70% for the same time period (19, 20). In cattle, most of the DEGs were observed at the chronic stage of infection. This indicates that when immature flukes penetrate the gut and migrate through the peritoneum of cattle, relatively few changes in gene expression in PBMC are triggered. However, when flukes are migrating through the liver parenchyma and into the bile ducts, they induce a greater number of gene-expression changes. This accurately reflects the different clinical presentations of fasciolosis between the two species. Whereas, sheep are susceptible to acute disease that can be fatal, fasciolosis in cattle has a much more muted clinical presentation, where animals in most cases appear clinically-normal even though they may experience production losses (47) and bystander immunoregulation (12, 48). The second key difference is the magnitude of the log2FC in response to infection. In cattle, log2FC in DEGs at the different time-points varied from −1 to 3 whereas in sheep log2FC up to 22 in PBMCs (20) and 14 in liver tissue (18) were observed. These results also reflect differences in the disease phenotype between these two host species. A study in water buffalo found DEGs with log2FC varying from −5 to 5 from liver tissue at chronic stages of F. gigantica infections (49), comparable to the magnitude of log2FC detected in the present study.
Apart from the two main differences between cattle and sheep outlined above, a combination of information from the DEGs, canonical pathways, upstream regulators, and regulatory effects detected pinpoint immunological events in bovine fasciolosis.
Polarized T-Helper and Immune Responses
This study shows that the Th2 response pathway is enriched after only 1 week of F. hepatica infection. Due to the low numbers of DEGs found at W1, no clear mechanisms related to T-cell responses can be detected at this acute stage of infection, but more information can be deduced from effects after chronic infection. For instance, upregulation of the IL6 and IL4I1 genes and involvement of IL-4 signaling pathways is characteristic of a skewed Th2 response (50) and this response is typically driven by chronic F. hepatica infection (48). The fact that the activation status of IL-10 as an upstream regulator changed from an activated trend at W1 toward an inhibitory trend at W14 suggests that during the acute phase the immune response in cattle is a more balanced Treg-Th2 response, with increased polarization toward a Th2 response during chronic stages.
The expression of the intercellular adhesion molecule 1 gene (ICAM1), which contributes to recruitment of circulating leukocytes to infection sites and stabilizes cell-target interactions (51), was also upregulated at W14. The same effect was observed in buffaloes but at the acute phase of the infection (49). This could reflect that at chronic stages, there is a need to recruit cells to the site of parasite development to clear the infection. The soluble molecules sICAM-1 have been seen to be increased in complicated cases of humans infected with F. gigantica (52).
The class II major histocompatibility complex (MHC-II) transactivator gene (CIITA) is downregulated at the chronic stage of the infection. The CIITA protein is known to be a positive regulator of MHC-II gene transcription (53). Consequently, downregulation of CIITA could explain the fact that gene expression of the MHC-II DO beta gene (BOLA_DOB) is downregulated at the same period (log2FC = −0.323). Therefore, antigenic components from F. hepatica could interfere with maturation of antigen presentation cells and in the cross-talk to CD4 T-cells in cattle. Suppression of MHC-II has been described as an effect of fasciolosis in murine peritoneal dendritic cells (54, 55) and in water buffalo (49).
We observed upregulation of TLR2, TLR4, and downregulation of TLR10 at the chronic stages of infection. This is consistent with previous findings—for example, increased expression of TLR2 gene by PBMC from F. hepatica-infected cattle for 8 weeks (56), of TLR4 protein by the mucin-derived peptide from F. hepatica (57) and downregulation of TLR10 gene in ovine PBMC (20). Nevertheless, Toll-like receptor signaling had a trend of inhibition in the time period from the acute to chronic fasciolosis, suggesting that F. hepatica could somehow overcome and interfere in the downstream effect triggered by increased TLR2 and TLR4. The suppression of TLR4 and TLR functions by antigenic components such as one of the F. hepatica fatty acid binding proteins (58) and glycoconjugates (59) has previously been reported. We also observed the activation of TLR7 in the time period from the acute to chronic fasciolosis in cattle. Activation of TLR7 gene has been reported in chronic stages of F. gigantica infection in water buffalos (60). The TLR7 receptor protein has been reported to mediate early innate immune responses in malaria (61) and it can contribute to the proliferation and activation of B cells and promotion of Th2 responses.
Liver Fibrosis
Hepatic fibrosis and hepatic cholestasis are clear clinical features seen in chronic fasciolosis. Previous studies have shown that TGFB1 is one of the main molecules orchestrating hepatic fibrosis after F. hepatica infection in sheep (18, 20, 62) and in cattle (63). Here, we detected the downregulation of TGIF1 as early as 1 week post-infection. This gene encodes a repressor of SMAD2 which leads to a controlled cell proliferation in acute liver injury (64). The plasminogen activator inhibitor-1 (PAI-1), which encodes a molecule with high fibrotic activity (65), was detected in ovine fasciolosis (20), and upregulated after 14 weeks of infection. Upregulation of TGFB1, TGFB2, COL1A1, and COL3A1 were found at W14 post-infection but in both infected and uninfected groups, suggesting that there may be alternative mechanisms for hepatic fibrosis in liver fluke-infected cattle. We suggest that the “fibrosis of liver” downstream effect could have been initiated at the chronic stage by the upregulation of TNF and that TGFB1 would contribute to the fibrotic effect at more advanced stages. Further work comparing TNF and TGFB1 changes from W14 onwards of F. hepatica infection would clarify the fibrosis events in cattle. TNF leads to the upregulation of the TNF gene, and the IL6 (66–68), urokinase-type plasminogen activator (PLAU) (69), SERPINE1, TNFRSF1A, SOCS1, and cathepsin B (CTSB) genes responsible for the fibrosis downstream effect (Figure 7). In addition, TNF activates IL1B, which also contributes to the upregulation of TLR4 and IL6. Upregulation of IL1B in water buffalos after 10 weeks of F. gigantica infection has previously been observed (49). Upregulation of TNF is also consistent with previous findings in sheep PBMC (20) and liver tissue (18) but not with other in vitro studies following incubation of F. hepatica antigens with human cells (70), murine cells in vivo and in vitro (58) and the bovine macrophage cell line BOMA in vitro (71). Discrepancies in TNF production between studies could be due to the differences in cell type populations when evaluated in vitro and in vivo, differences in parasite susceptibility between hosts and the antigen composition employed in each case. The activation of hepatic stellate cells by IL6/STAT3 to promote liver fibrosis has been documented in F. hepatica infection in humans and mice (72) which is in line with our findings in terms of the activation status of the IL6 and STAT3 signaling pathways at W14.
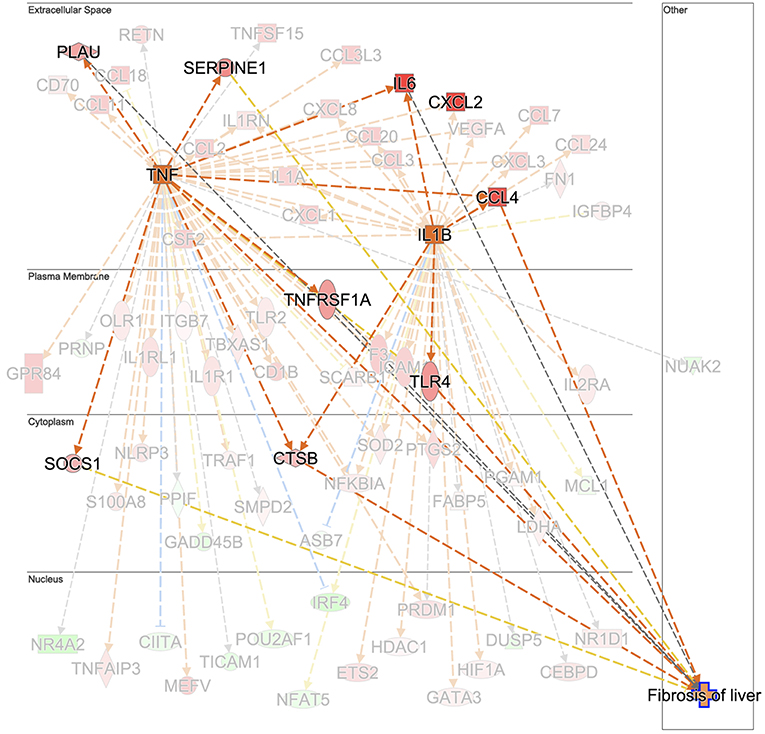
Figure 7. Prediction of TNF and IL1B as the upstream regulator cascade involved in hepatic fibrosis in animals experimentally infected with F. hepatica at 14 weeks post-infection. TNF is indicated as activated (orange square). Downstream target genes are highlighted as upregulated (red) or downregulated (green) with color intensity increasing with degree of log2 fold-change. Genes are illustrated according to the subcellular location of proteins translated from respective genes. Downstream target genes that do not have an effect in liver fibrosis are shaded in the background. Arrowheads at the end of interactions (dotted lines) indicate activation, while bars indicate inhibitory effects. The colors of lines represent predicted relationships based on gene expression, including orange (activation), blue (inhibition), yellow (findings inconsistent with state of downstream molecule), and gray (effect not predicted). © 2000–2019 QIAGEN. All rights reserved.
Apoptosis
Fasciola hepatica infection is known to induce apoptosis in peritoneal leukocytes (73), as well as in liver eosinophils (74), and in PMBC (20, 21) in sheep. In the case of ovine PBMC, the activation of the extrinsic apoptosis pathway by the up-regulation of TNF and TNFR1/TNFR2 genes (20) and the potential association of the intrinsic apoptosis pathway with the BH3-only member genes BIK, BNIP1, and BLC2L11 (21) has been postulated. In this study, apoptosis, and death receptor signaling pathways trended toward inhibition at W14. A close analysis reveals that activation of apoptosis of antigen presenting cells is one of the clearest regulatory effects, seen in combination with the migration of mononuclear leukocytes and migration and recruitment of phagocytes, orchestrated by the inhibitory effect of DUSP1 and mir-155 and by the activation of STAT3 and APP regulators. Although activation of STAT3 is known to reduce apoptosis, it could contribute to the upregulation of IL1B in combination with APP, mir-155, and DUSP1. Although DUSP1 was not detected as a DEG in this study it did trend toward upregulation (Log2FC = 0.263, FDR = 2.94E-01). Moreover, DUSP4 and DUSP16, were also observed to be upregulated. Other members of the DUSP gene family were upregulated in ovine PMBC at 2 and 8 weeks post-infection, respectively (19). Upregulation of DUSP13 has been shown in a bovine macrophage cell line stimulated with ES products from two F. hepatica isolates (71). DUSP13 inactivates important cell signaling mediators (JNK, p38, and ERK kinases as well as the transcription factor AP-1), which may lead to reduced inflammation (75).
Conclusions
In conclusion, this is the first in-depth transcriptomic analysis conducted in cattle for the assessment of the immune response against F. hepatica infection. This study pinpoints significant differences in terms of numbers of DEGs and the magnitude of transcriptional responses between cattle and sheep at the acute and chronic stages of infection. These differences are consistent with the different presentations of infection in these two species. It also predicts the potential role of TNF, IL-6, and IL-1B, in the development of early hepatic fibrosis events where TGF-β is not the key player. Apoptosis of antigen presenting cells is orchestrated by mir-155 and the products of the STAT3, APP, and DUSP1 genes at the chronic stages, demonstrating novel mechanisms triggering apoptosis during F. hepatica infection in cattle. This analysis is of pivotal importance for the better understanding of the immune response against F. hepatica in cattle, and for the development of novel Fasciola vaccines, where overcoming parasite-immunoregulatory strategies will be key to success.
Data Availability
The datasets generated for this study can be found in the European Nucleotide Archive Repository|PRJEB32022.
Author Contributions
AG-C, JB, and GM conceived and designed the experiments. AG-C, AN-L, and LG-C collected samples from animals and carried out PBMC isolation. AG-C performed lab work and analyzed data. JB supported lab work. CC, GF, and DM assisted in data analyses and bioinformatics. AG-C and GM contributed to the writing of the manuscript. GM, JB, CC, GF, and DM contributed to the editing of the manuscript critically for important intellectual content. All authors read and approved the final manuscript.
Funding
This work was funded by a Science Foundation Ireland grant to GM (14/IA/2304). Related work under EU H2020 Project PARAGONE (Grant Number 635408) and Department of Agriculture, Food and the Marine (DAFM) US-Ireland R&D Partnership (Grant Number 17/RD/US-ROl/52).
Conflict of Interest Statement
The authors declare that the research was conducted in the absence of any commercial or financial relationships that could be construed as a potential conflict of interest.
Acknowledgments
The authors would like to thank Edward Jordan and farm staff for the care of the animals during the experimental infection.
Supplementary Material
The Supplementary Material for this article can be found online at: https://www.frontiersin.org/articles/10.3389/fimmu.2019.02081/full#supplementary-material
Supplementary Figure 1. Evaluation of liver capsule, parenchyma and bile ducts in livers of uninfected (top) and infected (bottom) animals. Fibrotic areas and thickness of bile ducts are indicated by arrows.
Supplementary Figure 2. Expression density of gene counts for the individual samples in each time point after filtering. This plot shows that each sample follows the same trend thus there is no evidence of any poor quality or outlier libraries.
Supplementary Figure 3. Venn diagrams showing the numbers of DEGs in identified in PBMC and their direction of expression in uninfected and F. hepatica infected animals. Comparison of DEGs from W1 vs. W0 (A), W14 vs. W0 (B) and W14 vs. W1 (C). Downregulated genes are shown in gray and pink, upregulated genes in green and blue.
Supplementary Table 1. Reads from pooled RNA-seq libraries uniquely mapping to the bovine genome.
Supplementary Table 2. Confirmation of identification of samples corresponding to each individual animal.
Supplementary Table 3. DEGS identified between Holstein-Friesian and Holstein-Friesian crossbreds.
Supplementary Table 4. DEGs identified between the W0, W1, and W14 timepoints.
Supplementary Table 5. DEGs identified exclusively in infected animals between each timepoint comparison, and hence driven by F. hepatica infection.
Supplementary Table 6. RT-qPCR validation of six genes from the DEG dataset.
Supplementary Table 7. Enriched canonical pathways identified by IPA analysis.
Supplementary Table 8. Activation status of upstream regulators identified in comparisons of W1 vs W0 (A), W 14 vs. W0 (B) and W14 vs. W1 (C).
References
1. Schweizer G, Braun U, Deplazes P, Torgerson PR. Estimating the financial losses due to bovine fasciolosis in Switzerland. Vet Rec. (2005) 157:188–93. doi: 10.1136/vr.157.7.188
2. Beesley NJ, Caminade C, Charlier J, Flynn RJ, Hodgkinson JE, Martinez-Moreno A, et al. Fasciola and fasciolosis in ruminants in Europe: Identifying research needs. Transbound Emerg Dis. (2018) 65(Suppl 1):199–216. doi: 10.1111/tbed.12682
3. Hotez PJ, Brindley PJ, Bethony JM, King CH, Pearce EJ, Jacobson J. Helminth infections: the great neglected tropical diseases. J Clin Invest. (2008) 118:1311–21. doi: 10.1172/JCI34261
4. Boşnak VK, Karaoglan I, Sahin HH, Namiduru M, Pehlivan M, Okan V, et al. Evaluation of patients diagnosed with fascioliasis: a six-year experience at a university hospital in Turkey. J Infect Dev Ctries. (2016) 10:389. doi: 10.3855/jidc.6681
5. Pavlović M, Dakić Z, Milosević B, Korać M, Brmbolić B, Dzamić A. Human case of fasciolosis in Serbia treated with triclabendazole. Vojnosanit Pregl. (2014) 71:202–6. doi: 10.2298/VSP1402202P
6. Stensvold CR, Tilma J, Tilma J, Tilma K. [Fasciola hepatica infection acquired in Denmark]. Ugeskr Laeger. (2018) 180:V06180395.
7. Salzer HJF, Schmiedel S. Fasciola hepatica in a German traveler returning from Thailand. J Travel Med. (2015) 22:285–6. doi: 10.1111/jtm.12205
8. Kelley JM, Elliott TP, Beddoe T, Anderson G, Skuce P, Spithill TW. current threat of triclabendazole resistance in Fasciola hepatica. Trends Parasitol. (2016) 32:458–69. doi: 10.1016/j.pt.2016.03.002
9. Whiteland HL, Chakroborty A, Forde-Thomas JE, Crusco A, Cookson A, Hollinshead J, et al. An Abies procera-derived tetracyclic triterpene containing a steroid-like nucleus core and a lactone side chain attenuates in vitro survival of both Fasciola hepatica and Schistosoma mansoni. Int J Parasitol Drugs Drug Resist. (2018) 8:465–74. doi: 10.1016/j.ijpddr.2018.10.009
10. Molina-Hernández V, Mulcahy G, Pérez J, Martínez-Moreno Á, Donnelly S, O'Neill SM, et al. Fasciola hepatica vaccine: we may not be there yet but we're on the right road. Vet Parasitol. (2015) 208:101–11. doi: 10.1016/j.vetpar.2015.01.004
11. O'Neill SM, Mills KHG, Dalton JP. Fasciola hepatica cathepsin L cysteine proteinase suppresses Bordetella pertussis-specific interferon-gamma production in vivo. Parasite Immunol. (2001) 23:541–7. doi: 10.1046/j.1365-3024.2001.00411.x
12. Clery D, Torgerson P, Mulcahy G. Immune responses of chronically infected adult cattle to Fasciola hepatica. Vet Parasitol. (1996) 62:71–82. doi: 10.1016/0304-4017(95)00858-6
13. Mulcahy G, O'Connor F, Clery D, Hogan SF, Dowd AJ, Andrews SJ, et al. Immune responses of cattle to experimental anti-Fasciola hepatica vaccines. Res Vet Sci. (1999) 67:27–33. doi: 10.1053/rvsc.1998.0270
14. Adams PN, Aldridge A, Vukman K V, Donnelly S, O'Neill SM. Fasciola hepatica tegumental antigens indirectly induce an M2 macrophage-like phenotype in vivo. Parasite Immunol. (2014) 36:531–9. doi: 10.1111/pim.12127
15. Ferreira S, Fernandes R, Botelho MC. Fasciola hepatica extract induces cell death of mammalian cells. Anti-Infective Agents. (2018) 16:144–6. doi: 10.2174/1570180815666180531102555
16. Serradell MC, Guasconi L, Cervi L, Chiapello LS, Masih DT. Excretory-secretory products from Fasciola hepatica induce eosinophil apoptosis by a caspase-dependent mechanism. Vet Immunol Immunopathol. (2007) 117:197–208. doi: 10.1016/j.vetimm.2007.03.007
17. Guasconi L, Serradell MC, Masih DT. Fasciola hepatica products induce apoptosis of peritoneal macrophages. Vet Immunol Immunopathol. (2012) 148:359–63. doi: 10.1016/j.vetimm.2012.06.022
18. Alvarez Rojas CA, Ansell BRE, Hall RS, Gasser RB, Young ND, Jex AR, et al. Transcriptional analysis identifies key genes involved in metabolism, fibrosis/tissue repair and the immune response against Fasciola hepatica in sheep liver. Parasit Vect. (2015) 8:124. doi: 10.1186/s13071-015-0715-7
19. Alvarez Rojas CA, Scheerlinck JP, Ansell BRE, Hall RS, Gasser RB, Jex AR. Time-course study of the transcriptome of peripheral blood mononuclear cells (PBMCs) from sheep infected with Fasciola hepatica. PLoS ONE. (2016) 11:e0159194. doi: 10.1371/journal.pone.0159194
20. Fu Y, Chryssafidis AL, Browne JA, O'Sullivan J, McGettigan PA, Mulcahy G. Transcriptomic study on ovine immune responses to Fasciola hepatica infection. PLoS Negl Trop Dis. (2016) 10:e0005015. doi: 10.1371/journal.pntd.0005015
21. Fu Y, Browne JA, Killick K, Mulcahy G. Network analysis of the systemic response to Fasciola hepatica infection in sheep reveals changes in fibrosis, apoptosis, toll-like receptors 3/4, and B cell function. Front Immunol. (2017) 8:485. doi: 10.3389/fimmu.2017.00485
22. Golden O, Flynn RJ, Read C, Sekiya M, Donnelly SM, Stack C, et al. Protection of cattle against a natural infection of Fasciola hepatica by vaccination with recombinant cathepsin L1 (rFhCL1). Vaccine. (2010) 28:5551–7. doi: 10.1016/j.vaccine.2010.06.039
23. Rojas-Caraballo J, López-Abán J, Moreno-Pérez DA, Vicente B, Fernández-Soto P, del Olmo E, et al. Transcriptome profiling of gene expression during immunisation trial against Fasciola hepatica: identification of genes and pathways involved in conferring immunoprotection in a murine model. BMC Infect Dis. (2017) 17:94. doi: 10.1186/s12879-017-2205-3
25. Hart SN, Therneau TM, Zhang Y, Poland GA, Kocher J-P. Calculating sample size estimates for RNA sequencing data. J Comput Biol. (2013) 20:970–8. doi: 10.1089/cmb.2012.0283
26. Harhay GP, Smith TP, Alexander LJ, Haudenschild CD, Keele JW, Matukumalli LK, et al. An atlas of bovine gene expression reveals novel distinctive tissue characteristics and evidence for improving genome annotation. Genome Biol. (2010) 11:R102. doi: 10.1186/gb-2010-11-10-r102
27. Garcia-Campos A, Baird AW, Mulcahy G. Development of a versatile in vitro method for understanding the migration of Fasciola hepatica newly excysted juveniles. Parasitology. (2016) 143:24–33. doi: 10.1017/S0031182015001481
28. Great Britain Ministry of Agriculture, Fisheries and Food, (editor). Examination of liver for the presence of Fasciola. In Manual of Veterinary Parasitological Laboratory Techniques. London: H.M. Stationery Office (1986). p. 48.
29. xxxR: A Language and Environment for Statistical Computing (2018). Available online at: https://www.r-project.org/
30. Chen C, Khaleel SS, Huang H, Wu CH. Software for pre-processing Illumina next-generation sequencing short read sequences. Source Code Biol Med. (2014) 9:8. doi: 10.1186/1751-0473-9-8
31. Dobin A, Davis CA, Schlesinger F, Drenkow J, Zaleski C, Jha S, et al. STAR: ultrafast universal RNA-seq aligner. Bioinformatics. (2013) 29:15–21. doi: 10.1093/bioinformatics/bts635
32. Liao Y, Smyth GK, Shi W. The Subread aligner: fast, accurate and scalable read mapping by seed-and-vote. Nucleic Acids Res. (2013) 41:e108. doi: 10.1093/nar/gkt214
33. Chang CC, Chow CC, Tellier LC, Vattikuti S, Purcell SM, Lee JJ. Second-generation PLINK: rising to the challenge of larger and richer datasets. Gigascience. (2015) 4:7. doi: 10.1186/s13742-015-0047-8
34. Robinson MD, Oshlack A. A scaling normalization method for differential expression analysis of RNA-seq data. Genome Biol. (2010) 11:R25. doi: 10.1186/gb-2010-11-3-r25
35. Robinson MD, McCarthy DJ, Smyth GK. edgeR: a Bioconductor package for differential expression analysis of digital gene expression data. Bioinformatics. (2010) 26:139–40. doi: 10.1093/bioinformatics/btp616
36. McCarthy DJ, Chen Y, Smyth GK. Differential expression analysis of multifactor RNA-Seq experiments with respect to biological variation. Nucleic Acids Res. (2012) 40:4288–97. doi: 10.1093/nar/gks042
37. Lun ATL, Chen Y, Smyth GK. It's DE-licious: a recipe for differential expression analyses of RNA-seq experiments using quasi-likelihood methods in edgeR. Methods Mol Biol. (2016) 1418:391–416. doi: 10.1007/978-1-4939-3578-9_19
38. Braschi B, Denny P, Gray K, Jones T, Seal R, Tweedie S, et al. Genenames.org: the HGNC and VGNC resources in 2019. Nucleic Acids Res. (2019) 47:D786–92. doi: 10.1093/nar/gky930
39. Vandesompele J, De Preter K, Pattyn F, Poppe B, Van Roy N, De Paepe A, et al. Accurate normalization of real-time quantitative RT-PCR data by geometric averaging of multiple internal control genes. Genome Biol. (2002) 3:RESEARCH0034. doi: 10.1186/gb-2002-3-7-research0034
40. Hellemans J, Mortier G, De Paepe A, Speleman F, Vandesompele J. qBase relative quantification framework and software for management and automated analysis of real-time quantitative PCR data. Genome Biol. (2007) 8:R19. doi: 10.1186/gb-2007-8-2-r19
41. Lee S, Lee S, Ouellette S, Park WY, Lee EA, Park PJ. NGSCheckMate: software for validating sample identity in next-generation sequencing studies within and across data types. Nucleic Acids Res. (2017) 45:e103. doi: 10.1093/nar/gkx193
42. Tizard IR, (editor). Veterinary immunology. In Veterinay Immunology. St. Louis, MO: Elsevier (2013), p. 311–25.
43. Randhawa IAS, Khatkar MS, Thomson PC, Raadsma HW. A meta-assembly of selection signatures in cattle. PLoS ONE. (2016) 11:e0153013. doi: 10.1371/journal.pone.0153013
44. Gibson AJ, Woodman S, Pennelegion C, Patterson R, Stuart E, Hosker N, et al. Differential macrophage function in Brown Swiss and Holstein Friesian cattle. Vet Immunol Immunopathol. (2016) 181:15–23. doi: 10.1016/j.vetimm.2016.02.018
45. Pleasance J, Wiedosari E, Raadsma HW, Meeusen E, Piedrafita D. Resistance to liver fluke infection in the natural sheep host is correlated with a type-1 cytokine response. Parasite Immunol. (2011) 33:495–505. doi: 10.1111/j.1365-3024.2011.01305.x
46. Huang W, Nadeem A, Zhang B, Babar M, Soller M, Khatib H. Characterization and comparison of the leukocyte transcriptomes of three cattle breeds. PLoS ONE. (2012) 7:e30244. doi: 10.1371/journal.pone.0030244
47. Mazeri S, Rydevik G, Handel I, Bronsvoort BM, Sargison N. Estimation of the impact of Fasciola hepatica infection on time taken for UK beef cattle to reach slaughter weight. Sci Rep. (2017) 7:7319. doi: 10.1038/s41598-017-07396-1
48. Mulcahy G, Joyce P, Dalton JP. Immunology of Fasciola hepatica infection. In: J. P. Dalton editor. Fasciolosis. Cambridge: CAB International, 341–66.
49. Zhang F-K, Zhang X-X, Elsheikha HM, He J-J, Sheng Z-A, Zheng W-B, et al. Transcriptomic responses of water buffalo liver to infection with the digenetic fluke Fasciola gigantica. Parasit Vectors. (2017) 10:56. doi: 10.1186/s13071-017-1990-2
50. Cox FE. Concomitant infections, parasites and immune responses. Parasitology. (2001) 122(Suppl):S23–38. doi: 10.1017/S003118200001698X
51. Imhof BA, Dunon D. Leukocyte migration and adhesion. Adv Immunol. (1995) 58:345–416. doi: 10.1016/S0065-2776(08)60623-9
52. Rezk HA, Zagloul W, El Shazly A, Farrag AM, Morsy TA. Soluble adhesion molecules as a marker of disease severity in human fascioliasis. J Egypt Soc Parasitol. (2000) 30:401–6.
53. Huang X-P, Ludke A, Dhingra S, Guo J, Sun Z, Zhang L, et al. Class II transactivator knockdown limits major histocompatibility complex II expression, diminishes immune rejection, and improves survival of allogeneic bone marrow stem cells in the infarcted heart. FASEB J. (2016) 30:3069–82. doi: 10.1096/fj.201600331R
54. Noya V, Rodriguez E, Cervi L, Giacomini C, Brossard N, Chiale C, et al. Modulation of dendritic cell maturation by fasciola hepatica: implications of glycans and mucins for vaccine development. Vaccines Vaccin. (2014) 5:1000233. doi: 10.4172/2157-7560.1000233
55. Guasconi L, Chiapello LS, Masih DT. Fasciola hepatica excretory-secretory products induce CD4+T cell anergy via selective up-regulation of PD-L2 expression on macrophages in a Dectin-1 dependent way. Immunobiology. (2015) 220:934–9. doi: 10.1016/j.imbio.2015.02.001
56. Garza-Cuartero L, O'Sullivan J, Blanco A, McNair J, Welsh M, Flynn RJ, et al. Fasciola hepatica infection reduces Mycobacterium bovis burden and mycobacterial uptake and suppresses the pro-inflammatory response. Parasite Immunol. (2016) 38:387–402. doi: 10.1111/pim.12326
57. Noya V, Brossard N, Rodríguez E, Dergan-Dylon LS, Carmona C, Rabinovich GA, et al. A mucin-like peptide from Fasciola hepatica instructs dendritic cells with parasite specific Th1-polarizing activity. Sci Rep. (2017) 7:40615. doi: 10.1038/srep40615
58. Martin I, Cabán-Hernández K, Figueroa-Santiago O, Espino AM. Fasciola hepatica fatty acid binding protein inhibits TLR4 activation and suppresses the inflammatory cytokines induced by lipopolysaccharide in vitro and in vivo. J Immunol. (2015) 194:3924–36. doi: 10.4049/jimmunol.1401182
59. Rodríguez E, Noya V, Cervi L, Chiribao ML, Brossard N, Chiale C, et al. Glycans from Fasciola hepatica modulate the host immune response and TLR-induced maturation of dendritic cells. PLoS Negl Trop Dis. (2015) 9:e0004234. doi: 10.1371/journal.pntd.0004234
60. Zhang F-K, Hou J-L, Guo A-J, Tian A-L, Sheng Z-A, Zheng W-B, et al. Expression profiles of genes involved in TLRs and NLRs signaling pathways of water buffaloes infected with Fasciola gigantica. Mol Immunol. (2018) 94:18–26. doi: 10.1016/j.molimm.2017.12.007
61. Baccarella A, Fontana MF, Chen EC, Kim CC. Toll-like receptor 7 mediates early innate immune responses to malaria. Infect Immun. (2013) 81:4431–42. doi: 10.1128/IAI.00923-13
62. Haçariz O, Sayers G, Flynn RJ, Lejeune A, Mulcahy G. IL-10 and TGF-beta1 are associated with variations in fluke burdens following experimental fasciolosis in sheep. Parasite Immunol. (2009) 31:613–22. doi: 10.1111/j.1365-3024.2009.01135.x
63. Flynn RJ, Mulcahy G. The roles of IL-10 and TGF-β in controlling IL-4 and IFN-γ production during experimental Fasciola hepatica infection. Int J Parasitol. (2008) 38:1673–80. doi: 10.1016/j.ijpara.2008.05.008
64. Yoshida K, Murata M, Yamaguchi T, Matsuzaki K. TGF-β/Smad signaling during hepatic fibro-carcinogenesis (review). Int J Oncol. (2014) 45:1363–71. doi: 10.3892/ijo.2014.2552
65. Hu P-F, Chen H, Zhong W, Lin Y, Zhang X, Chen Y-X, et al. Adenovirus-mediated transfer of siRNA against PAI-1 mRNA ameliorates hepatic fibrosis in rats. J Hepatol. (2009) 51:102–13. doi: 10.1016/j.jhep.2009.02.025
66. Jefford M. Functional comparison of DCs generated in vivo with Flt3 ligand or in vitro from blood monocytes: differential regulation of function by specific classes of physiologic stimuli. Blood. (2003) 102:1753–63. doi: 10.1182/blood-2002-12-3854
67. Connolly MK, Bedrosian AS, Mallen-St., Clair J, Mitchell AP, Ibrahim J, et al. In liver fibrosis, dendritic cells govern hepatic inflammation in mice via TNF-α. J Clin Invest. (2009) 119:3213–25. doi: 10.1172/JCI37581
68. Pallai A, Kiss B, Vereb G, Armaka M, Kollias G, Szekanecz Z, et al. Transmembrane TNF-α reverse signaling inhibits lipopolysaccharide-induced proinflammatory cytokine formation in macrophages by inducing TGF-β: therapeutic implications. J Immunol. (2016) 196:1146–57. doi: 10.4049/jimmunol.1501573
69. Wright HL, Thomas HB, Moots RJ, Edwards SW. RNA-seq reveals activation of both common and cytokine-specific pathways following neutrophil priming. PLoS ONE. (2013) 8:e58598. doi: 10.1371/journal.pone.0058598
70. Figueroa-Santiago O, Espino AM. Fasciola hepatica fatty acid binding protein induces the alternative activation of human macrophages. Infect Immun. (2014) 82:5005–12. doi: 10.1128/IAI.02541-14
71. Baska P, Norbury LJ, Zawistowska-Deniziak A, Wiśniewski M, Januszkiewicz K. Excretory/secretory products from two Fasciola hepatica isolates induce different transcriptional changes and IL-10 release in LPS-activated bovine “BOMA” macrophages. Parasitol Res. (2017) 116:2775–82. doi: 10.1007/s00436-017-5588-6
72. Xiang D-M, Sun W, Ning B-F, Zhou T-F, Li X-F, Zhong W, et al. The HLF/IL-6/STAT3 feedforward circuit drives hepatic stellate cell activation to promote liver fibrosis. Gut. (2018) 67:1704–15. doi: 10.1136/gutjnl-2016-313392
73. Escamilla A, Pérez-Caballero R, Zafra R, Bautista MJ, Pacheco IL, Ruiz MT, et al. Apoptosis of peritoneal leucocytes during early stages of Fasciola hepatica infections in sheep. Vet Parasitol. (2017) 238:49–53. doi: 10.1016/j.vetpar.2017.03.015
74. Escamilla A, Bautista MJ, Zafra R, Pacheco IL, Ruiz MT, Martínez-Cruz S, et al. Fasciola hepatica induces eosinophil apoptosis in the migratory and biliary stages of infection in sheep. Vet Parasitol. (2016) 216:84–8. doi: 10.1016/j.vetpar.2015.12.013
Keywords: Fasciola, transcriptomics, vaccines, immunoregulation, cattle, PBMCs, apoptosis
Citation: Garcia-Campos A, Correia CN, Naranjo-Lucena A, Garza-Cuartero L, Farries G, Browne JA, MacHugh DE and Mulcahy G (2019) Fasciola hepatica Infection in Cattle: Analyzing Responses of Peripheral Blood Mononuclear Cells (PBMC) Using a Transcriptomics Approach. Front. Immunol. 10:2081. doi: 10.3389/fimmu.2019.02081
Received: 04 June 2019; Accepted: 16 August 2019;
Published: 29 August 2019.
Edited by:
Jayne Hope, University of Edinburgh, United KingdomReviewed by:
Parul Sharma, University of Liverpool, United KingdomJohn Graham-Brown, University of Liverpool, United Kingdom
Copyright © 2019 Garcia-Campos, Correia, Naranjo-Lucena, Garza-Cuartero, Farries, Browne, MacHugh and Mulcahy. This is an open-access article distributed under the terms of the Creative Commons Attribution License (CC BY). The use, distribution or reproduction in other forums is permitted, provided the original author(s) and the copyright owner(s) are credited and that the original publication in this journal is cited, in accordance with accepted academic practice. No use, distribution or reproduction is permitted which does not comply with these terms.
*Correspondence: Grace Mulcahy, Z3JhY2UubXVsY2FoeUB1Y2QuaWU=