 Ying Luo1
 Nicole Meyer2Qingqing Jiao1
 Jörg Scheffel1Carolin Zimmermann1
 Martin Metz1
 Ana Zenclussen2
 Marcus Maurer1*
 Frank Siebenhaar1
- 1Dermatological Allrgology, Department of Dermatology and Allergy, Charité - Universitätsmedizin Berlin, Corporate Member of Freie Universität Berlin, Humboldt - Universität zu Berlin, and Berlin Institute of Health, Berlin, Germany
- 2Experimental Obstetrics and Gynecology, Medical Faculty, Otto-Von-Guericke-University, Magdeburg, Germany
Mast cells (MCs) are considered as key effector cells in the elicitation of allergic symptoms, and they are essential players in innate and adaptive immune responses. In mice, two main types of MCs have been described: connective tissue MCs (CTMCs) and mucosal MCs (MMCs). However, little is known about the biological functions of MMCs, which is due to the lack of suitable models to investigate MMCs in vivo. Here, we aimed to generate a mouse model selectively deficient in MMCs. It has been previously described that Cre expressed under the control of the baboon α-chymase promotor is predominantly localized in MMCs. Therefore, we mated α-chymase-Cre transgenic mice with mice bearing a floxed allele of the myeloid cell leukemia sequence 1 (Mcl-1). Mcl-1 encodes for an intracellular antiapoptotic factor in MCs; hence, a selective reduction in MMCs was expected. Our results show that this new mouse model contains markedly reduced numbers of MMCs in mucosal tissues, whereas numbers of CTMCs are normal. Thus, Chm-Cre; Mcl-1fl/fl mice are a useful tool for the investigation of the pathophysiological functions of MMCs in vivo.
Introduction
Mast cells (MCs) are potent inflammatory cells that are constitutively present in most tissues. MCs are key effector cells in the elicitation of allergic symptoms (1–3) and essential players in protective innate and adaptive immune responses to pathogens and other environmental threats (4–6).
MCs exhibit a diverse hematopoietic origin. As the bone marrow was previously believed the only site from which MCs can arise (7–9), it has been recently shown that MCs also originate from the yolk sac and from definite progenitors (10). Unlike other myeloid-derived cells, which differentiate and mature in the BM before being released to the blood, MCs egress the BM and circulate as immature progenitor cells (11–14) (generically termed MCps), which give rise to mature MCs when they migrate to their target tissues (15).
In mice, MCps differentiate into two major types of mature MCs, connective tissue MCs (CTMCs) and mucosal MCs (MMCs), classified according to their anatomical distribution: CTMCs are found in skin, peritoneum, and submucosa of the gastrointestinal tract, where they are predominantly located in close proximity to vessels and sensory nerve endings. In contrast, MMCs are present in mucosal tissues such as the gastrointestinal and respiratory mucosa as well as in the uterus where they coexist with CTMCs and an intermediate phenotype (15, 16). CTMCs and MMCs also differ in their morphology, protease expression profiles, and biochemical and functional properties (15). CTMCs represent a robust and long-lived tissue population (17, 18), whereas MMCs are low in numbers under physiological conditions but show rapid and marked expansion under pathological conditions, such as parasitic infections (19–21) or food allergy (22). In addition, it has been reported that MMCs can expand during T cell-dependent immune responses (19, 23, 24), whereas CTMCs exhibit little or no T cell-dependent behavior and appear in athymic nude mice or rats in normal numbers. CTMCs are relatively well-characterized and studied as compared to MMCs. This is, in part, because animal models for the investigation of CTMC functions became available some decades ago. In contrast, very little is known about MMCs, and we are lacking suitable models to study their biological functions.
The role of MMCs in health and disease is largely unknown. In contrast to CTMCs, very little is known about the pathways of MMC activation, their physiological functions, mechanisms of proliferation and survival, as well as modulators of MMCs biology. We, therefore, aimed to generate a new mouse model that exhibits a specific reduction in MMCs, thus allowing for the investigation of MMC biology in vivo. To this end, we made use of the Cre/loxP recombination system for generating tissue-specific gene inactivation in mice (25, 26). It has been previously reported that Cre expression driven by the baboon α-chymase promotor correlates to MC-specific lineages present in colon and lungs, thereby suggesting an MMC-specific expression (27). Hence, in the present study, we mated chymase-Cre transgenic mice with mice bearing a floxed allele of the myeloid cell leukemia sequence 1 (Mcl-1), which encodes for an intracellular antiapoptotic factor in MCs (28). We hypothesized that the genetic inactivation of Mcl-1 under the control of the α-chymase promotor in this Chm-Cre; Mcl-1fl/fl mouse induces apoptosis in the target cell population and results in a specific reduction of MMCs.
Result
Chm-Cre; Mcl-1fl/fl Mice Have Markedly Reduced Numbers of Gastric and Duodenal MMCs
Chm-Cre; Mcl-1fl/fl mice showed markedly reduced numbers of MMCs in the glandular stomach as compared to control Chm-Cre; Mcl-1+/+ mice (Figure 1, 1.6 ± 0.5 MCs/HPF vs. 4.12 ± 0.3/HPF). MMC numbers were also markedly reduced in the lamina propria of the duodenum of Chm-Cre; Mcl1fl/fl mice (Chm-Cre;Mcl-1fl/fl: 0.6 ± 0.1 MC/HPF vs. Chm-Cre;Mcl-1+/+: 1.3 ± 0.1 MC/HPF, −54%, P < 0.01). MCs in ileum and colon generally appear in very low numbers; hence, the reduction of MMCs in the lamina propria of the ileum and colon of Chm-Cre; Mcl-1fl/fl mice was detectable but not significant.
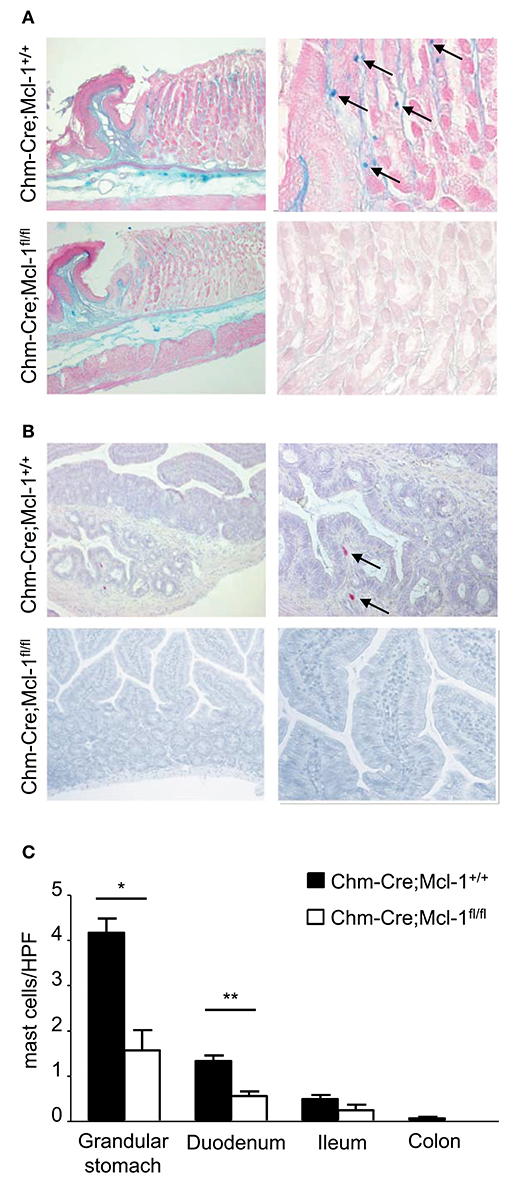
Figure 1. Chm-Cre; Mcl-1fl/fl mice have markedly reduced numbers of representative mucosal mast cell (MMC) populations. (A) Alcian blue staining for stomach MCs of 5-μm-thick paraffin sections showed markedly reduced MCs numbers (blue) in Chm-Cre; Mcl-1fl/fl mice compared to control Chm-Cre; Mcl-1+/+ mice. (B) Chloroacetate esterase staining for intestinal MCs showed decreased number of MCs (red) in duodenum of Chm-Cre; Mcl-1fl/fl mice compared to control Chm-Cre; Mcl-1+/+ mice. (C) Numbers of MCs in different gastrointestinal tissues were assessed by quantitative histomorphometry analysis. (A,B) left: 100× magnification, (A) right: 400× magnification, (B) right: 200× magnification. Data were pooled from three independent experiments (n = 5 mice per group) and expressed as mean ± SEM (*P < 0.05, **P < 0.01, n.s., not significant).
Chm-Cre; Mcl-1fl/fl Mice Exhibit Markedly Reduced Numbers of Uterus MCs and Decreased Placental Thickness
In consideration of the variation of uterine MC numbers (uMCs) during the fertile period in the uterus, which contains MMCs and CTMCs, we quantified the number of uMCs/mm2 in the uterus of virgin Chm-Cre; Mcl-1fl/fl and Chm-Cre; Mcl-1+/+ female mice at the estrus. During the estrus cycle, Chm-Cre; Mcl-1fl/fl mice presented significantly reduced uMC numbers as compared to Chm-Cre; Mcl-1+/+ mice (Figure 2A, 3.72 ± 1.72/mm2, n = 5 vs. 12.72 ± 2.44/mm2, n = 5, P = 0.017). Histomorphological analyses of uterine sections stained with alcian blue and safranin, to quantify MMCs and CTMCs, respectively, identified both CTMCs and MMCs during estrus in Chm-Cre; Mcl-1+/+ control mice. Interestingly, we observed some alcian blue/safranin double-positive cells in the uterus of Chm-Cre; Mcl-1+/+ mice, suggesting for an indistinct potentially intermediate phenotype. In contrast, Chm-Cre; Mcl-1fl/fl mice had CTMCs only, but no MMCs (Figure 2B).
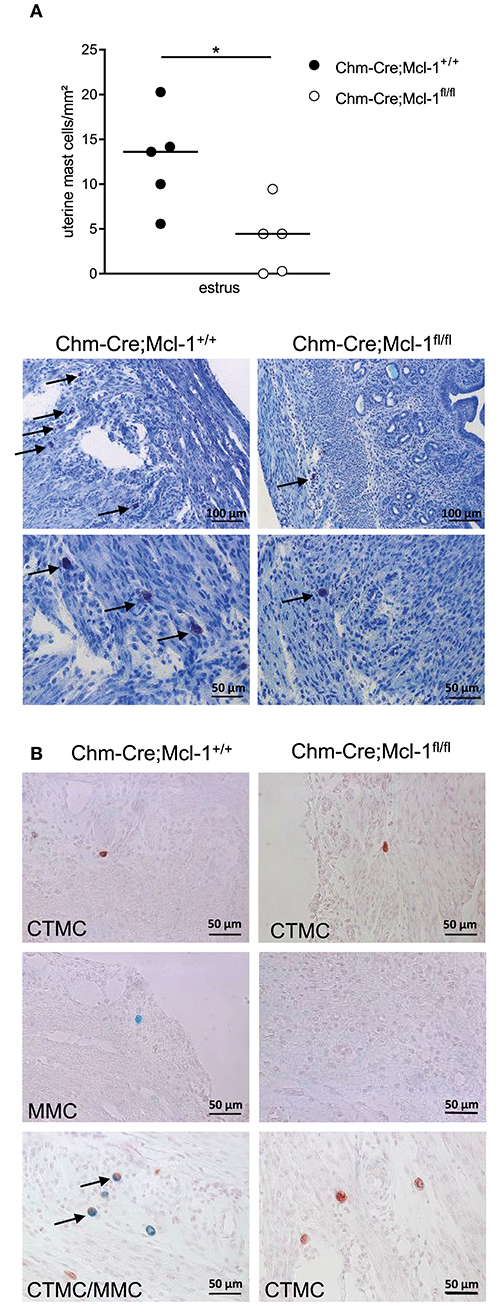
Figure 2. Chm-Cre; Mcl-1fl/fl mice exhibit reduced numbers of uterus MCs. (A) Toluidine blue staining of 5-μm-thick paraffin uteri sections showed markedly reduced number of uterus MCs (uMCs) at the estrus cycle (arrows) in Chm-Cre; Mcl-1fl/fl mice compared to control Chm-Cre; Mcl-1+/+ mice. (B) Representative images of alcian blue (MMCs) and safranin (CTMCs) staining of uterus from Chm-Cre; Mcl-1+/+ and Chm-Cre; Mcl-1fl/fl at estrus. Results are presented as individual values and median. Statistical differences were obtained by using Mann–Whitney (*P < 0.05), 200× magnification.
To investigate whether the lack of MMCs in the uterus has an impact on fetal/placental growth, we performed ultrasound analyses of the gestation period at gd5 and gd10 assessing the implantation area, placental thickness, and diameter, as well as the placental diameter/thickness ratio of Balb/c-paired Chm-Cre; Mcl-1fl/fl mice (n = 5, placentas n = 23) and Chm-Cre; Mcl-1+/+ mice (n = 4, placentas n = 22) at gd10 (Figures 3A,B). We observed significantly reduced placental thickness in Chm-Cre; Mcl-1fl/fl mice (Figure 3B), whereas the implantation area, placenta weight, as well as implantation and abortion rates were comparable to the one observed for Chm-Cre; Mcl-1+/+ mice at gd5 and gd10 (Figure 3C and Figures S1A–C). Also, no differences in spiral artery (SA) parameters were found at gd10 (Figure S1D).
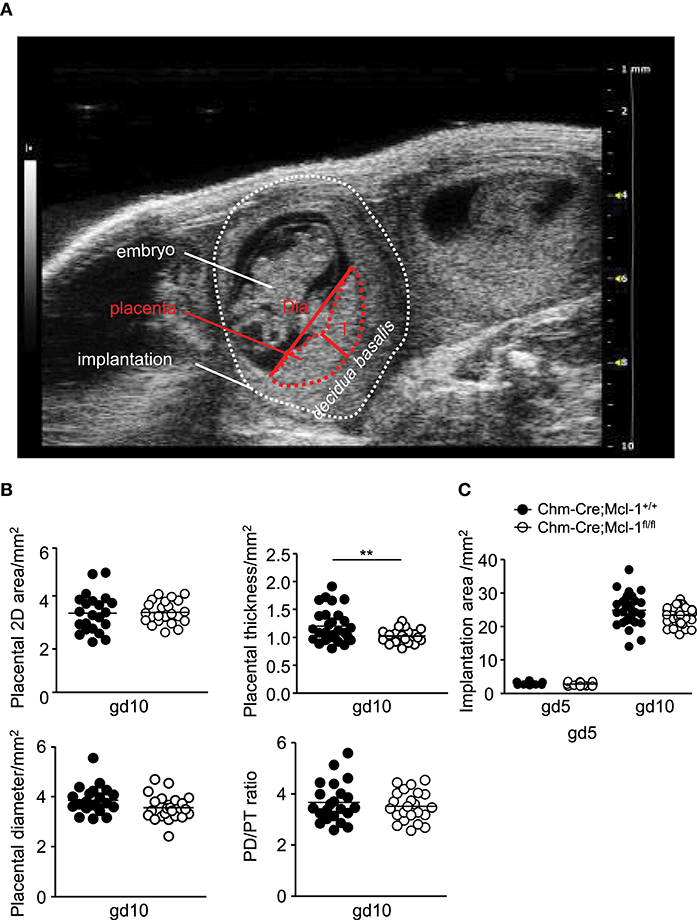
Figure 3. Chm-Cre; Mcl-1fl/fl mice presented decreased placental thickness at gd10. (A) Representative ultrasound image of an implantation at gd10 showing the embryo, the decidua basalis, and the placenta with placenta thickness (T) and diameter (Dia). (B) Placental area, placental thickness, placental diameter, and placental diameter/thickness ratio from Balb/c-paired Chm-Cre; Mcl-1+/+ (mice n = 4, placentas n = 22) and Chm-Cre; Mcl-1fl/fl mice (mice n = 5, placentas n = 23) at gd10. (C) Implantation areas in mm2 from Balb/c-paired Chm-Cre; Mcl-1+/+ (mice n = 4, implantations n = 15–32 per day) and Chm-Cre; Mcl-1fl/fl females (mice n = 5, implantations n = 21–36 per day) at gd5 and gd10. Results are presented as individual values for each single placenta with mean. Statistical differences were obtained using unpaired t-test (**P < 0.01). gd, gestation day; T, thickness; Dia, diameter.
Chm-Cre; Mcl-1fl/fl Mice Exhibit No Difference in Cell Numbers or Morphology of Representative CTMC Populations
Chm-Cre; Mcl-1fl/fl mice and Chm-Cre; Mcl-1+/+ mice were similar in their numbers of CTMCs obtained from the peritoneum (PMCs), and their PMCs were similar in their morphology and surface expression of c-kit and FcεRI as assessed by FACS analysis (Figures 4A,B). Numbers of CTMCs in the dorsal skin of Chm-Cre; Mcl-1fl/fl and Chm-Cre; Mcl-1+/+ control mice were similar as assessed by quantitative histomorphometry (Figures 4C,D; Chm-Cre; Mcl-1fl/fl: 10.1 ± 0.9 MCs/HPF; Chm-Cre; Mcl-1+/+: 10,6 ± 0.8 MCs/HPF). Both strains also exhibited similar numbers of ear skin CTMCs (Figure 4D; Chm-Cre; Mcl-1fl/fl: 11.2 ± 0.7 MCs/HPF; Chm-Cre; Mcl-1+/+: 10.1 ± 0.9 MCs/HPF).
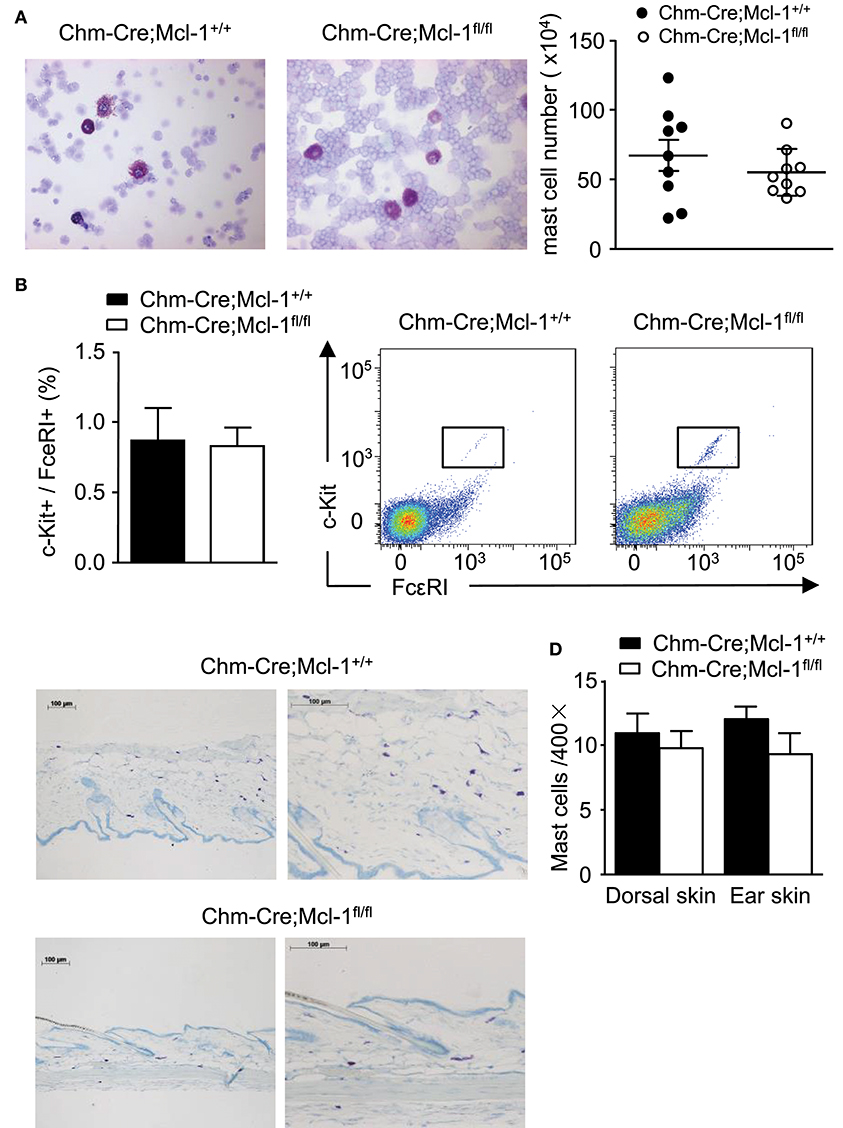
Figure 4. Chm-Cre; Mcl-1fl/fl mice exhibit no variation of cell number in representative sites of connective tissue mast cell (CTMC) populations as compared to Chm-Cre; Mcl-1+/+ mice. (A) Cytospins of peritoneal lavage fluid from Chm-Cre; Mcl-1+/+ mice and Chm-Cre; Mcl-1fl/fl mice were stained with Giemsa solution and MC numbers were assessed by Neubauer Hemocytometry. Mice exhibit comparable numbers of PMCs (right) with similar morphological features. (B) Percentage of mast cell surface markers expression (left) and representative flow cytometry plots (right) showed comparable expression of c-kit and FcεRI on PMCs isolated from Chm-Cre; Mcl-1+/+ mice and Chm-Cre; Mcl-1fl/fl mice. (C) Giemsa staining of 5-μm-thick paraffin sections of dorsal skin obtained from Chm-Cre; Mcl-1+/+ and Chm-Cre; Mcl-1fl/fl mice show comparable numbers of MCs (purple). (D) MCs in dorsal and ear skin tissues show similar amounts of dermal MCs. (A) 400× magnification, (C) left: 100× magnification, (C) right: 200× magnification. Data were pooled from two (A,B; n = 3 mice per group ± SEM) or five independent experiment (C,D; n = 5 mice per group ± SEM).
Bone Marrow-Derived Cultured MCs of Chm-Cre; Mcl-1fl/fl Mice-Exhibit Normal Proliferation and Differentiation
It has been previously reported that the α-chymase promotor is not expressed in bone marrow-derived cultured MCs (BMCMCs). As expected, cytological analyses showed cytoplasmic Giemsa-positive granules in both, BMCMCs generated from Chm-Cre; Mcl-1fl/fl and Chm-Cre; Mcl-1+/+ mice, after 4 weeks of culture. Furthermore, BMCMCs derived from Chm-Cre; Mcl-1fl/fl and Chm-Cre; Mcl-1+/+ mice were similar in size, granule distribution, and nucleus formation (Figure 5A). Chm-Cre; Mcl-1fl/fl and Chm-Cre; Mcl-1+/+ BMCMCs also showed no differences in their rates of proliferation after 7, 14, 21, or 28 days of culture (Figure 5B). The differentiation of BMCMCs derived from Chm-Cre; Mcl-1fl/fl and Chm-Cre; Mcl-1+/+ was also similar as assessed by flow cytometric analysis of the expression of the MC surface markers CD117 (c-kit) and FcεRIα at day 7, 14, 21, or 28 of culture. BMCMCs from both strains, after 28 days of culture, exhibited more than 95% double-positive cells (Figure 5C).
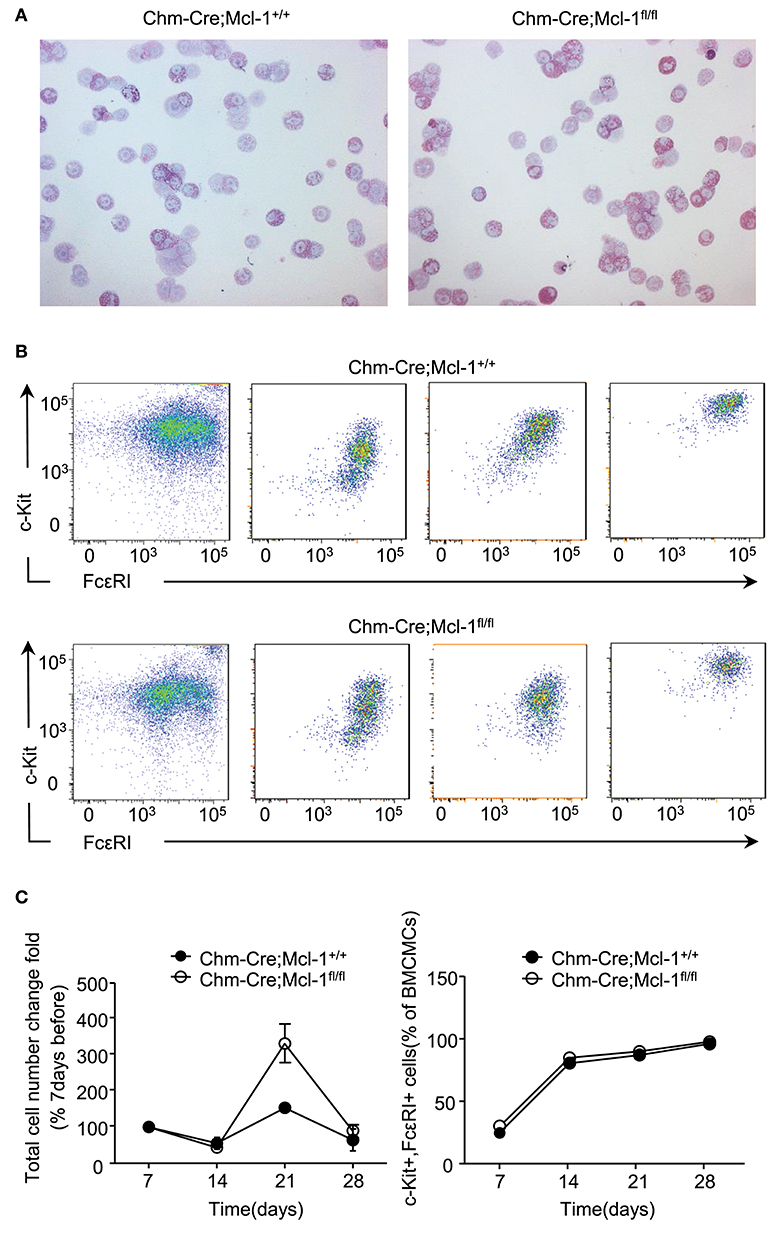
Figure 5. Comparable proliferation and differentiation rates in bone marrow-derived cultured mast cells (BMCMCs). (A) Representative light micrograph shows comparable morphology of BMCMCs after 4 weeks of culture in IL-3-supplemented medium from Chm-Cre; Mcl-1+/+ control mice and Chm-Cre; Mcl-1fl/fl mice. BMCMCs were identified morphologically on cytospin cell preparations stained with Giemsa solution. (B) Representative flow cytometry plots and percentage of c-kit and FcεRI expression show comparable differentiation rate on BMCMCs isolated from Chm-Cre; Mcl-1+/+ mice and Chm-Cre;Mcl-1fl/fl mice after 7, 14, 21, and 28 days of culture. (C) The proliferation rate of BMCMCs was evaluated by calculating the fold change of cell number over time. Data show similar proliferation rates of BMCMCs after 7, 14, 21, and 28 days of culture from Chm-Cre; Mcl-1+/+ mice and Chm-Cre; Mcl-1fl/fl mice. (A) 200× magnification. Data are pooled from three independent experiments (n = 3 mice per group ± SEM).
Discussion
In this study, we developed a new mouse strain Chm-Cre; Mcl-1fll/fl that was used for the investigation and characterization of different populations of MCs (CTMCs and MMCs). Our data support the conclusion that Chm-Cre; Mcl-1fl/fl mice have markedly reduced numbers of MMCs in mucosal tissues of the glandular stomach and intestine, which contain only MMCs, as well as in the uterus, which contains both subtypes of MCs. In contrast, the numbers of CTMCs, in the dorsal skin, ear skin, and peritoneal cavity, are normal.
MMCs are found at relatively low numbers in most mucosal tissues, especially in the intestines (29). It was, therefore, not surprising to find that some of the intestinal tissues analyzed, such as the ileum and colon, contained barely any detectable MMCs (Figure 1C). Our data indicate that Chm-Cre; Mcl-1fl/fl mice exhibited a significantly reduced number of intestinal MMCs, even when the physiological number of MMCs in wild-type mice was very low (Figure 1C) as previously described (9). MMC populations of the gut are known to expand under inflammatory conditions, such as parasitic infections and allergic conditions (19–21). Further studies will be needed to characterize if and how intestinal MMC numbers change in Chm-Cre; Mcl-1fl/fl mice in these settings. This will help to characterize their role and relevance for intestinal immune responses against parasites and allergens.
Interestingly, we observed markedly reduced MMC numbers in uterine tissue of Chm-Cre; Mcl-1fl/fl mice (Figure 2). Previous studies have shown that uMCs have a positive influence on implantation, placentation, and remodeling of spiral arteries (SAs) as well as placenta size and fetal growth (16, 30, 31). In Chm-Cre; Mcl-1fl/fl mice, the placental and fetal development was largely normal (Figure S1), but we did find that placental thickness is decreased (Figure 3). It has been recently demonstrated that the complete absence of all MCs, i.e., of both CTMCs and MMCs, in KitW−sh/KitW−sh (sash) mice is linked to a severe impairment in reproduction. The selective depletion of Mcpt-5-positive CTMCs also negatively impacts fetal and placental development (30). Our study suggests that the selective absence of MMCs has no major impact on fetal and placental growth. Previous studies have shown that uterine natural killer cells (uNKs) are able to overcome the absence of uMCs by counterbalancing their effects at the feto-maternal interface to promote SA remodeling and placentation (30). In addition, regulatory T cells (Treg) are known as key regulators of placental implantation. Tregs transferred into abortion-prone mice, which present with insufficient numbers of uMCs, restore SA remodeling and placental development by promoting the expansion of uMCs (16). Further studies will help in understanding the functions of uNKs and Tregs in Chm-Cre; Mcl-1fl/fl mice. uNKs and Tregs may rescue the phenotype in Chm-Cre; Mcl-1fl/fl mice and thereby secure normal implantation and placental development.
Interestingly, we also observed alcian blue/safranin double-positive cells in Chm-Cre; Mcl-1+/+ mice (Figure S1). Alcian blue staining is used to detect MMCs, and safranin stains CTMCs. The presence of double-positive MCs in the uterus has previously been reported (32–34). Whether these MCs are in a premature state or in a conversion process is yet unclear. It has been suggested by some authors that uMCs may be able to change their phenotype depending on the surrounding milieu (33, 34).
MCs can originate from bone marrow precursor cells, and they then differentiate into MMCs and CTMCs according to the local microenvironment. BMCMCs are used as an in vitro model for studying MC functions. They are a mucosal-like population of MCs since they share some characteristics with MMCs, like their protease composition. The generation of BMCMCs from Chm-Cre; Mcl-1fl/fl mice, however, revealed no differences when compared to Chm-Cre; Mcl-1+/+ mice, suggesting that BMCMCs are immature MCs that are phenotypically distinct from both MMCs and CTMCs (35). BMCMCs from Chm-Cre; Mcl-1fl/fl mice were similar in proliferation and maturation as compared to cells derived from control mice (Figures 5B,C), indicating that the hematopoietic progenitor cell capacities for MC differentiation are retained in Chm-Cre; Mcl-1fl/fl mice. This is in line with previous findings showing that the BMCMC population derived from Chm:Cre mice exhibit no specific Cre activity (27), indicating that Cre-expression driven by the baboon α-chymase promotor is restricted to mature MMCs.
After their egress from the bone marrow or alternate stem cell reservoirs, MC progenitors undergo differentiation and maturation in their peripheral target tissues. MC progenitors that populate the skin or peritoneum become CTMCs, whereas those that differentiate and mature in mucosal epithelia and the lamina propria become MMCs. The most important finding of our study is that Chm-Cre; Mcl-1fl/fl mice exhibit a profound reduction of MMCs in mucosal tissues of the glandular stomach and intestine without affecting the number of CTMCs in connective tissues like the skin and the peritoneal cavity.
Although mammalian MCs were first described more than a century ago, their detailed functions remain to be elucidated. MCs are considered to be multifunctional immune cells implicated in several physiological and pathological processes. However, the knowledge about the biological functions of the different MC subtypes, especially MMCs, and the plasticity of MCs is limited due to the lack of suitable models for their investigation in vivo. Today, one of the most important challenges for the development of MC-targeting therapeutic applications is to understand their impact on different MC subpopulations. Genetic mouse models are an important tool for this, as well as for the identification and characterization of physiological and pathological functions of MCs in vivo. Several MC-deficient models have been described and used in the past: mice deficient for Kit (KitW/KitW−v mice and KitW−sh/Kit/W−sh mice), the receptor for stem cell factor (SCF), which is essential for MC growth and survival, have been used for more than 30 years to analyze MC populations and their functions in vivo. These mice exhibit a variety of non-MC-related phenotypic abnormalities, including abnormalities affecting hematopoietic cells other than MCs that can contribute to innate or adaptive immune responses, such as neutrophils, basophils, γδ T-cells, and myeloid suppressor cells (9, 11, 36). In recent years, Kit-independent models became available including Cpa3-Cre; Mcl-1fl/fl (28), Cpa3Cre/+ (“Cre-Master”) mice (37), and Mas-TRECK (38), as well as Mcpt5-Cre iDTR (39), Mcpt5-Cre R-DTA (40), and RMB mice (41) with an inducible or constitutive deficiency for either the entire MC compartment, CTMCs only, or both MCs and basophils. However, genetic mouse models with a specific focus on MMC populations had not be reported, and this has been a roadblock for improving our understanding of the biology of MMCs.
In this study, we report a novel model for studying MMCs, the Chm-Cre; Mcl-1fl/fl mouse, and we provide a phenotypic characterization of its MC populations. The selective reduction of numbers of MMCs in this novel mouse model is a useful tool in MC research, especially for investigating the role and relevance of MMCs in health and disease.
Methods
Mice
Genetically, Chm-Cre; Mcl-1fl/fl mice and congenic normal Chm-Cre; Mcl-1+/+ mice (8–12 weeks old) were obtained from breeding colonies of the animal facilities of Charité-Universitätsmedizin Berlin. Mice were kept in community cages at the Animal Care Facilities at light periods of 12 h and were fed water and mouse chow ad libitum. All animal care and experimentation was conducted in accordance with current Institutional Animal Care and Use Committee guidelines at the Charité-Universitätsmedizin Berlin under official permissions of the State of Berlin, Germany.
Development of the Mouse Model
C57BL/6 alpha-chymase-Cre transgenic (Chm-Cre) mice previously described by Müsch et al. (27) were crossed to C57BL/6 Mcl-1+/fl mice for one generation to obtain heterozygote Chm-Cre; Mcl-1+/fl mice. The offspring was identified by PCR genotyping. The heterozygote Chm-Cre; Mcl-1+/fl mice were bred as breeder to obtain Chm-Cre; Mcl-1+/+, Chm-Cre; Mcl-1+/fl, and Chm-Cre; Mcl-1fl/fl mice.
Genotyping
Genotyping was performed by PCR. The genotype of transgenic offspring from Chm-Cre; Mcl-1+/fl mice was detected by ear biopsies DNA as described before (22). (Primers: Chm-CreFor: 5′ CGG CGC TAA GGA TGA CTC TGG TCA G 3′, Chm-CreRev: 5′ GTC CAA CGT TCC GTT CGC GCG G 3′, Mcl-1For: 5′ CGA TGC AAC GAG TGA TGA GG 3′, Mcl-1Rev: 5′ GCA TTG CTG TCA CTT GGT CGT 3′). Three reactions are performed during the genotyping, in brief: one to test for Chm-Cre, one to test for the wild-type Mcl-1 allele (PCR product: 360 bp), and one to test for the Mcl-1 flox allele (PCR product: 400 bp).
Cells
Mouse femoral and tibial BM cells from Chm-Cre; Mcl-1 mice were cultured for 4 weeks in complete IL-3-containing medium with 1% antibiotics to generate BM-derived cultured mast cells (BMCMCs). Peritoneal cells (PMCs) were obtained by injecting Chm-Cre; Mcl-1 mice i.p. with 5 ml of PBS for the peritoneal lavage. Morphological analysis of MCs was assessed by Alkaline-Giemsa staining of cytospins. MC differentiation was assessed by flow cytometric analysis for surface expression of CD117 (c-kit) and FcεRI.
Histology
Mice were euthanized, and samples of back skin, ear pinna, were fixed in 4% buffered formaldehyde (vendor); stomach, duodenum, ileum, and colon were fixed in 4% methanol-free formaldehyde, dehydrated, and embedded in paraffin ensuring a cross-sectional orientation of all tissues, and 5-μm sections were stained with alkaline-Giemsa solution for histologic examination and enumeration of MCs. To examine stomach MMCs, stomach samples were stained by alcian blue solution. To examine MMCs of the duodenum, jejunum, ileum, and colon, 5-μm sections of intestinal tissue were stained for chloroacetate esterase-positive MMCs, as previously described (35). To examine uMCs, 5-μm paraffin embedded uterus samples were stained by toluidine blue, alcian blue, or safranin. At least three random sections per mouse were analyzed. Ten high-power fields (HPF) per section have been analyzed.
Determination of MC Numbers
In all histological assessments, cell numbers were enumerated by a single observer not aware of the identity (mouse group) of the individual sections. Cell numbers were based on counting 10 medium-power fields (200×) or HPF (400×), and mean values were calculated. In this study, MCs were classified according to anatomic location as previously described (42). Skin MCs were quantified according to horizontal field length of dermis, uterine MCs were quantified according to area, and gastrointestinal MCs were quantified according to anatomical structure (per field of mucosa and submucosa). MCs superficial to the deep border of the muscular layer, including the epithelium and lamina propria, were classified as MMCs. Images were captured with a Zeiss Axioplan 2 Imaging microscope using a Zeiss AxioCam camera run by AxioVision Rel. 4.8 software.
Ultrasound Imaging
Serial high-frequency ultrasound measurements were performed with the Vevo® 2100 Imaging system (FujiFilm VisualSonics Inc.) by using the transducer MS550D-0421. Isoflurane (Baxter)-anesthetized mice were placed on the heating platform, abdominal hair was removed with depilatory cream (Reckitt Beckiser), and eye protection cream (Bayer) and prowarmed ultrasound gel (Gello GmbH Geltechnik) were applied. During measurements, ECG, body temperature, and respiratory physiology were controlled. B-Mode was used to visualize anatomical structures in 2D grayscale image. Ultrasound examinations were performed at gd5 (implantation size) and gd10 (implantation size, placenta area/thickness/diameter), and all implantations found within the mothers were imaged. Mice were never exposed longer than 1 h to gaseous anesthesia.
Statistics
Unless otherwise indicated, all data were tested for statistical significance using the unpaired Student's t-test and expressed as mean ± SEM. A p ≤ 0.05 was considered to reflect statistical significance.
Data Availability Statement
The datasets generated for this study are available on request to the corresponding author.
Ethics Statement
The animal study was reviewed and approved by Landesamt für Soziales und Gesundheit Berlin.
Author Contributions
YL, QJ, CZ, and NM performed experiments. YL wrote the manuscript. JS and FS supervised experiments and revised the manuscript. AZ, MMe, and MM gave critical input to the experimental design and the manuscript. All authors contributed to the interpretation of the results.
Funding
This work was supported by grants from the German Research Foundation (DFG) SPP1394 to MM (MA1909/9-1 and MA1909/10-1) and by a scholarship from the China Scholarship Council to YL.
Conflict of Interest
The authors declare that the research was conducted in the absence of any commercial or financial relationships that could be construed as a potential conflict of interest.
Acknowledgments
We thank Sina Heydrich and Evelin Hagen for their excellent technical support. We further acknowledge support from the German Research Foundation and the Open Access Publication Fund of Charité-Universitätsmedizin Berlin.
Supplementary Material
The Supplementary Material for this article can be found online at: https://www.frontiersin.org/articles/10.3389/fimmu.2019.02399/full#supplementary-material
Figure S1. Chm-Cre; Mcl1fl/fl mice exhibit no differences in the analyzed placental parameters comparing to Chm-Cre; Mcl1+/+ mice. (A) Placental weight of Chm-Cre; Mcl-1+/+ (mice n = 4, placentas n = 21) and Chm-Cre; Mcl-1fl/fl (mice n = 5, placentas n = 34) females paired with Balb/c males at gd10. (B) Number of implantations at gd5 or gd10, abortions, and abortion rate at gd10 from Chm-Cre; Mcl-1+/+ (n = 3–4) and Chm-Cre; Mcl-1fl/fl (n = 3–5) females paired with Balb/c males at gd10. Results are presented as individual values ± median. (C) Representative bicorneal uteri of Chm-Cre; Mcl-1+/+ and Chm-Cre; Mcl-1fl/fl mice at gd5 or gd10. (D) SA wall thickness and SA wall-to-lumen ratio from 3 to 9 SAs per mice of Balb/c-paired Chm-Cre; Mcl-1+/+ (n = 4) and Chm-Cre; Mcl-1fl/fl (n = 5) females at gd10. Statistical differences were analyzed with the Mann–Whitney test. gd, gestation day; SA, spiral artery.
References
1. Rivera J, Gilfillan AM. Molecular regulation of mast cell activation. J Allergy Clin Immunol. (2006) 117:1214–25; quiz 26. doi: 10.1016/j.jaci.2006.04.015
2. Grimbaldeston MA, Metz M, Yu M, Tsai M, Galli SJ. Effector and potential immunoregulatory roles of mast cells in IgE-associated acquired immune responses. Curr Opin Immunol. (2006) 18:751–60. doi: 10.1016/j.coi.2006.09.011
3. Gilfillan AM, Tkaczyk C. Integrated signalling pathways for mast-cell activation. Nat Rev Immunol. (2006) 6:218–30. doi: 10.1038/nri1782
4. Brown GD. Innate antifungal immunity: the key role of phagocytes. Annu Rev Immunol. (2011) 29:1–21. doi: 10.1146/annurev-immunol-030409-101229
5. Abraham SN, St John AL. Mast cell-orchestrated immunity to pathogens. Nat Rev Immunol. (2010) 10:440–52. doi: 10.1038/nri2782
6. St John AL, Abraham SN. Innate immunity and its regulation by mast cells. J Immunol. (2013) 190:4458–63. doi: 10.4049/jimmunol.1203420
7. Kitamura Y, Go S, Hatanaka K. Decrease of mast cells in W/Wv mice and their increase by bone marrow transplantation. Blood. (1978) 52:447–52.
8. Jamur MC, Grodzki AC, Berenstein EH, Hamawy MM, Siraganian RP, Oliver C. Identification and characterization of undifferentiated mast cells in mouse bone marrow. Blood. (2005) 105:4282–9. doi: 10.1182/blood-2004-02-0756
9. Chen CC, Grimbaldeston MA, Tsai M, Weissman IL, Galli SJ. Identification of mast cell progenitors in adult mice. Proc Natl Acad Sci USA. (2005) 102:11408–13. doi: 10.1073/pnas.0504197102
10. Gentek R, Ghigo C, Hoeffel G, Bulle MJ, Msallam R, Gautier G, et al. Hemogenic endothelial fate mapping reveals dual developmental origin of mast cells. Immunity. (2018) 48:1160–71.e5. doi: 10.1016/j.immuni.2018.04.025
11. Kitamura Y, Sonoda T, Nakano T, Hayashi C, Asai H. Differentiation processes of connective tissue mast cells in living mice. Int Arch Allergy Appl Immunol. (1985) 77:144–50. doi: 10.1159/000233769
12. Kitamura Y, Kasugai T, Arizono N, Matsuda H. Development of mast cells and basophils: processes and regulation mechanisms. Am J Med Sci. (1993) 306:185–91. doi: 10.1097/00000441-199309000-00011
13. Kroegel C. Biological and molecular aspects of mast cell and basophil differentiation and function. In: Kitamura Y, Yamamoto S, Galli SJ, Greaves MW, editors. FEBS Letters. New York, NY: Raven Press (1994). p. 270. doi: 10.1016/0014-5793(51)90001-4
14. Hallgren J, Gurish MF. Pathways of murine mast cell development and trafficking: tracking the roots and routes of the mast cell. Immunol Rev. (2007) 217:8–18. doi: 10.1111/j.1600-065X.2007.00502.x
15. Gurish MF, Austen KF. Developmental origin and functional specialization of mast cell subsets. Immunity. (2012) 37:25–33. doi: 10.1016/j.immuni.2012.07.003
16. Woidacki K, Meyer N, Schumacher A, Goldschmidt A, Maurer M, Zenclussen AC. Transfer of regulatory T cells into abortion-prone mice promotes the expansion of uterine mast cells and normalizes early pregnancy angiogenesis. Sci Rep. (2015) 5:13938. doi: 10.1038/srep13938
17. Fukuzumi T, Waki N, Kanakura Y, Nagoshi J, Hirota S, Yoshikawa K, et al. Differences in irradiation susceptibility and turnover between mucosal and connective tissue-type mast cells of mice. Exp Hematol. (1990) 18:843–7.
18. Kitamura Y, Shimada M, Hatanaka K, Miyano Y. Development of mast cells from grafted bone marrow cells in irradiated mice. Nature. (1977) 268:442–3. doi: 10.1038/268442a0
19. Ruitenberg EJ, Elgersma A. Absence of intestinal mast cell response in congenitally athymic mice during Trichinella spiralis infection. Nature. (1976) 264:258–60. doi: 10.1038/264258a0
20. Hepworth MR, Daniłowicz-Luebert E, Rausch S, Metz M, Klotz C, Maurer M, et al. Mast cells orchestrate type 2 immunity to helminths through regulation of tissue-derived cytokines. Proc Natl Acad Sci USA. (2012) 109:6644–9. doi: 10.1073/pnas.1112268109
21. McDermott JR, Bartram RE, Knight PA, Miller HR, Garrod DR, Grencis RK. Mast cells disrupt epithelial barrier function during enteric nematode infection. Proc Natl Acad Sci USA. (2003) 100:7761–6. doi: 10.1073/pnas.1231488100
22. Brandt EB, Strait RT, Hershko D, Wang Q, Muntel EE, Scribner TA, et al. Mast cells are required for experimental oral allergen-induced diarrhea. J Clin Invest. (2003) 112:1666–77. doi: 10.1172/JCI19785
23. Mayrhofer G, Fisher R. Mast cells in severely T-cell depleted rats and the response to infestation with Nippostrongylus brasiliensis. Immunology. (1979) 37:145–55.
24. Guy-Grand D, Dy M, Luffau G, Vassalli P. Gut mucosal mast cells. Origin, traffic, and differentiation. J Exp Med. (1984) 160:12–28. doi: 10.1084/jem.160.1.12
25. Kos CH. Methods in nutrition science: Cre/loxP system for generating tissue-specific knockout mouse models. Nutr Rev. (2004) 62:243–6. doi: 10.1301/nr2004.jun243-246
26. Rajewsky K, Gu H, Kuhn R, Betz UA, Muller W, Roes J, et al. Conditional gene targeting. J Clin Invest. (1996) 98:600–3. doi: 10.1172/JCI118828
27. Müsch W, Wege AK, Männel DN, Hehlgans T. Generation and characterization of alpha-chymase-Cre transgenic mice. Genesis. (2008) 46:163–6. doi: 10.1002/dvg.20378
28. Lilla JN, Chen CC, Mukai K, BenBarak MJ, Franco CB, Kalesnikoff J, et al. Reduced mast cell and basophil numbers and function in Cpa3-Cre; Mcl-1fl/fl mice. Blood. (2011) 118:6930–8. doi: 10.1182/blood-2011-03-343962
29. Reber LL, Sibilano R, Mukai K, Galli SJ. Potential effector and immunoregulatory functions of mast cells in mucosal immunity. Mucosal Immunol. (2015) 8:444–63. doi: 10.1038/mi.2014.131
30. Meyer N, Woidacki K, Knöfler M, Meinhardt G, Nowak D, Velicky P, et al. Chymase-producing cells of the innate immune system are required for decidual vascular remodeling and fetal growth. Sci Rep. (2017) 7:45106. doi: 10.1038/srep45106
31. Woidacki K, Popovic M, Metz M, Schumacher A, Linzke N, Teles A, et al. Mast cells rescue implantation defects caused by c-kit deficiency. Cell Death Dis. (2014) 4:e462. doi: 10.1038/cddis.2012.214
32. Combs J, Lagunoff D, Benditt E. Differentiation and proliferation of embryonic mast cells of the rat. J Cell Biol. (1965) 25:577–92. doi: 10.1083/jcb.25.3.577
33. Aydin Y, Tunçel N, Gürer F, Tunçel M, Koşar M, Oflaz G. Ovarian, uterine and brain mast cells in female rats: cyclic changes and contribution to tissue histamine. Comp Biochem Physiol A Mol Integr Physiol. (1998) 120:255–62. doi: 10.1016/S1095-6433(98)00027-0
34. Brandon JM, Evans JE. Changes in uterine mast cells during the estrous cycle in the Syrian hamster. Am J Anat. (1983) 167:241–7. doi: 10.1002/aja.1001670209
35. Yamada N, Matsushima H, Tagaya Y, Shimada S, Katz SI. Generation of a large number of connective tissue type mast cells by culture of murine fetal skin cells. J Invest Dermatol. (2003) 121:1425–32. doi: 10.1046/j.1523-1747.2003.12613.x
36. Galli SJ, Nakae S, Tsai M. Mast cells in the development of adaptive immune responses. Nat Immunol. (2005) 6:135–42. doi: 10.1038/ni1158
37. Feyerabend TB, Weiser A, Tietz A, Stassen M, Harris N, Kopf M, et al. Cre-mediated cell ablation contests mast cellcontribution in models of antibody- and T cell-mediated autoimmunity. Immunity. (2011) 35:832–44. doi: 10.1016/j.immuni.2011.09.015
38. Otsuka A, Kubo M, Honda T, Egawa G, Nakajima S, Tanizaki H, et al. Requirement of interaction between mast cells and skin dendritic cells to establish contact hypersensitivity. PLoS ONE. (2011) 6:e25538. doi: 10.1371/journal.pone.0025538
39. Reber LL, Marichal T, Mukai K, Kita Y, Tokuoka SM, Roers A, et al. Selective ablation of mast cells or basophils reduces peanut-induced anaphylaxis in mice. J Allergy Clin Immunol. (2013) 132:881–8.e11. doi: 10.1016/j.jaci.2013.06.008
40. Dudeck A, Dudeck J, Scholten J, Petzold A, Surianarayanan S, Kohler A, et al. Mast cells are key promoters of contact allergy that mediate the adjuvant effects of haptens. Immunity. (2011) 34:973–84. doi: 10.1016/j.immuni.2011.03.028
41. Dahdah A, Gautier G, Attout T, Fiore F, Lebourdais E, Msallam R, et al. Mast cells aggravate sepsis by inhibiting peritoneal macrophage phagocytosis. J Clin Invest. (2014) 124:4577–89. doi: 10.1172/JCI75212
Keywords: mast cells, mouse model, mucosa, connective tissue, chymase, Cre, Mcl-1
Citation: Luo Y, Meyer N, Jiao Q, Scheffel J, Zimmermann C, Metz M, Zenclussen A, Maurer M and Siebenhaar F (2019) Chymase-Cre; Mcl-1fl/fl Mice Exhibit Reduced Numbers of Mucosal Mast Cells. Front. Immunol. 10:2399. doi: 10.3389/fimmu.2019.02399
Received: 19 July 2019; Accepted: 25 September 2019;
Published: 15 October 2019.
Edited by:
Maria Leite-de-Moraes, INSERM U1151 Institut Necker Enfants Malades Centre de médecine moléculaire (INEM), FranceReviewed by:
Adrian Piliponsky, Seattle Children's Research Institute, United StatesUlrich Blank, Institut National de la Santé et de la Recherche Médicale (INSERM), France
Copyright © 2019 Luo, Meyer, Jiao, Scheffel, Zimmermann, Metz, Zenclussen, Maurer and Siebenhaar. This is an open-access article distributed under the terms of the Creative Commons Attribution License (CC BY). The use, distribution or reproduction in other forums is permitted, provided the original author(s) and the copyright owner(s) are credited and that the original publication in this journal is cited, in accordance with accepted academic practice. No use, distribution or reproduction is permitted which does not comply with these terms.
*Correspondence: Marcus Maurer, bWFyY3VzLm1hdXJlckBjaGFyaXRlLmRl