 Scott A. Read1,2*
 Ratna Wijaya2
 Mehdi Ramezani-Moghadam2Enoch Tay2Steve Schibeci3Christopher Liddle2
 Vincent W. T. Lam4,5Lawrence Yuen4,5Mark W. Douglas2,6
 David Booth3Jacob George2Golo Ahlenstiel1,2,7*
- 1Blacktown Medical School, Western Sydney University, Blacktown, NSW, Australia
- 2Storr Liver Centre, The Westmead Institute for Medical Research, The University of Sydney and Westmead Hospital, Westmead, NSW, Australia
- 3Centre for Immunology and Allergy Research, The Westmead Institute for Medical Research, The University of Sydney and Westmead Hospital, Westmead, NSW, Australia
- 4Department of Upper Gastrointestinal Surgery, Westmead Hospital, Westmead, NSW, Australia
- 5Discipline of Surgery, University of Sydney, Sydney, NSW, Australia
- 6Centre for Infectious Diseases and Microbiology, Marie Bashir Institute for Infectious Diseases and Biosecurity, University of Sydney at Westmead Hospital, Westmead, NSW, Australia
- 7Blacktown Hospital, Western Sydney Local Health District (WSLHD), Blacktown, NSW, Australia
Lambda interferons (IFN-λs) are a major component of the innate immune defense to viruses, bacteria, and fungi. In human liver, IFN-λ not only drives antiviral responses, but also promotes inflammation and fibrosis in viral and non-viral diseases. Here we demonstrate that macrophages are primary responders to IFN-λ, uniquely positioned to bridge the gap between IFN-λ producing cells and lymphocyte populations that are not intrinsically responsive to IFN-λ. While CD14+ monocytes do not express the IFN-λ receptor, IFNLR1, sensitivity is quickly gained upon differentiation to macrophages in vitro. IFN-λ stimulates macrophage cytotoxicity and phagocytosis as well as the secretion of pro-inflammatory cytokines and interferon stimulated genes that mediate immune cell chemotaxis and effector functions. In particular, IFN-λ induced CCR5 and CXCR3 chemokines, stimulating T and NK cell migration, as well as subsequent NK cell cytotoxicity. Using immunofluorescence and cell sorting techniques, we confirmed that human liver macrophages expressing CD14 and CD68 are highly responsive to IFN-λ ex vivo. Together, these data highlight a novel role for macrophages in shaping IFN-λ dependent immune responses both directly through pro-inflammatory activity and indirectly by recruiting and activating IFN-λ unresponsive lymphocytes.
Introduction
Lambda interferons (IFNL and IFN-λ), also known as type III IFNs, are a family of cytokines comprising four members: IFN-λ1 (IL29), IFN-λ2 (IL28A), IFN-λ3 (IL28B), and IFN-λ4. While all IFN-λs signal through a unique IFNLR1:IL10Rβ receptor complex, they activate a gene signature similar to type I IFNs, IFN-α, and IFN-β (1). Both type I and III IFNs activate the transcription of hundreds of interferon stimulated genes (ISGs) (1) that exhibit numerous autocrine and paracrine antiviral roles. Although IFNs are required to clear most viral infections, prolonged expression due to environmental or genetic factors can stimulate sustained immune activation, driving tissue damage, and fibrosis (2, 3).
Elevated IFN-λ3 production has demonstrated a strong association with IFNL genotype and hepatic inflammation, increasing the risk of both viral (HBV and HCV) and non-viral (non-alcoholic steatohepatitis, NASH) related progressive liver inflammation and fibrosis (4). Furthermore, these effects appear to be independent of IFN-λ4 activity, suggesting that IFN-λ3 may be a primary mediator of inflammation (5). While the precise mechanisms remain uncertain, peripheral and hepatic immune cell populations vary according to the IFNL polymorphism in patients with chronic HCV infection, suggesting that IFN-λs can prompt immune cell migration to tissues (5, 6).
IFN-λ activity is restricted to specific tissues due to selective IFNLR1 expression. In humans, epithelial cells within the lung, intestine and liver among others, are uniquely IFN-λ sensitive. In particular, IFN-λs have been shown to protect against pulmonary influenza and human metapneumovirus (HMPV) (7, 8), gastrointestinal rotavirus and norovirus (9, 10) and hepatic HBV and HCV (11, 12). While the majority of human studies have been performed in vitro, murine studies have shown potent antiviral effects of IFN-λs against numerous viruses including influenza and SARS coronavirus (13, 14), rotavirus, norovirus, and reovirus (15–17). It should be noted that IFNLR1 expression may differ between humans and mice, as exemplified in murine hepatocytes that do not respond to IFN-λ (18). Immune cells also demonstrate very restricted IFN-λ responsiveness with myeloid immune cell populations harboring the strongest responses: Human dendritic cells (DC) and neutrophils are highly responsive to IFN-λs (19–23), whereas natural killer (NK) and T cells have consistently demonstrated minimal responsiveness (21, 24, 25). Investigation of monocyte and B cell responsiveness has produced conflicting results (21, 24, 26–30), perhaps confounded by studies utilizing co-culture models in the presence of IFN-λ responsive cells (31–33). As such, isolation of pure immune cell subsets is required to unequivocally define IFN-λ sensitivity.
Here, we demonstrate that human macrophages, not monocytes, are a dominant, physiologically relevant IFN-λ responsive population capable of orchestrating tissue inflammation. This is achieved through a direct immuno-stimulatory response to IFN-λ and subsequent NK and T cell chemotaxis and activation. In vivo, macrophages are responsive to IFN-λ3 and accumulate in inflamed human liver. These data suggest a novel role of macrophages as key players in modulating the IFN-λ response in acute infection, as well as chronic disease.
Results
Macrophages Not Monocytes Are Responsive to IFN-λ
To address the uncertainty surrounding monocyte and macrophage (Mϕ) IFN-λ-responsiveness, we measured mRNA expression of the IFN-λ receptor, IFNLR1, in blood leukocytes by digital droplet PCR (ddPCR). DdPCR enables the precise quantification of RNA transcripts by performing the PCR reaction within >10,000 oil droplets, and calculating transcript copies using Poisson's law of small numbers (34). IFNLR1 expression in freshly isolated monocytes and in Mϕs cultured for 7 days with GM-CSF was compared to IFN-λ responsive cells (pDCs) and “unresponsive” cells (NK and T cells). Similar to NK and T cells, monocytes expressed minimal IFNLR1 transcript. Mϕ and pDC IFNLR1 expression was significantly increased compared to other populations, suggesting IFN-λ responsiveness (Figure 1A). Increased abundance of IFNLR1 was confirmed following monocyte to macrophage differentiation using seven datasets from the NCBI Gene Expression Omnibus (35) (Figure S1). To assess IFNLR1 expression during differentiation, IFNLR1 expression was quantified over 24 h (qPCR, no differentiation stimulus) and 7 days (flow cytometry, GM-CSF differentiation) following monocyte plating. Expression of the IFNLR1 transcript was quickly increased as early as 16 h post-plating, reaching a 30-fold increase at 24 h (Figure 1B). IFNLR1 surface expression was significantly increased at day 3 (monocyte IFNLR1 MFI 927 vs. day 3 Mϕ 3199) and further increased at day 7 (day 7 Mϕ IFNLR1 MFI 10,412) (Figure 1C).
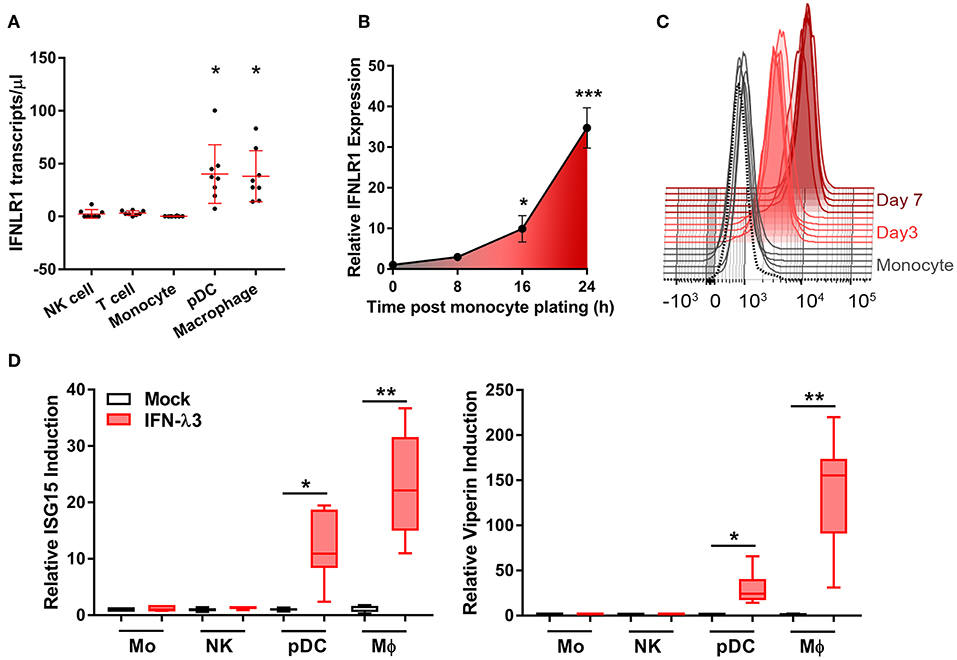
Figure 1. Macrophages but not monocytes are highly IFN-λ3 responsive. To investigate IFN-λ responsiveness, immune cell subsets were magnetically isolated and IFNLR1 expression was quantified by ddPCR (A). Mϕ and pDC IFNLR1 expression was significantly higher than monocyte, NK and T cell populations (p < 0.05, n = 8). Time course analysis demonstrated that IFNLR1 expression quickly rises following monocyte plating, reaching a 30× increase at 24 h even in the absence of GM-CSF addition (p < 0.001, n ≥ 5) (B). Similarly, IFNLR1 surface expression during macrophage differentiation (MFI) increased at days 3 and 7 (p < 0.001, n ≥ 5) (C). Isolated immune cell subsets were treated with 100 ng/ml IFN-λ3 for 8 h and the expression of ISGs viperin and ISG15 were examined (n ≥ 7) (D). Consistent with IFNLR1 expression, Mϕs and pDCs were highly responsive to IFN-λ3, whereas monocytes and NK cells were not (n ≥ 5). Data are representative of two (B,C) and three independent experiments (A,D). One-way ANOVA (A), Mann–Whitney test (B,D), paired t-test (C), *p < 0.05, **p < 0.01, ***p < 0.001 (mean ± SE).
To test monocyte and Mϕ responsiveness to IFN-λ, cells isolated and cultured as in Figure 1A were treated with 100 ng/ml IFN-λ3 for 8 h. This concentration is not a saturation dose, but is high enough to evoke a strong interferon response in Mϕs (Figure S2). Consistent with increased IFNLR1 expression, Mϕ and pDC mRNA expression of viperin and ISG15 were markedly increased (Figure 1D), whereas monocytes and NK cells demonstrated negligible responses.
Differentiation Method Regulates IFN-λ Responsiveness
Mϕ differentiation medium containing IFN-γ and LPS or interleukin 4 (IL-4) and IL-13 are often used to generate pro-inflammatory (M1) or anti-inflammatory (M2) Mϕs, respectively, but do not reflect the spectrum of macrophage activation in vivo (36). To avoid generating Mϕs whose IFN-λ sensitivity is influenced by phenotype skewing, monocytes were differentiated for 7 days with GM-CSF or M-CSF alone, as previously described (37, 38). The resulting Mϕ populations are differentially responsive to inflammatory stimuli, and are thus M1- or M2-shifted while maintaining some baseline characteristics of polarized Mϕs (Figure S3).When compared to monocyte derived DCs (MDDCs) generated using IL-4 and GM-CSF, the resulting Mϕs express elevated surface expression of CD14 and CD16, reduced CD1C, and unlike MDDCs, adhere strongly to culture dishes (Figure S4). M1- and M2-shifted Mϕs will be termed GM-Mϕs and M-Mϕs for the remainder of the manuscript.
IFN receptor expression and response to type I and III IFNs was examined in monocytes and Mϕs. Mϕ differentiation increases the abundance of the type I IFN receptor, IFNAR1 transcript (Figure 2A), and protein (Figure 2B) ~2-fold as compared to monocytes irrespective of stimulus. IFNLR1 transcript abundance was increased in M-Mϕs and GM-Mϕs over 30- and 60-fold, respectively. The IFN-λ co-receptor IL10RB was also measured, and was not significantly modulated following macrophage differentiation (Figure S5). Consistent with gene expression, IFNLR1 protein was absent in monocytes, and increased in GM-Mϕs compared to M-Mϕs. The IFNLR1 bands at 70 and 45 kDa represent the full length and soluble isoforms of IFNLR1, respectively (24).
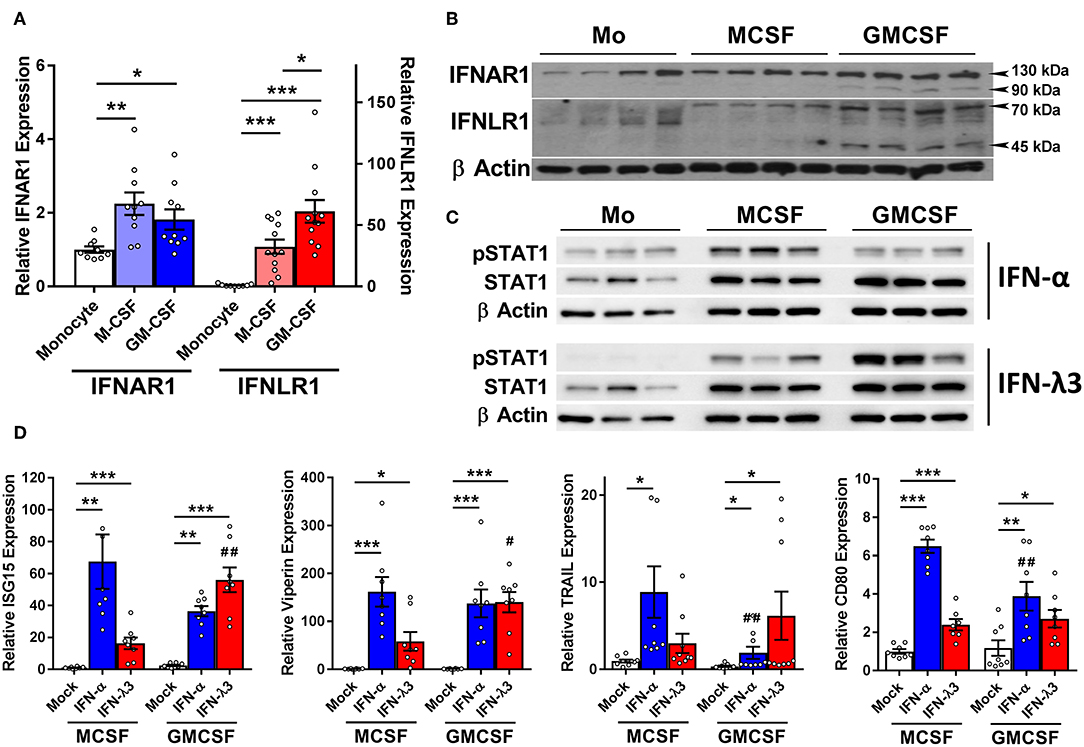
Figure 2. M-CSF and GM-CSF differentiated macrophages respond differently to IFN-α and IFN-λ3. Following M- and GM-CSF stimulated differentiation, IFN-λ responsiveness of Mϕ populations was examined, and compared to IFN-α. M-CSF and GM-CSF Mϕ subsets both increased the expression of IFNAR1 ~2-fold following differentiation from monocytes, and IFNLR1 transcripts ~30- and 60-fold, respectively (A) (n ≥ 9). Western blot of IFNAR1 and IFNLR1 from four healthy subjects confirmed these findings (B) (n = 7, total). Supporting these findings, phosphorylation of STAT1 was detected by Western blot in both monocytes and macrophages following 15 min of IFN-α treatment and macrophages only following IFN-λ3 (C). ISG transcripts for ISG15, viperin, CD80, and TRAIL were examined to measure Mϕ sensitivity to IFN-α (50 U/ml) and IFN-λ3 (100 ng/ml) (D) (n = 8). M-CSF differentiated Mϕs were more responsive to IFN-α, whereas GM-CSF differentiated Mϕs, IFN-λ3. Data are representative of two independent experiments. Paired t-test */#p < 0.05, **/##p < 0.01, ***p < 0.001 (mean ± SE). *Mock vs. IFN treatments, #M-Mϕ vs. GM-Mϕ.
To confirm that elevated IFNLR1 expression confers response to IFN-λs, monocytes and Mϕs from three healthy subjects were treated with IFN-λ3 for 15 min and STAT1 phosphorylation (Y701) was examined by Western blot. Monocytes did not phosphorylate STAT1 in response to IFN-λ3, whereas both M-Mϕs and GM-Mϕs were highly sensitive (Figure 2C). All cells demonstrated no STAT1 phosphorylation pre-treatment (Figure S6).
Mϕs were subsequently treated with either interferon-alpha (IFN-α) or IFN-λ3 to determine whether cognate receptor expression defines sensitivity. Following 8 h of IFN-α or IFN-λ3, all measured ISGs were significantly increased by both IFNs (Figure 2D). M-Mϕs were more sensitive to IFN-α, demonstrating stronger induction of all ISGs, particularly CD80 and TRAIL. In contrast, GM-Mϕs were more sensitive to IFN-λ3, increasing the expression of both ISG15 and viperin compared to M-Mϕs. To confirm that macrophage differentiation and not treatment with M- or GM-CSF specifically induce IFNLR1 expression, monocytes were also differentiated using 10% autologous human serum from healthy individuals. Compared monocytes, human serum differentiated macrophages (HS-Mϕs) possess increased IFNLR1 transcript abundance and possessed similar IFN-λ3 responsiveness as MDDCs and GM-Mϕs, both of which express high levels of IFNLR1 (Figure S7).
IFN-λ3 Drives a Pro-inflammatory Macrophage Phenotype
The robust induction of IFNLR1 following monocyte plating suggests that monocytes quickly become IFN-λ responsive upon differentiation and transmigration into tissues. Consequently, in the context of chronic antigen exposure, IFN-λ expression at sites of inflammation will likely influence monocyte differentiation and subsequent Mϕ phenotype due to their prolonged exposure throughout the differentiation process. To test this hypothesis, we differentiated monocytes for 7 days with either M-CSF or GM-CSF alone (differentiation stimulus), or in combination with IFN-λ3 (activation stimulus), followed by transcriptional and functional assessment of Mϕ phenotype (Figure 3A).
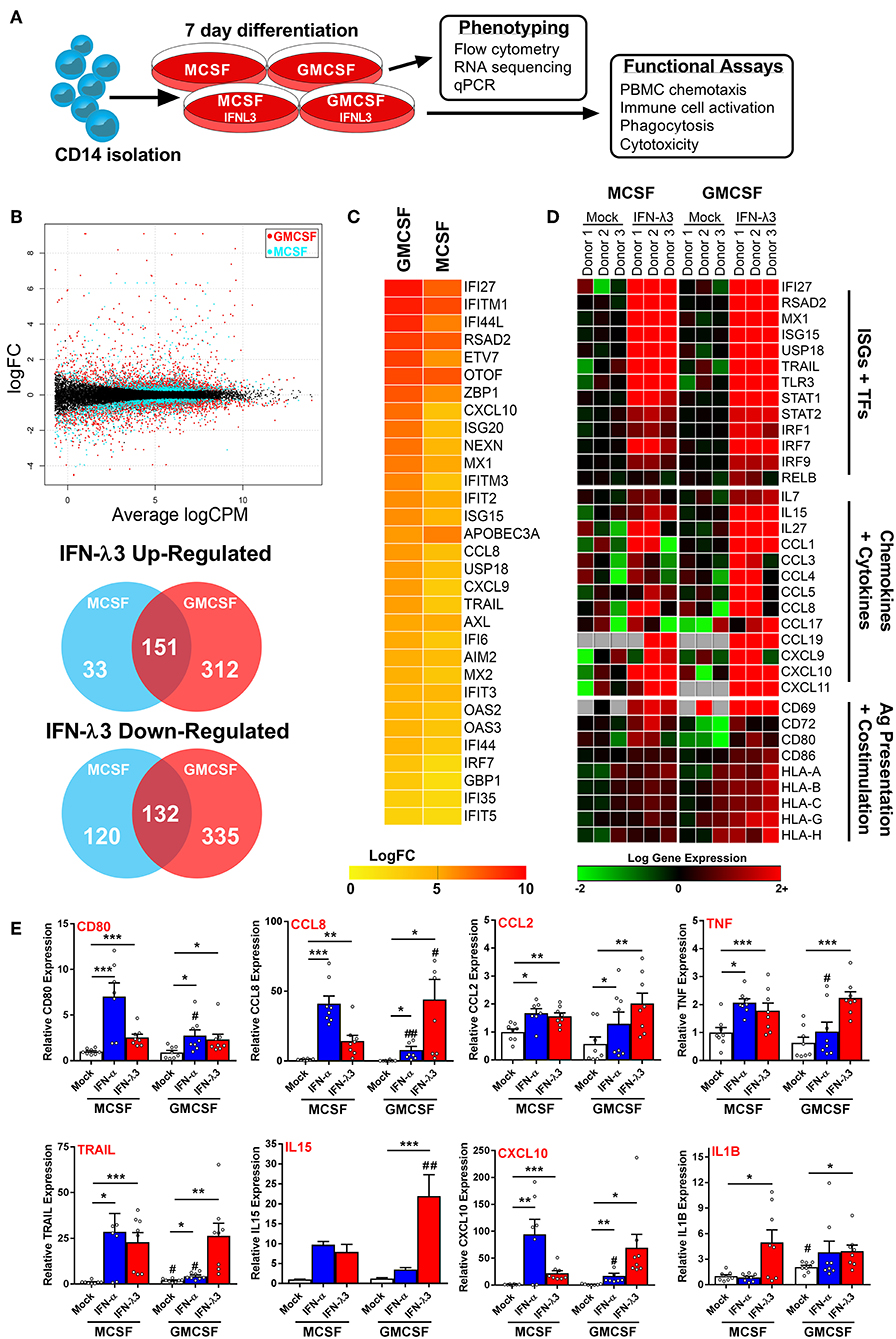
Figure 3. Monocyte differentiation with IFN-λ3 drives a pro-inflammatory macrophage phenotype. Monocytes were cultured with M- or GM-CSF ± IFN-λ3 for 7 days to examine the effect of IFN-λ3 on Mϕ differentiation, followed by phenotypic and functional characterization (A). RNA sequencing (n = 3/treatment) demonstrated that GM-CSF Mϕs were significantly more responsive to IFN-λ3, as demonstrated by smear plot and Venn diagram of genes regulated above 2-fold (B). GM-CSF Mϕ ISG induction was significantly stronger, as demonstrated by heat map of gene log 2-fold change (logFC) (C). IFN-λ3 increased transcript abundance of numerous ISGs and transcription factors (TFs) in both Mϕ sets, as well as numerous chemokines, cytokines, and genes responsible for antigen (Ag) presentation and co-stimulation, particularly in GM-CSF Mϕs (D). IFN-λ3 stimulated genes were confirmed by qPCR, using IFN-α differentiated Mϕs as a comparison (E) (n = 8). Quantitative PCR data are representative of three independent experiments. Paired t-test */#p < 0.05, **/##p < 0.01, ***p < 0.001 (mean ± SE). *Mock vs. IFN treatments, #M-Mϕ vs. GM-Mϕ.
RNA sequencing of M-Mϕs and GM-Mϕs from three donors was undertaken followed by paired analysis of transformed gene counts (Log 2) between untreated and IFN-λ3 treated Mϕs (Tables S1, S2). The resulting smear plot demonstrates significantly up and down-regulated genes following differentiation of M-Mϕs (blue) and GM-Mϕs (red) with IFN-λ3 (Figure 3B). GM-Mϕs were significantly more responsive to IFN-λ3, up-regulating 463 genes ≥2-fold compared to 184 genes in M-Mϕs. Similarly, GM-Mϕs down-regulated 467 genes ≥2-fold compared to 252 genes in M-Mϕs. IFN-λ driven ISG induction was also collectively higher in GM-Mϕs as demonstrated by the heat map of gene expression LogFC (Figure 3C).
Functional analysis of data from Mϕs differentiated with IFN-λ3 revealed numerous well defined ISGs (e.g., IFI27, MX1, and TLR3) and transcription factors (STAT and IRF gene families) responsible for ISG gene transcription (Figure 3D). In addition, a Th1 chemokine profile (CCL3, 4, and 5 and CXCL9, 10, and 11) responsible for CCR5 and CXCR3 mediated immune cell chemotaxis (39) was found in response to maturation with IFN-λ3, with stronger induction in GM-Mϕs. Up-regulation of immune cell interaction and activation (CD80, CD86, and IL15) as well as antigen presentation [major histocompatibility complex (MHC) class I HLA genes] was also observed. Using transcriptomic markers of M1 and M2 Mϕ differentiation, IFN-λ3 was found to induce the expression of the majority of M1, but not M2 markers, in both M and GM-differentiated Mϕs, supporting the movement toward an M1 phenotype (GM-CSF p < 0.001, M-CSF p < 0.05, Sign test null hypothesis of 0.5) (Figure S8).
Gene induction was confirmed by qPCR from a larger group of donors including individuals used for RNA sequencing data, and compared to the effects of IFN-α differentiation. M-Mϕs were considerably more sensitive to IFN-α, whereas GM-Mϕs responded strongly to IFN-λ (Figure 3E). In addition to chemokines identified by RNA sequencing, inflammatory mediators including CCL2, IL1B, and TNF transcripts were increased by IFN-λ in both Mϕ subsets. To assess the role of differentiation (M- vs. GM-CSF), interferon treatment (IFN-α and -λ3), and their subsequent interaction, a 2-way ANOVA was additionally performed. As expected, all ISGs measured were significantly affected by IFN treatment (p < 0.01), however only CD80 expression was influenced by differentiation (p < 0.01). In agreement with RNA-Seq analysis, a significant interaction between IFN treatment and differentiation was observed for all measured genes (CXCL10, CCL8, IL15; p < 0.001, CD80; p < 0.01, TRAIL, TNF; p < 0.05) apart from IL1B and CCL2.
Analysis using Metacore functional annotation software demonstrated that similar networks were activated by IFN-λ3 in both M-Mϕs and GM-Mϕs (Table 1). Immune activation was considerably stronger in GM-Mϕs, with highly significant p-values in networks such as antigen presentation and lymphocyte proliferation. Down-regulated gene networks were primarily associated with the cell cycle and protein translation (Table S3). This analysis is consistent with Mϕ BrdU assays, which demonstrated a reduction in BrdU incorporation following IFN-α (p < 0.05) and IFN-λ3 (NS) treatment (Figure S9).
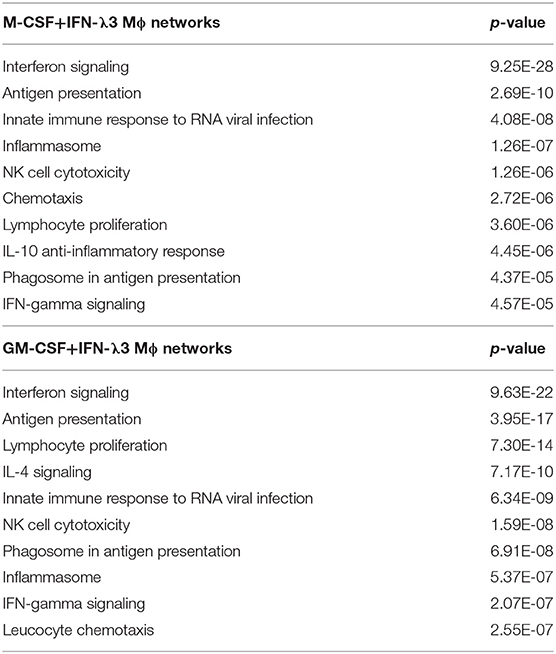
Table 1. Metacore gene networks up-regulated by IFN-λ3.
Interferon Lambda Promotes Lymphocyte Migration and NK Cell Degranulation
To determine the extent at which Mϕs differentiated with IFN-λ can drive immune cell migration, transwell migration assays were performed using autologous PBMCs. Following 24 h transwell incubation, migrated cells were removed from the lower chamber and analyzed by flow cytometry (Figure 4A). IFN-λ stimulated lymphocyte migration solely in GM-Mϕs by ~25% more than M-Mϕs (Figure 4B), with NK, T, and NKT cell populations being most affected. Separate measurement of GM-Mϕ media demonstrated that IFN-λ3 stimulated a significant increase in CCL2 (1.8×), CCL3 (3×), CCL4 (2.75×), and CXCL10 secretion (~5×), with minimal effect on M-Mϕs (Figure 4C).
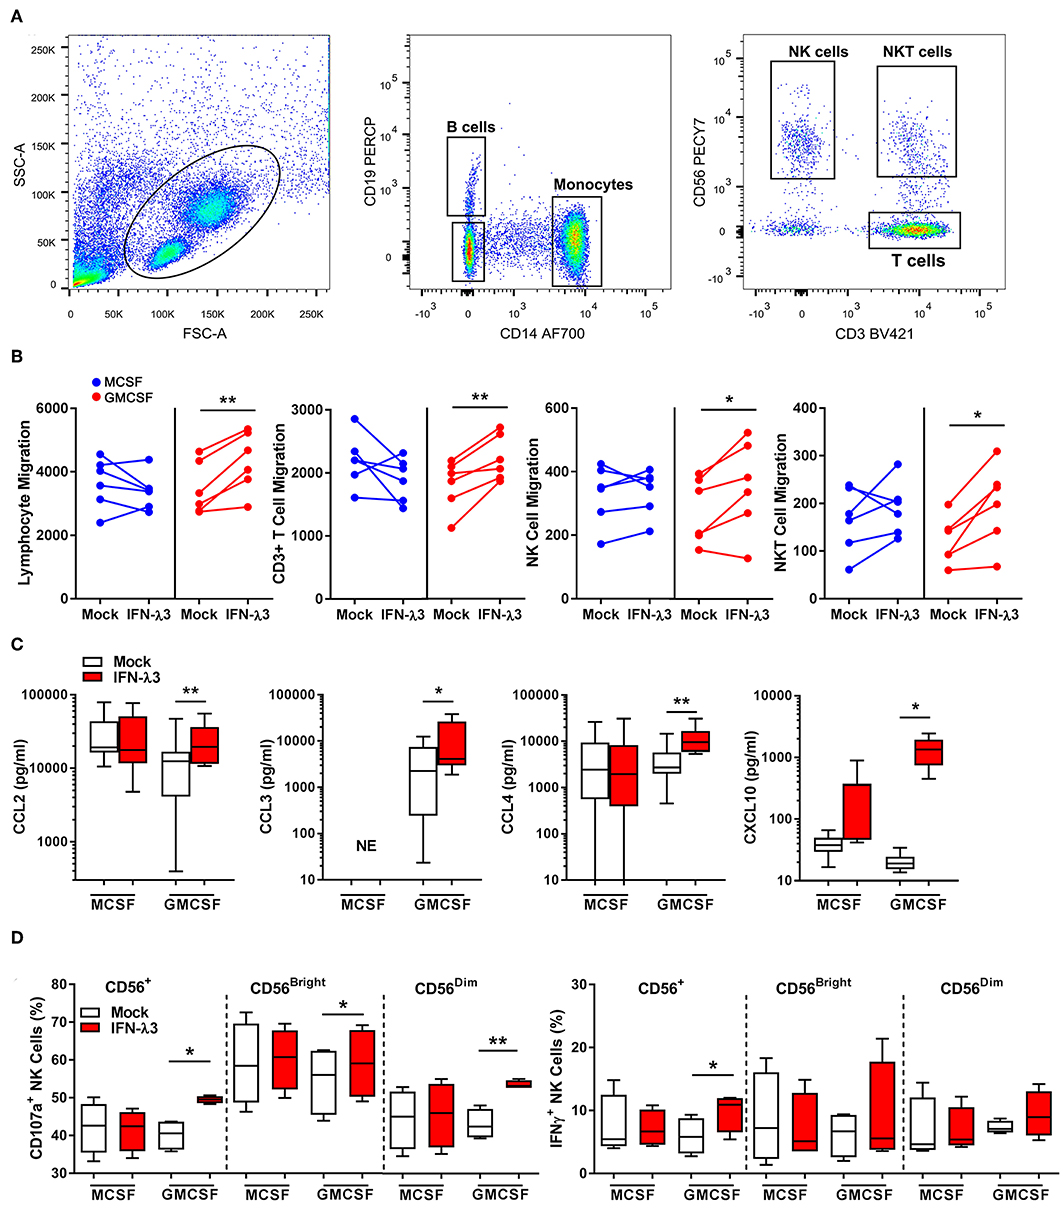
Figure 4. Macrophages differentiated with IFN-λ3 induce lymphocyte chemotaxis and NK cell activation. Transwell inserts containing autologous PBMCs were placed into wells containing 6-day differentiated Mϕs ± IFN-λ3 to examine immune cell chemotaxis (n = 6). Migrated cells were analyzed by flow cytometry using CD14, CD19, CD3, and CD56 antibodies to identify the number of migrated monocytes, B, NK, and T cells (A). The addition of IFN-λ3 to GM-CSF Mϕs alone, stimulated lymphocyte migration, with significant increases in NK, NKT, and T cell migration (B). Consistent with migration data, GM-Mϕ CCL2, CCL3,CCL4, and CXCL10 secretion were significantly increased by IFN-λ3, with no significant effect on M-Mϕs (C) (n = 7). To assess the role of IFN-λ3 on Mϕ activation of NK cells, autologous NK cells were incubated with Mϕs for 16 h a ratio of 1:1, removed and incubated with K562 target cells for a further 6 h to measure cytotoxicity by degranulation and IFN-γ expression (n = 4). GM-Mϕs differentiated with IFN-λ3 significantly increased NK cell cytotoxicity as measured by CD107a expression, as well as IFN-γ production (D). Data are representative of two (B,D) and three (C) independent experiments. Paired t-test *p < 0.05, **p < 0.01 (mean ± SE). NE, No expression.
Co-culture experiments were next performed to assess the capacity of IFN-λ matured Mϕs to stimulate NK cells in vitro. NK cells were incubated with Mϕs overnight, removed, and co-cultured with K562 cells. K562 cells lack MHC class I expression, making them targets for NK cell killing. A significant increase in NK cell degranulation (CD107a), particularly within the CD56dim population, was observed following co-culture with IFN-λ3 treated GM-Mϕs (Figure 4D). NK cell IFN-γ production was also increased following co-culture with IFN-λ3 treated GM-Mϕs, but significance was lost within subgroup analysis. Minimal effect on NK cell function was observed following M-Mϕ co-culture.
IFN-λ Stimulates Macrophage Phagocytosis and Cytotoxicity
To examine the effect of IFN-λ3 on Mϕ effector function that is not associated with an inflammatory phenotype, phagocytosis was examined by flow cytometry. Tissue resident Mϕs that demonstrate an M2 phenotype are highly phagocytic and efficient at presenting antigen (40), a phenotype that can be replicated in vitro (41, 42). UV induced apoptotic K562 cells stained with Zombie Yellow viability stain or DAPI labeled E. coli were incubated with Mϕs for 1 h at a ratio of 2:1 and 4:1, respectively. The ratio of double-fluorescent (phagocytic, CD14+) cells to mono-fluorescent (non-phagocytic, CD14+) cells, as measured by flow cytometry (Figure 5A) was calculated to determine the phagocytic Mϕ percentage (Figure 5B). Confocal microscopy was additionally used to confirm cell engulfment. IFN-λ3 increased phagocytosis of K562 cells (30% increase) and E. coli bacteria (10% increase) in M-Mϕ alone. Mϕ MFI, indicating of the number of engulfed target cells, was consistent among populations when K562 cells were used as targets, likely reflecting their large size in comparison to Mϕs. Conversely, M-Mϕ DAPI MFI, representing bacterial engulfment, was significantly higher than M-Mϕs, representing an increase in the number of phagocytosed bacteria. To determine the mechanism by which IFN-λ3 stimulates apoptosis, RNA-Seq data was queried, with a focus on Mϕ receptors responsible for pathogen and apoptotic cell recognition. Consistent with an M2 phenotype, M-Mϕs possessed higher expression of PRRs (TLR2, TLR4, and CD163), apoptotic ligand receptors (CD36 and MERTK) and complement transcripts (C1Q and C2) (Figure S10A). IFN-λ3 had minimal effect on the expression of most phagocytic receptors, but significantly increased key members of the complement cascade (C1S and C1R) (Figure S10B). These data suggest that activation of the complement system by IFN-λ3 may stimulate M-Mϕs phagocytosis of both bacterial and apoptotic cells (43, 44), however further functional analysis is required.
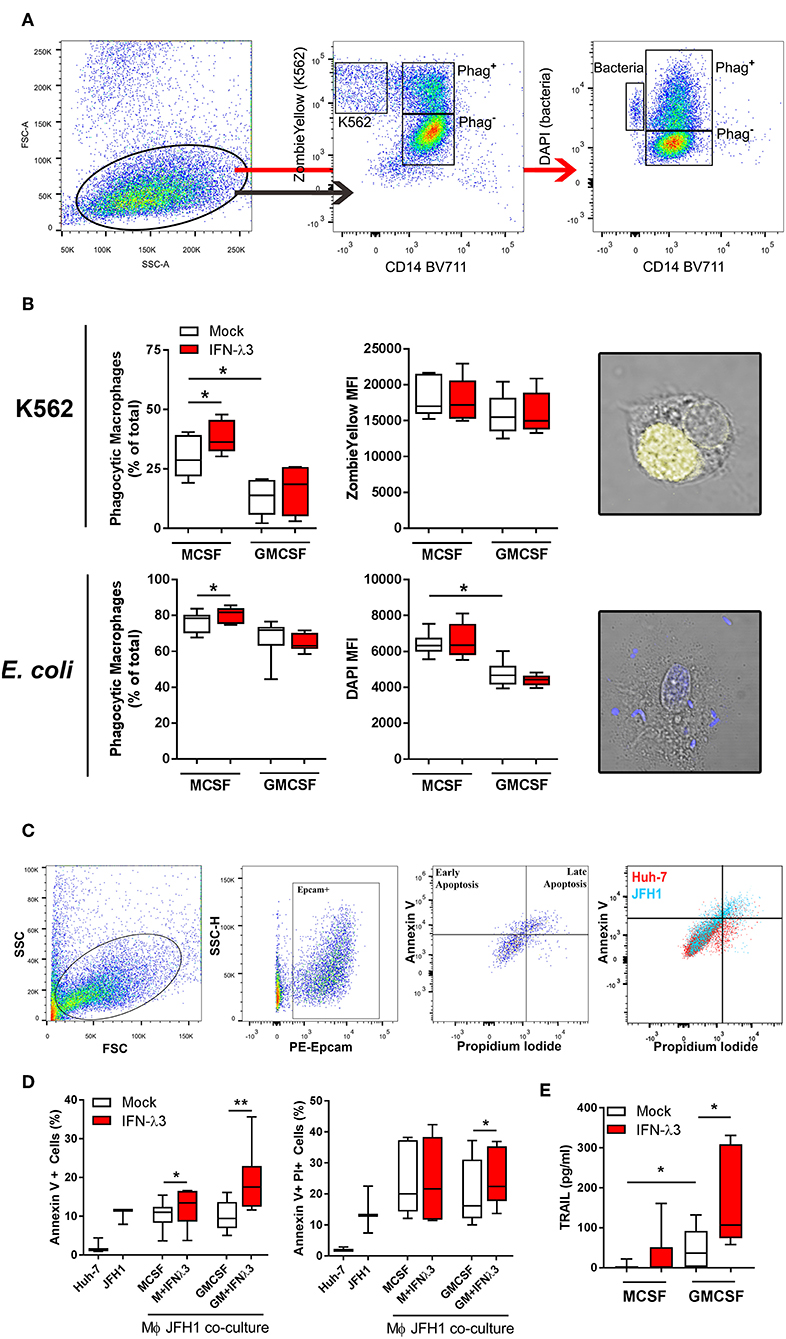
Figure 5. IFN-λ3 stimulates macrophage phagocytosis of apoptotic cells. To examine the role of IFN-λ3 on macrophage phagocytosis, apoptotic K562 cells or E. coli were added to Mϕ cultures for 1 h at a ratio of 2:1 and 4:1, respectively. Phagocytic Mϕs were defined as cells double fluorescent for CD14 (BV711), and ZombieYellow viability stain/DAPI, representing target cell engulfment (A). M-Mϕs were more phagocytic than GM-Mϕs toward K562 cells (2-fold increase, p < 0.05), a phenotype that was further increased by IFN-λ3 (B) (n = 6). Similarly, IFN-λ3 increased E. coli engulfment in M-Mϕs only. Mϕ MFI, representing the number of cells engulfed remained unchanged in response to IFN-λ3. To assess cytotoxicity toward virus infected cells, Mϕs were co-cultured with JFH1 infected Huh-7 cells, and apoptosis was quantified in Epcam+ Huh-7 cells using propidium iodide (PI) and Annexin V (C) (n = 7). IFN-λ3 stimulated GM-Mϕ cytotoxicity, increasing the percentage of early (Annexin V+) and late (Annexin V+, PI+) apoptotic cells, whereas early apoptosis alone was affected in M-Mϕs (D). TRAIL expression was up-regulated by IFN-λ3 in GM-Mϕs only, providing a possible mechanism of cytotoxicity (E). Data are representative of two independent experiments. Wilcoxon matched pairs signed rank test (B,E), paired t-test (D) *p < 0.05, **p < 0.01 (mean ± SE).
To quantify the ability of Mϕs to kill virus infected cells (cytotoxicity), Mϕs were co-cultured with HCV infected (JFH1 strain) Huh-7 cells for 24 h. Following incubation, Huh-7 cells were labeled with Epcam, Annexin V, and propidium iodide (PI) to quantify cells undergoing apoptosis (Figure 5C). Additionally, Huh-7 and JFH1 infected Huh-7 cultures were used as controls to confirm HCV mediated Huh-7 cell apoptosis, as previously described (45). M- and GM-Mϕs differentiated with IFN-λ3 stimulated an increase of early apoptotic (Annexin V+, PI−) cells, by ~20 and 90%, respectively, compared to mock treated controls (Figure 5D). GM-Mϕs alone increased Annexin V+, PI+ cells, representing late apoptosis by ~20% following IFN-λ3 treatment. The cytotoxic mechanism by which Mϕs killed infected cells has not been determined, but is likely mediated by soluble factors such as TRAIL that is highly inducible following IFN-λ3 treatment in GM-Mϕs in particular (Figure 5E). Low expression of TRAIL in untreated Mϕs may explain the apparent lack of apoptosis following co-culture. In addition, no nitric oxide production by M- or GM-Mϕs was found in response to IFN-λ3, bacterial or infected cell stimulus. To validate Huh-7 cell apoptosis results, qPCR for apoptosis markers Caspase 3 (Casp3), Caspase 7 (Casp7), and Bax were performed (Figure S11). Co-culture with IFN-λ3 differentiated GM-Mϕs increased Casp3 and 7 expression by ~6-fold in addition to increasing the antiviral response of Huh-7 cells as demonstrated by strong induction of ISGs viperin and ISG15.
Liver Macrophages Are IFN-λ3 Responsive in vivo
To assess IFN-λ production in vivo, we measured the expression of IFNL genes in liver biopsies of chronic HBV, HCV, and NAFLD/NASH patients and compared them to normal liver tissue from benign liver resections. IFNLs were increased in both viral (>10-fold IFNL1, IFNL2/3 HCV vs. healthy) and non-viral (e.g., ~2-fold IFNL1, IFNL2/3 NAFLD/NASH vs. healthy) liver disease (Figure 6A), indicating that chronic inflammatory conditions can increase hepatic IFN-λ expression to facilitate the generation of inflammatory macrophages in vivo.
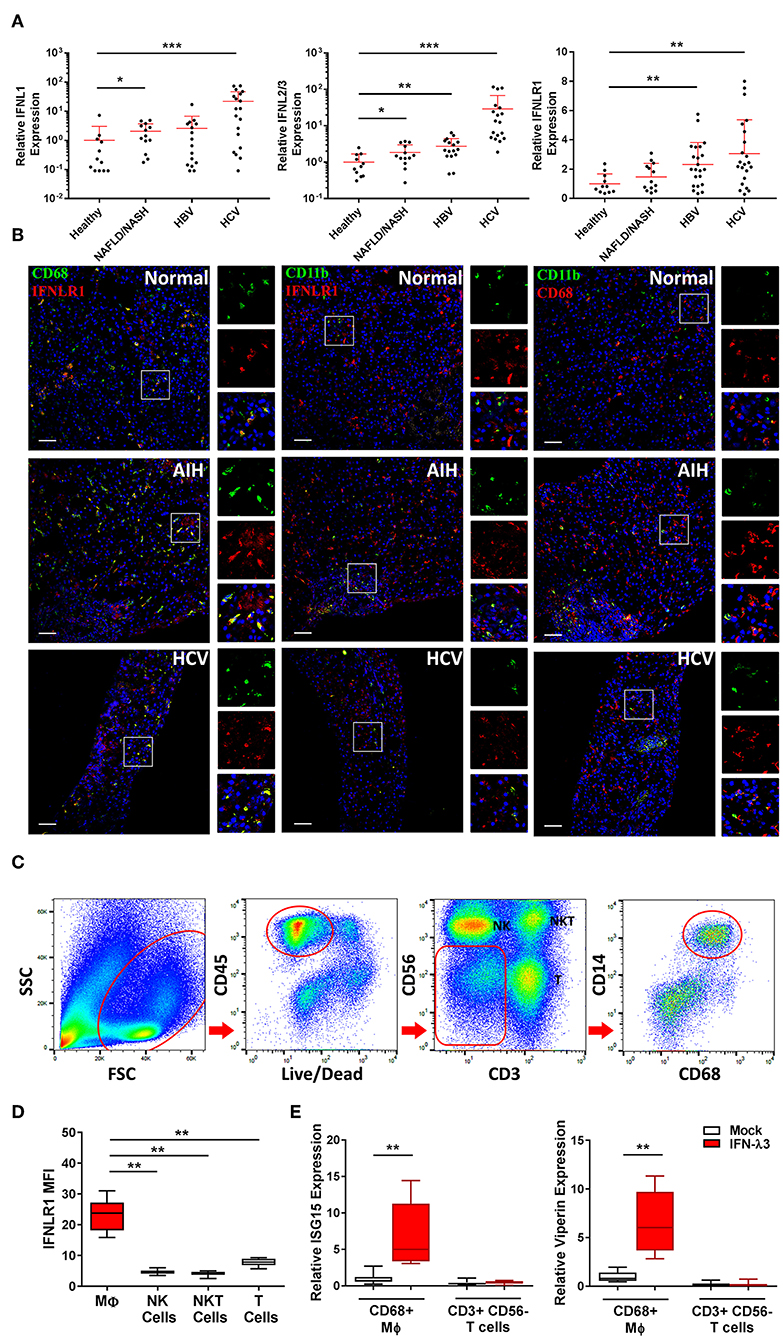
Figure 6. Hepatic IFN-λ3 responsive macrophages are present in vivo. IFNL1, IFNL2/3, and IFNLR1 mRNA expression was measured in healthy, NAFLD/NASH, HBV, and HCV infected liver tissue (n ≥ 9/group) (A). To examine IFNLR1 expression in vivo, biopsy sections obtained from healthy, autoimmune hepatitis, and HCV infected liver tissue were labeled with monocyte/Mϕ markers CD11b and CD68 as well as IFNLR1 antibodies, and examined by confocal microscopy (B). To assess the responsiveness of liver Mϕs to IFN-λ3, immune cells were isolated from fresh liver tissue, sorted by FACS and cultured in the presence of IFN-λ3. Live CD45+ immune cells were sorted based on the expression of CD3 and CD56 into NK and T cell subsets, and CD14 and CD68 into Mϕ subsets (C). IFNLR1 expression, as determined based on IFNLR1 MFI was compared among liver immune cell subsets, and was significantly higher in CD14+, CD68+ liver Mϕs, as compared to NK (CD56+), NKT (CD3+, CD56+), and T cells (CD3+, CD56−) (D) (n = 6). Sorted T cells and Mϕs were cultured with 100 ng/ml IFN-λ3 for 10 h and ISG mRNA expression was compared to mock treated cells (E) (n = 8). Scale bars represent 100 μm. Data are representative of one cell sorting experiment. Wilcoxon matched pairs signed rank test, *p < 0.05, **p < 0.01, and ***p < 0.001 (mean ± SE).
To demonstrate the presence of IFN-λ responsive Mϕs in vivo, we performed immunofluorescent labeling of liver tissue from a patient with autoimmune hepatitis (AIH), chronic HCV infection, and normal liver obtained from a cancer resection. Biopsies were labeled with IFNLR1 and CD68 or CD11b antibodies to identify IFN-λ responsive liver Mϕs (Kupffer cells) or myeloid populations (monocytes/macrophages/neutrophils), respectively. As demonstrated in Figure 6B, all CD68+ and a fraction of CD11b+ cells were labeled with IFNLR1.
Immuno-labeling was also performed using CD68 or CD11b in combination with CD3 to demonstrate immune cell proximity in inflamed tissue (Figure S12). CD3+ T cells localized in proximity to CD68 Mϕs, supporting a role for Mϕ derived chemokines as mediators of immune cell trafficking.
To confirm that liver Mϕs are responsive to IFN-λs, CD68+ Mϕs were harvested from liver resection tissue by cell sorting (Figure 6C), and treated with 100 ng/ml IFN-λ3 ex vivo. Consistent with our in vitro findings, liver Mϕs highly express IFNLR1 compared to liver NK (CD3− and CD56+), NKT (CD3+ and CD56+), and T cells (CD3+ and CD56−) (Figure 6D). In addition, Mϕ IFNLR1 MFI negatively correlated with blood white blood cell count (r = −0.678, p < 0.05) and positively correlated with hepatic T cell enrichment as a percentage of CD45 cells (r = 0.712, p < 0.05).
To compare IFN-λ3 sensitivity, T cells and Mϕs from each individual were cultured for 10 h in media alone or with IFN-λ3, followed by quantification of ISG expression. T cells were unresponsive to IFN-λ3 as demonstrated by a lack of ISG15 and viperin induction (Figure 6E). Conversely, IFNLR1 expressing Mϕs were highly responsive to IFN-λ3, increasing the abundance of both transcripts ~6-fold.
Discussion
The cellular and molecular mechanisms by which IFN-λ modulates host responses to viral infections and tissue inflammation remains unclear. Here we undertook comprehensive functional characterization to demonstrate both in vitro and ex vivo, that macrophages are likely immune cell drivers of IFN-λ mediated hepatic antiviral and inflammatory activities. Unlike monocytes, macrophages are highly sensitive to IFN-λ through the induction of IFNLR1 expression. As such, monocytes likely become IFN-λ responsive upon movement into tissue and subsequent differentiation. Upon IFN-λ stimulation, macrophages develop a robust immune-stimulatory gene signature, expressing hundreds of ISGs, cytokines, chemokines, and co-stimulatory molecules to stimulate both autocrine and paracrine immune cell activation (Figure 7).
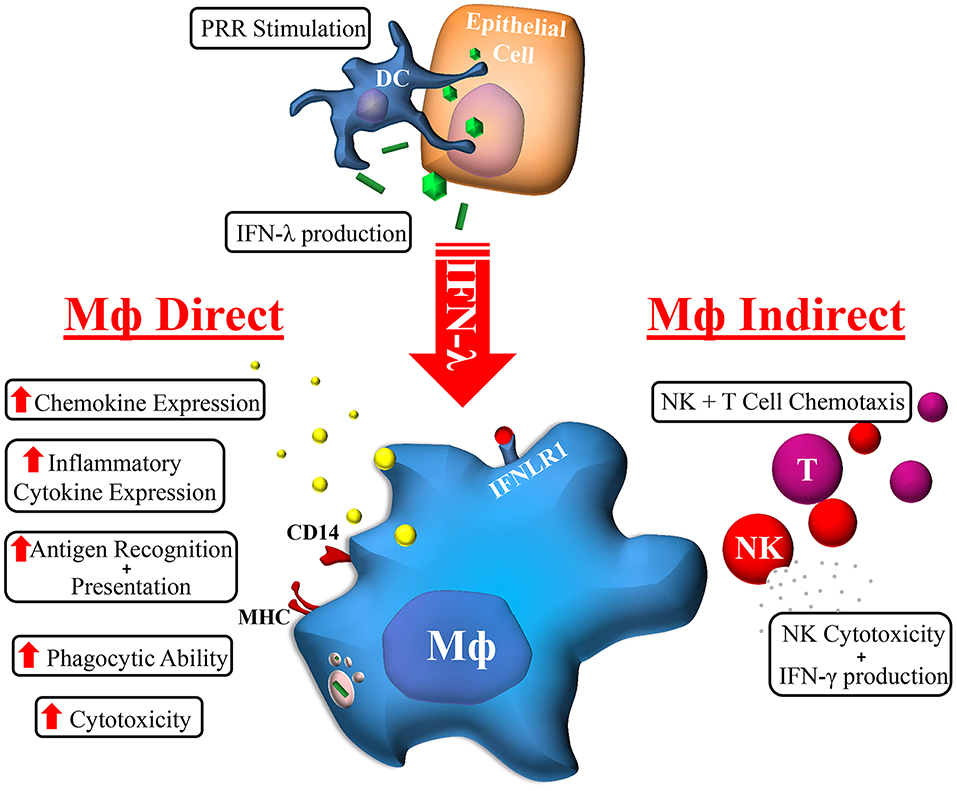
Figure 7. Macrophage orchestration of the IFN-λ immune response. In response to TLR stimulation by viral, bacterial, or fungal pathogens, IFN-λ produced by epithelial (e.g., hepatocytes) or immune cells (e.g., DC) can stimulate the expression of hundreds of Mϕ ISGs. The subsequent effects of IFN-λ on Mϕs can be categorized into direct and indirect effects: Mϕs cytotoxicity and phagocytic ability is increased, as is antigen recognition and presentation, and cytokine/chemokine secretion. Subsequent indirect effects include NK and T cell chemotaxis and increased NK cell cytotoxicity and IFN-γ production.
IFN-λs are inducible cytokines that drastically increase in abundance upon viral infections, but can also effectively protect against bacterial and fungal insults (46, 47). Activation of TLRs 3, 4, 5, 7, 9 (48, 49) can drive IFN-λ expression, which is dependent factors including cell type and cellular environment. IFN-λs are necessary for epithelial barrier protection in the lungs, liver and gastrointestinal tract, however their dysregulation has been associated with a number of diseases that lack an obvious association with microbial infection. These include chronic inflammatory diseases such as psoriasis (50), systemic lupus erythematosus (51), and asthma (52). Consequently, it is important to understand the direct and indirect molecular mechanisms by which IFN-λs are induced, as well as the responding cellular identities.
The effectiveness of direct acting antiviral therapy for chronic HCV infection has ultimately overshadowed the antiviral role of IFN-λs in the liver, however there remains much to be understood regarding the immuno-stimulatory and potentially destructive roles of these unique cytokines. Recent evidence suggests that IFNL genotype influences IFN-λ expression in the liver to facilitate immune cell migration and subsequent inflammation (4, 5). Unlike IFN-λ4 which is weakly secreted by hepatocytes (53, 54), IFN-λs 1–3 are highly expressed, and can exert paracrine effects on surrounding immune cells. This is consistent with reports showing increased Mϕ activation in patients possessing the favorable IFNL genotype (55). The importance of the Mϕ response is additionally underscored by the fact that Mϕ but not hepatocyte ISG expression is positively associated with both the favorable IFNL genotype that produces increased IFN-λ3 and antiviral response (56, 57).
Both PCR and RNA-Seq analysis support the IFN-λ sensitive nature of GM-Mϕs and highlight the stimulatory role of IFN-λ3. Increased expression of pattern recognition receptors [TLR3, IFIH1 [MDA5], DDX58 [RIG-I]] in response to IFN-λ can increase antigen recognition, as we have shown in Figure 5. Numerous pro-inflammatory transcription factors including STATs 1–3, IRFs 1, 7, and 9, AP-1, and NFκB components were activated in response to IFN-λ, as demonstrated by an enrichment of their respective target genes (Table S4). Inflammatory cytokines TNF and IL1B that are known mediators of hepatocyte apoptosis and liver injury were moderately, albeit significantly induced by IFN-λ treatment alone (Figure 3E), though our data supports additional inflammatory effects of IFN-λ. By strengthening Mϕ recognition and response to pathogen associated molecular patterns, IFN-λs likely sensitize Mϕs to inflammatory stimuli, thus amplifying the strength and/or duration of the inflammatory cascade. This has been demonstrated by Liu et al. who showed that IFN-λ1 can promote IL-12 production in TLR7 stimulated Mϕs (28).
In response to IFN-λ, GM-Mϕs potently express Th1 chemokines including CXCL 9, 10, and 11 as well as IL-15 and IL-27, notable drivers of T and NK cell activation and proliferation. In agreement with RNA-Seq gene expression data, we demonstrated that IFN-λ3 treated GM-Mϕs stimulate T and NK cell chemotaxis and subsequent NK cell cytotoxicity. These data suggest that IFN-λs are strong mediators of the Th1 response and provides a rationale for works by Morrow et al. who showed that IFN-λ3 can increase IFN-γ secretion and degranulation despite T cell insensitivity to IFN-λ (58). A similar phenotype has been observed in tumor model NK cells, where IFN-λ signaling drives NK cell cytotoxicity, suppression of tumor growth and metastases (33, 59). This Th1 skewing effect has been further validated using murine models of Th2 diseases where IFN-λ alleviated symptoms of airway disease (60), intestinal inflammation (61), and conjunctivitis (62).
Interestingly, GM-Mϕs were significantly more responsive to IFN-λ, whereas M-Mϕs where more responsive to IFN-α. These data suggest that while type I and type III IFNs induce a similar gene signature, their respective response is dependent not only on the cell type, but also, the inflammatory phenotype of the responsive cell. This data is consistent with work by Fleetwood et al. that demonstrate a strong dependence on type I IFN signaling in M-CSF over GM-CSF cultured Mϕs (37). Consistent with an M2 phenotype (63), M-Mϕs were not particularly efficient at driving immune cell chemotaxis and activation upon IFN-λ3 stimulation, but were significantly more phagocytic than GM-Mϕs both at baseline and in response to IFN-λ3. These data suggest that IFN-λs are perhaps not inherently inflammatory, but instead promote macrophage effector functions based on location or developmental phenotype.
Our data fills a current gap in knowledge concerning the cellular identities and mechanisms that regulate local IFN-λ mediated inflammation. Because IFN-λ signaling is longer lasting and unlike IFN-α does not become refractory following chronic exposure (64), continuous IFN-λ expression from chronic infections can drive prolonged immune activation. While DCs have a strong IFN-λ response, they are a small population in the liver and migrate toward proximal lymph nodes in response to infection (65). Liver Mϕs (Kupffer cells) on the other hand consist of the ~3/4 of hepatic immune cells, and remain locally to become crucial drivers of localized tissue inflammation (65). Neutrophils are the only other immune cell subset with a defined IFN-λ response, and respond with reduced migration and suppression of inflammation (22, 23, 66).
In summary, we have demonstrated a novel concept whereby Mϕs gain IFN-λ sensitivity quickly following differentiation from monocytes. These data support a pro-inflammatory role for IFN-λs, particularly via recruitment of NK and T cells, chief promoters of inflammation in chronic liver disease. Mϕs bridge the gap between IFN-λ responsive and non-responsive effector cells, and are likely implicated in the elimination of acute infection and the promotion of tissue damage in chronic disease.
Methods
Patient Cohort
Blood samples were obtained from healthy volunteers at the Westmead Institute of Medical Research. Data points represent individual donors from a cohort of ~20 healthy individuals. Different cohorts of donors were used for individual experiments based on availability. Liver tissue was obtained at Westmead Hospital, Sydney, at the time of needle biopsy [chronic HBV/HCV infection, non-alcoholic fatty liver disease (NAFLD)/NASH, autoimmune hepatitis] or from patients undergoing liver resections (normal tissue). Ethics approval was obtained from the Sydney West Area Health Service and University of Sydney. Informed consent was obtained for all subjects [HREC2002/12/4.9(1564)].
Immune Cell Isolation, Culture, and IFN Treatment
Peripheral blood mononuclear cells (PBMCs) were isolated from volunteer blood using Ficoll Paque Plus (GE Healthcare). Immune cell isolations were performed using StemCell EasySep Kits, resulting in immune cell purity of >90%. CD14+ monocytes were cultured at 37°C and 5% CO2 in RPMI medium containing 10% fetal calf serum (FCS) and 50 ng/ml macrophage colony-stimulating factor (M-CSF, Peprotech) or granulocyte macrophage colony-stimulating factor (GM-CSF, Peprotech) for 7 days, replacing media and removing non-adherent cells at day 4. Mϕ populations were treated with IFN-α (50 U/ml) or IFN-λ3 (100 ng/ml) purchased from R&D Systems. All cytokines were confirmed LPS free.
RNA Sequencing and Bioinformatics
RNA was extracted using the Favorgen Tissue Total RNA Kit and the sequencing library was prepared using the TruSeq Stranded mRNA Library Prep Kit (Illumina). Single ended RNA sequencing (RNA-Seq) was performed at the Australian Genome Research Facility using the Illumina HiSeq 2500 platform (50 bp read length; minimum of 107 reads per sample). Sequence alignments and gene counts were performed using STAR RNA-Seq aligner version 2.5.1b (67) and paired comparisons were performed using EdgeR version 3.16.2(68). Heat map visualization of RNA-Seq data was performed using GITools (69). Functional analysis of IFN-λ3 mediated gene expression was conducted using Metacore version 6.29 (Thomson Reuters).
Quantitative PCR
cDNA synthesis was performed using MMLV reverse transcriptase (Promega) and 500 ng of RNA. Gene transcripts were quantified using the Corbett Research Rotorgene 3000 or 6000 thermocyclers with TaqMan primer probes (Applied Biosystems) or custom primers. Quantification of CD80, CXCL10, IFNLR1, and TRAIL were performed using primer probes (Applied Biosystems). Custom primers sets are as follows: CCL2 (CTGCTCATAGCAGCCACCTT, GCACTGAGATCTTCCTATTGGTG), CCL8 (TCCCAAGGAAGCTGTGATCTT, ATGGAATCCCTGACCCATCT), IFNAR1 (TCAGGTGTAGAAGAAAGGATTGAAA, AGACACCAATTTTCCATGACGTA), IFNL1 (AGGGACGCCTTGGAAGAGT, GAAGCCTCAGGTCCCAATTC), IFNL2/3 (GCCACATAGCCCAGTTCAAGTC, GGCATCTTTGGCCCTAAA) IL1B (TCGCCAGTGAAATGATGGCT, GGTCGGAGATTCGTAGCTGG), IL15 (GTGATGTTCACCCCAGTTGC, CATCTCCGGACTCAAGTGAAA), ISG15 (CGCAGATCACCCAGAAGATC, GCCCTTGTTATTCCTCACCA), TNFα (CCCGAGTGACAAGCCTGTAG, TGAGGTACAGGCCCTCTGAT), and viperin (CTTTTGCTGGGAAGCTCTTG, CAGCTGCTGCTTTCTCCTCT). All transcripts were normalized to 18s ribosomal RNA (Applied Biosystems, 4319413E). Standard curves derived from combined assay RNA were used to determine relative expression of genes.
Digital Droplet PCR (ddPCR)
Immune cell RNA was quantified using the Qubit fluorometer and RNA BR assay kit (Thermo Fisher), and cDNA was synthesized from ≥10 ng of RNA per sample using qScript cDNA supermix (Quantabio). cDNA was combined with ddPCR supermix and droplet generation oil for probes (Bio-Rad), and droplets were generated using the Bio-Rad QX200 Droplet Generator. PCR was performed using IFNLR1 and GAPDH probes according to the manufacturer's instructions, and droplet fluorescence was analyzed using the Bio-Rad QX200 Droplet Reader. Absolute quantification of transcript number was determined using QuantaSoft Analysis Pro software.
Western Blotting
Mϕs were lysed at 4°C using a denaturing buffer containing protease and phosphatase inhibitors. Protein was quantified and subject to sodium dodecyl sulfate poly-acrylamide gel electrophoresis. Gels were transferred to nitrocellulose membranes, blocked and probed with: IFNAR1 (Abcam, ab45172), IFNLR1 (Sigma Aldrich, HPA017319), STAT1 (Santa Cruz Biotechnology, SC-345), p-STAT1 (Cell Signaling, 9167), and β-actin (Sigma-Aldrich, A1978). Protein bands were visualized on X-ray film using horseradish peroxidase (HRP) conjugated secondary antibodies and the Supersignal West Pico chemiluminescence kit (Pierce Endogen).
Chemotaxis Assays and ELISAs
Immune cell chemotaxis assays were performed using 1 × 10⁶ autologous PBMCs placed in 5 μM pore size transwell inserts. Assays were performed for 24 h at 37°C and 5% CO2. Migrated cells present in the lower chamber were removed by pipetting and characterized by flow cytometry. Zombie Aqua viability stain (BioLegend 423101) and antibodies directed toward CD19 (BioLegend, 302218), CD3 (BioLegend, 300424), CD56 (Becton Dickinson, 335791), and CD14 (Becton Dickinson, 563372) were used to identify immune cell populations. All samples examined by flow cytometry have been treated with Fc block (BD, 564219) prior to staining. ELISAs for CCL2 (R&D Systems, DY279), CCL3 (R&D Systems, DY270), CCL4 (R&D Systems, DY271), CXCL10 (BioLegend, 439904), and TRAIL (Abcam, ab46074) were performed according to the manufacturers' protocols.
Phagocytosis Assays
To stimulate apoptosis, K562 cells were exposed to UV light for 15 min. Apoptotic K562 cells were stained with ZombieYellow viability stain (Biolegend), after which apoptosis was confirmed with >90% of cells staining positive. Culture media was removed from Mϕ cultures and target cells in RPMI + 10% FCS were added at a ratio of 2:1 (K562). Culture plates were centrifuged at 450 g for 2 min to synchronize phagocytosis. Following 1 h of incubation at 37°C, cells were washed and labeled with BV711 mouse anti-human CD14 antibody (BD Biosciences), and analyzed using the BD Biosciences LSR Fortessa cell analyzer.
Cytotoxicity Assay
Huh-7 cells were electroporated with JFH1 RNA, a genotype 2 strain of HCV as previously described (70). Upon confirming >85% infection rate by HCV NS5A immunofluorescence, Huh-7 cells were plated in 48 well plates. Day 6 Mϕs were spun down onto Huh-7 cells at 400× g for 5 min at a ratio of 2:1. Following 24 h incubation, macrophages were removed by pipetting, and Huh-7 cells detached using Accutase (Sigma-Aldrich). Huh-7 cells were labeled with Annexin V (Becton Dickinson, 550474), Epcam (Miltenyi Biotec, 130-091253) and propidium iodide (Sigma Aldrich, P4864) in 1× Annexin V binding buffer according to the manufacturers protocol. Cells were washed thoroughly, fixed with 2% paraformaldehyde and analyzed on the BD Biosciences LSR II cell analyzer.
NK Cell Degranulation and Interferon Gamma Production
Following 6 days of culture, freshly isolated autologous NK cells were added to Mϕs at a ratio of 1:1. Cells were centrifuged at 300 g for 3 min and incubated for 16 h at 37°C with 5% CO2. Following stimulation by Mϕs, NK cells were removed by pipetting, and incubated ± K562 cells (1:1 ratio) with an antibody against the degranulation marker CD107a (BD Biosciences 328620), GolgiStop and GolgiPlug transport inhibitor for 6 h at 37°C with 5% CO2. NK cell degranulation and interferon gamma (BioLegend, 502509) production was examined by flow cytometry, identifying live NK cell populations using Zombie Aqua viability stain (BioLegend 423101), APC-CY7 CD19 (BioLegend, 302218), Alexafluor 700 CD3 (BioLegend, 300424), PE-CY7 CD56 (Becton Dickinson, 335791), and BUV395 CD16 (Becton Dickinson, 563785).
Immunofluorescence
Frozen biopsy tissue sections were fixed with acetone, blocked and labeled with primary antibodies against CD11b (Bio-Rad MCA74A488), CD68 (Abcam, AB955), and IFNLR1 (all 1:100 dilution) overnight at 4°C. Secondary fluorescent antibodies (Alexafluor 488/594 anti-rabbit/mouse, Life Technologies, 1:1,000 dilution) and DAPI were applied for 1 h at room temperature, and imaged by confocal microscopy (Olympus FluoView FV1000). The IFNLR1 antibody was validated using siRNA knockdown of IFNLR1 on macrophage cultures, as well as gastrointestinal biopsy tissue to ensure specific labeling (Figure S13).
Immune Cell Sorting
Liver tissue was diced and incubated for 30 min at 37°C in a dissociation buffer consisting of RPMI medium containing 1 μg/ml DNAse, 0.1 mg/ml Collagenase type IV, and 100 U/ml penicillin/streptomycin. Cells were filtered through a 70 μm cell strainer and centrifuged at 50 g for 5 min to pellet hepatocytes (71). The supernatant containing liver immune cells was washed, pelleted at 400 g and frozen at −80°C until a sufficient number of samples were obtained. Fluorescence-activated cell sorting (FACS) was performed using the Becton Dickinson Influx Cell Sorter using the following panel: Zombie Aqua viability stain (BioLegend, 423102), APC CD45 (BioLegend, 304012), BUV395 CD3 (Becton Dickinson, 563546), PE-CY7 CD56 (Becton Dickinson, 335791), BV711 CD14 (Becton Dickinson, 563372), Alexafluor 488 CD68 (BioLegend, 333812), and PE IFNLR1 (BioLegend, 337804). A cell sort purity of >90% was measured during sorting.
Statistics
Statistics were performed using GraphPad Prism and were chosen based on the normality of the data, with p < 0.05 deemed significant. Student t-tests or Mann–Whitney tests were performed on unpaired samples based on data normality. Paired t-tests and Wilcoxon matched pairs signed rank test were performed on paired samples based on Gaussian distribution.
Data Availability Statement
RNA sequencing data has been uploaded into the Figshare data repository: https://doi.org/10.6084/m9.figshare.10324511.v1.
Ethics Statement
The studies involving human participants were reviewed and approved by Sydney West Area Health Service. The patients/participants provided their written informed consent to participate in this study.
Author Contributions
SR, ET, MR-M, SS, DB, and GA: designing research studies. SR, RW, ET, and MR-M: conducting experiments. SR, RW, CL, and GA: acquiring and analyzing the data. VL, LY, DB, MD, JG, and GA: providing tissues and reagents and interpreting results. SR, MD, JG, and GA: writing the manuscript.
Funding
This project was supported by the Robert W. Storr Bequest to the Sydney Medical Foundation, University of Sydney; a National Health and Medical Research Council of Australia (NHMRC) Program Grant No. 1053206. GA was supported by a Sylvia and Charles Viertel Charitable Foundation Investigatorship (VTL2015C022).
Conflict of Interest
The authors declare that the research was conducted in the absence of any commercial or financial relationships that could be construed as a potential conflict of interest.
Acknowledgments
RNA sequencing, flow cytometry and microscopy were performed in the Genomics, Flow Cytometry and Cell Imaging Core Facilities that are supported by the Westmead Research Hub, Cancer Institute New South Wales and National Health and Medical Research Council. In particular, we would like to thank Suat Dervish and Edwin Lau for their expertise and help performing cell sorting experiments and Joey Lai for his help preparing mRNA libraries for RNA sequencing.
Supplementary Material
The Supplementary Material for this article can be found online at: https://www.frontiersin.org/articles/10.3389/fimmu.2019.02674/full#supplementary-material
References
1. Lazear HM, Nice TJ, Diamond MS. Interferon-λ: immune functions at barrier surfaces and beyond. Immunity. (2015) 43:15–28. doi: 10.1016/j.immuni.2015.07.001
2. Lee PY, Li Y, Kumagai Y, Xu Y, Weinstein JS, Kellner ES, et al. Type I interferon modulates monocyte recruitment and maturation in chronic inflammation. Am J Pathol. (2009) 175:2023–33. doi: 10.2353/ajpath.2009.090328
3. Crow MK. Type I interferon in the pathogenesis of lupus. J Immunol. (2014) 192:5459–68. doi: 10.4049/jimmunol.1002795
4. Eslam M, Hashem AM, Leung R, Romero-Gomez M, Berg T, Dore GJ, et al. Interferon-λ rs12979860 genotype and liver fibrosis in viral and non-viral chronic liver disease. Nat Commun. (2015) 6:6422. doi: 10.1038/ncomms7422
5. Eslam M, Mcleod D, Kelaeng KS, Mangia A, Berg T, Thabet K, et al. IFN-λ3, not IFN-λ4, likely mediates IFNL3-IFNL4 haplotype-dependent hepatic inflammation and fibrosis. Nat Genet. (2017) 49:795–800. doi: 10.1038/ng.3836
6. O'connor KS, Read SA, Wang M, Schibeci S, Eslam M, Ong A, et al. IFNL3/4 genotype is associated with altered immune cell populations in peripheral blood in chronic hepatitis C infection. Genes Immun. (2016) 17: 328–34. doi: 10.1038/gene.2016.27
7. Banos-Lara Mdel R, Harvey L, Mendoza A, Simms D, Chouljenko VN, Wakamatsu N, et al. Impact and regulation of lambda interferon response in human metapneumovirus infection. J Virol. (2015) 89:730–42. doi: 10.1128/JVI.02897-14
8. Ilyushina NA, Lugovtsev VY, Samsonova AP, Sheikh FG, Bovin NV, Donnelly RP. Generation and characterization of interferon-lambda 1-resistant H1N1 influenza A viruses. PLoS ONE. (2017) 12:e0181999. doi: 10.1371/journal.pone.0181999
9. Qu L, Murakami K, Broughman JR, Lay MK, Guix S, Tenge VR, et al. Replication of human norovirus RNA in mammalian cells reveals lack of interferon response. J Virol. (2016) 90:8906–23. doi: 10.1128/JVI.01425-16
10. Hakim MS, Chen SR, Ding SH, Yin YB, Ikram A, Ma XX, et al. Basal interferon signaling and therapeutic use of interferons in controlling rotavirus infection in human intestinal cells and organoids. Sci Rep. (2018) 8:8341. doi: 10.1038/s41598-018-26784-9
11. Hong SH, Cho O, Kim K, Shin HJ, Kotenko SV, Park S. Effect of interferon-lambda on replication of hepatitis B virus in human hepatoma cells. Virus Res. (2007) 126:245–9. doi: 10.1016/j.virusres.2007.03.006
12. Park H, Serti E, Eke O, Muchmore B, Prokunina-Olsson L, Capone S, et al. IL-29 is the dominant type III interferon produced by hepatocytes during acute hepatitis C virus infection. Hepatology. (2012) 56:2060–70. doi: 10.1002/hep.25897
13. Mordstein M, Neugebauer E, Ditt V, Jessen B, Rieger T, Falcone V, et al. Lambda interferon renders epithelial cells of the respiratory and gastrointestinal tracts resistant to viral infections. J Virol. (2010) 84:5670–7. doi: 10.1128/JVI.00272-10
14. Mahlakoiv T, Ritz D, Mordstein M, Dediego ML, Enjuanes L, Muller MA, et al. Combined action of type I and type III interferon restricts initial replication of severe acute respiratory syndrome coronavirus in the lung but fails to inhibit systemic virus spread. J Gen Virol. (2012) 93:2601–5. doi: 10.1099/vir.0.046284-0
15. Pott J, Mahlakoiv T, Mordstein M, Duerr CU, Michiels T, Stockinger S, et al. IFN-λ determines the intestinal epithelial antiviral host defense. Proc Natl Acad Sci USA. (2011) 108:7944–9. doi: 10.1073/pnas.1100552108
16. Baldridge MT, Nice TJ, Mccune BT, Yokoyama CC, Kambal A, Wheadon M, et al. Commensal microbes and interferon-λ determine persistence of enteric murine norovirus infection. Science. (2015) 347:266–9. doi: 10.1126/science.1258025
17. Mahlakoiv T, Hernandez P, Gronke K, Diefenbach A, Staeheli P. Leukocyte-derived IFN-α/β and epithelial IFN-λ constitute a compartmentalized mucosal defense system that restricts enteric virus infections. PLoS Pathog. (2015) 11:e1004782. doi: 10.1371/journal.ppat.1004782
18. Hermant P, Demarez C, Mahlakoiv T, Staeheli P, Meuleman P, Michiels T. Human but not mouse hepatocytes respond to interferon-λ in vivo. PLoS ONE. (2014) 9:e87906. doi: 10.1371/journal.pone.0087906
19. Mennechet FJ, Uze G. Interferon-λ-treated dendritic cells specifically induce proliferation of FOXP3-expressing suppressor T cells. Blood. (2006) 107:4417–23. doi: 10.1182/blood-2005-10-4129
20. Jordan WJ, Eskdale J, Srinivas S, Pekarek V, Kelner D, Rodia M, et al. Human interferon lambda-1 (IFN-λ1/IL-29) modulates the Th1/Th2 response. Genes Immun. (2007) 8:254–61. doi: 10.1038/sj.gene.6364382
21. Yin Z, Dai J, Deng J, Sheikh F, Natalia M, Shih T, et al. Type III IFNs are produced by and stimulate human plasmacytoid dendritic cells. J Immunol. (2012) 189:2735–45. doi: 10.4049/jimmunol.1102038
22. Blazek K, Eames HL, Weiss M, Byrne AJ, Perocheau D, Pease JE, et al. IFN-λ resolves inflammation via suppression of neutrophil infiltration and IL-1β production. J Exp Med. (2015) 212:845–53. doi: 10.1084/jem.20140995
23. Broggi A, Tan Y, Granucci F, Zanoni I. IFN-λ suppresses intestinal inflammation by non-translational regulation of neutrophil function. Nat Immunol. (2017) 18:1084–93. doi: 10.1038/ni.3821
24. Witte K, Gruetz G, Volk HD, Looman AC, Asadullah K, Sterry W, et al. Despite IFN-lambda receptor expression, blood immune cells, but not keratinocytes or melanocytes, have an impaired response to type III interferons: implications for therapeutic applications of these cytokines. Genes Immun. (2009) 10:702–14. doi: 10.1038/gene.2009.72
25. Morrison MH, Keane C, Quinn LM, Kelly A, O'farrelly C, Bergin C, et al. IFNL cytokines do not modulate human or murine NK cell functions. Hum Immunol. (2014) 75:996–1000. doi: 10.1016/j.humimm.2014.06.016
26. Lasfar A, Lewis-Antes A, Smirnov SV, Anantha S, Abushahba W, Tian B, et al. Characterization of the mouse IFN-lambda ligand-receptor system: IFN-lambdas exhibit antitumor activity against B16 melanoma. Cancer Res. (2006) 66:4468–77. doi: 10.1158/0008-5472.CAN-05-3653
27. Jordan WJ, Eskdale J, Boniotto M, Rodia M, Kellner D, Gallagher G. Modulation of the human cytokine response by interferon lambda-1 (IFN-lambda1/IL-29). Genes Immun. (2007) 8:13–20. doi: 10.1038/sj.gene.6364348
28. Liu BS, Janssen HL, Boonstra A. IL-29 and IFNalpha differ in their ability to modulate IL-12 production by TLR-activated human macrophages and exhibit differential regulation of the IFNgamma receptor expression. Blood. (2011) 117:2385–95. doi: 10.1182/blood-2010-07-298976
29. Dickensheets H, Sheikh F, Park O, Gao B, Donnelly RP. Interferon-lambda (IFN-λ) induces signal transduction and gene expression in human hepatocytes, but not in lymphocytes or monocytes. J Leukoc Biol. (2013) 93:377–85. doi: 10.1189/jlb.0812395
30. De Groen RA, Groothuismink ZM, Liu BS, Boonstra A. IFN-λ is able to augment TLR-mediated activation and subsequent function of primary human B cells. J Leukoc Biol. (2015) 98:623–30. doi: 10.1189/jlb.3A0215-041RR
31. Srinivas S, Dai J, Eskdale J, Gallagher GE, Megjugorac NJ, Gallagher G. Interferon-λ1 (interleukin-29) preferentially down-regulates interleukin-13 over other T helper type 2 cytokine responses in vitro. Immunology. (2008) 125:492–502. doi: 10.1111/j.1365-2567.2008.02862.x
32. Egli A, Santer DM, O'shea D, Barakat K, Syedbasha M, Vollmer M, et al. IL-28B is a key regulator of B- and T-Cell vaccine responses against influenza. PLoS Pathog. (2014) 10:e1004556. doi: 10.1371/journal.ppat.1004556
33. Souza-Fonseca-Guimaraes F, Young A, Mittal D, Martinet L, Bruedigam C, Takeda K, et al. NK cells require IL-28R for optimal in vivo activity. Proc Natl Acad Sci USA. (2015) 112:E2376–84. doi: 10.1073/pnas.1424241112
34. Taylor SC, Laperriere G, Germain H. Droplet digital PCR versus qPCR for gene expression analysis with low abundant targets: from variable nonsense to publication quality data. Sci Rep. (2017) 7:2409. doi: 10.1038/s41598-017-02217-x
35. Edgar R, Domrachev M, Lash AE. Gene expression omnibus: NCBI gene expression and hybridization array data repository. Nucleic Acids Res. (2002) 30:207–10. doi: 10.1093/nar/30.1.207
36. Martinez FO, Gordon S. The M1 and M2 paradigm of macrophage activation: time for reassessment. F1000Prime Rep. (2014) 6:13. doi: 10.12703/P6-13
37. Fleetwood AJ, Lawrence T, Hamilton JA, Cook AD. Granulocyte-macrophage colony-stimulating factor (CSF) and macrophage CSF-dependent macrophage phenotypes display differences in cytokine profiles and transcription factor activities: implications for CSF blockade in inflammation. J Immunol. (2007) 178:5245–52. doi: 10.4049/jimmunol.178.8.5245
38. Lacey DC, Achuthan A, Fleetwood AJ, Dinh H, Roiniotis J, Scholz GM, et al. Defining GM-CSF- and macrophage-CSF-dependent macrophage responses by in vitro models. J Immunol. (2012) 188:5752–65. doi: 10.4049/jimmunol.1103426
39. Sallusto F. The role of chemokines and chemokine receptors in T cell priming and Th1/Th2-mediated responses. Haematologica. (1999) 84(Suppl EHA-4):28–31.
40. Uderhardt S, Herrmann M, Oskolkova OV, Aschermann S, Bicker W, Ipseiz N, et al. 12/15-Lipoxygenase orchestrates the clearance of apoptotic cells and maintains immunologic tolerance. Immunity. (2012) 36:834–46. doi: 10.1016/j.immuni.2012.03.010
41. Zizzo G, Hilliard BA, Monestier M, Cohen PL. Efficient clearance of early apoptotic cells by human macrophages requires M2c polarization and MerTK induction. J Immunol. (2012) 189:3508–20. doi: 10.4049/jimmunol.1200662
42. Kapellos TS, Taylor L, Lee H, Cowley SA, James WS, Iqbal AJ, et al. A novel real time imaging platform to quantify macrophage phagocytosis. Biochem Pharmacol. (2016) 116:107–19. doi: 10.1016/j.bcp.2016.07.011
43. Sampson LL, Heuser J, Brown EJ. Cytokine regulation of complement receptor-mediated ingestion by mouse peritoneal-macrophages - M-Csf and Il-4 activate phagocytosis by a common mechanism requiring autostimulation by Ifn-Beta. J Immunol. (1991) 146:1005–13.
44. Mevorach D, Mascarenhas JO, Gershov D, Elkon KB. Complement-dependent clearance of apoptotic cells by human macrophages. J Exp Med. (1998) 188:2313–20. doi: 10.1084/jem.188.12.2313
45. Deng L, Adachi T, Kitayama K, Bungyoku Y, Kitazawa S, Ishido S, et al. Hepatitis C virus infection induces apoptosis through a bax-triggered, mitochondrion-mediated, caspase 3-dependent pathway. J Virol. (2008) 82:10375–85. doi: 10.1128/JVI.00395-08
46. Bierne H, Travier L, Mahlakoiv T, Tailleux L, Subtil A, Lebreton A, et al. Activation of type III interferon genes by pathogenic bacteria in infected epithelial cells and mouse placenta. PLoS ONE. (2012) 7:e39080. doi: 10.1371/journal.pone.0039080
47. Espinosa V, Dutta O, Mcelrath C, Du PC, Chang YJ, Cicciarelli B, et al. Type III interferon is a critical regulator of innate antifungal immunity. Sci Immunol. (2017) 2:eaan5357. doi: 10.1126/sciimmunol.aan5357
48. Hillyer P, Mane VP, Schramm LM, Puig M, Verthelyi D, Chen A, et al. Expression profiles of human interferon-alpha and interferon-lambda subtypes are ligand- and cell-dependent. Immunol Cell Biol. (2012) 90:774–83. doi: 10.1038/icb.2011.109
49. Odendall C, Voak AA, Kagan JC. Type III IFNs are commonly induced by bacteria-sensing TLRs and reinforce epithelial barriers during infection. J Immunol. (2017) 199:3270–9. doi: 10.4049/jimmunol.1700250
50. Witte E, Kokolakis G, Witte K, Warszawska K, Friedrich M, Christou D, et al. Interleukin-29 induces epithelial production of CXCR3A ligands and T-cell infiltration. J Mol Med. (2016) 94:391–400. doi: 10.1007/s00109-015-1367-y
51. Wu Q, Yang Q, Lourenco E, Sun H, Zhang Y. Interferon-lambda1 induces peripheral blood mononuclear cell-derived chemokines secretion in patients with systemic lupus erythematosus: its correlation with disease activity. Arthritis Res Ther. (2011) 13:R88. doi: 10.1186/ar3363
52. Da Silva J, Hilzendeger C, Moermans C, Schleich F, Henket M, Kebadze T, et al. Raised interferon-β, type 3 interferon and interferon-stimulated genes - evidence of innate immune activation in neutrophilic asthma. Clin Exp Allergy. (2017) 47:313–23. doi: 10.1111/cea.12809
53. Lu YF, Goldstein DB, Urban TJ, Bradrick SS. Interferon-λ4 is a cell-autonomous type III interferon associated with pre-treatment hepatitis C virus burden. Virology. (2015) 476:334–40. doi: 10.1016/j.virol.2014.12.020
54. Hong MA, Schwerk J, Lim C, Kell A, Jarret A, Pangallo J, et al. Interferon lambda 4 expression is suppressed by the host during viral infection. J Exp Med. (2016) 213:2539–52. doi: 10.1084/jem.20160437
55. Dultz G, Gerber L, Zeuzem S, Sarrazin C, Waidmann O. The macrophage activation marker CD163 is associated with IL28B genotype and hepatic inflammation in chronic hepatitis C virus infected patients. J Viral Hepatitis. (2016) 23:267–73. doi: 10.1111/jvh.12488
56. Chen L, Borozan I, Sun J, Guindi M, Fischer S, Feld J, et al. Cell-type specific gene expression signature in liver underlies response to interferon therapy in chronic hepatitis C infection. Gastroenterology. (2010) 138:1123–33.e1-3. doi: 10.1053/j.gastro.2009.10.046
57. Mcgilvray I, Feld JJ, Chen L, Pattullo V, Guindi M, Fischer S, et al. Hepatic cell-type specific gene expression better predicts HCV treatment outcome than IL28B genotype. Gastroenterology. (2012) 142:1122–31.e1. doi: 10.1053/j.gastro.2012.01.028
58. Morrow MP, Pankhong P, Laddy DJ, Schoenly KA, Yan J, Cisper N, et al. Comparative ability of IL-12 and IL-28B to regulate Treg populations and enhance adaptive cellular immunity. Blood. (2009) 113:5868–77. doi: 10.1182/blood-2008-11-190520
59. Sato A, Ohtsuki M, Hata M, Kobayashi E, Murakami T. Antitumor activity of IFN-λ in murine tumor models. J Immunol. (2006) 176:7686–94. doi: 10.4049/jimmunol.176.12.7686
60. Koltsida O, Hausding M, Stavropoulos A, Koch S, Tzelepis G, Ubel C, et al. IL-28A (IFN-λ2) modulates lung DC function to promote Th1 immune skewing and suppress allergic airway disease. EMBO Mol Med. (2011) 3:348–61. doi: 10.1002/emmm.201100142
61. He SH, Chen X, Song CH, Liu ZQ, Zhou LF, Ma WJ, et al. Interferon-λ mediates oral tolerance and inhibits antigen-specific, T-helper 2 cell-mediated inflammation in mouse intestine. Gastroenterology. (2011) 141:249–58, 258 e241–2. doi: 10.1053/j.gastro.2011.04.006
62. Chen J, Zhang J, Zhao R, Jin J, Yu Y, Li W, et al. Topical application of interleukin-28A attenuates allergic conjunctivitis in an ovalbumin-induced mouse model. Invest Ophthalmol Vis Sci. (2016) 57:604–10. doi: 10.1167/iovs.15-18457
63. Roszer T. Understanding the mysterious M2 macrophage through activation markers and effector mechanisms. Mediat Inflamm. (2015) 2015:816460. doi: 10.1155/2015/816460
64. Makowska Z, Duong FH, Trincucci G, Tough DF, Heim MH. Interferon-β and interferon-λ signaling is not affected by interferon-induced refractoriness to interferon-α in vivo. Hepatology. (2011) 53:1154–63. doi: 10.1002/hep.24189
65. Yu YRA, O'koren EG, Hotten DF, Kan MJ, Kopin D, Nelson ER, et al. A protocol for the comprehensive flow cytometric analysis of immune cells in normal and inflamed murine non-lymphoid tissues. PLoS ONE. (2016) 11:e0150606. doi: 10.1371/journal.pone.0150606
66. Chrysanthopoulou A, Kambas K, Stakos D, Mitroulis I, Mitsios A, Vidali V, et al. Interferon lambda1/IL-29 and inorganic polyphosphate are novel regulators of neutrophil-driven thromboinflammation. J Pathol. (2017) 243:111–22. doi: 10.1002/path.4935
67. Dobin A, Davis CA, Schlesinger F, Drenkow J, Zaleski C, Jha S, et al. STAR: ultrafast universal RNA-seq aligner. Bioinformatics. (2013) 29:15–21. doi: 10.1093/bioinformatics/bts635
68. Robinson MD, Mccarthy DJ, Smyth GK. edgeR: a Bioconductor package for differential expression analysis of digital gene expression data. Bioinformatics. (2010) 26:139–40. doi: 10.1093/bioinformatics/btp616
69. Perez-Llamas C, Lopez-Bigas N. Gitools: analysis and visualisation of genomic data using interactive heat-maps. PLoS ONE. (2011) 6:e19541. doi: 10.1371/journal.pone.0019541
70. Read SA, Tay E, Shahidi M, George J, Douglas MW. Hepatitis C virus infection mediates cholesteryl ester synthesis to facilitate infectious particle production. J General Virol. (2014) 95:1900–10. doi: 10.1099/vir.0.065300-0
Keywords: macrophage, interferon lambda, innate immunity, liver, Kupffer
Citation: Read SA, Wijaya R, Ramezani-Moghadam M, Tay E, Schibeci S, Liddle C, Lam VWT, Yuen L, Douglas MW, Booth D, George J and Ahlenstiel G (2019) Macrophage Coordination of the Interferon Lambda Immune Response. Front. Immunol. 10:2674. doi: 10.3389/fimmu.2019.02674
Received: 02 June 2019; Accepted: 30 October 2019;
Published: 19 November 2019.
Edited by:
Francesca Granucci, University of Milano Bicocca, ItalyReviewed by:
Achille Broggi, Boston Children's Hospital and Harvard Medical School, United StatesAmariliz Rivera, New Jersey Medical School, United States
Megan Tierney Baldridge, Washington University School of Medicine in St. Louis, United States
Copyright © 2019 Read, Wijaya, Ramezani-Moghadam, Tay, Schibeci, Liddle, Lam, Yuen, Douglas, Booth, George and Ahlenstiel. This is an open-access article distributed under the terms of the Creative Commons Attribution License (CC BY). The use, distribution or reproduction in other forums is permitted, provided the original author(s) and the copyright owner(s) are credited and that the original publication in this journal is cited, in accordance with accepted academic practice. No use, distribution or reproduction is permitted which does not comply with these terms.
*Correspondence: Golo Ahlenstiel, Zy5haGxlbnN0aWVsQHdlc3Rlcm5zeWRuZXkuZWR1LmF1; Scott A. Read, Uy5yZWFkQHdlc3Rlcm5zeWRuZXkuZWR1LmF1