 Fany Blanc1,2,3*†
 Armelle Prévost-Blondel1,4,5*†
 Guillaume Piton2,3Edwige Bouguyon6Jean-Jacques Leplat2,3Fabrice Andréoletti2,3
 Giorgia Egidy2
 Emmanuelle Bourneuf2,3,7
 Nicolas Bertho6,8Silvia Vincent-Naulleau2,3
- 1INSERM, U1016, Institut Cochin, Paris, France
- 2Université Paris-Saclay, INRAE, AgroParisTech, GABI, Jouy-en-Josas, France
- 3CEA, DSV/iRCM/SREIT/LREG, Jouy-en-Josas, France
- 4CNRS, UMR8104, Paris, France
- 5Université de Paris, Paris, France
- 6Université Paris-Saclay, INRAE, VIM, Jouy-en-Josas, France
- 7CEA, DSV/iRCM/SREIT/LCE, Fontenay-aux-Roses, France
- 8BIOEPAR, INRAE, ONIRIS, Nantes, France
Immunological research in pigs benefits from many improvements with a direct impact on the veterinary control of pig husbandry and on biomedical models. We compiled the available knowledge to develop gating strategies to monitor simultaneously all blood immune cell types by multicolor flow cytometry in Melanoblastoma-bearing Libechov Minipigs (MeLiM). The MeLiM pig spontaneously develops cutaneous melanomas that regress few months later. We monitored lymphoid and myeloid cell subsets in 3 to 21 weeks old pigs. Interestingly, neutrophils, type III monocytes (CD163+ CD14+ MHC II−) and CD4− CD8α− T cells are less abundant in oldest animals in contrast to eosinophils, type II monocytes (CD163− CD14low MHC II+), B cells, γδ T cells, CD4+ CD8α+ and CD4− CD8α+ T cells. Melanoma occurrence led to changes in the blood cell composition. Higher proportions of NK cells, CD4+ and CD4+ CD8α+ T cells, and CD21− B cells among B cells are found in young melanoma-bearing piglets, consistent with the immune-mediated spontaneous regression in the MeLiM model.
Introduction
Immunological research in the porcine species is of great importance for its direct impact on the veterinary control of pig husbandry as well as for the development of biomedical models (1, 2). Melanoblastoma-bearing Libechov Minipigs (MeLiM) spontaneously develop cutaneous melanomas around birth, with clinical and histopathological features comparable to human counterparts (3, 4). Animals can carry multiple lesions from benign to highly invasive, eventually leading to lymph nodes and visceral metastasis. A spontaneous regression occurs between 2 and 4 months after birth, corresponding to a complete disappearance of tumors and metastasis, without any treatment. This regression process, often accompanied by a local or systemic depigmentation of hair, skin and eyes has been described in details, both clinically and histologically (4, 5). It is at least partially controlled by an efficient immune response toward melanoma cells (6).
Studies of porcine immune cells have been initially enabled by the development and characterization of monoclonal antibodies against porcine cluster of differentiation (CD) molecules as well as the identification of cross-reactive antibodies provided by three International Swine CD Workshops (7–9). Since then, efforts have been made to provide new tools to study immune cells (10–13). In addition, the use of omics analyses can help identifying molecular patterns shared between cell types across tissues and species, thus refining surface phenotyping as it was published for phagocyte mononuclear cells (14–16).
Most publications regarding tools specific to immunomonitoring in pigs focus on certain cell subtypes and do not consider studying all blood cell subsets simultaneously. Lymphoid cells are the most studied and current gating strategies allow proper identification of B cells, NK, NKT, γδ T cells, CD4, and CD8 T cells (11, 17, 18). Concerning the myeloid lineage, characterization of circulating conventional dendritic cells (DCs) by flow cytometry allowed a proper identification of swine cDC1 and cDC2 subsets (15, 19, 20). Blood monocytes identified in peripheral blood mononuclear cells (PBMCs) are heterogeneous. Most research focuses on the CD163 marker as it was found to be the entry point of the porcine reproductive and respiratory syndrome virus into macrophages. CD163 distinguishes two major populations of monocytes (21) that could be further divided into four subsets according to CD14 and MHC II expressions (22–24). Finally, granulocytes have not been much studied in swine blood. Indeed, the use of PBMCs in many studies may bias results due to the loss of particular populations (i.e., granulocytes) during cell preparation. The antibody clone PG68A has been described as a pan granulocyte marker, but its target is still unknown (9).
The aim of this study was to monitor all cell types simultaneously in swine peripheral blood leukocytes (PBLs). We thus compiled the available knowledge to develop gating strategies for multicolor flow cytometry. Four panels with lineage, exclusion and activation markers were used to identify lymphoid (αβ and γδ T cells, B cells, NK, and NKT cells) and myeloid cells (DCs, monocytes, granulocytes). The subsets of T lymphocytes were also distinguished according to their helper, cytotoxic or regulatory functions. We monitored MeLiM pigs from 3 to 21 weeks of age to gain knowledge on the maturation of pig's immune system before weaning until puberty and to evaluate the impact of melanoma occurrence in this biomedical model.
Materials and Methods
Experimental Pigs
Animal care and use was carried out under licenses issued by the Direction Départementale de la Protection des Populations des Yvelines (DDPPY, agreement number C78–719) and experiments were ethically approved by the Committee on the Ethics of Animal Experiments of AgroParisTech and INRA Jouy-en-Josas (COMETHEA, authorization number 12/091). Blood samples (5 mL) were collected on EDTA-containing Vacutainers from MeLiM pigs after puncture of the jugular vein. Fourteen males and 22 females were sampled 3–6 times (mean = 4.7) from 3 to 21 weeks of age. Samples were then allocated to eight groups of age (3–4, 5–6, 7–8, 9–10, 11–12, 13–15, 16–18, and 19–21 weeks). Pigs were individually examined for the presence of cutaneous melanoma every 1–2 weeks until 3 months of age and then every 2–3 weeks until 5 months. Among these 36 pigs, 29 animals bore a melanoma. The tumor burden was considered as low or high depending on the number of cutaneous melanoma that developed on each animal (low: 1–4; high: 5–14). The presence of palpable lymphadenopathies (lymph node adenomegalies) was also examined. Seven animals, melanoma free at the sampling time, were classified as healthy. The number of pigs sampled for each group of age with their sex, melanoma occurrence, tumor burden, and presence of palpable lymphadenopathies is reported in Table 1. Studied animals have never been vaccinated. The herd was serologically tested free of brucellosis, classical swine fever, porcine reproductive and respiratory syndrome virus and Aujeszky's disease. In addition, no diarrhea nor pneumonia were observed during the study. Weaning is progressive in the herd as piglets can start eating dry food before being separated from the sow (separation occurring between 5 and 8 weeks). Some blood samples were also collected on dry-Vacutainers and after centrifugation (350 g, 15 min, 20°C), sera were stored at −80°C.
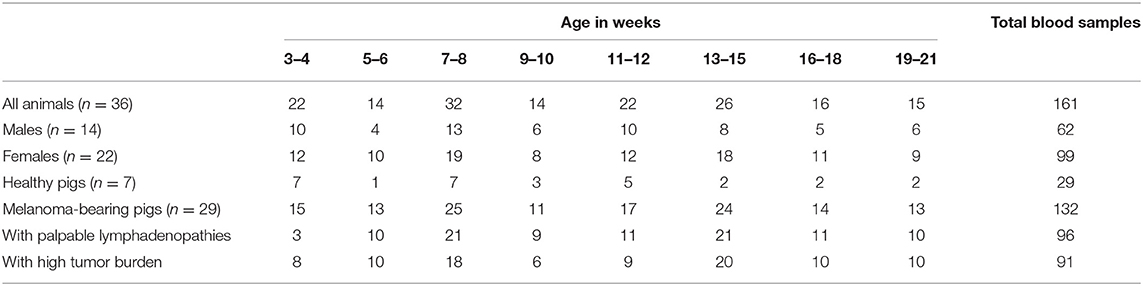
Table 1. Number of pigs sampled for each group of age, with their sex, melanoma occurrence, presence of palpable lymphadenopathies, and tumor burden.
Preparation of Peripheral Blood Leukocytes
Absolute number and viability of cells were determined with the ViaCount Assay performed on easyCyte 6HT-2L Guava flow cytometer (Millipore) following manufacturer's instructions. Red blood cells were lysed by transferring blood into a Tris-NH4Cl 140mM, pH 7.5 solution and incubated at room temperature for 20 min. Cells were then centrifuged (300 g, 5 min, 20°C) and a second red blood cell lysis was performed if necessary. Cells were thereafter washed twice in phosphate buffered saline (PBS) containing 5% fetal bovine serum (FBS) and cell number and viability were again determined in PBLs with the ViaCount Assay. One to five millions of PBLs were processed in each staining combination.
Flow Cytometry
PBLs were first stained for viability with the aqua LIVE/DEAD® Fixable Dead Cell Stain Kit (Thermo Fisher Scientific) following manufacturer's instructions and further incubated for 20 min at 4°C in a blocking buffer (PBS containing 5% FBS, 5% horse serum, and 5% porcine serum). Cells were then centrifuged (300 g, 5 min, 4°C) and surface staining was performed in three steps. The four combinations of antibodies used are listed in Table 2 (combinations A-D). PBLs were first incubated for 20 min with a combination of primary antibodies of different mouse isotypes. After a wash in PBS containing 5% FBS, the appropriate combination of secondary antibodies specific for mouse immunoglobulin (Ig) subclasses labeled with fluorochromes was incubated for 20 min to the cell pellets. Cells were washed in PBS containing 5% FBS and finally incubated for 20 min with directly labeled primary antibodies. Detection of CD79a or Foxp3 was done by intracellular staining using Foxp3/Transcription Factor Staining Buffer Set (eBioscience) with a slight modification of the protocol recommended by the manufacturer. Briefly, samples were incubated for 2 h in fixation/permeabilization buffer, washed and incubated for 2 h with labeled antibodies diluted in permeabilization buffer. Foxp3 and CD79a intracellular staining specificity was determined by incubating cells with PE-labeled isotype controls (rat IgG2a or mouse IgG1, respectively). All antibodies used in this study were titrated for optimal signal/noise ratios as indicated in Table 2. Cells were then fixed in BD CellFIX solution before analysis on a BD LSR Fortessa cytometer (BD Biosciences). The data analysis was performed using FlowJo V10 software. Electronic compensation was used to eliminate residual spectral overlaps between individual fluorochromes.
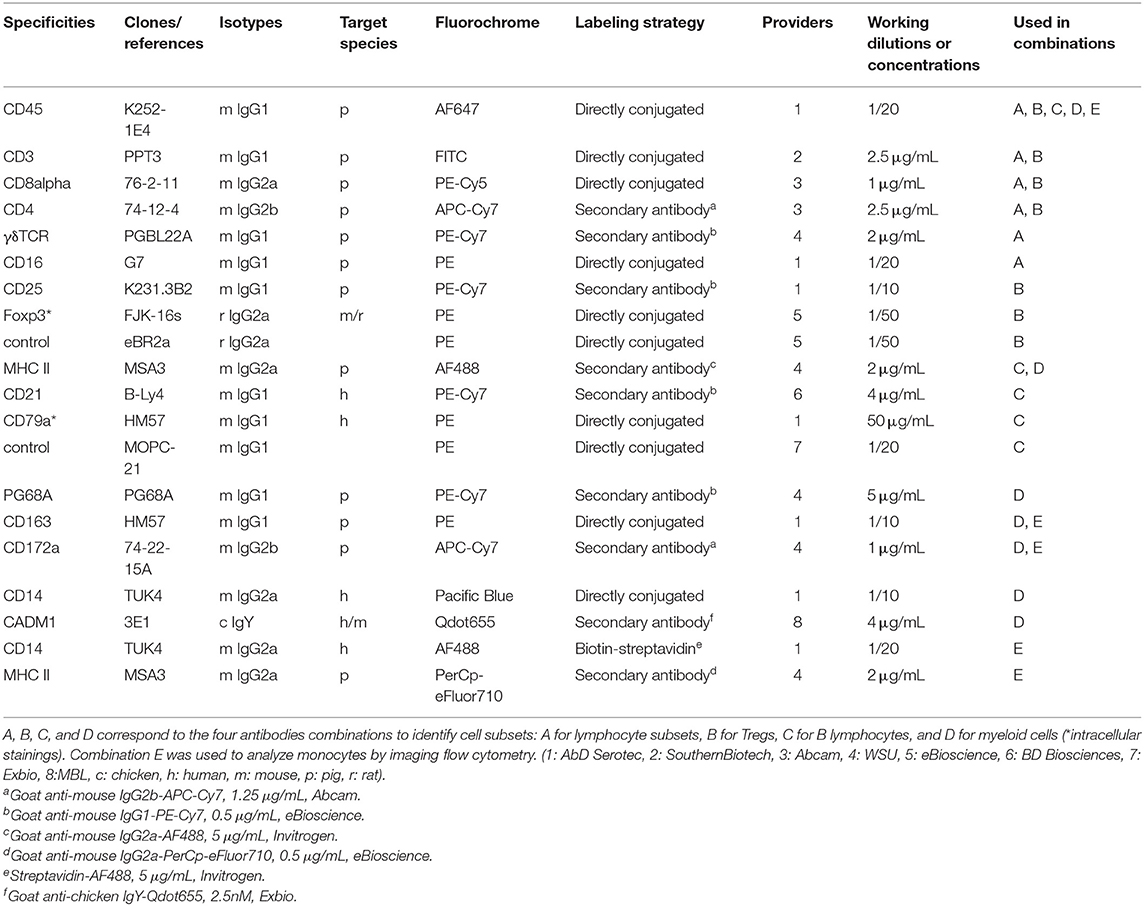
Table 2. Antibodies used in this study.
Cell Sorting and May–Grünwald–Giemsa Staining
Myeloid cells were stained as described for flow cytometry analysis (Table 2, combination D), but were not fixed. They were sorted using a FACS Aria III cell sorter (BD Biosciences; 100 μm nozzle). Sorted cells were dropped off on microscope slides (Superfrost, Thermo) by centrifugation and incubated with May–Grünwald–Giemsa (MGG) stains. Images were acquired with a digital slide scanner (Pannoramic SCAN, 3DHISTECH), objective magnification X40 and visualized with the Pannoramic Viewer software.
Imaging Flow Cytometry
Cells were stained as described for flow cytometry analysis (Table 2, combination E) without viability staining. Cells were finally fixed in 50 μL of BD CellFIX solution (BD Biosciences) and nuclei were stained by adding DAPI (1 μg/mL) and Triton X-100 (0.1%). Images were acquired on an Amnis ImageStreamX imaging flow cytometer (Merck Millipore) with the 60X objective. Data were analyzed using IDEAS 6.2 software following a method adapted from Pelletier et al. (25). Monocyte subpopulations were gated among in-focus single cell events, using the same gating strategy as for flow cytometry analysis. Average measurements from multiple masks selected after visual inspection were used to accurately represent the cell surface (bright field area in Ch01, 3 masks) and nuclei (DNA dye intensity in Ch07, 4 masks). These average cellular and nuclear areas were used to create a combined feature to calculate the “per cell” average cytoplasmic area (area of the cell reduced by the area of the nucleus) and N/C ratio (average nuclear area divided by the average cytoplasmic area).
IgG ELISA
Total IgGs sera concentrations were measured with the Pig IgG ELISA Quantification Kit (Bethyl Laboratories). Samples were tested at 1–100,000 or 250,000 dilutions. Assays were performed in duplicate and according to manufacturer's instructions.
Statistical Analysis
Absolute cell counts were used to calculate absolute numbers of various subpopulations. Statistical analyses were performed taking into account the age group, sex and melanoma occurrence of pigs. For statistical inference, logarithm or square root transformations were applied to the data expressed in absolute count or percentages, respectively. A linear regression model was then applied using the lm() function of R (version 3.6.0) (26) on transformed data with sex, age group and melanoma occurrence as fixed effects. Likelihood ratio tests were performed to evaluate the effects of sex, age group or melanoma occurrence for each cell subset and data are reported in Table 3 and Supplementary Tables 1–3. When an effect was significant, analysis of variance followed by Tukey's post-test was performed to compare the groups. Results in the text are expressed as mean +/– SD of the raw data and figures represent the plot of the raw data. Other statistical tests used are mentioned in the appropriate figure legend.
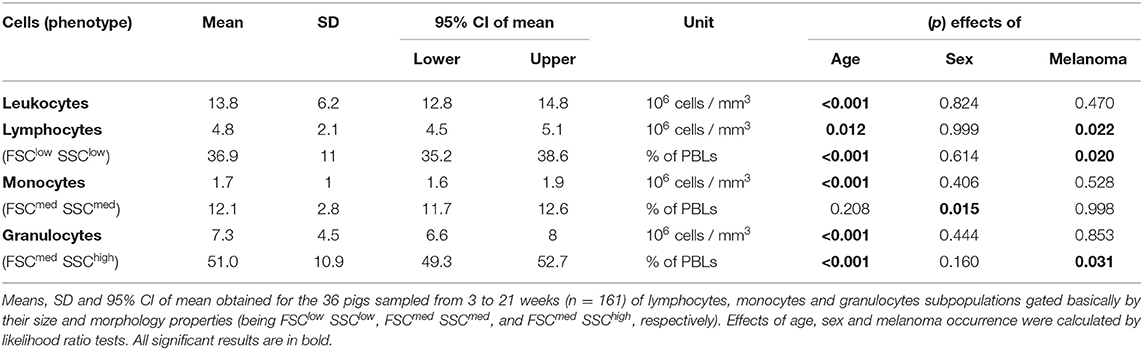
Table 3. Absolute numbers and proportions of lymphocytes, monocytes and granulocytes in pig blood, and effect of age, sex, and melanoma occurrence on those phenotypes.
Results
Longitudinal Analysis of Global Immune Cells in Swine Blood: Decrease in Granulocyte and Increase in Lymphocyte Proportions With Age
The different cell subpopulations in peripheral blood from 3 to 21 week-old pigs were analyzed by flow cytometry using four combinations of antibodies applied to each sample (A-D listed in Table 2) and a gating strategy illustrated in Figure 1A. All proportions and absolute numbers of cell subsets are reported in Table 3. Total leukocyte count was 13.8 +/– 6.2 millions per mm3 with a high dispersion at each time point between animals (Figure 1B). On average, lymphocytes, monocytes and granulocytes represented 36.9% +/– 11.0, 12.1% +/– 2.8 and 51.0% +/– 10.9 of PBLs, respectively (Figure 1C). Of note, the proportion of granulocytes decreased in oldest pigs (effect of age p < 0.001 and p < 0.01 comparing 3–4 weeks to 16–18 and 19–21 week-old groups, respectively). Differences were also observed in absolute count. On the other hand, the proportion of lymphocytes increased at the same time points (effect of age p < 0.001). The proportion of monocytes varied among pigs (with 3 to 4-fold differences between minimum and maximum), but no effect of age was observed over the 16 weeks period.
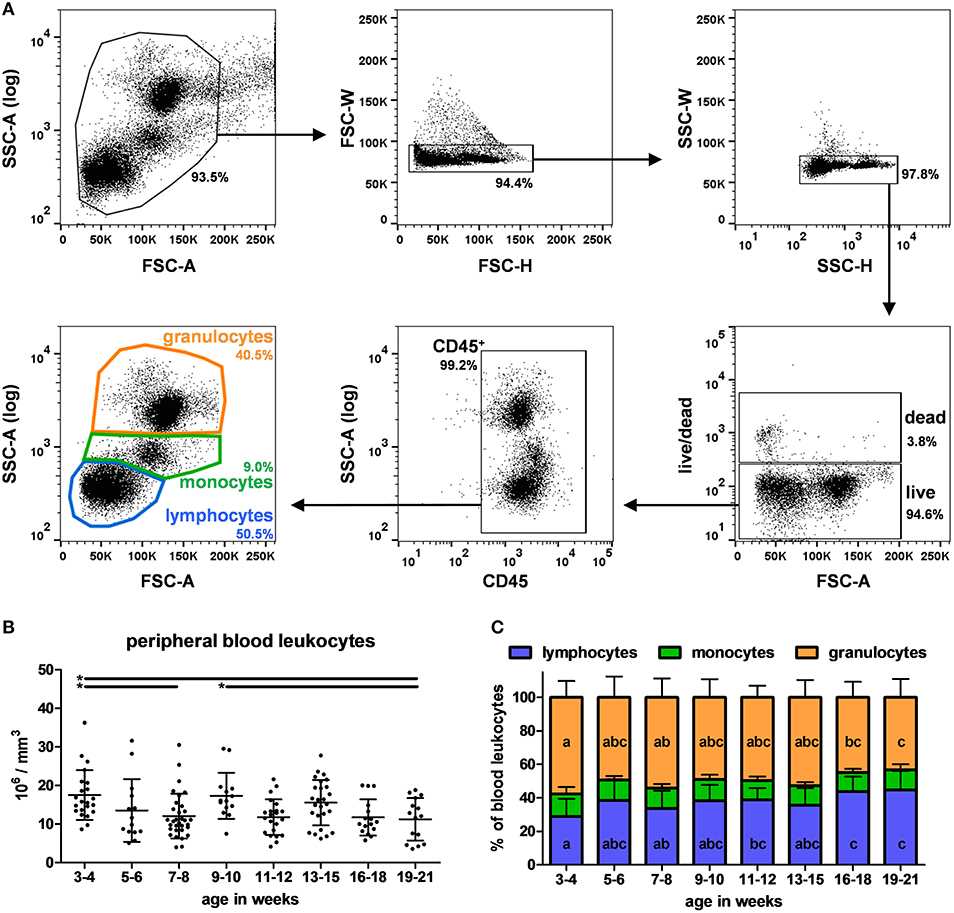
Figure 1. Identification and quantification of lymphocytes, monocytes and granulocytes in swine peripheral blood. (A) Illustrative dot plots showing the gating strategy used to identify PBLs subsets. Cells were first gated on FSC-A vs. SSC-A dot plot (upper left panel) and doublets were excluded on FSC-H vs. FSC-W dot plot (“singlets-1,” upper middle panel) and SSC-H vs. SSC-W dot plot (“singlets-2,” upper right panel). Dead cells were then excluded using live/dead staining (lower right panel). Immune cells were stained for CD45 (lower middle panel). Lymphocytes, monocytes, and granulocytes subpopulations from CD45+ cells were finally gated using size and morphology properties (lower left panel). Percentages of the parent populations are shown on each dot plot representing 10,000 events. (B) Absolute leukocyte count in blood according to pigs' age. Lines represent the means with SEM. Significant differences within groups of age are represented with bars (*p < 0.05). (C) Lymphocytes, monocytes and granulocytes distribution according to pigs' age. Different letters inside the bar plots indicate significant differences within groups of age for the corresponding cell population (p < 0.05).
Longitudinal Analysis of Swine Blood NK, NKT, γδ T Cells, CD4 and CD8 T Cells, and Tregs: High Proportion of γδ T Cells and Increase in CD4+ CD8α+ T Cells With Age
The phenotypes and absolute numbers of NK, NKT, γδ T cells, CD4, and CD8 T cells, and Tregs were investigated in the blood of pigs using the antibody panels A and B, listed in Table 2. The gating strategy is presented in Supplementary Figure 1A. Supplementary Table 1 reports the different proportions and numbers found for those subsets and their evolution between 3–4 and 19–21 weeks of age are presented in Figure 2 (subsets varying over time) and Supplementary Figure 1B (stable subsets over time).
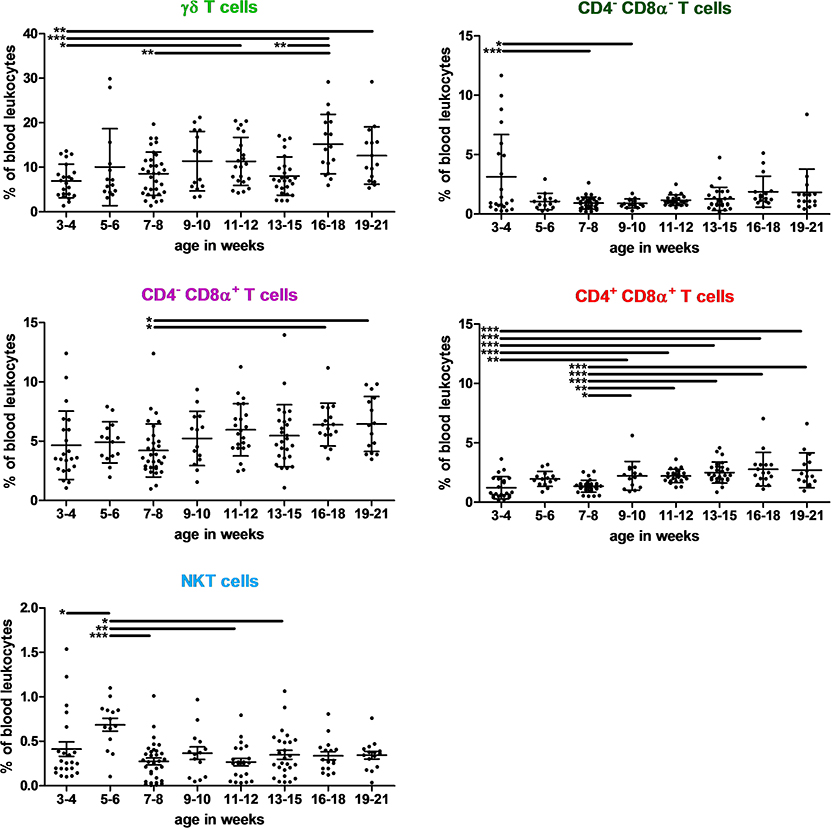
Figure 2. Kinetics of percentages of γδ T, CD4− CD8α−, CD4− CD8α+ T, CD4+ CD8α+ T, and NKT lymphocytes in swine peripheral blood. Lines represent the means with SEM. Significant differences are represented with bars (*p < 0.05, **p < 0.01, and ***p < 0.001).
No significant differences among PBLs were observed with age for NK (3.2% +/– 2.3), CD4+ T helper cells (6.6% +/– 3.3) and Tregs (1.0% +/– 0.3). Most of these latter were CD4+ (63.7%), whereas CD4+ CD8α+ (double positive cells, or DP) and CD8α+ represented 16.8 and 12.5% of Tregs, respectively. Only DP Tregs slightly increased in oldest pigs (data not shown).
Conversely, differences with age were observed for the following subsets: NKT cells represented only 0.4% of PBLs, whereas γδ T cells represented 9.9% of them and were the most abundant T cells. DP T cells (p < 0.001) represented only 1.2% of PBLs at 3–4 weeks of age, remained at that level until 7–8 weeks and then reached 2.7% of PBLs in 16 to 21 week-old pigs. Cytotoxic T cells represented 5.2% +/– 2.4 of PBLs. A slight increase in cytotoxic T cell levels was observed with age (p = 0.002) with lower levels for 7–8 week-old pigs. Finally, CD4− CD8α− (double negative cells, or DN) T cells represented <2% of PBLs in most cases. Nevertheless, they could represent 11.7% of PBLs and 38.7% of T cells in 3–4 weeks old piglets, with a very high heterogeneity.
Progressive Increase of B Cells and Serum IgG Levels With Age While CD21 Decreased
To identify B cells, CD79a remained the best marker (27), as the anti-human CD19 antibody (clone B-D3) reported to cross-react with porcine B cells (28) did not label any cells in our experiments (data not shown). Therefore, B cells were identified using the antibody panel C (listed in Table 2) and the gating strategy illustrated in Figure 3A. To illustrate the specificity of the intracellular CD79a staining, the FMO control is depicted. Different B cell subsets were also analyzed according to their CD21 and MHC II expressions. On average, CD79a+ B cells represented 6.9% +/– 3.6 of PBLs (Supplementary Table 2). Interestingly, they were significantly less abundant in 3–4 week-old piglets (3.4% of PBLs) than in oldest ones (6.3 and 9.9% of PBLs, p < 0.001) (Figure 3B). We observed that the CD21 expression on B cells decreased with age (p < 0.001) (Figure 3C). The serum IgG levels were also analyzed to evaluate the humoral response (Figure 3D). They remained low until 7–8 weeks and increased thereafter (effect of age, p = 0.012) with a significant difference between 7–8 and 13–15 week-old pigs (p = 0.01). Serum IgG levels significantly correlated with B cells (expressed in absolute number and in percentage of PBLs, n = 78, Pearson's correlations: p = 0.016 and 0.019, with r = 0.272 and 0.265, respectively), and with the CD21− MHC II+ B cell subset (expressed in absolute number and in percentages of PBLs or B cells, n = 78, Pearson's correlations: p < 0.001, p = 0.002 and p = 0.018 with r = 0.371, 0.350, and 0.268, respectively).
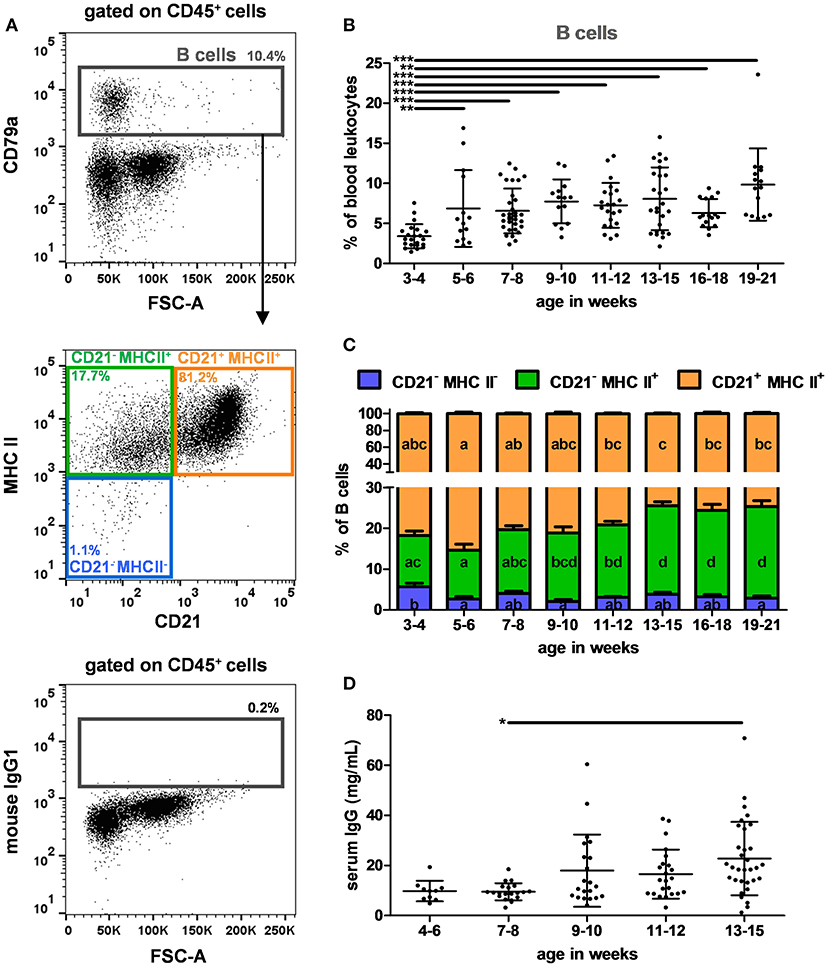
Figure 3. B cells in swine peripheral blood. (A) Gating strategy to identify B cells in PBLs. B cells were identified as CD79a+ among the CD45+ population described in Figure 1A (upper panel). A representative dot plot with CD79a isotype control (mouse IgG1) is shown (lower panel). CD21 and MHC II expression of B cells were studied (middle panel). Percentages of the parent populations are shown on each dot plot representing 10,000 events. Kinetics of the percentages of (B) B cells in PBLs and (C) CD21 and MHC II expressions among B cells. (D) Kinetics of total IgGs in sera assessed by ELISA. Lines represent the means with SEM. Significant differences within groups of age are represented with bars (*p < 0.05, **p < 0.01, and ***p < 0.001) or with different letters inside the bar plots of the corresponding population (p < 0.05).
Longitudinal Analysis of Swine Blood DCs and Monocytes: Rapid Decrease of CD163+ CD14+ MHC II− Monocytes and Increase of CD163− Monocytes With Age
Recent studies have reported combinations of antibodies to identify circulating DCs in pig (15, 19, 20), cDC1 being CD14− CD172alow CADM1+ and cDC2 CD14−/low CD172ahigh CADM1low. Monocytes were described in pigs based on their expression of CD163, CD14, and MHC II (24). Accordingly, a specific combination (Table 2, panel D) was set up to analyze myeloid cells with the gating strategy illustrated in Figure 4A. cDC1 and cDC2 represented 0.03 and 0.04% of PBLs, respectively (Supplementary Table 3). Their proportions did not vary significantly with age except that cDC1 and cDC2 were more abundant at 9–10 and 5–6 weeks (p < 0.01), respectively (Figure 4B).
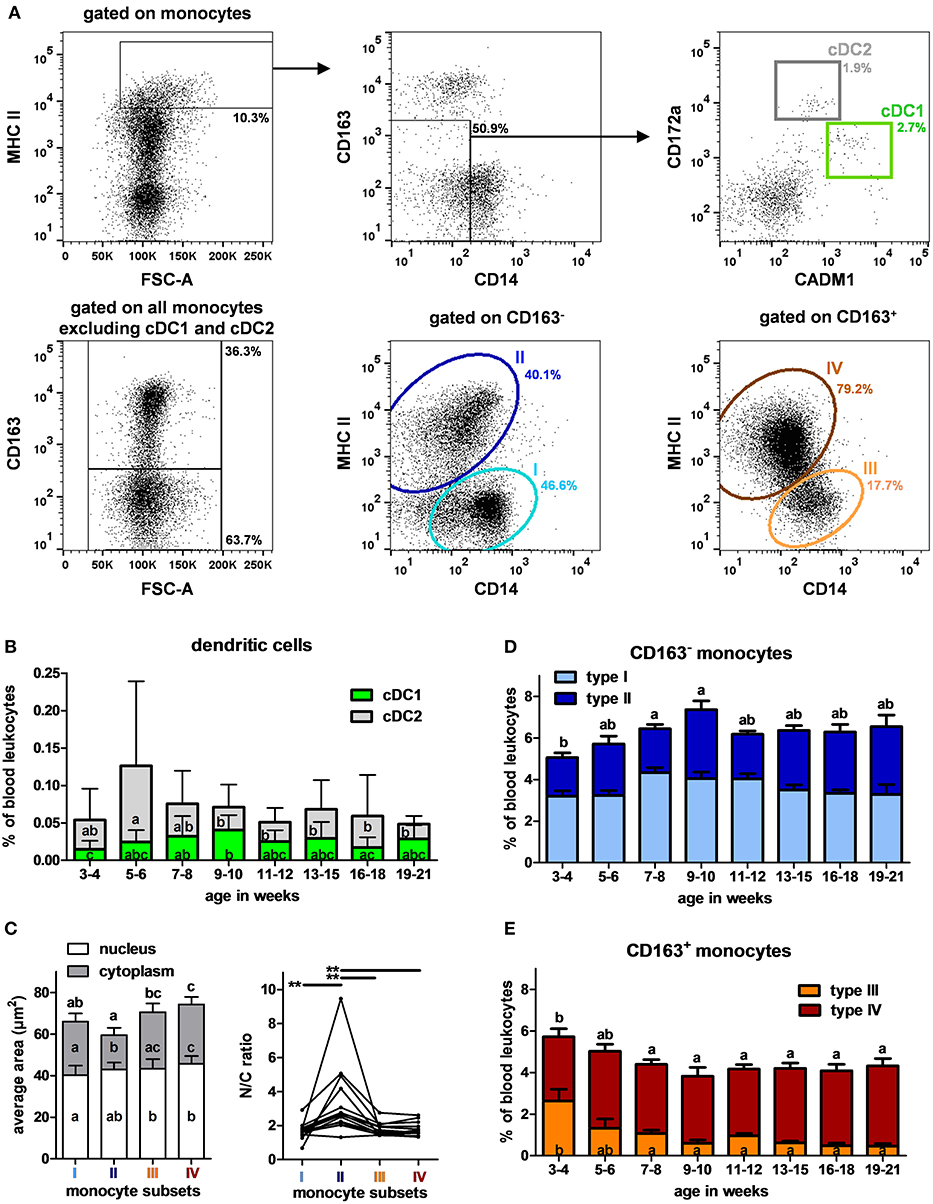
Figure 4. DCs and monocytes in swine peripheral blood. (A) Gating strategy to identify cDC1, cDC2 and monocytes in PBLs. Cells were first gated on the monocyte cell population described in Figure 1A. Within monocytes, MHC IIhigh were selected (upper left panel) and CD14−/low CD163−/low were gated (upper middle panel) and plotted on CADM1 vs. CD172a (upper right panel). cDC1 and cDC2 were gated as CADM1high CD172alow and CADM1low CD172ahigh, respectively. A Boolean gate was then created to get all the monocytes excluding only cDC1 and cDC2. Cells were then separated in CD163+ and CD163− (lower left panel) and MHC II and CD14 expressions were evaluated within those cell subsets. Within CD163− monocytes (lower middle panel), type I (CD163− CD14+ MHC II−) and type II (CD163− CD14low MHC II+) were identified and within CD163+ monocytes (lower right panel), type III (CD163+ CD14+ MHC II−) and type IV (CD163+ CD14low MHC II+). Percentages of the parent populations are shown on each dot plot representing 10,000 events. (B) Kinetics of percentages of cDC1 and cDC2 in peripheral blood. Lines represent the means with SEM. Different letters inside the bar plots indicate significant differences within groups of age for the corresponding cell population (p < 0.05). (C) Per cell nuclear and cytoplasmic areas and N/C ratios (nuclear divided by cytoplasmic area) of the monocyte subsets assessed by imaging flow cytometry. Lines link data from the same animals. Statistical analysis was performed using a Friedman test for non-parametric repeated values followed by Dunn's post test to compare the different monocyte subsets. Significant differences within monocyte subsets are represented with bars (**p < 0.01) or with different letters inside the bar plots of the corresponding population (p < 0.05). Letters above the bar plots indicate the significant differences for the total cell area. Kinetics of percentages of (D) CD163− and (E) CD163+ monocytes subsets in peripheral blood. Lines represent the means with SEM. Different letters inside the bar plots indicate significant differences within groups of age for the corresponding population (p < 0.05), letters above indicate the significant differences within groups of age for all the CD163− or CD163+ monocytes (p < 0.05).
The characterization of monocytes was performed from the gate excluding cDC1 and cDC2 (Figure 4A). CD163 expression allowed to separate monocytes into two populations that could be further divided into 4 subsets according to their CD14 and MHC II expressions: CD163− CD14+ MHC II− (type I), CD163− CD14low MHC II+ (type II), CD163+ CD14+ MHC II− (type III), and CD163+ CD14low MHC II+ (type IV) (23, 24). Means of FSC were weaker for CD163− monocytes than for CD163+ monocytes. To go further on the evaluation of their morphologic features, monocytes from pigs of 6–7 (n = 3), 11–12 (n = 9) and 16–18 (n = 2) weeks of age were studied by imaging flow cytometry. Areas of cells, nucleus and cytoplasm and the nucleus to cytoplasm ratios were evaluated “per cell” for the different subsets. Type II monocytes appeared morphologically different from others, harboring smaller cytoplasmic area and higher nucleus to cytoplasm ratios. Type III and IV (CD163+) were the biggest ones (Figure 4C).
The proportions of CD163− monocytes increased until weeks 9–10 and then remained stable, representing around 6% of PBLs, type I and type II monocytes having the same evolution profile (Figure 4D). Type IV monocytes remained stable over time. In contrast, type III monocytes are more abundant in the youngest studied animals (effect of age p < 0.001) (Figure 4E). A high variability in the proportions of type III monocytes is observed within pigs between 3 and 6 weeks of age. After 13 weeks, type I, II, III and IV monocytes represented <5, 24–27, 26–30, and 30–32% of total monocytes, respectively.
Longitudinal Analysis of Circulating Granulocytes in 3–21 Week-Old Pigs: Inverse Correlation Between the Proportion of Neutrophils and Eosinophils With Age
To analyze granulocytes, the antibody clone PG68A was used (Table 2, panel D) and the gating strategy illustrated in Figure 5A was applied. Most of granulocytes expressed the PG68A marker, but some were PG68A−/low. These two subsets were then sorted and stained by MGG. As shown in Figure 5B, 94% of PG68A+ granulocytes had features corresponding to neutrophils with a multilobed nucleus and a cytoplasm containing few organelles and harboring a neutral pink stain. By contrast, 86% of PG68A−/low granulocytes exhibited specific features of eosinophils with two lobes to their nucleus and acidophilic granules in their cytoplasm stained bright red, or reddish-purple. PG68A+ (mainly neutrophils) represented 56.9 and 54.1% of PBLs at 3–4 and 7–8 weeks, respectively; and decreased to 42.9 and 41.8% of them at 16–18 and 19–21 weeks, respectively (Supplementary Table 3 and Figure 5C, effect of age p < 0.001). PG68A−/low (mainly eosinophils) were rare in young piglets and increased with age, representing 1.2, 0.9, and 1.3% of PBLs at 3–4, 5–6, and 7–8 weeks, respectively and 3.3 and 2.4% of PBLs at 16–18 and 19–21 weeks, respectively (Supplementary Table 3 and Figure 5D, effect of age p < 0.001).
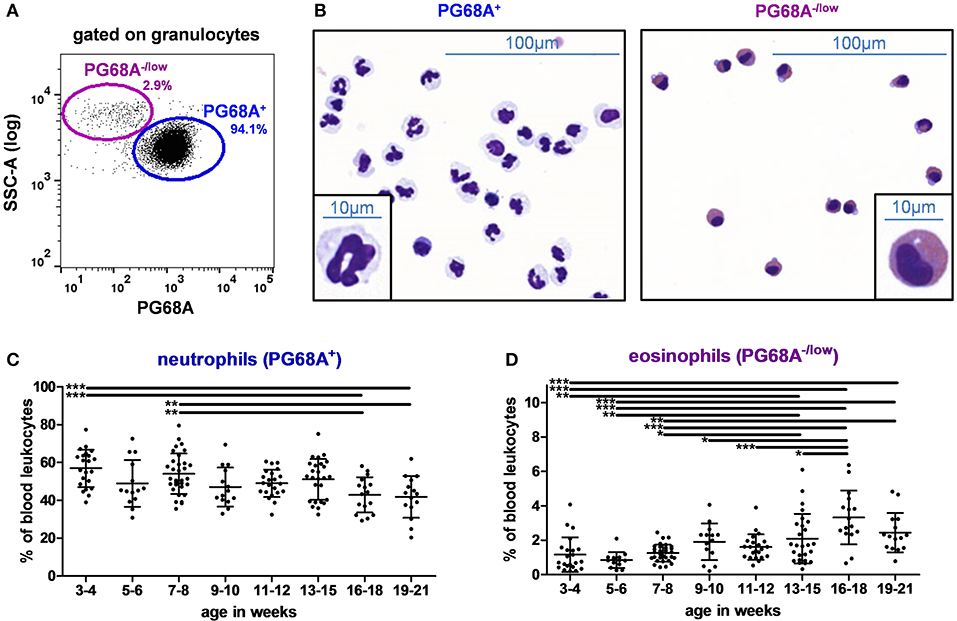
Figure 5. Granulocytes in swine peripheral blood. (A) Gating strategy to identify granulocytes in PBLs. Cells were first gated on the granulocyte population described in Figure 1A. PG68A−/low and PG68A+ cells were identified. Percentages of the parent populations are shown on each dot plot representing 10,000 events. (B) Microscopic images (MGG staining, × 40 original magnification or × 100 in the insert) of sorted PG68A+ and PG68A−/low cells. Images are representative of 3 independent sortings performed on 15 to 21 week-old pig granulocytes. Kinetics of percentages of (C) neutrophils and (D) eosinophils in peripheral blood. Lines represent the means with SEM. Significant differences are represented with bars (*p < 0.05, **p < 0.01, and ***p < 0.001).
Influence of the Gender on Blood Cell Composition
Next, the effect of sex on the blood leukocyte composition was investigated from 62 samples derived from 14 males and 99 samples from 22 females. Globally, slight differences could be revealed: females harbored a higher proportion of type IV monocytes, CD4+ T helper cells and a lower proportion of CD8α+ cytotoxic T cells and cDC2 (see effect of sex in Table 3 and Supplementary Tables 1, 3).
Effect of Melanoma Occurrence on the Blood Cell Composition in the MeLiM Model
In this analysis, 29 samples came from 7 healthy pigs and 132 samples from 29 melanoma-bearing pigs. The effect of melanoma occurrence was then investigated on blood cell composition. Globally, there was no effect of melanoma on cDC1 and monocyte subsets. Melanoma-bearing animals harbored higher proportions of neutrophils, NK cells, cDC2, CD4+, and DP T cells; and lower proportions of eosinophils, γδ T cells and B cells (see effect of melanoma in Supplementary Tables 1–3). The differences were observed over three different periods related with important time points of melanoma development and then regression (at 3–4 weeks: tumor progression; at 7–8 weeks, first histological features of regression often observed; and at 11–12 weeks: more advanced features of regression) (4). Individual data for each cell subset in percentages of PBLs and in absolute counts are represented in Figure 6A and Supplementary Figure 2, respectively.
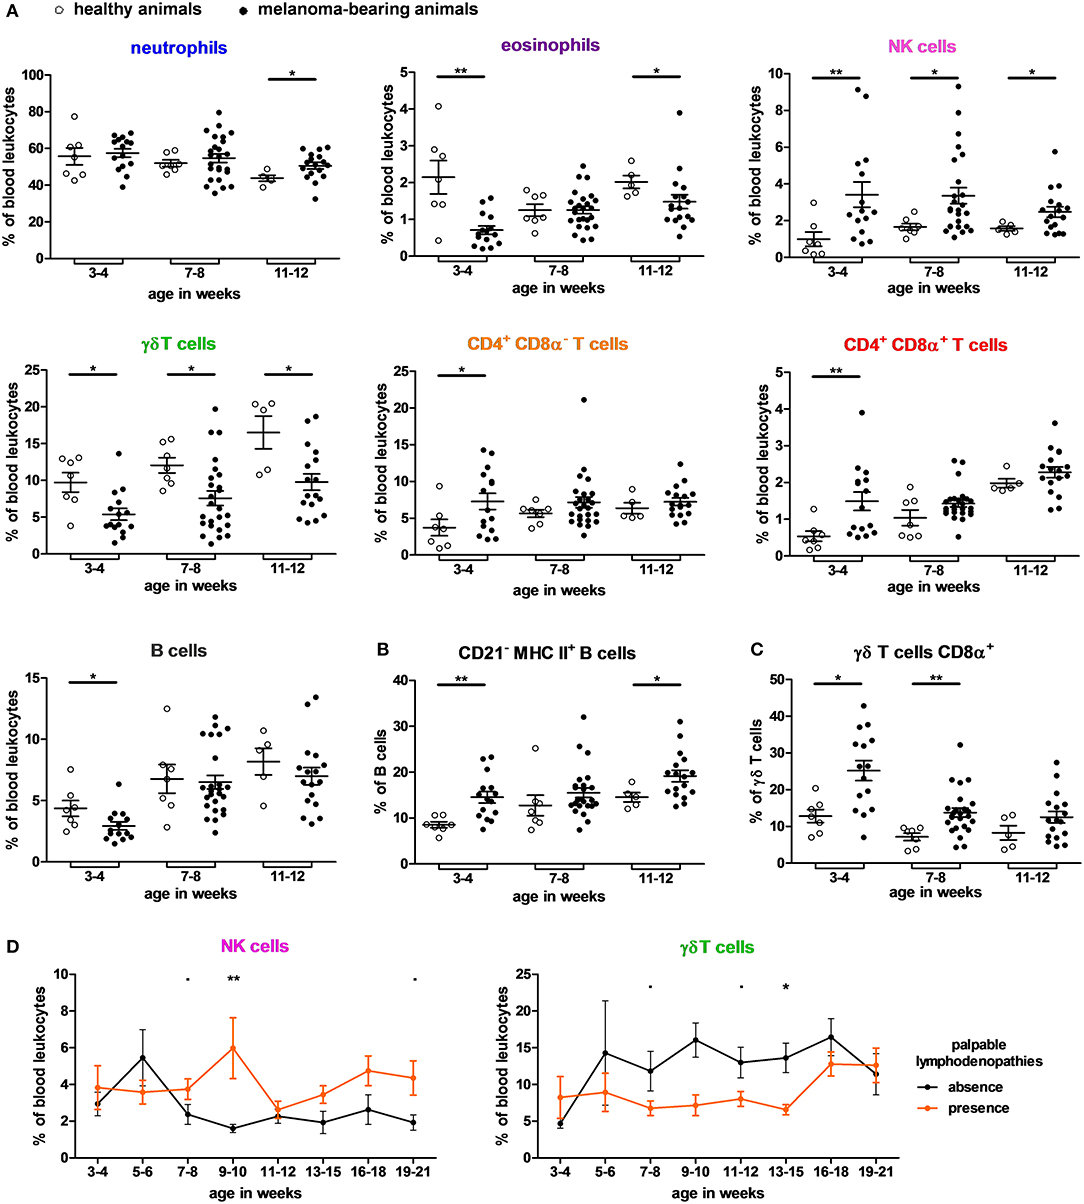
Figure 6. Effect of melanoma occurrence on immune blood cell composition of MeLiM pigs. (A) Blood cell proportions that differ between healthy and melanoma-bearing pigs aged of 3–4, 7–8, and 11–12 weeks. Proportions (B) of B cells CD21− MHC II+ among B cells and (C) of γδ T cells expressing CD8α among γδ T cells from healthy and melanoma-bearing pigs aged of 3–4, 7–8, and 11–12 weeks. Healthy and melanoma-bearing pigs at each age were compared using a Mann-Whitney test and significant differences are represented with bars (*p < 0.05 and **p < 0.01). (D) Kinetics of proportions of NK cells and γδ T cells in blood leukocytes depending on the presence of palpable lymphadenopathies and tumor burden in melanoma-bearing pigs (means with SEM). Groups of pigs at each age were compared using a Mann-Whitney test and significant differences are represented above (p < 0.1 and *p < 0.05).
Neutrophils were more frequent in melanoma-bearing animals only at the latest time-point (11–12 weeks). Interestingly, 3–4 week-old melanoma-bearing pigs harbored higher proportions of NK cells and single positive CD4 or DP T cells and lower proportion of B cells, eosinophils and γδ T cells compared to age-matched healthy pigs. These differences between both groups were even observed all along the follow-up for NK cells and γδ T cells and were also consistent with absolute counts in most of cases (Supplementary Figure 2). Indeed, our data evidenced a significant accumulation of circulating NK cells and single positive CD4 or DP T cells in very young melanoma bearing pigs.
Notably, even though γδ T cells and B cells were less frequent in melanoma-bearing pigs, there were higher proportions of CD21− MHC II+ B cells (Figure 6B) and CD8α+ γδ T in these animals (Figure 6C).
An effect of the presence of palpable lymphadenopathies and to a lesser extent of tumor burden can be found on the proportions of γδ T cells and NK cells in blood; the presence of palpable lymphadenopathies leading to higher proportions of NK cells and lower of γδ T cells (Figure 6D).
Discussion
In this study, we analyzed phenotypic and quantitative changes in blood immune cell subpopulations before weaning until puberty to provide an overview of the maturation of the pig immune system in the biomedical MeLiM model. We determined relevant strategies to monitor all circulating subsets simultaneously. Lymphoid and myeloid cells were phenotyped and functional subsets for T lymphocytes (helper, cytotoxic or regulatory functions) and B lymphocytes were characterized.
Here we showed major effects of age (Figure 7A) on B cells, γδ T cells, DP and CD8α+ T cells from total blood of 3–21 week-old MeLiM pigs, consistent with previous analyses on PBMCs in other breeds (29–31). In addition, we evidenced a decrease in neutrophils and an increase in eosinophils with age. The inter-individual variability in very young piglets may be related to a difference in the maturation of their immune system. For example, a high number of DN T cells was found in the youngest studied animals and should correspond to immature T cells. Also T and B lymphocytes are present in colostrum passing into neonate's blood and therefore could participate in this variability. For animal welfare, weaning is progressive in our experimental facility, piglets can start eating dry food while still suckling. Therefore, the effect of weaning could not be clearly investigated in this study.
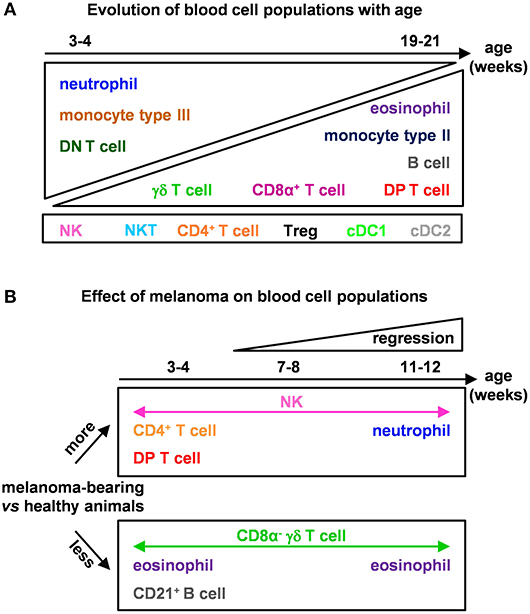
Figure 7. Models of the effects of age and melanoma occurrence on immune blood cell composition of MeLiM pigs. (A) Evolution of blood cell populations with age and (B) effect of melanoma on blood cell populations.
We have refined the identification of granulocytes in swine. Indeed, these cells are mainly identified from the whole blood by their morphology (high granularity) or purified according to their density (32). The detailed identification of neutrophils, eosinophils and basophils was based on automatic blood cell count or by microscopy with a specific staining. We have defined a new strategy allowing the identification of eosinophils among granulocytes. They have a high granulometry (high SSC in log scale) and have no or low PG68A expression. This marker is currently considered as a pan granulocyte marker although its target is still unknown (9). We showed here that PG68A stains neutrophils and possibly basophils, but not eosinophils in swine blood. Being able for the first time to distinguish by flow cytometry eosinophils from neutrophils among granulocytes in pigs allowed us to reveal an inverse evolution between these two populations with age. Eosinophils are usually linked to parasite infestations. A careful follow up of animal health status was done and no parasitic presence was detected during the course of the study.
Monocyte subsets and their functionality are not clearly defined in pigs. Fairbairn et al. have reported variable expressions between breeds for CD163, CD14, and MHC II markers used to phenotype the four distinct subsets that could be more or less continuous (21). It seems difficult to compare from one study to another as the breed and age of pigs are different or not always reported. Nonetheless, two major subtypes are present in the blood of adult pigs: type I (CD163− CD14+ MHC II−) and type IV (CD163+ CD14low MHC II+) (33, 34). We report here variable proportions of monocytes with age. Globally, CD163− monocytes increase, while CD163+ monocytes decrease with age. Furthermore, type III (CD163+ CD14+ MHC II−) monocytes are present in high proportion in blood of young piglets, whereas type I and IV are the major subtypes of monocytes in older pigs. Based on the literature, type I monocytes could be considered as the most immature stage and type IV as the most mature. Indeed, CD163− monocytes could spontaneously switch their phenotype to CD163+ under in vitro conditions (24). In addition, CD163+ monocytes express higher amounts of co-stimulatory and adhesion molecules and are able to produce higher amounts of TNF-α than CD163− ones after in vitro culture (23, 24). The approach of studying the morphological features of the different monocyte subsets by imaging flow cytometry could help understanding their activation status. We report here that type II monocytes display morphological features that correspond to a more advanced activation status (loss of cytoplasmic volume, high nucleus to cytoplasm ratio) (35) and that type III and IV monocytes are the biggest ones. It would be of great interest to use this approach to study monocytes in inflammatory infection conditions.
Recently, melanoma-bearing MeLiM pigs were reported to show white blood cell counts not significantly different from control MeLiM pigs, neutrophils instead were more abundant in sick ones (36). Here we confirm this effect on circulating neutrophils on growing animals. We further observed higher proportions of NK cells and lower proportions of eosinophils at all time points in melanoma-bearing animals (Figure 7B). At 3–4 weeks of age, these individuals also showed higher CD4+ and DP T cells, as well as lower percentages of γδ T cells and B cells. In line with our findings, the inoculation of melanoma cells in mice was reported to decrease B and CD8α + T lymphocytes, increase CD4+ T lymphocytes and NK cells percentages and activate markers of NK in blood (37). Patients with an advanced stage of melanoma have also higher circulating leukocytes, neutrophils and monocytes, and lower lymphocytes, supporting a shaping of the blood composition in the course of tumor progression (38).
Compared to human and mice, swine harbor a substantial proportion of γδ T cells in the peripheral blood and lymphoid organs like other species qualified as high γδ T species (17); their role is still unclear. In absolute count, CD8α− γδ T cells are less frequent in melanoma-bearing pigs compared to healthy pigs. Nevertheless, in melanoma-bearing animals, we found a higher proportion and an equal absolute count of CD8α+ γδ T cells, which seems to stain more mature cells (39). B cells are also less abundant in melanoma-bearing animals than in healthy pigs, but higher proportion of CD21− MHC II+ B cells among B cells is observed and absolute count of this specific B cell subset is maintained in animals with melanoma. In humans, CD21−/low B cells increase with age in physiological conditions and correspond to memory B cells (40). In pigs, naïve and primed/activated B cells express CD21 while effector B cells and plasma cells are CD21− (17, 41). Braun et al. have identified CD21− B cells as B-1 cells (42). Here we found that CD21 expression on B cells correlated with the serum total IgG levels. Interestingly, Cizkova et al. also found an increase of melanoma-associated DP T lymphocytes in peripheral blood during melanoma regression at adult stages (43). In our study, we showed a higher proportion of this T cell subset already in young pigs. Together, all these B cell and T cell subsets may be involved in the production of tumor-specific antibodies and the depigmentation process associated with the regression (5). Furthermore, the higher proportion of NK cells in melanoma-bearing animals suggests an important implication of NK cells in the immune response against melanoma tumors in the MeLiM model. Interestingly, compared to healthy donors, an impaired blood NK cell function is observed in metastatic melanoma patients (44, 45). Accordingly, anti-tumor properties of NK cells and their subsequent role in the regression process remains to be addressed in MeLiM pigs. It could thus be envisaged to add NKp46 as a marker of NK cell activation (46).
The higher proportions of NK cells, CD4+ and DP T cells and CD21− B cells among B cells in young melanoma-bearing piglets compared to healthy age matched pigs is in accordance with the mounting of an immune response against melanoma. The strategy designed here includes live/dead staining and an anti-CD45 antibody and could be adapted to identify cell subsets from more complex tissues in which dead cells can render the analysis more difficult and when identifying immune cells among others is necessary. Further studies are needed to characterize immune cells infiltrating melanoma tumors in this MeLiM biomedical model to better understand the role of the immune system in the progression and regression of melanomas. More knowledge on the phenotypes of immune cells in swine blood could also participate in qualifying and selecting immunocompetent pigs to improve welfare as well as to reduce antimicrobials in swine meat production.
Data Availability Statement
The raw data supporting the conclusions of this article will be made available by the authors, without undue reservation, to any qualified researcher.
Ethics Statement
The animal study was reviewed and approved by Committee on the Ethics of Animal Experiments of AgroParisTech and INRA Jouy-en-Josas (COMETHEA, authorization number 12/091).
Author Contributions
FB, AP-B, NB, and SV-N contributed to the conception and design of the study. FB, GP, and EBoug performed the experiments. J-JL and FA were in charge of the animal experimentations. FB performed the statistical analysis and wrote the first draft of the manuscript. AP-B, GE, EBour, NB, and SV-N participated in interpreting the results. All authors contributed to manuscript revision, read and approved the submitted version.
Funding
This work was supported by Institut National du Cancer, in the frame of the project INCa-ITMO Cancer inside the plan cancer 2009–2013—project MeLiMun.
Conflict of Interest
The authors declare that the research was conducted in the absence of any commercial or financial relationships that could be construed as a potential conflict of interest.
Acknowledgments
The authors greatly acknowledge the Cytometry and Immunobiology Facility (Cybio) of the Cochin Institute, the MetaFun platform of MetaGénoPolis and the Cytometry Paris platform of Institut Curie for access to the flow cytometers apparatus used in that study. This work has benefited from the facilities and expertise of @BRIDGe (GABI, INRA, AgroParisTech, Paris-Saclay University) for the virtual slide scanner. We also thank Mickaël Bourge and the Imagerie-Gif core facility.
Supplementary Material
The Supplementary Material for this article can be found online at: https://www.frontiersin.org/articles/10.3389/fimmu.2020.00291/full#supplementary-material
References
1. Meurens F, Summerfield A, Nauwynck H, Saif L, Gerdts V. The pig: a model for human infectious diseases. Trends Microbiol. (2012) 20:50–7. doi: 10.1016/j.tim.2011.11.002
2. Mair KH, Sedlak C, Käser T, Pasternak A, Levast B, Gerner W, et al. The porcine innate immune system: an update. Dev Comp Immunol. (2014) 45:321–43. doi: 10.1016/j.dci.2014.03.022
3. Hruban V, Horák V, Fortýn K, Hradecký J, Klaudy J, Smith DM, et al. Inheritance of malignant melanoma in the MeLiM strain of miniature pigs. Vet Med. (2004) 49:453–9. doi: 10.17221/5739-VETMED
4. Vincent-Naulleau S, Le Chalony C, Leplat J-J, Bouet S, Bailly C, Spatz A, et al. Clinical and histopathological characterization of cutaneous melanomas in the melanoblastoma-bearing libechov minipig model. Pigment Cell Res. (2004) 17:24–35. doi: 10.1046/j.1600-0749.2003.00101.x
5. Blanc F, Créchet F, Bruneau N, Piton G, Leplat J-J, Andréoletti F, et al. Impact of a CD4 gene haplotype on the immune response in minipigs. Immunogenetics. (2018) 70:209–22. doi: 10.1007/s00251-017-1037-z
6. Rambow F, Piton G, Bouet S, Leplat J-J, Baulande S, Marrau A, et al. Gene expression signature for spontaneous cancer regression in melanoma pigs. Neoplasia. (2008) 10:714–26. doi: 10.1593/neo.08344
7. Lunney JK, Walker K, Goldman T, Aasted B, Bianchi A, Binns R, et al. Overview of the first international workshop to define swine leukocyte cluster of differentiation (CD) antigens. Vet Immunol Immunopathol. (1994) 43:193–206. doi: 10.1016/0165-2427(94)90136-8
8. Saalmüller A, Pauly T, Lunney JK, Boyd P, Aasted B, Sachs DH, et al. Overview of the Second International Workshop to define swine cluster of differentiation (CD) antigens. Vet Immunol Immunopathol. (1998) 60:207–28. doi: 10.1016/S0165-2427(97)00098-6
9. Haverson K, Saalmüller A, Alvarez B, Alonso F, Bailey M, Bianchi ATJ, et al. Overview of the third international workshop on swine leukocyte differentiation antigens. Vet Immunol Immunopathol. (2001) 80:5–23. doi: 10.1016/S0165-2427(01)00290-2
10. Deloizy C, Bouguyon E, Fossum E, Sebo P, Osicka R, Bole A, et al. Expanding the tools for identifying mononuclear phagocyte subsets in swine : reagents to porcine CD11c and XCR1. Dev Comp Immunol. (2016) 65:31–40. doi: 10.1016/j.dci.2016.06.015
11. Gerner W, Talker SC, Koinig HC, Sedlak C, Mair KH, Saalmüller A. Phenotypic and functional differentiation of porcine αβ T cells: current knowledge and available tools. Mol Immunol. (2015) 66:3–13. doi: 10.1016/j.molimm.2014.10.025
12. Piriou-Guzylack L, Salmon H. Membrane markers of the immune cells in swine: an update. Vet Res. (2008) 39:54. doi: 10.1051/vetres:2008030
13. Dawson HD, Lunney JK. Porcine cluster of differentiation (CD) markers 2018 update. Res Vet Sci. (2018) 118:199–246. doi: 10.1016/j.rvsc.2018.02.007
14. Vu Manh TP, Bertho N, Hosmalin A, Schwartz-Cornil I, Dalod M. Investigating evolutionary conservation of dendritic cell subset identity and functions. Front Immunol. (2015) 6:260. doi: 10.3389/fimmu.2015.00260
15. Vu Manh TP, Elhmouzi-Younes J, Urien C, Ruscanu S, Jouneau L, Bourge M, et al. Defining mononuclear phagocyte subset homology across several distant warm-blooded vertebrates through comparative transcriptomics. Front Immunol. (2015) 6:299. doi: 10.3389/fimmu.2015.00299
16. Guilliams M, Dutertre CA, Scott CL, McGovern N, Sichien D, Chakarov S, et al. Unsupervised high-dimensional analysis aligns dendritic cells across tissues and species. Immunity. (2016) 45:669–84. doi: 10.1016/j.immuni.2016.08.015
17. Sinkora M, Butler JE. The ontogeny of the porcine immune system. Dev Comp Immunol. (2009) 33:273–83. doi: 10.1016/j.dci.2008.07.011
18. Stepanova K, Sinkora M. Porcine γδ T lymphocytes can be categorized into two functionally and developmentally distinct subsets according to expression of CD2 and level of TCR. J Immunol. (2013) 190:2111–20. doi: 10.4049/jimmunol.1202890
19. Auray G, Keller I, Python S, Gerber M, Bruggmann R, Ruggli N, et al. Characterization and transcriptomic analysis of porcine blood conventional and plasmacytoid dendritic cells reveals striking species-specific differences. J Immunol. (2016) 197:4791–806. doi: 10.4049/jimmunol.1600672
20. Edwards JC, Everett HE, Pedrera M, Mokhtar H, Marchi E, Soldevila F, et al. CD1− and CD1+ porcine blood dendritic cells are enriched for the orthologues of the two major mammalian conventional subsets. Sci Rep. (2017) 7:1–14. doi: 10.1038/srep40942
21. Fairbairn L, Kapetanovic R, Beraldi D, Sester DP, Tuggle CK, Archibald AL, et al. Comparative analysis of monocyte subsets in the pig. J Immunol. (2013) 190:6389–96. doi: 10.4049/jimmunol.1300365
22. Ondrackova P, Nechvatalova K, Kucerova Z, Leva L, Dominguez J, Faldyna M. Porcine mononuclear phagocyte subpopulations in the lung, blood and bone marrow: dynamics during inflammation induced by Actinobacillus pleuropneumoniae. Vet Res. (2010) 41:64. doi: 10.1051/vetres/2010035
23. Chamorro S, Revilla C, Alvarez B, López-Fuertes L, Ezquerra A, Domínguez J. Phenotypic characterization of monocyte subpopulations in the pig. Immunobiology. (2000) 202:82–93. doi: 10.1016/S0171-2985(00)80055-8
24. Chamorro S, Revilla C, Álvarez B, Alonso F, Ezquerra A, Domínguez J. Phenotypic and functional heterogeneity of porcine blood monocytes and its relation with maturation. Immunology. (2005) 114:63–71. doi: 10.1111/j.1365-2567.2004.01994.x
25. Pelletier MGH, Szymczak K, Barbeau AM, Prata GN, O'Fallon KS, Gaines P. Characterization of neutrophils and macrophages from ex vivo-cultured murine bone marrow for morphologic maturation and functional responses by imaging flow cytometry. Methods. (2017) 112:124–46. doi: 10.1016/j.ymeth.2016.09.005
26. R Core Team. R: A Language and Environment for Statistical Computing. (2019) Available online at: https://www.r-project.org/ (accessed July 25, 2019).
27. Lee SJ, Kim SJ, Park C-G, Park J, Kim JH, Chun T. Molecular cloning and expression analysis of pig CD79α. Vet Immunol Immunopathol. (2008) 125:368–74. doi: 10.1016/j.vetimm.2008.05.014
28. Sun J, Sinkora J, Wertz N, Moravkova A, Butler JE. Characterization of porcine CD19 and anti-CD19 monoclonal antibodies. Mol Immunol. (2004) 41:929–38. doi: 10.1016/j.molimm.2004.03.021
29. Grierson SS, King DP, Tucker AW, Donadeu M, Mellencamp MA, Haverson K, et al. Ontogeny of systemic cellular immunity in the neonatal pig: correlation with the development of post-weaning multisystemic wasting syndrome. Vet Immunol Immunopathol. (2007) 119:254–68. doi: 10.1016/j.vetimm.2007.06.004
30. Talker SC, Käser T, Reutner K, Sedlak C, Mair KH, Koinig H, et al. Phenotypic maturation of porcine NK- and T-cell subsets. Dev Comp Immunol. (2013) 40:51–68. doi: 10.1016/j.dci.2013.01.003
31. Stepanova H, Samankova P, Leva L, Sinkora J, Faldyna M. Early postnatal development of the immune system in piglets: the redistribution of T lymphocyte subsets. Cell Immunol. (2007) 249:73–9. doi: 10.1016/j.cellimm.2007.11.007
32. Bréa D, Meurens F, Dubois AV, Gaillard J, Chevaleyre C, Jourdan ML, et al. The pig as a model for investigating the role of neutrophil serine proteases in human inflammatory lung diseases. Biochem J. (2012) 447:363–70. doi: 10.1042/BJ20120818
33. Moreno S, Alvarez B, Poderoso T, Revilla C, Ezquerra A, Alonso F, et al. Porcine monocyte subsets differ in the expression of CCR2 and in their responsiveness to CCL2. Vet Res. (2010) 41:76. doi: 10.1051/vetres/2010048
34. Ondrackova P, Leva L, Kucerova Z, Vicenova M, Mensikova M, Faldyna M. Distribution of porcine monocytes in different lymphoid tissues and the lungs during experimental Actinobacillus pleuropneumoniae. infection and the role of chemokines. Vet Res. (2013) 44:1–16. doi: 10.1186/1297-9716-44-98
35. Sheaff MT, Singh N. Cytopathology: An Introduction. 1st ed. Springer-Verlag London (2013). doi: 10.1007/978-1-4471-2419-1
36. Cizková J, Erbanová M, Sochor J, Jindrová A, Strnadová K, Horák V. Relationship between haematological profile and progression or spontaneous regression of melanoma in the Melanoma-bearing Libechov Minipigs. Vet J. (2019) 249:1–9. doi: 10.1016/j.tvjl.2019.04.016
37. Isvoranu G, Surcel M, Huică R, Munteanu AN, Pîrvu IR, Ciotaru DAN, et al. Natural killer cell monitoring in cutaneous melanoma - new dynamic biomarker. Oncol Lett. (2019) 17:4197–206. doi: 10.3892/ol.2019.10069
38. Gandini S, Ferrucci PF, Botteri E, Tosti G, Barberis M, Pala L, et al. Prognostic significance of hematological profiles in melanoma patients. Int J Cancer. (2016) 139:1618–25. doi: 10.1002/ijc.30215
39. Stepanova K, Sinkora M. The expression of CD25, CD11b, SWC1, SWC7, MHC-II, and family of CD45 molecules can be used to characterize different stages of γδ T lymphocytes in pigs. Dev Comp Immunol. (2012) 36:728–40. doi: 10.1016/j.dci.2011.11.003
40. Thorarinsdottir K, Camponeschi A, Cavallini N, Grimsholm O, Jacobsson L, Gjertsson I, et al. CD21−/low B cells in human blood are memory cells. Clin Exp Immunoly. (2016) 185:252–62. doi: 10.1111/cei.12795
41. Sinkora M, Butler JE. Progress in the use of swine in developmental immunology of B and T lymphocytes. Dev Comp Immunol. (2016) 58:1–17. doi: 10.1016/j.dci.2015.12.003
42. Braun RO, Python S, Summerfield A. Porcine B cell subset responses to toll-like receptor ligands. Front Immunol. (2017) 8:1044. doi: 10.3389/fimmu.2017.01044
43. Cizkova J, Sinkorova Z, Strnadova K, Cervinkova M, Horak V, Sinkora J, et al. The role of αβ T-cells in spontaneous regression of melanoma tumors in swine. Dev Comp Immunol. (2019) 92:60–8. doi: 10.1016/j.dci.2018.10.001
44. Mirjačić Martinović K, Konjević G, Babović N, Inić M. The stage dependent changes in NK cell activity and the expression of activating and inhibitory NK cell receptors in melanoma patients. J Surg Res. (2011) 171:637–49. doi: 10.1016/j.jss.2010.05.012
45. Fregni G, Messaoudene M, Fourmentraux-Neves E, Mazouz-Dorval S, Chanal J, Maubec E, et al. Phenotypic and functional characteristics of blood Natural killer cells from melanoma patients at different clinical stages. PLoS ONE. (2013) 8:1–9. doi: 10.1371/journal.pone.0076928
Keywords: swine blood leucocytes, lymphoid cells, myeloid cells, longitudinal analysis, age, melanoma, biomedical model
Citation: Blanc F, Prévost-Blondel A, Piton G, Bouguyon E, Leplat J-J, Andréoletti F, Egidy G, Bourneuf E, Bertho N and Vincent-Naulleau S (2020) The Composition of Circulating Leukocytes Varies With Age and Melanoma Onset in the MeLiM Pig Biomedical Model. Front. Immunol. 11:291. doi: 10.3389/fimmu.2020.00291
Received: 25 July 2019; Accepted: 05 February 2020;
Published: 28 February 2020.
Edited by:
Fabrizio Ceciliani, University of Milan, ItalyReviewed by:
Sabine Hammer, University of Veterinary Medicine Vienna, AustriaWilhelm Gerner, University of Veterinary Medicine Vienna, Austria
Copyright © 2020 Blanc, Prévost-Blondel, Piton, Bouguyon, Leplat, Andréoletti, Egidy, Bourneuf, Bertho and Vincent-Naulleau. This is an open-access article distributed under the terms of the Creative Commons Attribution License (CC BY). The use, distribution or reproduction in other forums is permitted, provided the original author(s) and the copyright owner(s) are credited and that the original publication in this journal is cited, in accordance with accepted academic practice. No use, distribution or reproduction is permitted which does not comply with these terms.
*Correspondence: Fany Blanc, ZmFueS5ibGFuY0BpbnJhZS5mcg==; Armelle Prévost-Blondel, YXJtZWxsZS5ibG9uZGVsQGluc2VybS5mcg==
†These authors have contributed equally to this work