 Vincent Pernin1,2*
 Anais Beyze2Ilan Szwarc1
 Nicole Bec2Céline Salsac2Esther Perez-Garcia2Georges Mourad1,2
 Pierre Merville3,4,5
 Jonathan Visentin4,5,6
 Helene Perrochia7Christian Larroque2,8
 Lionel Couzi3,4,5
 Moglie Le Quintrec1,2*
- 1Department of Nephrology, Dialysis and Transplantation, Montpellier University Hospital, University of Montpellier, Montpellier, France
- 2Institute for Regenerative Medicine & Biotherapy (IRMB), University of Montpellier, INSERM, Montpellier, France
- 3Department of Nephrology, Transplantation, Dialysis and Apheresis, Pellegrin University Hospital, Bordeaux, France
- 4Immuno ConcEpT, UMR CNRS 5164, Bordeaux, France
- 5Université de Bordeaux, Bordeaux, France
- 6Department of Immunology and Immunogenetics, Pellegrin University Hospital, Bordeaux, France
- 7Department of Pathology, Montpellier University Hospital, Montpellier, France
- 8Institut de Recherche en Cancérologie de Montpellier (IRCM), INSERM U1194, Montpellier University, Institut Régional du Cancer de Montpellier (ICM), Montpellier, France
Donor-specific antibodies (DSAs) are the main risk factor for antibody-mediated rejection (ABMR) and graft loss but could have variable pathogenicity according to their IgG subclass composition. Luminex-based test might lack sensitivity for the detection of IgG subclasses and this test does not allow quantifying the relative abundance of each IgG subclass. We investigated the precise repartition of each DSA subclass and their role in ABMR occurrence and severity, using an innovative mass spectrometry-based method. Between 2014 and 2018, we enrolled 69 patients who developed de novo DSA (n = 29 without ABMR, and n = 40 with ABMR) in two transplant centers. All IgG subclasses were detected in every samples tested: 62.7% were IgG1, 26.6% were IgG2, 6.6% were IgG3, and 4.2% were IgG4. The IgG3 proportion was significantly higher in the ABMR+ compared to the ABMR– group (8.4% vs. 5.6%, p = 0.003). The proportion of IgG1, IgG2, and IgG4 of DSA was similar between the two groups. Higher IgG3 level was associated with higher C4d deposition, higher microvascular inflammation scores, and glomerular filtration rate decline >25%. IgG3 proportion was not correlated with DSA MFI. Multivariate analysis showed that proteinuria and high level of IgG3 DSA were the only two factors independently associated with ABMR. In conclusion, de novo DSA are always composed of the four IgG subclasses, but in different proportions. High IgG3 proportion is associated with ABMR occurrence and severity and with poorer outcome, independently of DSA MFI.
Introduction
Antibody-mediated rejection (ABMR) is now recognized as the leading cause of long-term renal transplant loss (1). ABMR results from the interaction between endothelial cells and donor-specific antibodies (DSAs), mainly against HLA antigens, leading to endothelial cell activation, complement activation via the classical pathway, inflammatory cell recruitment within the graft microcirculation (glomerular capillaries and peri-tubular capillaries), and graft dysfunction (2).
De novo DSA (i.e., DSA appearing after transplantation) are detected in ~20% of transplant recipients in the first 5 years (3), and are a major risk factor for ABMR and graft loss. However, the clinical course after de novo DSA detection is very heterogeneous, ranging from absence of detectable graft injury to rapid graft function deterioration and graft loss (4). Therefore, anti-HLA antibodies seem to have variable pathogenicity. DSA level (mean fluorescence intensity, MFI, using the Luminex Single Antigen test) and ability to bind to the complement component 1q (C1q) contribute to the graft rejection risk, but do not explain the outcome disparities (5, 6).
On the other hand, the different immunoglobulin (Ig) G subclasses significantly modulate antibody function and could be crucial for DSA pathogenicity. Indeed, each IgG subclass contributes differently to complement-dependent cytotoxicity (CDC) and antibody-dependent cellular cytotoxicity (ADCC). IgG3 displays the greatest potential for complement activation, followed by IgG1 (7). IgG2 and IgG4 show little or no binding to C1q and complement activation. Moreover, IgG3 and IgG1 have the best affinity for the FcγRIIIa activating receptor for natural killer cell-mediated ADCC (8).
Several research groups had studied the DSA subclass distribution with the Luminex test, and some of them found a correlation between IgG3 detection and poor outcome after renal transplantation (9, 10). However, this test might lack sensibility for IgG subclass detection, as suggested by the fact that any subclass was detected in only about of 20% of iDSA analyzed in these studies. Furthermore, the Luminex test does not allow quantifying the relative abundance of each IgG subclass.
Therefore, we developed an innovative mass spectrometry-based method to assess the relative IgG subclass composition of DSA after their capture on HLA Luminex beads. The aim of this study was to evaluate the distribution of the different DSA subclasses and their role in ABMR occurrence and severity.
Materials and Methods
Study Population
From 01/01/2014 to 01/03/2018, all patients who developed de novo DSA and had a kidney biopsy after kidney transplantation were prospectively enrolled at two French transplant centers (Montpellier Hospital and Bordeaux Hospital) (Figure 1). At both centers, routine anti-HLA DSA screening with a single antigen bead (SAB) assay (One Lambda, Canoga Park, CA) was performed at day 0, and then at month 3, month 12, and every year after transplant, and in the case of increased creatinine or proteinuria. All serum samples were pre-treated with EDTA to avoid the prozone effect (11, 12), and beads with a normalized MFI value >1,000 were considered positive. De novo DSA was defined as an antibody that was detected only after transplantation. For patients with multiple DSA, only the immunodominant DSA (iDSA), defined as the DSA with the highest MFI value, was considered for the subclass distribution analysis. Kidney biopsy was performed at the time of DSA detection, or of increased creatinine or proteinuria. Serum samples were prospectively collected for DSA subclass analysis at the time of kidney biopsy, and stored at −80°C. Patients with combined organ transplantation, ABO-incompatible kidney transplantation, and patients with DSA or positive CDC cross-match were excluded. The recipients' characteristics [age, sex, transplant number, blood type, initial nephropathy, immunosuppression, T cell-mediated rejection (TCMR) prior to DSA occurrence], kidney function at biopsy time, and the donors' characteristics were collected by reviewing the medical records. All enrolled patients gave their written informed consent for using their data for research purposes according to the Declaration of Helsinki (clinicaltrials.gov identifier: NCT04026087).
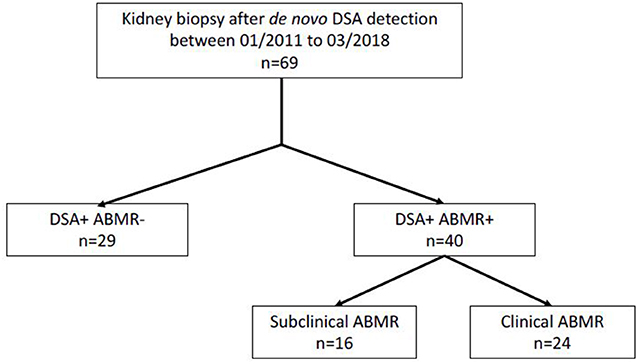
Figure 1. Study flow chart.
ABMR was diagnosed according to the last diagnostic criteria revised at the 2017 Banff Conference (13). C4d staining was assessed by immunochemistry (rabbit monoclonal anti-C4d antibody, clone A24-T, DB Biotec). Clinical AMBR was defined by an estimated glomerular filtration rate (eGFR) decline >20% (calculated with the MDRD formula) (14) or occurrence of proteinuria (proteinuria/creatininuria ratio >0.5 g/g) at the time of graft biopsy associated with ABMR histological criteria [C4d staining score; glomerulonephritis + peritubular capillaritis (g+ptc) score; intimal or transmural arteritis (v) score; tubulitis + interstitial inflammation (t+i) score; chronic glomerulopathy (cg) score; mesangial matrix expansion (mm) score, vascular fibrous intimal thickening (cv) score; interstitial fibrosis and tubular atrophy (IFTA) score]. Subclinical ABMR was defined by the presence of DSA and ABMR histological criteria, but without kidney dysfunction.
Characterization of Immunodominant DSA Subclasses
Isolation of Immunodominant DSA
Protein G affinity purification
Total IgG was purified from 500 μl of plasma by protein G-based affinity chromatography using the Nab Protein G Spin Kit (Thermofisher) according to the manufacturer's instructions. Samples were dialyzed with phosphate-buffered saline and concentrated using Amicon centrifugal filters (100 kDa cutoff) to a final IgG concentration of 10 mg/ml. IgG concentration was determined by measuring the absorbance at 280 nm on a Nanodrop spectrophotometer.
DSA IgG isolation using monospecific HLA luminex beads
DSA were isolated from total IgG using Luminex FlowPRA® single-antigen beads (One Lamda, Inc.). These beads, which are routinely used for DSA detection, are coated with a single HLA antigen. Each bead batch contain beads specific for nine different HLA antigens. First, beads that interacted with the DSA were sorted by flow cytometry (Facs ARIA, Becton Dickinson). Then, total IgG were incubated with the selected beads for 1 h, and beads were washed three times with ammonium bicarbonate buffer.
In parallel, the specific binding of DSA to HLA Luminex beads was controlled by flow cytometry, according to the manufacturer's instructions.
Quantification of the iDSA Subclasses
Sample preparation for mass spectrometry
Total IgG (10 μg) and DSA-specific IgG were resuspended in 200 mM Tris buffer, pH 8.6, with 8 M urea for denaturation. After cysteine reduction (incubation with 10 mM DTT and 100 mM NH4HCO3 at 55°C for 45 min) and protein alkylation (incubation with 55 mM iodoacetamide and 100 mM NH4HCO3 in the dark at room temperature for 30 min), samples were diluted four times with protease buffer. Trypsin (sequencing grade, Promega) was diluted in 100 mM NH4HCO3/5 mM CaCl2, to a final protease-to-substrate ratio of 1:20, and samples were digested at 37°C overnight. Trifluoroacetic acid concentration was adjusted to 0.05% in samples prior to desalting using Omix C18 tips (Agilent Technologies). The resulting peptides were dried under vacuum and stored at −20°C until analysis.
LC separation and MS/MS detection
The peptide mixtures were dissolved in 10 μl of 0.1% formic acid (FA), and loaded on an Ekspert 425 nanoLC system (Eksigent) equipped with a C18 column (Discovery BIO Wide Pore, Supelco). The mobile phases were solvent A (water, 0.1% FA) and B (acetonitrile, 0.1% FA). Injection was performed with 98% solvent A at a flow rate of 5 μl/min. Peptides were separated at 30°C with the following gradient: 2% to 40% B for 105 min, 40–80% B for 5 min. The column was washed with 80% solvent B for 5 min and equilibrated with 98% solvent A. Peptide separation was monitored online with the coupled TripleTOF 5600 mass spectrometer (Sciex). External calibration was performed using trypsin-digested beta-galactosidase (Sciex). The total ion chromatogram acquisition was made in information-dependent acquisition (IDA) mode using the Analyst TF v.1.7 software (Sciex). Positive ion profiling was performed from m/z 350–1,500, followed by a MS/MS product ion scan from m/z 100–1,500 with the abundance threshold set at more than 100 cps. The accumulation time for ions was set at 250 ms for MS scans, and 100 ms for MS/MS scans. Target ions were excluded from the scan for 10 s after detection. The IDA advanced “rolling collision energy (CE)” option was employed to automatically ramp up the CE value in the collision cell as the m/z value was increased. A maximum of 25 spectra were collected from candidate ions per cycle.
IgG sub-class relative quantification
Peptides and proteins were identified using the ProteinPilot software v.5.0 (Sciex). Each MS2 spectrum was searched against the UniProt/Swiss-Prot database using the following parameters: sample type: identification; cys alkylation: iodoacetamide; digestion: trypsin; instrument: TripleTOF 5600; special factors: urea denaturation; species: Homo sapiens; search effort: thorough; ID focus: biological modifications.
Among the available label-free quantification strategies, spectral counting, defined as the number of peptides assigned to a protein in an MS2 experiment, is a straightforward quantification method especially suitable for estimation of high abundance proteins (15).
Each IgG subclass was quantified using two unique proteotypic peptide sequences listed in Supplementary Table 1. Some of these sequences were previously selected for IgG subclass quantification studies by LC-MS in multiple reaction monitoring mode (16–18). Only proteotypic peptides identified with a confidence score ≥99 were retained. For each IgG subclass, the spectral count was determined. As the sequence SCDTPPPCPR is present, three times in the IgG3 heavy-chain backbone, counts for this sequence were divided by 3. To evaluate the relative abundance of each IgG subclass in a sample, spectral counts were normalized to the total sum of the spectral counts of all subclasses.
This choice was validated by the similar results obtained in two test samples using the recognized immunoturbidimetric method (Biomnis, Lyon, France) (data not shown).
Statistical Analysis
Normality was assessed with the Shapiro-Wilk test and graphically using quantile–quantile plots. Continuous variables were described as means (±SD) or medians [25th and 75th percentile] according to their distribution. Categorical variables were represented as proportions. The t-test, Wilcoxon test, chi-square, and Fisher's exact tests were used to compare groups, as appropriate. Receiver operating characteristic (ROC) curves were used to identify the IgG3 DSA and MFI cutoff values that best predicted ABMR, and the best possible cutoff was defined with the Youden Index ([sensitivity + specificity] – 1).
The relationship between ABMR and the different clinical and biological variables of interest was assessed by logistic regression analysis. The included variables were as follows: patient characteristics (sex, age, and transplant number), donor and graft characteristics (sex, age, donor origin, cold ischemia time, number of HLA mismatches, and delayed graft function), immunosuppressive treatment (induction therapy and therapy at biopsy time), eGFR, proteinuria/creatininuria ratio, DSA characteristics (number of DSA, sum of DSA MFI, iDSA MFI, and IgG3 DSA level: high vs. low). The relevant variables for ABMR prediction were identified by multivariable analysis with a stepwise backward elimination. Variables with a p < 0.2 were kept in the model.
GFR decline was defined by an eGFR decrease >25% or need of hemodialysis (graft loss). The eGFR decline-free survival rate was assessed with the Kaplan–Meier method, and compared among groups with the log-rank test. The eGFR decline-free survival rate was calculated from the date of kidney biopsy to the date of eGFR decrease or graft loss. Cox proportional-hazards models were used to estimate the hazard ratio (HR) and 95% confidence intervals (CI) for each studied variable: the previously described patient characteristics and immunological factors and also the histological characteristics according to the Banff 2017 criteria. Factors with a p < 0.20 were included in the multivariate Cox model.
p < 0.05 were considered significant. Analyses were performed using GraphPad Prism version 8.00 (GraphPad Software, La Jolla, CA, USA) and STATA version 12 (College Station, TX: StataCorp LP).
Results
Patients' Characteristics
From January 2014 to March 2018, de novo DSA antibodies were detected in 69 patients who underwent kidney biopsy in the two transplant centers. Forty patients had DSA with ABMR at biopsy time (DSA+/ABMR+ group), and 29 patients had DSA without ABMR (DSA+/ABMR– group) (Figure 1). Overall, the median interval between transplantation and DSA detection was 5.3 years and was longer in the DSA+/ABMR+ than in the DSA+/ABMR– group (7.5 vs. 4.0 years; p = 0.01). Similarly, immunosuppression at biopsy time, cold ischemic time, and proteinuria/creatininuria ratio were different in the two groups (Table 1). Patients in the DSA+/ABMR+ group took more frequently cyclosporine, had longer cold ischemic time (19.7 vs. 14.4 h, p = 0.01), and higher proteinuria/creatininuria ratio (0.36 vs. 0.19 g/g, p = 0.03). Conversely, eGFR at biopsy time was similar between groups.
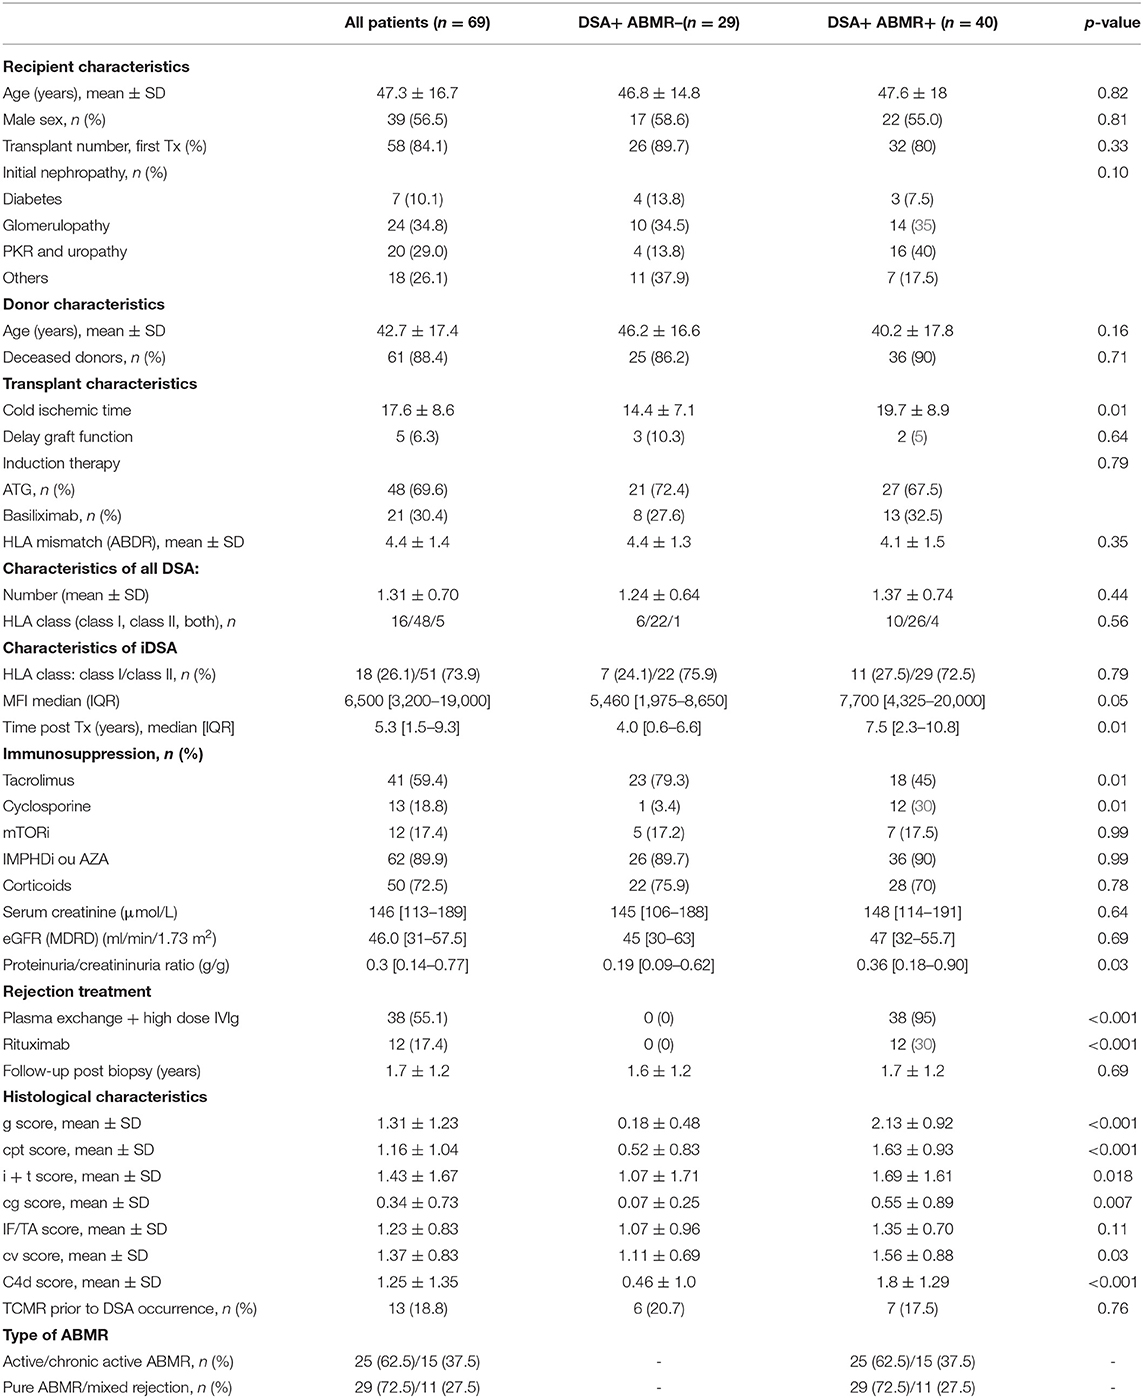
Table 1. Patient characteristics at biopsy time.
Multiple DSAs were detected in 15 patients with a mean DSA number of 1.31. DSA against class I HLA were detected in 23.2% of patients, DSA against class II HLA in 69.6% of patients, and against both class I and class II HLA in 7.2% of patients. The iDSA belonged to class I in 26.1% of patients and to class II in 73.9% of patients. These distributions were not significantly different between the DSA+/ABMR+ and DSA+/ABMR– groups (Table 1). Conversely, the median iDSA MFI value was higher in the DSA+/ABMR+ than in the DSA+/ABMR– group: 7,700 [4,325–20,000] vs. 5,460 [1,975–8,650], p = 0.05. Graft loss occurred in 13 patients (18.8%), and no patient died during the follow-up.
In the DSA+/ABMR+ group, 38 patients (95%) had at least five plasma exchange sessions followed by four infusions of high-dose IVIg (2 g/kg). Twelve patients (30%) received one perfusion of rituximab (375 mg/kg). Two patients did not receive any specific ABMR treatment, one because of severe graft function impairment and the other one because of active tuberculosis at the time of ABMR diagnosis. In the DSA+/ABMR– group, no patient received any specific treatment.
DSA Are Composed of all IgG Subclasses With a Specific Distribution
The IgG subclass distribution was analyzed in each iDSA and total IgG sample by mass spectrometry. The four IgG subclasses were detected in all iDSA and total IgG samples (Figure 2) but with different distributions. The proportion of IgG1 (62.7 vs. 58.2%, p = 0.016), IgG3 (6.6 vs. 4.9%, p < 0.0001), and IgG4 (4.2 vs. 2.0%, p < 0.0001) was higher, whereas that of IgG2 was lower (26.6 vs. 35.0%, p < 0.0001) in iDSA than in total IgG samples (Figure 2).
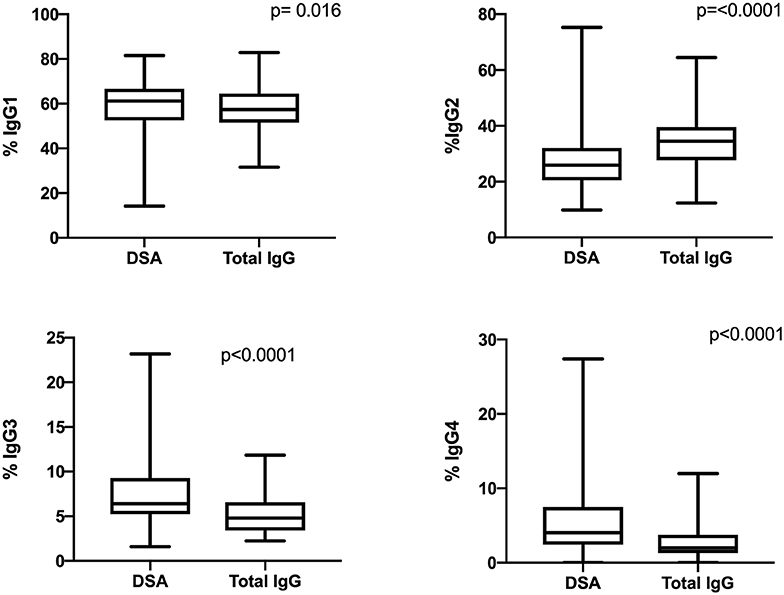
Figure 2. Comparison of the IgG subclass distribution in total IgG and iDSA samples from all patients.
Percentage of IgG3 iDSA Is Correlated With ABMR Occurrence and Severity
The percentage of IgG3 iDSA was significantly higher in the DSA+/ABMR+ compared to DSA+/ABMR– group: 8.4% [5.9–10.1] vs. 5.6% [5.1–6.4], respectively, p < 0.001 (Figure 3C). Conversely, the percentage of IgG1, IgG2, and IgG4 iDSA was comparable between groups (Figures 3A,B,D).
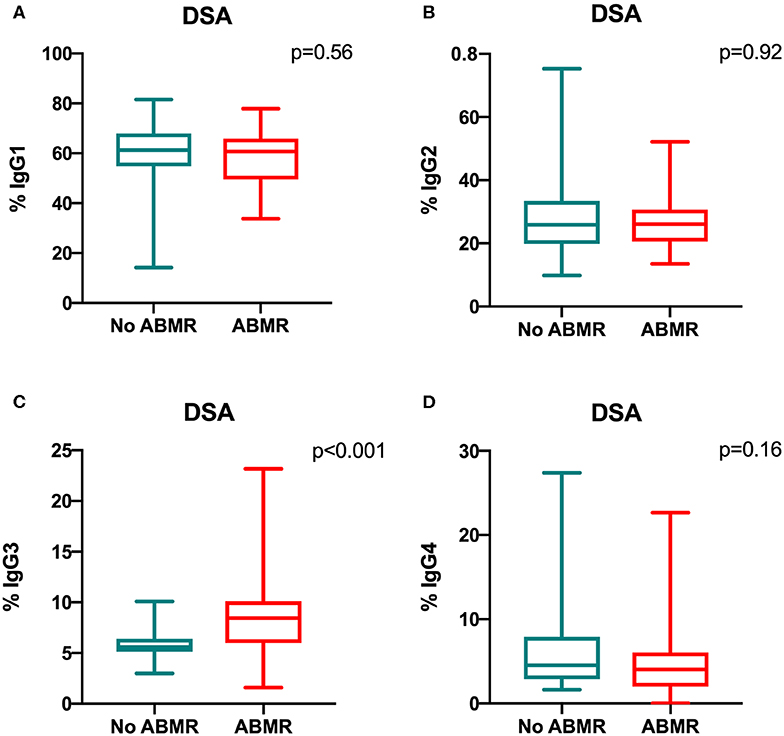
Figure 3. Comparison of the IgG subclass distribution in de novo iDSA isolated from DSA+/ABMR+ and DSA+/ABMR– patients. Proportion of IgG1 (A), IgG2 (B), IgG3 (C) and IgG4 (D) which composed iDSA in ABMR+ and ABMR− groups.
Moreover, the IgG3 iDSA percentage was significantly associated with ABMR severity. In the group DSA+/ABMR+, IgG3 iDSA level was higher when C4d was positive (8.9% [6.2–12.2] vs. 7.0% [4.5–9.1]) than when C4d was negative, p = 0.018 (Figure 4A). IgG3 level was also associated with the intensity of microvascular inflammation: 10.8% [7.4–16.7] in patients with g+ptc>4 vs. 7.6% [5.6–9.6] in patients with g+ptc ≤ 4, p = 0.022 (Figure 4B).
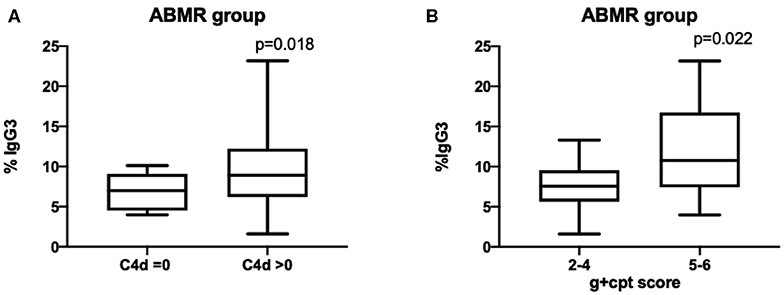
Figure 4. Percentage of IgG3 DSA is correlated with C4d deposition and microvascular inflammation scores.
Univariate and multivariate logistic regression analyses to identify patient and DSA characteristics associated with ABMR diagnosis (Table 2) indicated that high IgG3 iDSA level and proteinuria/creatininuria ratio were independent risk factors of ABMR (odds ratio [OR] = 11.15, 95% CI [2.24–55.37], p = 0.003, and OR = 5.18, 95% CI [1.14–23.48], p = 0.033, respectively).
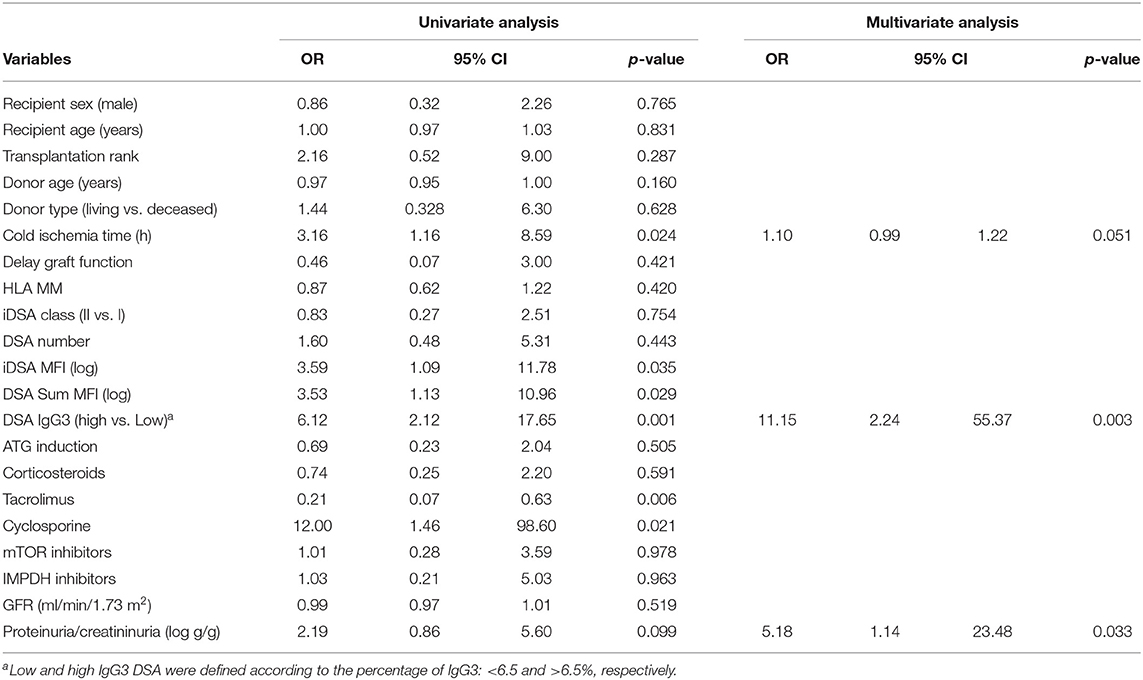
Table 2. Patients and DSA characteristics associated with ABMR.
Higher IgG3 iDSA Percentage Is Associated With Poorer Outcome
Patients were then divided into two sub-groups according to the IgG3 iDSA percentage: “Low IgG3” (patients with IgG3 <6.4%) and “High IgG3” (patients with IgG3>6.4%) and according to the iDSA MFI value: “Low MFI group” (patients with MFI <7,500) and “High MFI” (patients with MFI > 7,500). The cutoff values of 6.4% for IgG3 and 7,500 for MFI were determined based on the ROC curve analysis and corresponded to the most relevant values for ABMR prediction (Supplementary Figure 1). IgG3 percentage has shown a better AUC than MFI although not statistically significant (0.76 [0.61–0.86] vs. 0.62 [0.51–0.77], respectively, p = 0.3). Sensitivity and specificity were 72.5 and 72.4% for IgG3 and 62.5 and 62.1% for MFI, respectively.
Comparison of the characteristics of the Low IgG3 and High IgG3 groups (Table 3) showed higher g+ptc score (3.2 vs. 1.8, p = 0.006), cv score (1.8 vs. 1.0, p < 0.0001), C4d score (1.6 vs. 0.9, p = 0.048), and proteinuria/creatininuria ratio (0.41 vs. 0.25g/g, p = 0.05) in the High IgG3 compared with the Low IgG3 group. Conversely, iDSA class distribution, iDSA MFI value, and eGFR were similar between groups.
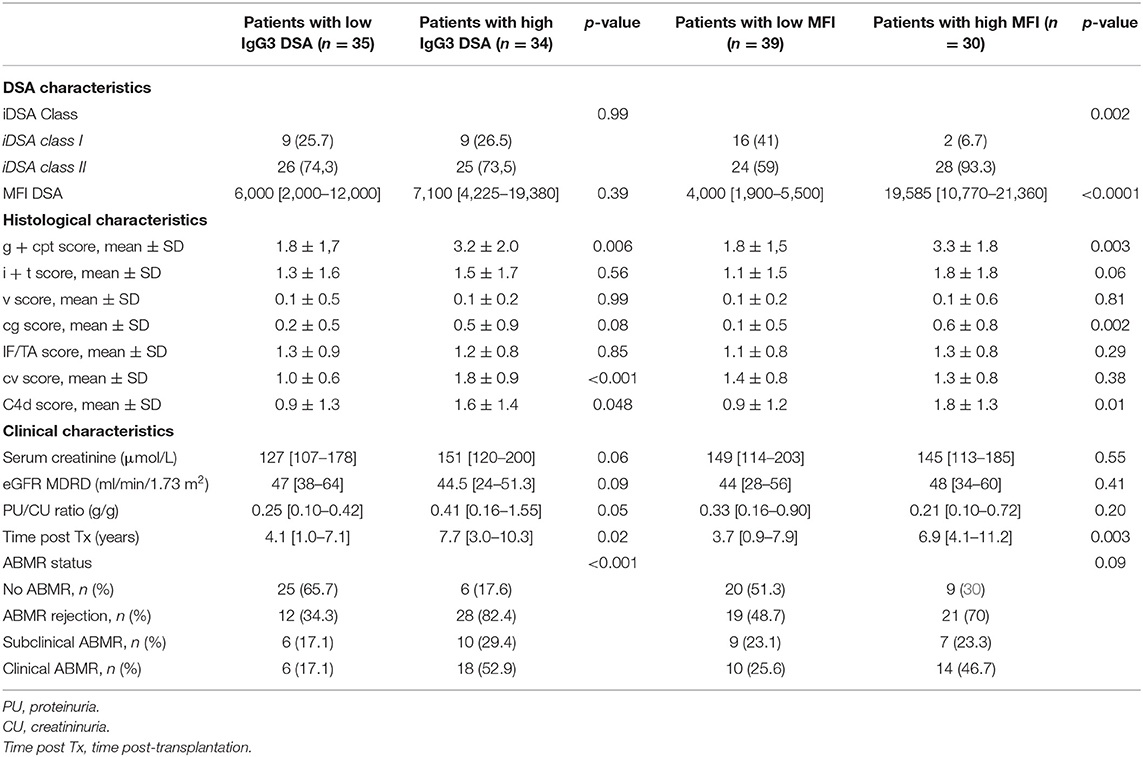
Table 3. Characteristics of the low and high IgG3 groups and low and high MFI groups at biopsy time.
Comparison of the characteristics of the Low and High MFI groups (Table 3) showed that the percentage of class II iDSA, g+ptc score (3.3 vs. 1.8, p = 0.003), cg score (0.6 vs. 0.1, p = 0.002), and C4d score (1.8 vs. 0.9, p = 0.01) were higher in the High than in the Low MFI group.
The eGFR decline-free survival rate was lower in the High than in the Low IgG3 group (Figure 5A, p = 0.001). At 1 year post-graft, eGFR decrease >25% was observed in 50% of patients in the High IgG3 group and in 11.4% of patients in the Low IgG3 group. The same analysis only in DSA+/ABMR+ patients showed again that high IgG3 iDSA was associated with higher risk of impaired renal function (Figure 5B, p = 0.01). Conversely, the eGFR decline-free survival rate was not significantly different in the Low and High MFI groups from the entire sample (Figure 5C) and from the DSA+/ABMR+ group (Figure 5D). Percentage of IgG1, IgG2, and IgG4 did not affect either eGFR decline >25%.
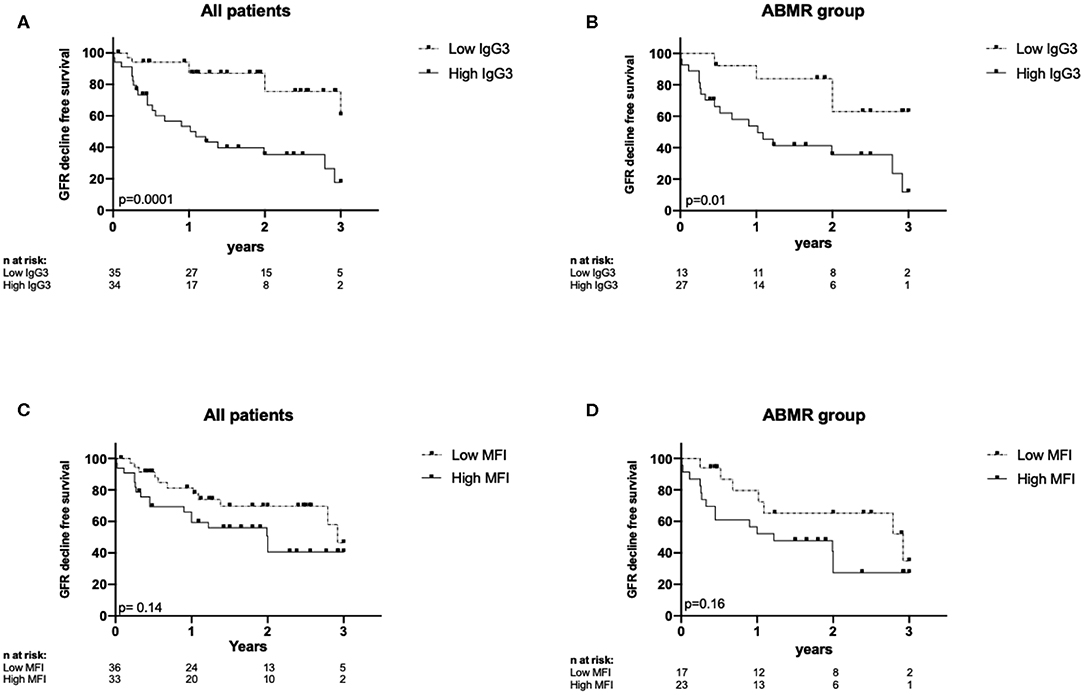
Figure 5. Kaplan-Meyer curves for eGFR decline-free survival according to IgG3 level in all patients (A) and in DSA+ABMR+ group (B), and according to MFI level in all patients (C) and in DSA+ABMR+ group (D).
Graft survival was not significantly different in the Low IgG3 and High IgG3 DSA groups and in the Low MFI and High MFI groups (data not shown). Finally, univariate and multivariate Cox regression analyses (Table 4) showed that high IgG3 iDSA (HR = 5.68, 95% CI [1.82–17.8], p = 0.003), low eGFR at time of biopsy (HR = 0.95, 95% CI [0.93–0.98], p = 0.002), and number of DSA (HR = 2.04, 95% CI [1.17–3.58], p = 0.013) were independent risk factors of eGFR decline >25%.
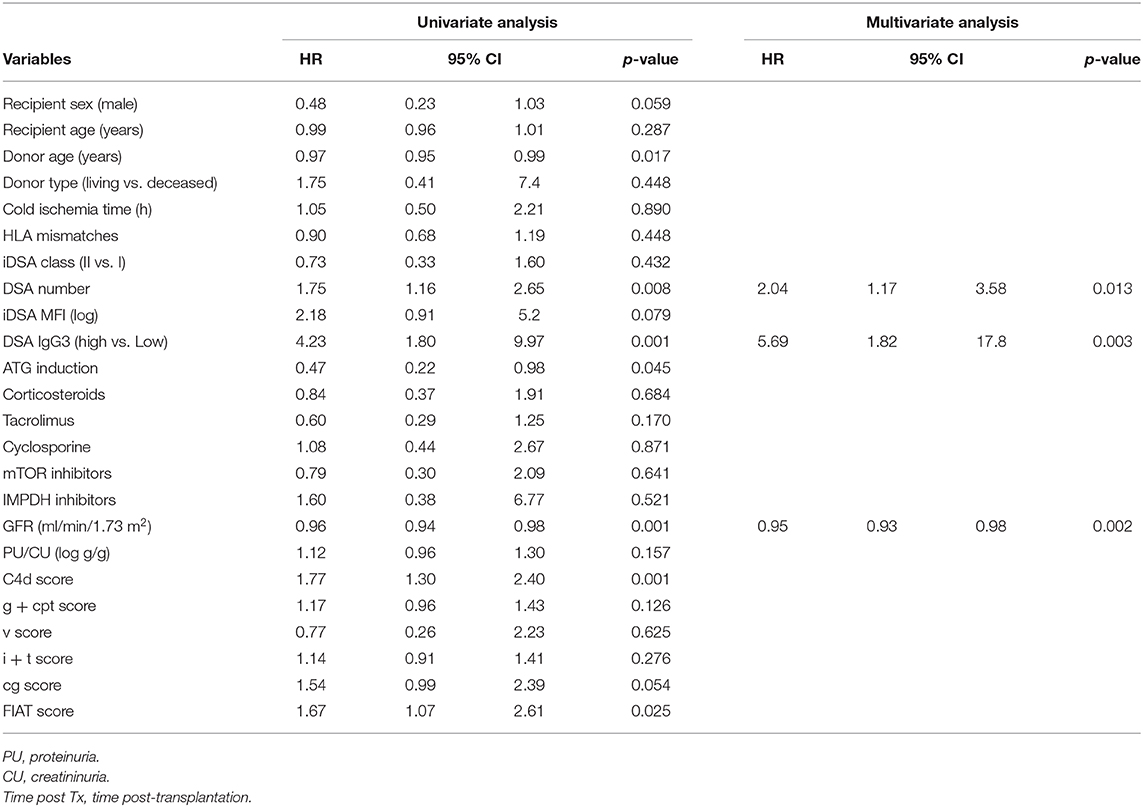
Table 4. Patients and DSA characteristics associated with GFR decline.
Discussion
Here, we assessed the distribution of the donor IgG subclasses by mass spectrometry after iDSA occurrence. We found for the first time that all de novo DSA were composed of all IgG subclasses and that higher percentage of IgG3 iDSA was correlated with ABMR occurrence and severity, and poorer graft outcome.
By using mass spectrometry after iDSA isolation, we detected the four IgG subclasses in each isolated iDSA. We demonstrated that the alloimmune response is always polyclonal. Contrary to Luminex technique, this innovative method not only detected the different IgG subclass, but also allowed their relative quantification. We found that IgG1 is the predominant DSA subclass (62.2% of the total IgG DSA), followed by IgG2 (23.1%), IgG3 (7.8%), and IgG4 (4.7%). Previous studies that analyzed the composition of DSA Ig subclasses and their impact on kidney transplantation outcome adapted the generic Luminex Single Antigen assay for DSA subclass detection by flow cytometry (9, 10, 19–21). They used secondary antibodies specific for the different IgG subclasses detection, and defined the presence of a subclass by an MFI value above a fixed cutoff. In this way, Lefaucheur et al. detected a single subclass in 31% of iDSA (mainly IgG1), two and three subclasses in 21% and 24% of iDSA, respectively, and the four subclasses only in 7% of iDSA (10). By using the Luminex IgG assay, any subclass was detected in 16% to 21% of iDSA, especially in iDSA with low MFI value (10, 20, 21). This suggests that this test lacks sensitivity for subclass detection. Moreover, cross-reactivity of secondary antibodies could be observed when they are not fully specific for one subclass. However, this non-specific reactivity seems to have not exceeded 5% of the binding (22).
Our study showed that the DSA class composition is antigen-specific and that IgG subclass distribution is different from that in total IgG. Indeed, the IgG1, IgG3, and IgG4 fractions were higher in the DSA antibody population than in total IgG. Immunoglobulin class switching is a complex mechanism that mainly depends on the antigen nature and the interaction between B cells and their environment. Polysaccharide and glycolipid antigens usually promote IgG2 production (23) and protein antigens mainly drive IgG1 and IgG3 production (24). On the other hand, chronic antigen exposure leads to IgG4 production (25). The B-cell microenvironment is also involved in class switching. Class switching typically occurs following interaction with CD4+ T cells via the receptors CD40–CD40L and cytokines (26, 27). Avery et al. elegantly showed that IL-4 induces the switch to IgG1 in CD40L-stimulated human naive B cells, whereas IL-21 mainly induces IgG3 production (28). High percentage of IgG1 and IgG3 could easily be explained by a T-dependent alloantigen presentation after kidney transplantation. Moreover, high IgG4 percentage is not surprising in a context of chronic antigen exposure, as observed in patients who underwent kidney graft. However, the signals that control isotype switching are incompletely defined, and more studies are needed, particularly in the context of alloimmunization to improve ABMR understanding.
Several studies reported that detection of IgG3-iDSA with the Luminex test is associated with higher ABMR risk after transplantation of kidney and also of other organs, particularly liver (10, 20, 29–31). Lefaucheur et al. detected IgG3 in 23% of iDSA, and their presence was associated with ABMR and poorer graft outcome (10). Our results confirmed IgG3's deleterious role and also highlighted the predominant role of IgG3 relative proportion in ABMR risk. Indeed, our technique allowed comparing the relative proportion of each iDSA subclass and showing that ABMR was associated with iDSA IgG3 > 6.4%, independently of the other subclass distribution.
IgG1 and IgG3 are known to activate the classical complement pathway, and IgG3 display the best ability to bind to and activate the complement cascade (7). In agreement, the percentage of IgG3 iDSA was associated with C4d-positive ABMR and with eGFR decline in our study. Conversely, IgG1 percentage was similar in DSA+/ABMR+ and DSA+/ABMR– patients. Moreover, the IgG subclass affects also the affinity for FcγRIIIa and the capacity for natural killer cell recruitment (8). IgG3 is the subclass with the most affinity for this receptor, and we found a correlation between the inflammatory microvascular lesions and IgG3 percentage.
Finally, we found that high MFI was a risk factor for ABMR, as previously reported (5, 32–34). However, MFI value was not correlated with the IgG3 level. In our multivariate analysis, the only three factors associated with GFR decline were eGFR at diagnosis, number of DSA, and high IgG3 percentage. While high IgG3 percentage was associated with ABMR occurrence and histological severity and also with eGFR decline, the difference in graft survival was not statistically significant between the High and Low IgG3 groups. This is explained by limited number of graft losses (18.8%) in a relatively short follow-up period (mean: 1.7 years). In previous studies, the median time to graft loss after ABMR diagnosis was >5 years (35).
Our work has some limitations. First, we did not monitor the iDSA subclass distribution at different times during the follow-up, but only at the time of kidney biopsy after DSA occurrence. Therefore, we do not know whether the iDSA subclass proportions vary over time, and whether changes are influenced by ABMR treatment. Second, we focused only on de novo DSA. As the therapeutic management and clinical course after pre-formed DSA and de novo DSA are not similar (36), our results cannot be extrapolated to patients with pre-formed DSA. Moreover, we did not analyze iDSA with the C1q or C3d Luminex assays, which would have allowed comparing the percentage of IgG3 in mass spectrometry and DSA ability to fix complement in vitro. However, the routine use of C1q/C3d Luminex assays to better predict rejection and graft loss remains controversial (37, 38). Finally, our mass spectrometry-based technique is relatively complex, although it brings useful information to understand ABMR mechanism.
In conclusion, we reported for the first time that de novo DSA are polyclonal antibodies always composed of the four IgG subclasses, and that the IgG3 proportion is crucial for their pathogenicity. High IgG3 percentage is associated with ABMR occurrence and severity and with higher risk of eGFR decline. Better knowledge of the mechanism implicated in class switching of DSA may lead to the development of new therapeutic approaches in ABMR.
Data Availability Statement
The datasets generated for this study are available on request to the corresponding author.
Ethics Statement
The studies involving human participants were reviewed and approved by CPP Ile de France V. The patients/participants provided their written informed consent to participate in this study.
Author Contributions
VP and ML designed the study, analyzed the data, and wrote the paper. IS performed the statistical analyses. CL, AB, and NB reviewed the paper. VP, NB, CS, and EP-G performed the experiments. NB and CL participated in data analysis. All authors had reviewed the paper and provided final approval of the version to be published.
Funding
A funding was provided by Montpellier University Hospital for this study (AOI 2018).
Conflict of Interest
The authors declare that the research was conducted in the absence of any commercial or financial relationships that could be construed as a potential conflict of interest.
Acknowledgments
The authors thank Montpellier Hospital for providing financial support for this work (AOI 2018—clinicaltrials.gov identifier: NCT04026087). We also thank the imaging platform “Montpellier Ressources Imagerie (MRI)” and Dr. DUPERRAY Christophe and Dr. ANDERMARCHER Elisabetta for their contributions and logistical supports.
Supplementary Material
The Supplementary Material for this article can be found online at: https://www.frontiersin.org/articles/10.3389/fimmu.2020.00919/full#supplementary-material
References
1. Sellarés J, de Freitas DG, Mengel M, Reeve J, Einecke G, Sis B, et al. Understanding the causes of kidney transplant failure: the dominant role of antibody-mediated rejection and nonadherence. Am J Transplant. (2012) 12:388–99. doi: 10.1111/j.1600-6143.2011.03840.x
2. Stegall MD, Chedid MF, Cornell LD. The role of complement in antibody-mediated rejection in kidney transplantation. Nat Rev Nephrol. (2012) 8:670–8. doi: 10.1038/nrneph.2012.212
3. Everly MJ, Rebellato LM, Haisch CE, Ozawa M, Parker K, Briley KP, et al. Incidence and impact of de novo donor-specific alloantibody in primary renal allografts. Transplantation. (2013) 95:410–7. doi: 10.1097/TP.0b013e31827d62e3
4. Wiebe C, Gibson IW, Blydt-Hansen TD, Karpinski M, Ho J, Storsley LJ, et al. Evolution and clinical pathologic correlations of de novo donor-specific HLA antibody post kidney transplant. Am J Transplant. (2012) 12:1157–67. doi: 10.1111/j.1600-6143.2012.04013.x
5. Lefaucheur C, Loupy A, Hill GS, Andrade J, Nochy D, Antoine C, et al. Preexisting donor-specific HLA antibodies predict outcome in kidney transplantation. J Am Soc Nephrol. (2010) 21:1398–406. doi: 10.1681/ASN.2009101065
6. Loupy A, Lefaucheur C, Vernerey D, Prugger C, Duong van Huyen JP, Mooney N, et al. Complement-binding anti-HLA antibodies and kidney-allograft survival. N Engl J Med. (2013) 369:1215–26. doi: 10.1056/NEJMoa1302506
7. Michaelsen TE, Garred P, Aase A. Human IgG subclass pattern of inducing complement-mediated cytolysis depends on antigen concentration and to a lesser extent on epitope patchiness, antibody affinity and complement concentration. Eur J Immunol. (1991) 21:11–16. doi: 10.1002/eji.1830210103
8. Bruhns P, Iannascoli B, England P, Mancardi DA, Fernandez N, Jorieux S, et al. Specificity and affinity of human Fcgamma receptors and their polymorphic variants for human IgG subclasses. Blood. (2009) 113:3716–25. doi: 10.1182/blood-2008-09-179754
9. Hönger G, Hopfer H, Arnold ML, Spriewald BM, Schaub S, Amico P. Pretransplant IgG subclasses of donor-specific human leukocyte antigen antibodies and development of antibody-mediated rejection. Transplantation. (2011) 92:41–7. doi: 10.1097/TP.0b013e31821cdf0d
10. Lefaucheur C, Viglietti D, Bentlejewski C, Duong van Huyen JP, Vernerey D, Aubert O, et al. IgG donor-specific anti-human HLA antibody subclasses and kidney allograft antibody-mediated injury. J Am Soc Nephrol. (2016) 27:293–304. doi: 10.1681/ASN.2014111120
11. Schnaidt M, Weinstock C, Jurisic M, Schmid-Horch B, Ender A, Wernet D. HLA antibody specification using single-antigen beads, a technical solution for the prozone effect. Transplantation. (2011) 92:510–5. doi: 10.1097/TP.0b013e31822872dd
12. Visentin J, Vigata M, Daburon S, Contin-Bordes C, Fremeaux-Bacchi V, Dromer C, et al. Deciphering complement interference in anti-human leukocyte antigen antibody detection with flow beads assays. Transplantation. (2014) 98:625–31. doi: 10.1097/TP.0000000000000315
13. Haas M, Loupy A, Lefaucheur C, Roufosse C, Glotz D, Seron D, et al. The banff 2017 kidney meeting report: revised diagnostic criteria for chronic active T cell-mediated rejection, antibody-mediated rejection, and prospects for integrative endpoints for next-generation clinical trials. Am J Transplant. (2018) 18:293–307. doi: 10.1111/ajt.14625
14. Levey AS, Bosch JP, Lewis JB, Greene T, Rogers N, Roth D. A more accurate method to estimate glomerular filtration rate from serum creatinine: a new prediction equation. Modification of diet in renal disease study group. Ann Intern Med. (1999) 130:461–70. doi: 10.7326/0003-4819-130-6-199903160-00002
15. Dowle AA, Wilson J, Thomas JR. Comparing the diagnostic classification accuracy of iTRAQ, peak-area, spectral-counting, and emPAI methods for relative quantification in expression proteomics. J Proteome Res. (2016) 15:3550–62. doi: 10.1021/acs.jproteome.6b00308
16. Ladwig PM, Barnidge DR, Snyder MR, Katzmann JA, Murray DL. Quantification of serum IgG subclasses by use of subclass-specific tryptic peptides and liquid chromatography–tandem mass spectrometry. Clin Chem. (2014) 60:1080–8. doi: 10.1373/clinchem.2014.222208
17. Miyamoto S, Stroble CD, Taylor S, Hong Q, Lebrilla CB, Leiserowitz GS, et al. Multiple reaction monitoring for the quantitation of serum protein glycosylation profiles: application to ovarian cancer. J Proteome Res. (2018) 17:222–33. doi: 10.1021/acs.jproteome.7b00541
18. Yuan W, Sanda M, Wu J, Koomen J, Goldman R. Quantitative analysis of immunoglobulin subclasses and subclass specific glycosylation by LC-MS-MRM in liver disease. J Proteomics. (2015) 116:24–33. doi: 10.1016/j.jprot.2014.12.020
19. Freitas MC, Rebellato LM, Ozawa M, Nguyen A, Sasaki N, Everly M, et al. The role of immunoglobulin-G subclasses and C1q in de novo HLA-DQ donor-specific antibody kidney transplantation outcomes. Transplantation. (2013) 95:1113–9. doi: 10.1097/TP.0b013e3182888db6
20. Khovanova N, Daga S, Shaikhina T, Krishnan N, Jones J, Zehnder D, et al. Subclass analysis of donor HLA-specific IgG in antibody-incompatible renal transplantation reveals a significant association of IgG4 with rejection and graft failure. Transpl Int. (2015) 28:1405–15. doi: 10.1111/tri.12648
21. Hamdani G, Goebel JW, Brailey P, Portwood EA, Hooper DK, Girnita AL. IgG3 anti-HLA donor-specific antibodies and graft function in pediatric kidney transplant recipients. Pediatr Transplant. (2018) 22:e13219. doi: 10.1111/petr.13219
22. Lowe D, Higgins R, Zehnder D, Briggs DC. Significant IgG subclass heterogeneity in HLA-specific antibodies: Implications for pathogenicity, prognosis, and the rejection response. Hum Immunol. (2013) 74:666–72. doi: 10.1016/j.humimm.2013.01.008
23. Siber GR, Schur PH, Aisenberg AC, Weitzman SA, Schiffman G. Correlation between serum IgG-2 concentrations and the antibody response to bacterial polysaccharide antigens. N Engl J Med. (1980) 303:178–82. doi: 10.1056/NEJM198007243030402
25. Aalberse RC, van der Gaag R, van Leeuwen J. Serologic aspects of IgG4 antibodies. Prolonged immunization results in an IgG4-restricted response. J Immunol. (1983) 130:722–6.
26. Aversa G, Punnonen J, Carballido JM, Cocks BG, de Vries JE. CD40 ligand-CD40 interaction in Ig isotype switching in mature and immature human B cells. Semin Immunol. (1994) 6:295–301. doi: 10.1006/smim.1994.1038
27. Coffman RL, Lebman DA, Rothman P. Mechanism and regulation of immunoglobulin isotype switching. Adv Immunol. (1993) 54:229–70. doi: 10.1016/S0065-2776(08)60536-2
28. Avery DT, Bryant VL, Ma CS, de Waal Malefyt R, Tangye SG. IL-21-induced isotype switching to IgG and IgA by human naive B cells is differentially regulated by IL-4. J Immunol. (2008) 181:1767–79. doi: 10.4049/jimmunol.181.3.1767
29. Everly MJ, Rebellato LM, Haisch CE, Briley KP, Bolin P, Kendrick WT, et al. Impact of IgM and IgG3 anti-HLA alloantibodies in primary renal allograft recipients. Transplantation. (2014) 97:494–501. doi: 10.1097/01.TP.0000441362.11232.48
30. Kaneku H, O'Leary JG, Taniguchi M, Susskind BM, Terasaki PI, Klintmalm GB. Donor-specific human leukocyte antigen antibodies of the immunoglobulin G3 subclass are associated with chronic rejection and graft loss after liver transplantation. Liver Transplant. (2012) 18:884–892. doi: 10.1002/lt.23451
31. O'Leary JG, Kaneku H, Banuelos N, Jennings LW, Klintmalm GB, Terasaki PI. Impact of IgG3 subclass and C1q-fixing donor-specific HLA alloantibodies on rejection and survival in liver transplantation. Am J Transplant. (2015) 15:1003–13. doi: 10.1111/ajt.13153
32. Schinstock CA, Cosio F, Cheungpasitporn W, Dadhania DM, Everly MJ, Samaniego-Picota MD, et al. The value of protocol biopsies to identify patients with de novo donor-specific antibody at high risk for allograft loss. Am J Transplant. (2017) 17:1574–84. doi: 10.1111/ajt.14161
33. Kwon H, Kim YH, Choi JY, Shin S, Jung JH, Park SK, et al. Impact of pretransplant donor-specific antibodies on kidney allograft recipients with negative flow cytometry cross-matches. Clin Transplant. (2018) 32:e13266. doi: 10.1111/ctr.13266
34. de Castro MCR, Barbosa EA, Souza RP, et al. The kinetics of anti-hla antibodies in the first year after kidney transplantation: in whom and when should they be monitored? J Transplant. (2018) 2018:8316860. doi: 10.1155/2018/8316860
35. Viglietti D, Loupy A, Aubert O, Bestard O, Duong Van Huyen JP, Taupin JL, et al. Dynamic prognostic score to predict kidney allograft survival in patients with antibody-mediated rejection. J Am Soc Nephrol. (2018) 29:606–619. doi: 10.1681/ASN.2017070749
36. Aubert O, Loupy A, Hidalgo L, Duong van Huyen JP, Higgins S, Viglietti D, et al. Antibody-mediated rejection due to preexisting versus de novo donor-specific antibodies in kidney allograft recipients. J Am Soc Nephrol. (2017) 28:1912–23. doi: 10.1681/ASN.2016070797
37. Courant M, Visentin J, Linares G, Dubois V, Lepreux S, Guidicelli G, et al. The disappointing contribution of anti-human leukocyte antigen donor-specific antibodies characteristics for predicting allograft loss. Nephrol Dial Transplant. (2018) 33:1853–63. doi: 10.1093/ndt/gfy088
Keywords: de novo DSA, IgG subclass, antibody-mediated rejection, kidney transplantation, mass spectrometry
Citation: Pernin V, Beyze A, Szwarc I, Bec N, Salsac C, Perez-Garcia E, Mourad G, Merville P, Visentin J, Perrochia H, Larroque C, Couzi L and Le Quintrec M (2020) Distribution of de novo Donor-Specific Antibody Subclasses Quantified by Mass Spectrometry: High IgG3 Proportion Is Associated With Antibody-Mediated Rejection Occurrence and Severity. Front. Immunol. 11:919. doi: 10.3389/fimmu.2020.00919
Received: 02 January 2020; Accepted: 20 April 2020;
Published: 02 June 2020.
Edited by:
Frans H. J. Claas, Leiden University, NetherlandsReviewed by:
Christophe Picard, Établissement Français du Sang (EFS), FranceMark Haas, Cedars Sinai Medical Center, United States
Copyright © 2020 Pernin, Beyze, Szwarc, Bec, Salsac, Perez-Garcia, Mourad, Merville, Visentin, Perrochia, Larroque, Couzi and Le Quintrec. This is an open-access article distributed under the terms of the Creative Commons Attribution License (CC BY). The use, distribution or reproduction in other forums is permitted, provided the original author(s) and the copyright owner(s) are credited and that the original publication in this journal is cited, in accordance with accepted academic practice. No use, distribution or reproduction is permitted which does not comply with these terms.
*Correspondence: Vincent Pernin, di1wZXJuaW5AY2h1LW1vbnRwZWxsaWVyLmZy; Moglie Le Quintrec, bS1sZXF1aW50cmVjLWRvbm5ldHRlQGNodS1tb250cGVsbGllci5mcg==