 Yi-Na Liu1†
 Jie-Feng Yang1†Dai-Jia Huang1†
 Huan-He Ni1Chuan-Xia Zhang2Lin Zhang1Jia He3Jia-Mei Gu3Hong-Xia Chen1
 Hai-Qiang Mai1,4Qiu-Yan Chen1,4Xiao-Shi Zhang1,3
 Song Gao1,5*‡
 Jiang Li1,3,6*‡
- 1Collaborative Innovation Center for Cancer Medicine, State Key Laboratory of Oncology in South China, Guangzhou, China
- 2Key Laboratory of Gene Engineering of the Ministry of Education, State Key Laboratory of Biocontrol, School of Life Sciences, Sun Yat-sen University, Guangzhou, China
- 3Department of Biotherapy, Sun Yat-sen University Cancer Center, Guangzhou, China
- 4Department of Nasopharyngeal Carcinoma, Sun Yat-sen University Cancer Center, Guangzhou, China
- 5Guangzhou Regenerative Medicine and Health Guangdong Laboratory, Guangzhou, China
- 6Department of Research and Development, Shenzhen Institute for Innovation and Translational Medicine, Shenzhen International Biological Valley-Life Science Industrial Park, Shenzhen, China
T cell exhaustion is an obstacle to immunotherapy for solid tumors. An understanding of the mechanism by which T cells develop this phenotype in solid tumors is needed. Here, hypoxia, a feature of the tumor microenvironment, causes T cell exhaustion (TExh) by inducing a mitochondrial defect. Upon exposure to hypoxia, activated T cells with a TExh phenotype are characterized by mitochondrial fragmentation, decreased ATP production, and decreased mitochondrial oxidative phosphorylation activity. The TExh phenotype is correlated with the downregulation of the mitochondrial fusion protein mitofusin 1 (MFN1) and upregulation of miR-24. Overexpression of miR-24 alters the transcription of many metabolism-related genes including its target genes MYC and fibroblast growth factor 11 (FGF11). Downregulation of MYC and FGF11 induces TExh differentiation, reduced ATP production and a loss of the mitochondrial mass in T cell receptor (TCR)-stimulated T cells. In addition, we determined that MYC regulates the transcription of FGF11 and MFN1. In nasopharyngeal carcinoma (NPC) tissues, the T cells exhibit an increased frequency of exhaustion and loss of mitochondrial mass. In addition, inhibition of miR-24 signaling decreases NPC xenograft growth in nude mice. Our findings reveal a mechanism for T cell exhaustion in the tumor environment and provide potential strategies that target mitochondrial metabolism for cancer immunotherapy.
Introduction
T cell exhaustion, which is characterized by progressive decreases in proliferation, cytokine production, and cytotoxic capabilities, is an acquired state of T cell dysfunction and a hallmark of cancer and chronic viral infections (1). During chronic viral infections, high antigen loads induce the T cell exhaustion (TExh) phenotype (2). However, the mechanism by which T cells develop an exhaustion phenotype in human cancers is not completely understood, although the tumor microenvironment (TME) and intrinsic programmed cell death protein 1 (PD-1) and extrinsic immunoregulatory cytokine negative regulatory pathways are considered important factors (3). Immunotherapies based on checkpoint inhibition or chimeric antigen receptor (CAR) T cells that aim to reverse TExh in cancers by targeting negative regulatory pathways have been strikingly effective (4, 5). Nevertheless, the majority of patients, particularly those suffering from solid tumors, fail to benefit from these therapies. This failure is partly due to the adverse effect of the TME on the function of tumor-infiltrating lymphocytes (TILs) (6, 7). Thus, identification of the mechanisms underlying the development of the TME-induced TExh phenotype in solid tumors is necessary.
Hypoxia is a prominent feature of the TME in solid tumors and is considered a major factor driving adaptation toward host immunosurveillance evasion (8, 9). Although the exact mechanism remains unclear, hypoxic stress is thought to impede immune cell functions by inducing the expression and production of immunosuppressive molecules and metabolites in tumor cells (10, 11). We previously reported that hypoxia induces the enrichment of miR-24 in nasopharyngeal carcinoma (NPC) cells and NPC-derived exosomes and thereby disrupts the activity of T cells (12). In tumor cells, hypoxia triggers angiogenesis, the epithelial–mesenchymal transition (EMT) and metabolic reprogramming in addition to immune modulation (9, 13, 14). However, the direct response of human TILs to hypoxic stress and the relationship between hypoxia and TExh remain to be elucidated.
T cell fate is closely related to metabolic conditions. T cell activation occurs concomitantly with the engagement of aerobic glycolysis and induces increases in mitochondrial oxidative phosphorylation (OXPHOS) activity (15). Competition with cancer cells in the TME leads to metabolic dysregulation of TILs, which is a hallmark of the TExh phenotype and is often coupled with mitochondrial deficiencies (16, 17). T cells rapidly lose mitochondrial mass upon entering malignant tissues. In most eukaryotic cells, mitochondria undergo regulated and frequent fusion and fission processes. Fusion contributes to the formation of a healthy mitochondrial network and promotes OXPHOS activity. It is unclear whether impairment of mitochondrial dynamics, as reflected by imbalance between fusion and fission processes, is involved in the development of the TExh phenotype (18). The dynamin-like GTPases mitofusin 1 and mitofusin 2 (MFN1 and MFN2, respectively) initiate mitochondrial fusion by catalyzing the tethering and merging of outer membranes. Depletion of MFN1/2 leads to mitochondrial fragmentation and ultimately to mitochondrial dysfunction (19–21). In this study, we show that impairment of mitochondrial dynamics is closely associated with the exhaustion of both hypoxia-treated T cells and patient-derived TILs and that the exhaustion phenotype is induced through the miR-24-MYC-MFN1 axis. These data establish a new pathway for the direct induction of the TExh phenotype by hypoxia through the regulation of mitochondrial dynamics and provide novel strategies for the development of effective immunotherapeutic approaches.
Materials and Methods
Sample Collection, T Cell Culture, and Exosome Isolation
Fresh tumor specimens and peripheral blood samples were collected from 10 NPC patients at the time of their first diagnosis at Sun Yat-sen University (SYSU) Cancer Center, Guangzhou, China, in 2015. The detailed clinical data are summarized in Supplementary Table 1. Ten age-matched healthy donors (HDs) were included in this study. This study was conducted in accordance with the Declaration of Helsinki. All the patients and HDs provided written consent. The study was approved by the Research Ethics Committee of SYSU Cancer Center (GZR2013-040).
For isolation of TILs, biopsied NPC tissues were minced into small pieces and digested with collagenase type IV (0.1 μg/ml) for 2 h. The protocol for TIL culture is described in detail in Supplemental Experimental Procedures.
Reagents and Antibodies
Detailed information about the antibodies used in this study is provided in Supplementary Table 2.
Plasmid Construction, Lentivirus Production and Transduction
miR-24 (HmiR0146-MR03), scrambled control (CmiR0001-MR03), miR-24 sponge (HmiR-AN0349-AM03), scrambled sponge control (CmiR-AN0001-AM03), scrambled control short hairpin RNA (shRNA) (shControl), MYC-specific shRNA (shMYC), and FGF11-specific shRNA (shFGF11, HSH067396-3-LVRU6MP) sequences were separately cloned into lentivectors (GeneCopoeia). This protocol is described in detail in Supplemental Experimental Procedures.
T Cell Proliferation and Differentiation Assay
This protocol is described in detail in Supplemental Experimental Procedures.
RNA Sequencing (RNA-Seq) and Analysis
This protocol is described in detail in Supplemental Experimental Procedures. The RNA-seq data have been deposited in the NCBI Gene Expression Omnibus (GEO) under the Accession Code GSE110523.
Real-Time RT-qPCR and Immunoblotting
This protocol is described in detail in Supplemental Experimental Procedures.
Determination of Cell Viability
A CellTiter-Glo® Luminescent Cell Viability assay was used to determine the number of viable cells in culture based on the quantification of ATP produced in the cell culture supernatant after 48, 72, and 96 h under different treatment conditions. CellTiter-Glo® reagent (100 μl) and cell culture supernatant (100 μl) were added to each well of a 96-well plate, mixed for 2 min on an orbital shaker, and incubated at room temperature for 10 min to stabilize the luminescent signal. Cell luminescence was detected using a Tecan Spark™ 10 M microplate reader.
Metabolism Measurements
Twenty-four-well XF cell culture microplates were coated with 0.1 mg/ml poly-D-lysine (Sigma-Aldrich) and then washed with PBS (phosphate-buffered saline). The extracellular acidification rate (ECAR) and oxygen consumption rate (OCR) were detected using a 24-well XF or XFe extracellular flux analyzer. For the ECAR assays, the cells (2 × 10⁵) were plated in assay medium (XF Base Medium containing 2 mM L-glutamine) supplemented with 10 mM glucose, 1 μM oligomycin (Seahorse Bioscience), and 50 mM 2-deoxy-D-glucose (2-DG) (Sigma-Aldrich) under basal conditions. For the OCR assays, cells (2 × 10⁵) were plated in assay medium (XF Base Medium containing 10 mM glucose, 2 mM L-glutamine, and 1 mM sodium pyruvate) under basal conditions and stimulated with 1 μM oligomycin, 1.0 μM fluoro-carbonyl cyanide phenylhydrazone (FCCP), and 0.5 μM rotenone/antimycin A according to the manufacturer's instructions and our previous study (22).
Mitochondrial Staining and Microscopic Observation
This protocol is described in detail in Supplemental Experimental Procedures.
Electron Microscopy
Tumor tissues from NPC patients were fixed, sectioned, stained, and coated at the SYSU Electron Microscopy core facility. The images were visualized using FEI Tecnai transmission electron microscopes.
Luciferase Reporter Assay
This protocol is described in detail in Supplemental Experimental Procedures.
Xenograft Mouse Model
All animal experiments were performed in accordance with protocols approved by the Institutional Animal Care and Use Committee of SYSU, Guangzhou, China (L102012018060P). The in vivo experiments were performed using 4-week-old female nude athymic mice (BALB/c-nu/nu, Harlan). Briefly, 2 × 10⁵ CNE2 cells resuspended in 100 μl of PBS were injected intravenously into the tail vein. After 1 week of in vitro pretreatment under different conditions for 1 week, TILs (4 × 10⁵ and 1.2 × 10⁶ cells) from NPC patients were injected intravenously after tumor challenge and every 2 weeks thereafter. The in vivo treatment conditions for the TILs are described below. First, 1 × 10⁶ TILs were plated in an anti-CD3 antibody (OKT3)-coated 24-well plate and transfected with lenti-sponge-control (group 2 [G2]), lenti-miR-24-sponge (group 3 [G3]), lenti-shMYC (group 4 [G4]), or lenti-shMYC + 10 μM Mdivi-1 (a mitochondrial fission inhibitor) + 25 μM bezafibrate (group 5 [G5]) for three days. A xenograft + PBS group (group 1 [G1]) was included as a control. The cells were then harvested for injection into the mice. The mice were sacrificed 3 weeks after the last treatment. Their lungs were removed and weighed, and tumor nodes visible to the naked eye were counted. For pathological examination, the lungs were fixed with formalin, embedded in paraffin, sectioned consecutively at a thickness of 4 μm, and stained with hematoxylin and eosin (H&E). The tumor nodes in each field were counted under a microscope at 10x magnification. All mouse experiments were performed with groups of five to six mice (the exact numbers are specified in the figure legends). The mice were randomly grouped into the treatment or corresponding control groups, and the operators were blinded to the group assignments.
Statistical Analysis
This protocol is described in detail in Supplemental Experimental Procedures.
Results
Hypoxia Induces the TExh Phenotype and Alters Mitochondrial Metabolism and Dynamics in T Cells
Hypoxia subverts the immune system and promotes tumorigenesis (23, 24). However, the direct effects of hypoxia on tumor-infiltrated T cells have not been fully elucidated. To explore this issue, we first investigated the differences in activated T cells under normoxic vs. hypoxic conditions in vitro. T cells were activated with a well-established system in which an anti-CD3 antibody (OKT3) was used to mimic the human TCR-mediated signal. Compared with normoxia-treated cells, activated T cells exposed to hypoxia for 48 h showed increased expression of hypoxia-inducible factor 1 alpha (HIF-1α) (Supplementary Figures 1A,B), CD39, PD-1, and TIM-3, but decreased secretion of the effector cytokines interferon-gamma (IFN-γ) and granzyme B (GrB) (Figures 1A,B). Importantly, hypoxia suppressed the proliferation of activated T cells, including both CD4+ and CD8+ T cells (Figure 1C). Accordingly, fewer mitochondria and decreased TOMM20 (translocase of outer mitochondrial membrane 20 homolog) expression were observed in OKT3-activated T cells exposed to hypoxic stress than in T cells exposed to normoxic condition (Figure 1D). Hypoxia also reduced total ATP production by activated T cells (Figure 1E). To understand the metabolic properties of these activated T cells, we measured their ECARs and OCRs as indicators of aerobic glycolysis and OXPHOS activity, respectively. Both the ECAR and OCR values were substantially lower in T cells under hypoxia than in T cells under normoxia. (Figures 1F,G). Under hypoxic conditions, the expression of glycolysis-related enzymes was markedly increased (Supplementary Figure 1C). These data suggest that hypoxia induces the TExh phenotype and mitochondrial dysfunction.
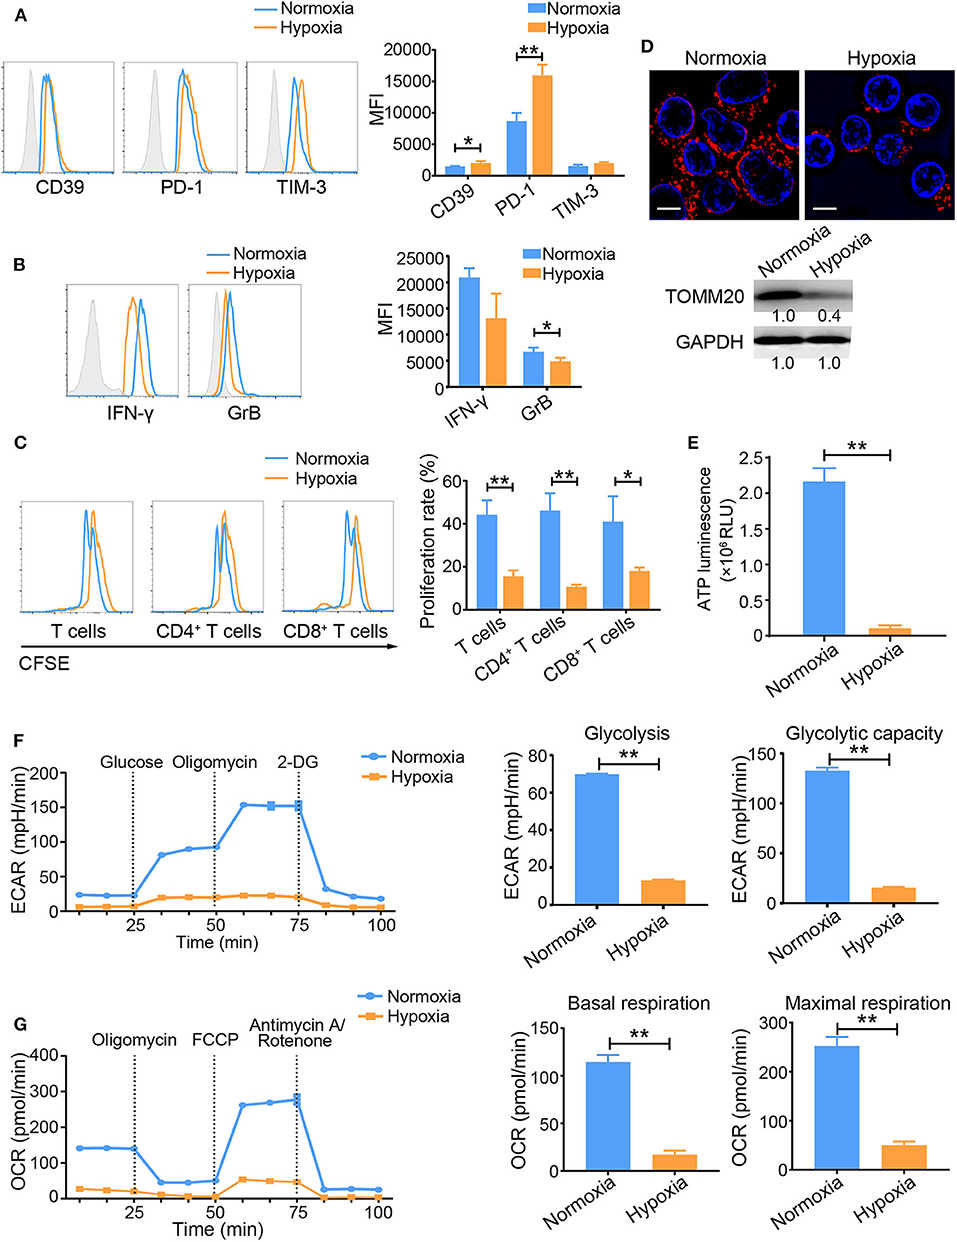
Figure 1. Hypoxia induces the TExh phenotype and energy metabolism dysregulation in activated T cells. T Cells were isolated from the peripheral blood of healthy donors, plated in the wells of OKT3-coated 24-well plates, and treated under the different indicated conditions. (A,B) Graphs showing the expression levels of inhibitory molecules, including CD39, PD-1 and TIM-3 (A), and the effector cytokines IFN-γ and GrB (B) in activated T cells exposed to normoxic and hypoxic conditions for 48 h. (C) Proliferation of activated T cells exposed to normoxic and hypoxic conditions for 48 h. (D) Representative structured illumination microscopy images of activated T cells cultured under normoxic or hypoxic conditions for 48 h and immunoblot showing the levels of TOMM20. Images from one of three experiments are shown. The mitochondria are red (MitoTracker Deep Red), and the nuclei are blue (DAPI). Scale bar, 50 μm. (E–G) Analysis of energy metabolism parameters, including ATP production (E), ECAR (glycolysis and glycolytic capacity) (F) and OCR (basal and maximal respiration) (G) in OKT3-stimulated T Cells exposed to normoxic or hypoxic conditions for 48 h; the values were normalized to the number of cells. All the data were obtained from at least three independent experiments. The data are presented as the means ± SEMs. The error bars represent the SEMs. *P < 0.05, **P < 0.01 (two-tailed Student's t-test).
Inhibition of MFN1-Mediated Mitochondrial Fusion Induces TExh
Because we observed a prominent loss of mitochondrial mass in hypoxia-treated activated T cells, we examined the expression profile of peroxisome proliferator-activated receptor gamma coactivator 1-alpha (PGC1α), a transcription factor involved in mitochondrial biogenesis. Under hypoxic conditions, the activated T cells displayed a decreased PGC1α expression at both the mRNA and protein levels (Figures 2A,B), suggesting that PGC1α might account for the mitochondrial loss observed in hypoxia-treated T cells. Intriguingly, we discovered that the expression level of the mitochondrial fusion protein MFN1 was significantly decreased in activated T cells under hypoxia, while the level of MFN2 was also slightly decreased (Figure 2C). Compared with control T cells, OKT3-activated T cells in which endogenous MFN1 was knocked down presented small and fragmented mitochondria that were dispersed in the cytoplasm (Figure 2D), as well as decreased ATP production, which was mainly due to the suppression mitochondrial OXPHOS (Figure 2E). MFN1 knockdown in OKT3-activated T cells increased the expression of CD39, decreased the secretion of IFN-γ and GrB, and resulted in poor proliferation (Figures 2F–H). These data suggest that mitochondrial fusion deficiency caused by MFN1 downregulation in activated T cells is closely related to the TExh phenotype.
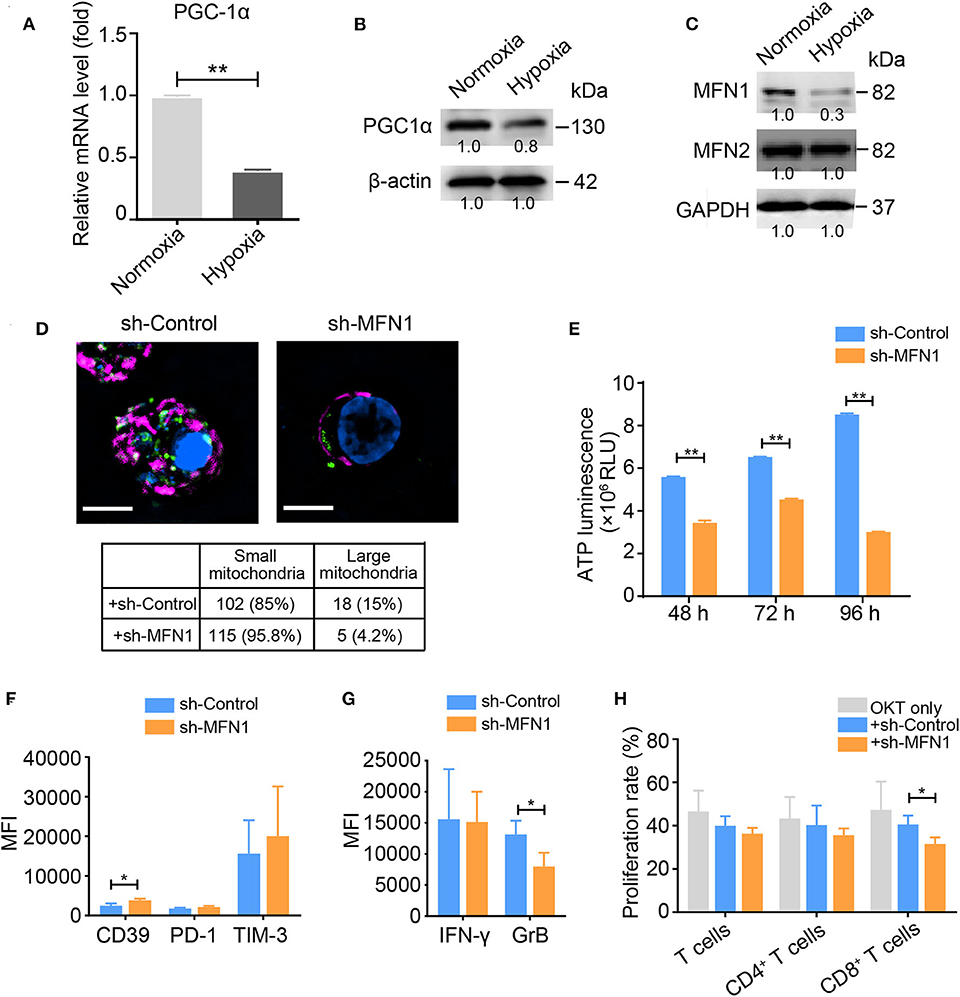
Figure 2. MFN1 is essential for hypoxia-induced TExh and mitochondrial energy metabolic reprogramming. (A,B) Levels of the PGC-1α mRNA and protein in activated T cells cultured under normoxic and hypoxic conditions. (C) Immunoblot analysis of activated T cells cultured under normoxic or hypoxic conditions for 48 h using the indicated antibodies; the data from one of three independent experiments are shown. (D) Representative structured illumination microscopy images of activated T cells cultured under the indicated treatment conditions for 48 h; the images from one of three experiments are shown. The mitochondria are shown in red (MitoTracker Deep Red), shControl and shMFN1 are shown in green (GFP), and the nuclei are shown in blue (DAPI). Scale bar, 50 μm. The small and large mitochondria that formed per microscopic field were counted. (E) ATP production in shMFN1 and shControl vector-treated T cells was measured at 48, 72, and 96 h. (F,G) Expression levels of inhibitory molecules, including CD39, PD-1, and TIM-3 (F), and the effector cytokines IFN-γ and GrB (G) in activated T cells treated with the lenti-shMFN1 or lenti-control vector. (H) Proliferation of activated T cells transduced with the lenti-shMFN1 or lenti-control vector. All data were obtained from at least three independent experiments. The error bars represent the SEMs. *P < 0.05, **P < 0.01 (two-tailed Student's t-test).
Hypoxia-Induced MiR-24 Expression Promotes the Progression of Activated Human T Cells to the Exhausted Phenotype by Regulating Mitochondrial Dynamics
In a previous study, we found that hypoxia induces exosomal miR-24 secretion in NPC and that this process is linked to T cell dysfunction (12). In the present study, miR-24 expression was also increased in activated T cells under hypoxia (Figure 3A). OKT3-activated T cells overexpressing miR-24 (OE-miR-24) exhibited increased levels of CD39, PD-1, and TIM-3, but decreased levels of IFN-γ and GrB and poor proliferation, while the ablation of endogenous miR-24 (miR-24-sponge) produced the opposite effect on the expression of these inhibitory molecules and the secretion of effector cytokines (Figures 3B–D). Based on these data, overexpression of miR-24 in T cells induces the TExh phenotype in vitro. Moreover, the NPC cell-derived exosomes, which exhibit miR-24 enrichment (12), also induced the TExh phenotype in vitro (Supplementary Figures 2A,B).
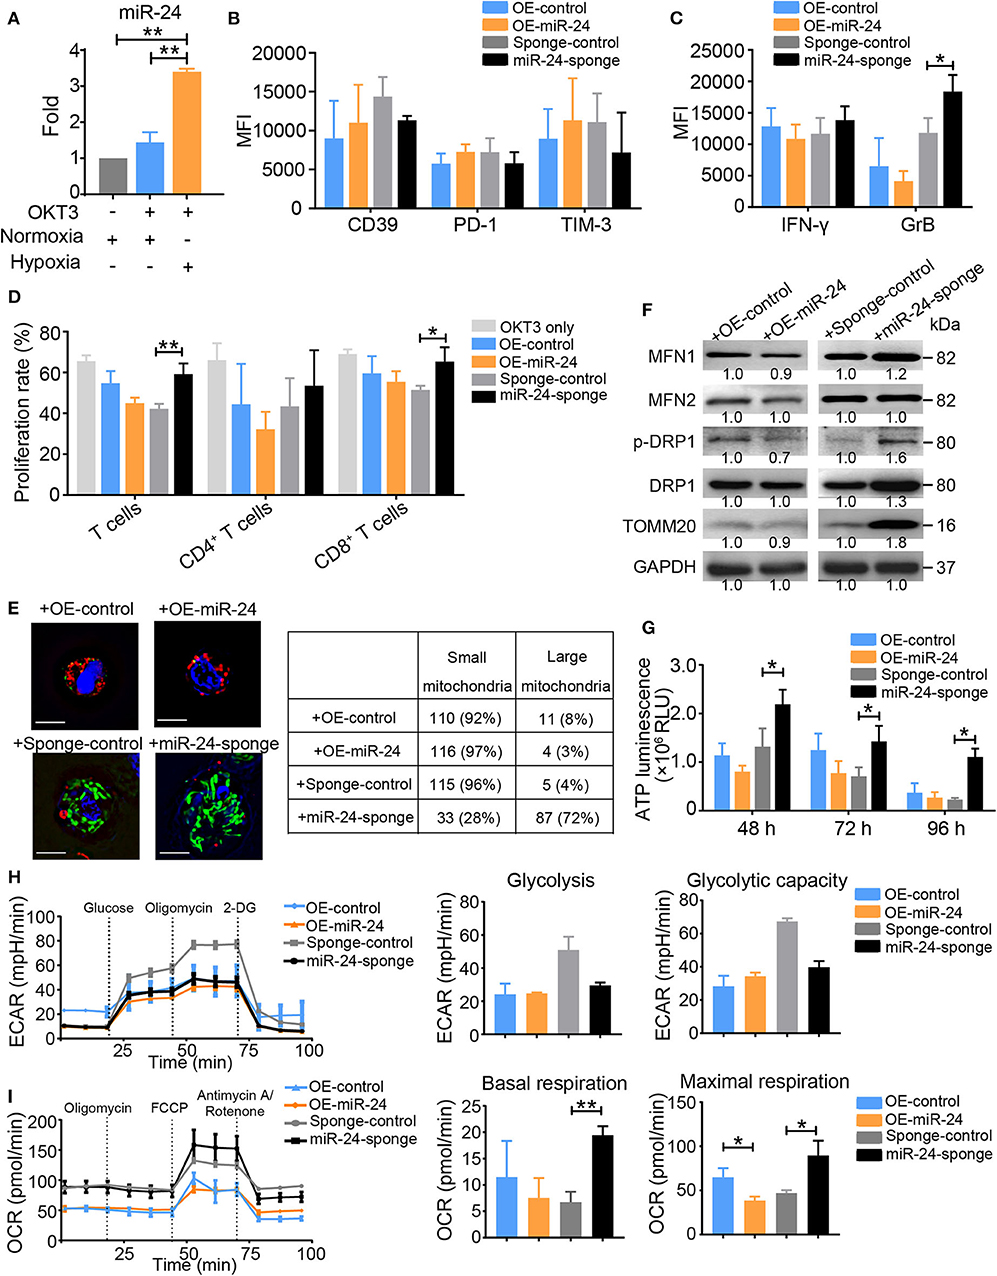
Figure 3. Ectopic expression of miR-24 induces TExh in vitro. (A) Real-time RT-qPCR assay showing the relative miR-24 levels in OKT3-activated T cells cultured under normoxic and hypoxic conditions; T cells that were not stimulated with OKT3 were included as controls. (B,C) Graphs showing the expression levels of inhibitory molecules, including CD39, PD-1 and TIM-3 (B), and the effector cytokines IFN-γ and GrB (C) in activated T cells transduced with the lenti-miR-24 (OE-miR-24), lenti-miR-24-sponge (miR-24-sponge), or corresponding lenti-control vector, as determined using flow cytometry. (D) Proliferation of activated T cells treated with the lenti-miR-24, lenti-miR-24-sponge, or corresponding lenti-control vector for 3 days. (E) Representative structured illumination microscopy images of activated T cells cultured under the indicated treatment conditions for 48 h; images from one of three experiments are shown. The mitochondria are shown in green or red (MitoTracker Green or MitoTracker Deep Red, respectively), OE-control and OE-miR-24 are shown in green (GFP), sponge-control and miR-24-sponge are shown in red (m-Cherry), and the nuclei are shown in blue (DAPI). Scale bar, 50 μm. The small and large mitochondria that formed per microscopic field were counted. (F) Immunoblot analysis of activated T cells after the indicated treatments for 72 h in vitro. Representative data from one of three independent experiments are shown. (G) ATP production in activated T cells treated with the lenti-miR-24, lenti-miR-24-sponge or lenti-control vector was measured at 48, 72, and 96 h. (H,I) The ECAR and OCR values in activated T Cells were measured 48 h after transduction with the lenti-sponge-control, lenti-miR-24-sponge, lenti-OE-control, and lenti-OE-miR-24; the values were normalized to the number of cells. All data were obtained from at least three independent experiments. The data are presented as the means ± SEMs. The error bars represent the SEMs. *P < 0.05, **P < 0.01 (one-way ANOVA and two-tailed Student's t-test).
OKT3-activated T cells in which endogenous miR-24 was knocked down contained densely packed, moderately tubulated mitochondria, whereas activated T cells overexpressing miR-24 showed relatively small and fragmented mitochondria (Figure 3E). The levels of MFN1, MFN2, p-DRP1 (phospho-dynamin related protein 1) and TOMM20 were increased in miR-24 sponge-treated T cells, but decreased in miR-24-treated T cells (Figure 3F). The ATP concentrations in the supernatants of activated T cell cultures were notably increased at multiple time points (48, 72, and 96 h) after endogenous miR-24 was knocked down, but were decreased upon miR-24 overexpression (Figure 3G), suggesting that miR-24 reduces ATP production in activated T cells. Activation of T cells is believed to elevate both aerobic glycolysis and mitochondrial OXPHOS activity to allow more robust ATP production (24). Although the ECAR and basal total oxygen consumption did not show marked differences between the miR-24-treated and miR-24 sponge-treated T Cells, the miR-24 sponge vector or /tumor cell line-derived exosome (T-EXO)-treated T Cells exhibited increases in the basal respiration and notable increases in the maximal respiration values (Figures 3H,I and Supplementary Figures 2C,D). These results indicate that miR-24 is a negative regulator of mitochondrial function.
Transcriptome Analysis Identifies MYC as a Key Modulator of the MiR-24-Mediated Induction of the TExh Phenotype
To further investigate the detailed molecular mechanism responsible for the miR-24-mediated induction of the TExh phenotype at the posttranscriptional level, we investigated the changes in the expression profiles of activated T cells overexpressing miR-24 by RNA-seq. Among the differentially expressed genes observed in miR-24-treated vs. control T cells, several reported direct targets of miR-24, including MYC and FGF11, and genes encoding T cell-inhibitory ligands, such as ENTPD1 and HAVCR2, were significantly altered (Figure 4A). We verified that the mRNA and protein levels of MYC and FGF11 in T cells, including CD4+ and CD8+ T cells, were suppressed by forced miR-24 overexpression and upregulated after miR-24 knockdown (Figures 4B,C). A pathway analysis revealed that the transcripts of genes involved in OXPHOS and fatty acid metabolism and MYC targets were significantly altered by miR-24 overexpression compared with the control condition (Figure 4D).
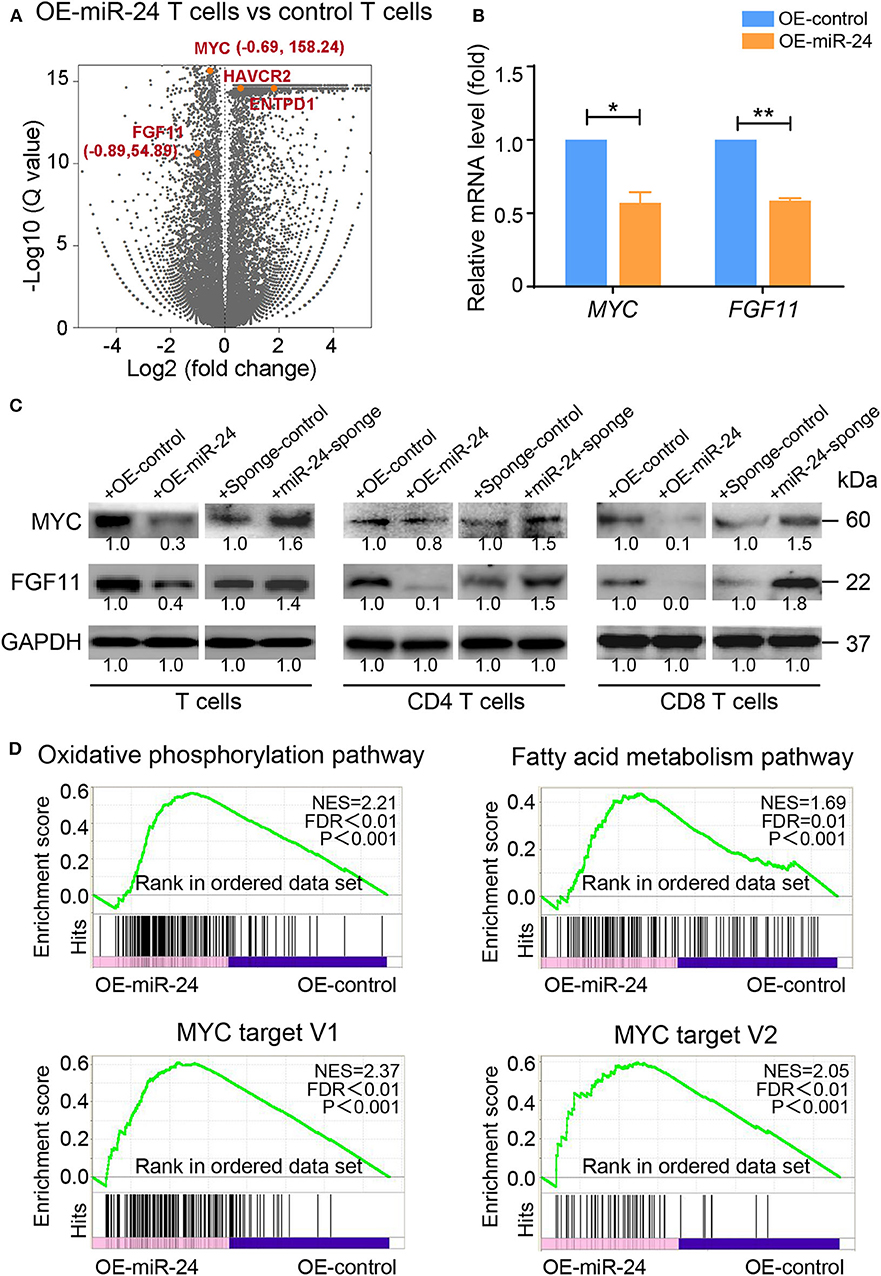
Figure 4. Exogenous miR-24 alters gene expression associated with cellular and metabolic processes in T cells. RNA-seq was performed on activated T cells transfected with control and miR-24-expressing lentiviruses in vitro. (A) Volcano plot showing the differential expression of all genes (gray) or the indicated miR-24 target genes MYC and FGF11 and the exhaustion-related genes ENTPD1 and HAVCR2 (orange) in control vs. miR-24-expressing T cells. (B,C) The mRNA and protein levels of the miR-24 target genes MYC and FGF11 in activated T cells, including CD4+ and CD8+ T cells, transduced with the lenti-miR-24, lenti-miR-24-sponge or corresponding lenti-control vector were measured using real-time RT-qPCR and immunoblotting, respectively. (D) The gene set enrichment analysis (GSEA) revealed an enrichment of genes involved in the OXPHOS pathway, the fatty acid metabolism pathway and MYC target genes in control cells compared with miR-24-expressing T cells. NES, normalized enrichment score. All data were obtained from at least three independent experiments. *P < 0.05, **P < 0.01 (two-tailed Student's t-test).
MYC and FGF11 Are Essential for the Reprogramming of Mitochondrial Dynamics in T Cells
According to a bioinformatic analysis (DIANA mirPath 2.0 software) and previous studies, MYC is a driving factor in the mechanism regulating cell metabolism and a direct target of miR-24, similar to FGF11 (25). We investigated whether MYC or FGF11 was involved in the regulation of glycolytic and mitochondrial energy respiration in activated T cells. Blockade of MYC or FGF11 significantly decreased the total ATP production in activated T cells at 48, 72, and 96 h (Figure 5A). The shFGF11- and shMYC-treated T Cells showed significantly increased basal or maximal ECAR values, respectively; meanwhile, both shMYC- and shFGF11-treated T cells exhibited significantly decreased basal and maximal respiration values (Figures 5B,C). Moreover, the mitochondrial size was substantially reduced in the shMYC- and shFGF11-treated activated T cells (Figure 5D), and the expression levels of MFN1/2, p-DRP1, DRP1, and TOMM20 were decreased in the shMYC- and shFGF11-treated T cells compared with the corresponding control T cells (Figure 5E). Although this result reflects a loss of mitochondrial mass, the change in mitochondrial morphology implies that the mitochondria in these cells also experienced inadequate fusion. We next sought to understand whether the canonical translational regulator MYC is involved in the regulation of mitochondrial fusion and to elucidate the underlying mechanism. We identified a MYC-binding site in the MFN1 promoter at a region spanning nucleotides −647 to −638 relative to the open reading frame and confirmed that MYC was able to induce the expression of the MFN1 gene containing a corresponding sequence by performing a luciferase assay (Figure 5F). These observations indicate that MYC enhances mitochondrial OXPHOS activity and is closely related to mitochondrial fusion via MFN1.
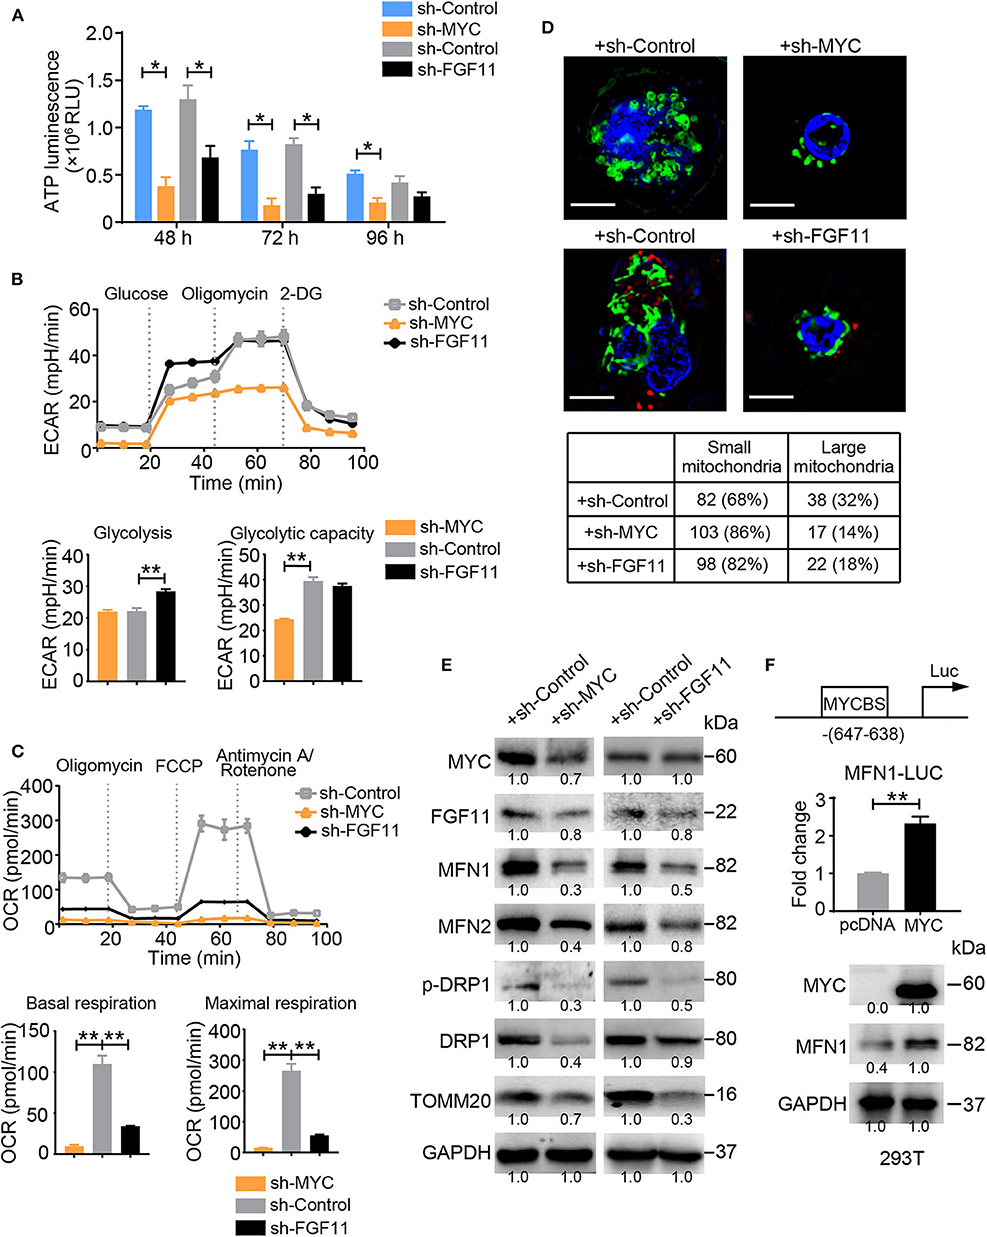
Figure 5. MYC and FGF11 are essential for mitochondrial energy metabolism reprogramming. (A) ATP production in shMYC, shFGF11 and shControl vector-transfected T cells was measured. (B,C) ECAR and OCR values of activated T Cells transfected with the shControl, shMYC, or shFGF11 vector; the values were normalized to the number of cells. (D) Representative structured illumination microscopy images of activated cells transfected with the shMYC, shFGF11, or shControl vector; images from one of three independent experiments are shown. The mitochondria are shown in green (MitoTracker Green), shControl and shFGF11 are shown in red (m-Cherry), and the nuclei are shown in blue (DAPI). Scale bar, 50 μm. The small and large mitochondria per field were counted under a microscope. (E) Immunoblot analysis of activated T cells transfected with the shMYC, shFGF11 or shControl vector using the indicated antibodies; the results from one of three independent experiments are shown. (F) Schematic showing the MYC-binding site (MYCBS) in the MFN1 promoter and the results of the luciferase reporter assay of the transcriptional regulation of MFN1 in 293T cells. All data were obtained from at least three independent experiments. The error bars represent the SEMs. *P < 0.05, **P < 0.01 (two-tailed Student's t-test).
FGF11 Is a Signal Transducer Between MYC and MFN1 in the TExh Induction
Intriguingly, the ablation of MYC or FGF11 in activated T cells resulted in increased levels of CD39, PD-1, and TIM-3, but decreased levels of IFN-γ and GrB and poor proliferation, consistent with their roles in the energy metabolism of activated T cells (Figures 6A–C). However, as shown in Figure 5, the effect of FGF11 on mitochondria function in activated T cells was less than MYC. Thus, we wondered whether FGF11 might serve as an additional signal transfer station between MYC and MFN1, supplementing the direct crosstalk between these molecules. We found that MYC bound to the FGF11 promoter at a region including nucleotides −1348 to −699 and induced FGF11 expression (Figure 6D). We subsequently introduced a lenti-FGF11 vector into shMYC-treated T cells and observed a reversal of the decrease in ATP production induced by MYC knockdown (Figure 6E). FGF11 overexpression reversed the decreases in MFN1 and TOMM20 levels, but not p-DRP1 levels, in shMYC-treated T cells (Figure 6F). These results support our hypothesis that FGF11 can act as a signal transducer between MYC and MFN1.
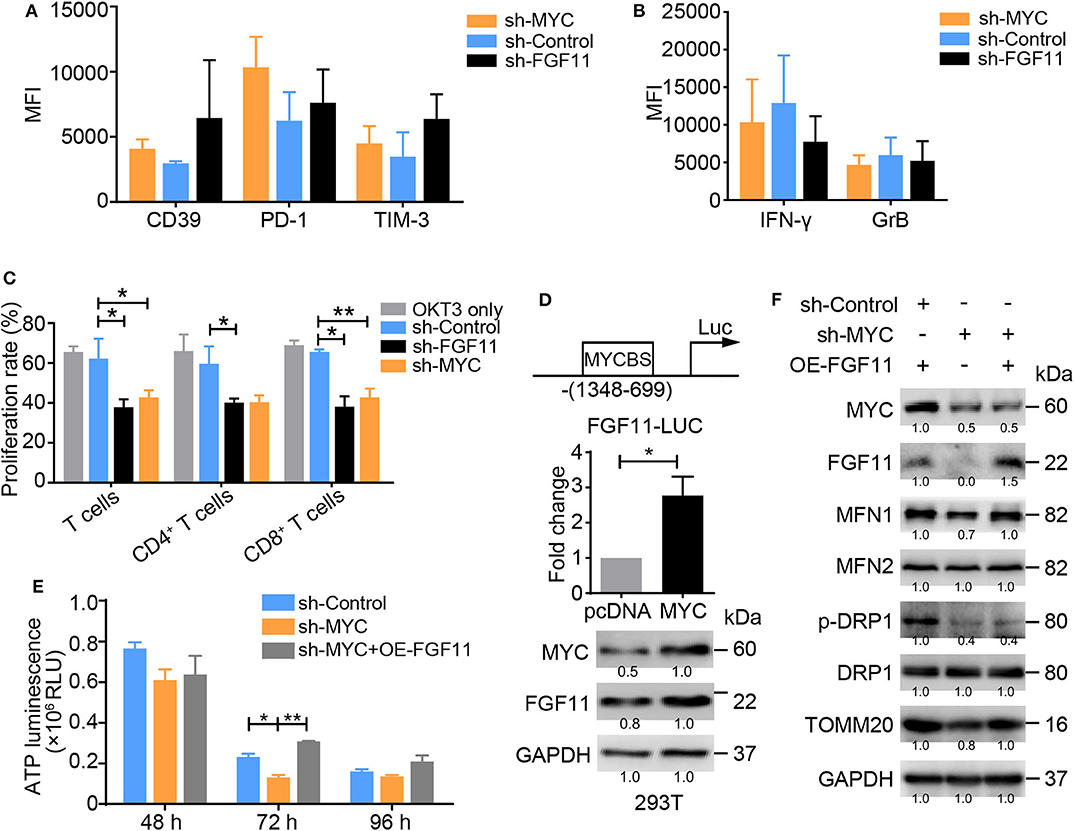
Figure 6. MYC transcriptionally activates FGF11 and MFN1 to trigger OXPHOS activity. (A,B) Graphs showing the expression levels of inhibitory molecules, including CD39, PD-1 and TIM-3, and the effector cytokines IFN-γ and GrB in activated T cells transduced with the shMYC, shFGF11, or shControl vector determined using flow cytometry. (C) Proliferation of activated T cells transfected with the shMYC, shFGF11, or shControl vector for 3 days. (D) Schematic showing the MYC-binding site (MYCBS) in the FGF11 promoter; a luciferase reporter assay was performed to assess the transcriptional regulation of FGF11 in 293T cells. (E) ATP production in activated T cells stimulated with the shControl, shMYC, or shMYC + FGF11 overexpression (OE) vector for 48, 72, and 96 h. (F) Immunoblot analysis of activated T cells cultured under the treatment conditions shown in (E) using the indicated antibodies; the data from one of three independent experiments are shown. All data were obtained from at least three independent experiments. The error bars represent the SEMs. *P < 0.05, **P < 0.01 (one-way ANOVA).
The NPC Microenvironment Promotes an Increased Frequency of T Cells With the TExh Phenotype and Mitochondrial Fragmentation
To determine whether our above-described results obtained with in vitro-activated T cells also occur in vivo, we analyzed circulating and tumor-infiltrating T cells from NPC patients and age-matched HDs by flow cytometry. This analysis revealed the same trends for the CD4+ and CD8+ T cell populations: TILs exhibited the highest percentage of the CD44+CD62L− Teff subset and the lowest proportion of CD44−CD62L+ naïve T cells and CD44+CD62L+ central memory T cells among the three groups of both CD4+ and CD8+ T cells (P < 0.01) (Figure 7A). However, compared with cells from HDs, T cells (including both CD4+ and CD8+ cells and particularly TILs) from patients with NPC expressed the inhibitory ligands CD39, PD-1, and TIM-3 at higher levels and the effector cytokines GrB and IFN-γ at lower levels (Figure 7B). These observations indicate that the T cells of NPC patients exhibit a TExh phenotype, particularly in tumor tissues, with lower proportions of naïve and central memory T cells than T cells of HDs. In addition, we observed increased expression of miR-24 in TILs compared with the PBMCs from patients with NPC and HDs, and decreased levels of MYC and MFN1 in the PBMCs and TILs from patients with NPC compared with HDs (Figures 7C,D). ATP production was decreased in patients with NPC, particularly in TILs (Figure 7E). Both PBMCs and TILs from patients with NPC displayed a significantly higher ECAR value and decreased OCR value (Figures 7F,G). We subsequently assessed the mitochondrial morphology of TILs and infiltrated lymphocytes in peritumor tissues by transmission electron microscopy (TEM). The average area and length of mitochondria in TILs were less than the mitochondria in lymphocytes that infiltrated peritumor tissues, although the total mitochondria numbers per cell were similar in these samples (Figure 7H). However, mitochondrial tubulation was induced by the reactivation of TILs in vitro (Figure 7I). These data suggest that the TExh phenotype is associated with the dysregulation of mitochondrial dynamics in NPC microenvironments.
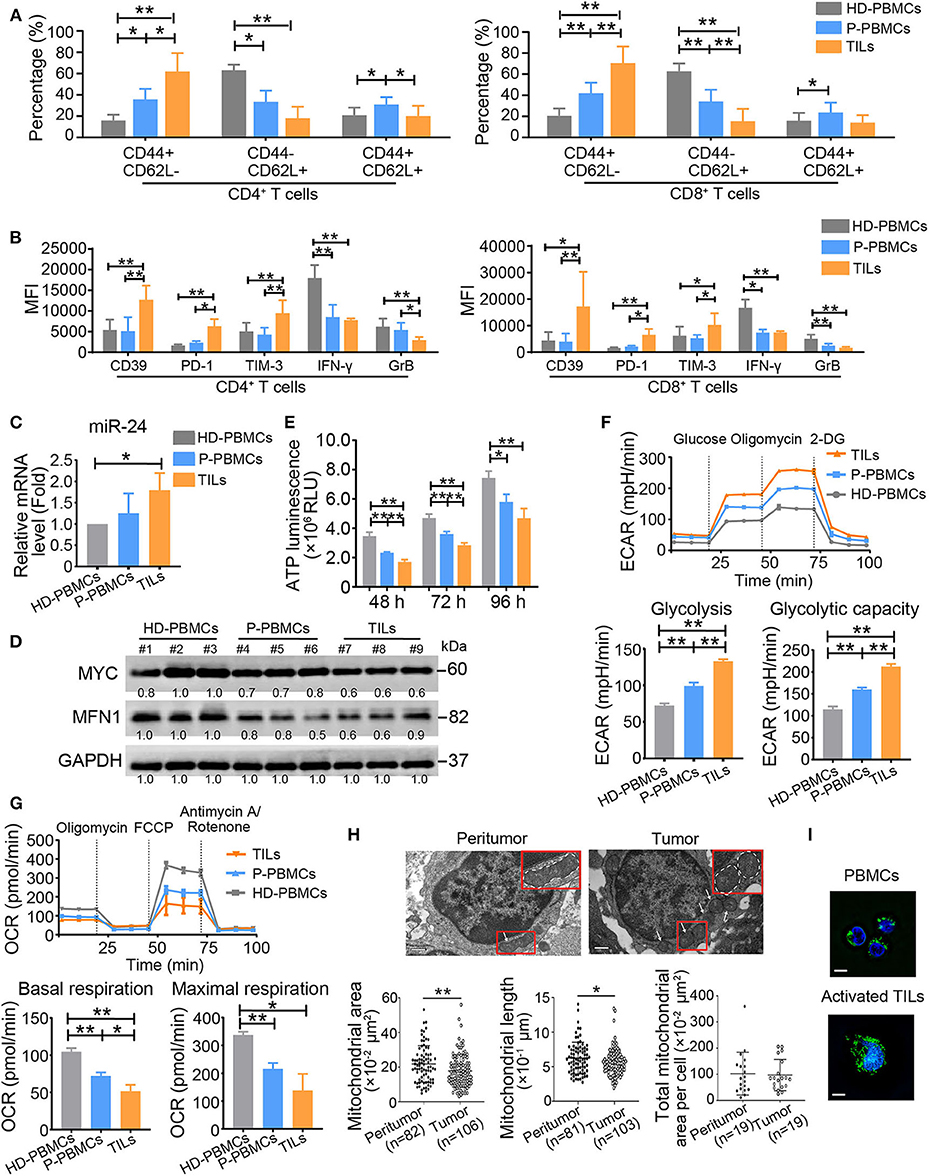
Figure 7. TExh frequency is increased in NPC patients. (A) PBMCs (P-PBMCs) and TILs were isolated from patients with NPC (n = 10). The percentages of different T cell subsets were calculated by performing staining for T cell surface markers, including CD4, CD8, CD44, and CD62L, followed by a FACS analysis. CD4+ (CD8+) CD44+CD62L− cells were defined as Teff cells, CD4+ (CD8+) CD44−CD62L+ cells were defined as naïve T cells, and CD4+ (CD8+) CD44+CD62L+ cells were defined as central memory T cells. PBMCs (HD-PBMCs) from age-matched HDs were included as controls (n = 10). (B) Summary of CD39, PD-1 and TIM-3 MFI levels in CD4+ and CD8+ P-PBMCs and TILs and HD-PBMCs (n = 10). (C) Real-time RT-qPCR assay showing the relative miR-24 levels in P-PBMCs, TILs and HD-PBMCs (n = 3) (D) Immunoblot analysis of P-PBMCs, TILs and HD-PBMCs using the indicated antibodies (n = 3). (E) ATP production in P-PBMCs, TILs and HD-PBMCs (n = 3). (F,G) The ECAR and OCR values in P-PBMCs, TILs, and HD-PBMCs (n = 3); the values were normalized to the number of cells. (H) Images of tumor and peritumor tissues from two patients. The images were acquired with a Gatan 1K × 1K charge-coupled device (CCD) camera (Gatan). Scale bar, 0.5 μm. (I) Image of mitochondrial staining in PBMCs and preactivated and activated TILs. The mitochondrial morphology of PBMCs and activated TILs was captured using a structured illumination microscope (Nikon). The mitochondria are green (MitoTracker Green), and the nuclei are blue (Hoechst). Scale bar, 50 μm. PBMCs = peripheral blood monocytes; TILs = tumor-infiltrating lymphocytes; MFI = mean fluorescence intensity. All the values are shown as the means ± SEMs. *P < 0.05, **P < 0.01 (one-way ANOVA or Mann–Whitney U-tests).
Inhibiting the Development of the TExh Phenotype by Inhibiting MiR-24 Signaling Decreases NPC Tumorigenesis in Nude Mice
To determine whether inhibition of miR-24-induced TExh restricts the progression of NPC in vivo, we implemented an experimental pipeline based on NPC xenografts in nude mice as described previously (26) (Figure 8A). Both the tumor node number and size were decreased by pretreatment of TILs with miR-24 sponges prior to their injection into xenograft mice. The activity of TILs was rescued by the coadministration of Mdivi-1, an efficacious inhibitor of the mitochondrial fission protein DRP1, and bezafibrate, an approved lipid-lowering drug that is presumed to prevent mitochondrial dysfunction (Figures 8B,C). Based on these results, the expression levels of miR-24 in TILs are closely associated with the tumor-inhibiting activity, and boosting mitochondrial biogenesis and fusion promotes the response to MYC-depleted TILs in mice. This association might be established based on (and effectively influenced by) the health of mitochondria and the resulting OXPHOS capacity.
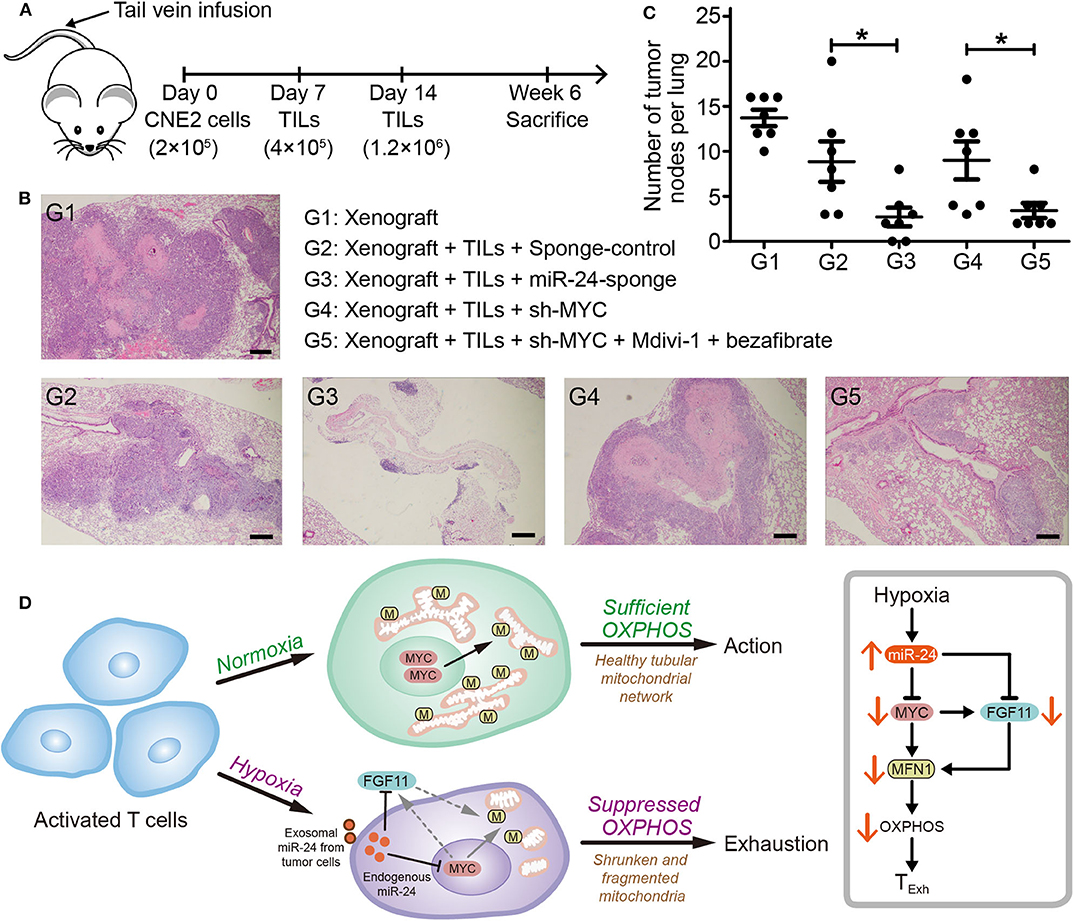
Figure 8. Inhibition of the TExh status of TILs reduces the growth of NPC xenografts in mice. (A) Nude mice were injected with 2 × 10⁵ CNE2 cells via the tail vein, and 1 and 2 weeks later, the mice received injections of TILs into the tail vein (4 × 10⁵ and 1.2 × 10⁶ cells, respectively). The TILs were pretreated in vitro for 3 days as follows: G1 (n = 5), xenograft + PBS; G2 (n = 5), xenograft + TILs administered the lenti-sponge-control vector; G3 (n = 5), xenograft + TILs administered the lenti-miR-24-sponge vector; G4 (n = 6), xenograft + TILs administered the lenti-shMYC vector; and G5 (n = 5), xenograft + TILs administered the lenti-shMYC vector, Mdivi-1, and bezafibrate. (B) Images of H&E staining of the lungs of mice in the different treatment groups (G1 to G5). Scale bar, 250 μm. (C) Statistical analysis of the numbers of tumor nodes in the lungs of mice in the various groups (G1 to G5); the nodes were counted in each 10x microscopic field. The data are presented as the means ± SEMs. *P < 0.05 (one-way ANOVA). (D) Cartoon schematic showing the regulation of TExh under hypoxic conditions via the miR-24 signaling-mediated reprogramming of mitochondrial energy metabolism.
Discussion
In this study, we found that hypoxia stress inhibits mitochondrial fusion in activated T cells and subsequently induces the TExh phenotype by disrupting mitochondrial function. Hypoxia upregulates miR-24 in tumor cells and TILs. Endogenous and exogenous miR-24 suppresses the expression of MYC and FGF11 in TILs and thereby decreases the cellular OXPHOS level by disrupting MFN1-mediated mitochondrial fusion (Figure 8D). Importantly, we found that inhibition of miR-24/MYC expression and/or promotion of mitochondrial fusion can restore the TExh status of TILs from NPC patients and restrict NPC tumorigenesis in xenograft mice. These results highlight a novel pathway for tumor microenvironment-induced TExh and provide new potential targets for cancer immunotherapy.
The hypoxic conditions in the TME lead to various effects that are thought to promote tumor progression. Specifically, hypoxia triggers the upregulation of PD-L1 in tumor cells in a HIF-1α-dependent manner (27), and HIF-1α accumulation in T cells has been suggested to favor differentiation into TH17 cells and to promote inflammatory diseases in humans (28, 29). Although these HIF-1α-mediated processes might contribute to T cell differentiation and dysfunction in the TME, how activated TILs directly respond to hypoxia and the role played by hypoxia in the development of the TExh phenotype remain unclear. We observed increased HIF-1α levels in activated T cells derived from PBMCs under hypoxic conditions. However, enhancement of HIF-1α activity might promote the glycolytic metabolism and effector function of CD8+ T cells in response to persistent antigen exposure (30). Hypoxia reportedly induces the expression of effector molecules, including GrB, via a HIF-dependent mechanism (31, 32). These results appear somewhat inconsistent with our data, which showed that hypoxia inhibits the effector function of activated T cells. Furthermore, hypoxia reduced the mitochondrial metabolism and mass in the present study, consistent with the observations of the status of mitochondrial metabolism in the tumor microenvironment containing dysfunctional T cells or exhausted T cells (33, 34). We reason that miR-24-induced MYC downregulation plays a more important role than other processes in the development of the TExh phenotype in the TME. In addition, a recent study found that HIF-1α induces miR-24 expression in colorectal cancer cells under hypoxic stress (35). Thus, miR-24 upregulation in T cells might also be related to HIF-1α stabilization.
Notably, miR-24 belongs to the miR-23/27/24 family, which contains multiple members and two paralogs in humans: miR-23a/27a/24-2 (the miR-23a cluster) on chromosome 19 and miR-23b/27b/24-1 (the miR-23b cluster) on chromosome 9 (36). According to previous studies, miR-24 is actively involved in T cell regulation. For instance, the miR-23~27~24 cluster is upregulated during postthymic CD8+ T cell differentiation and sensitizes human CD8+CD28− effector memory T cells to apoptotic death by suppressing histone variant H2AX expression (37, 38). In tumor microenvironments, miRs, including miR-24, play important roles in tumor immune editing by regulating target gene expression in a number of cell signaling pathways (39, 40). Here, we showed that under hypoxic conditions, TILs might accumulate miR-24 through both directly induced endogenous expression and import from T-EXOs. Thus, high loads of miR-24 can effectively induce metabolic and proliferative alterations in activated T cells. Although miR-24 induced mitochondrial dysfunction, as indicated by decreases in ATP production and OXPHOS activity (Figure 3), the RNA-seq transcriptome data indicated that most OXPHOS-related genes were upregulated following hypoxia or miR-24 overexpression in response to mitochondrial damage (Figure 4). These seemingly controversial results might be explained by a protective feedback mechanism of cells under stress. Similar regulatory mechanisms for mitochondrial metabolic reprogramming have been observed in T cells under hypoxia (41, 42).
Our study revealed that MYC is a major target of miR-24 in T cells. MYC is required at the early stage of T cell activation that precedes cell cycle entry (43). It has also been suggested that MYC promotes effector functions in CD8+ T cells (44) and is essential for the expression of genes involved in metabolic reprogramming during T cell activation (45). Given its roles in activated T cells, ablation of MYC might be closely related to TExh in the TME. We supported this possibility by showing that MYC directly impacts mitochondrial dynamics through control of the expression of the mitochondrial fusogen MFN1. Similarly, a study on mammary epithelial cells found that MYC overexpression promotes mitochondrial fusion via the mitochondrial outer membrane-anchored phospholipase PLD6 (46). As shown in our experiments, mitochondrial fusion is intimately coupled with OXPHOS activity and ATP production in activated T cells. Recent studies have also proposed that mitochondrial dynamics are able to control T cell fate through metabolic programming because enforcing mitochondrial fusion in activated Teff cells imposes characteristics of memory T cells and enhances antitumor function (47). A change in mitochondrial morphology has been proposed as a mechanism for bioenergetic adaptation to metabolic demands (48). In addition, we observed that the expression level of PGC1α remained unchanged and relatively low in activated T cells with and without miR-24 overexpression, which indicates that the miR-24-induced changes in the mitochondrial architecture are not dependent on PGC1α-mediated mitochondrial biogenesis. In contrast, although MFN1 has been found to share some functional redundancy with MFN2 in mouse epithelial fibroblast (MEF)-based assays (20), ablation of MFN1 in HeLa cells is sufficient to induce mitochondrial fragmentation (49). Thus, the disruption of mitochondrial fusion caused by miR-24-induced downregulation of the MYC-MFN1 pathway is likely an event upstream of metabolic reprogramming and a major driving force promoting TExh in the TME, which is considered a hypoxic and extremely nutrient-deprived environment. Notably, FGF11 plays an interesting role in this process. On the one hand, FGF11 responds to miR-24 upregulation both directly and through MYC; on the other hand, FGF11 and MYC both regulate the expression of MFN1. Thus, miR-24 controls MFN1-mediated mitochondrial dynamics in a “dual switch mode.”
TExh in the TME is a major barrier to the success of immunotherapies for solid cancers, such as CAR-T cell and PD-1 antibody therapies. Here, we found that increases in the frequency of the TExh phenotype among circulating T cells and TILs from NPC patients occurred concomitantly with decreases in mitochondrial mass and fusion deficiency in the TME. Although we have previously investigated the safety of and the objective clinical response to autologous in vivo-activated TILs in patients with late-stage NPC in a phase I study (50), we noted that the mitochondria in these TILs displayed a healthy tubular network (Figure 7I), which would enable efficient OXPHOS. A previous study based on mouse-derived Teff cells found that enforcement of mitochondrial fusion improves adoptive cellular immunotherapy against tumors (47). In this study, we found that targeting of miR-24 signaling or promotion of mitochondrial biogenesis and fusion enhanced the antitumor activity of human TILs in xenograft mice, which demonstrates the effectiveness of regulating mitochondrial dynamics in promoting the effector functions of human T cells. Therefore, targeting the miR-24 or MYC/FGF11-MFN1 pathway could be a potential effective approach for correcting mitochondrial defects in exhausted T cells and restoring healthy metabolism. This approach might prevent the development of the TExh phenotype or reverse the exhausted fate of TILs and could eventually improve the clinical efficacy of adaptive T cell therapies against solid tumors.
Data Availability Statement
The datasets presented in this study can be found in online repositories. The names of the repository/repositories and accession number(s) can be found in the article/Supplementary Material.
Ethics Statement
The fresh tumor specimens and peripheral blood samples were collected at Sun Yat-sen University Cancer Center, Guangzhou, China, in 2015. The study was approved by the Research Ethics Committee of Sun Yat-sen University Cancer Center (GZR2013-040). The patients/participants provided their written informed consent to participate in this study. All animal experiments were performed in accordance with protocols approved by the Institutional Animal Care and Use Committee of Sun Yat-sen University, Guangzhou, China (L102012018060P). Written informed consent was obtained from the individual(s) for the publication of any potentially identifiable images or data included in this article.
Author Contributions
JL and SG proposed the concept and conceived the entire study. Y-NL, D-JH, J-FY, H-HN, C-XZ, JH, J-MG, and H-XC performed the experiments. H-QM, Q-YC, JH, and X-SZ selected the patients and collected the clinical samples. JL, SG, and Y-NL wrote the manuscript. JL supervised the entire project. All authors contributed to the article and approved the submitted version.
Funding
This work was supported by the National Key R&D Program of China (Grant Nos. 2018YFA0508300 and 2018YFC1313400), the National Natural Science Foundation of China (Grant Nos. 81972874, 81773256, and 81572982 to JL and Nos. 31722016, 31470729, and 81772977 to SG), the Natural Science Foundation of Guangdong Province (Grant No. 2014A020212066 to JL and Nos. 2014TQ01R584 and 2014A030312015 to SG), the Key Program of the Guangzhou City Foundation (Grant No. 201802020001), Shenzhen Institute for Innovation and Translational Medicine Shenzhen Peacock Plan (Grant No. KQTD20130416114522736), and the Shenzhen Basic Research Program (Grant Nos. JCYJ20170412102821202 and JCYJ20180507182902330). Natural Science Foundation of Guangdong Province (2019TX05Y598, 2014TQ01R584, and 2014A030312015); Innovative Team Program of Guangzhou Regenerative Medicine and Health Guangdong Laboratory to SG (2018GZR110103002).
Conflict of Interest
The authors declare that the research was conducted in the absence of any commercial or financial relationships that could be construed as a potential conflict of interest.
Acknowledgments
We thank Mr. Christopher Lavender (Sun Yat-sen University Cancer Center, Guangzhou) for discussions regarding the manuscript.
Supplementary Material
The Supplementary Material for this article can be found online at: https://www.frontiersin.org/articles/10.3389/fimmu.2020.01906/full#supplementary-material
References
1. Speiser DE, Ho PC, Verdeil G. Regulatory circuits of T Cell function in cancer. Nat Rev Immunol. (2016) 16:599–611. doi: 10.1038/nri.2016.80
3. Bauer C, Kuhnemuth B, Duewell P, Ormanns S, Gress T, Schnurr M. Prevailing over T Cell exhaustion: new developments in the immunotherapy of pancreatic cancer. Cancer Lett. (2016) 381:259–68. doi: 10.1016/j.canlet.2016.02.057
4. Okoye IS, Houghton M, Tyrrell L, Barakat K, Elahi S. Coinhibitory receptor expression and immune checkpoint blockade: maintaining a balance in cD8(+) T Cell responses to chronic viral infections and cancer. Front Immunol. (2017) 8:1215. doi: 10.3389/fimmu.2017.01215
5. Seo H, Jeon I, Kim BS, Park M, Bae EA, Song B, et al. IL-21-Mediated reversal of nK cell exhaustion facilitates anti-Tumour immunity in mHC class i-Deficient tumours. Nat Commun. (2017) 8:15776. doi: 10.1038/ncomms15776
6. Moon EK, Wang LC, Dolfi DV, Wilson CB, Ranganathan R, Sun J, et al. Multifactorial t-Cell hypofunction that is reversible can limit the efficacy of chimeric antigen receptor-Transduced human T Cells in solid tumors. Clin Cancer Res. (2014) 20:4262–73. doi: 10.1158/1078-0432.CCR-13-2627
7. Wang SF, Fouquet S, Chapon M, Salmon H, Regnier F, Labroquere K, et al. Early T Cell signalling is reversibly altered in pD-1+ T Lymphocytes infiltrating human tumors. PLoS ONE. (2011) 6:E17621. doi: 10.1371/journal.pone.0017621
8. Baginska J, Viry E, Paggetti J, Medves S, Berchem G, Moussay E, et al. The critical role of the tumor microenvironment in shaping natural killer cell-Mediated anti-Tumor immunity. Front Immunol. (2013) 4:490. doi: 10.3389/fimmu.2013.00490
9. Lee CT, Mace T, Repasky EA. Hypoxia-Driven immunosuppression: a new reason to use thermal therapy in the treatment of cancer? Int J Hyperthermia. (2010) 26:232–46. doi: 10.3109/02656731003601745
10. Henderson BW, Gollnick SO, Snyder JW, Busch TM, Kousis PC, Cheney RT, et al. Choice of oxygen-Conserving treatment regimen determines the inflammatory response and outcome of photodynamic therapy of tumors. Cancer Res. (2004) 64:2120–6. doi: 10.1158/0008-5472.CAN-03-3513
11. Sormendi S, Wielockx B. Hypoxia pathway proteins as central mediators of metabolism in the tumor cells and their microenvironment. Front Immunol. (2018) 9:40. doi: 10.3389/fimmu.2018.00040
12. Ye SB, Zhang H, Cai TT, Liu YN, Ni JJ, He J, et al. Exosomal miR-24-3p impedes t-Cell function by targeting fGF11 and serves as a potential prognostic biomarker for nasopharyngeal carcinoma. J Pathol. (2016) 240:329–40. doi: 10.1002/path.4781
13. Catalano V, Turdo A, Di Franco S, Dieli F, Todaro M, Stassi G. Tumor and its microenvironment: a synergistic interplay. Semin Cancer Biol. (2013) 23(6 Pt B):522–32. doi: 10.1016/j.semcancer.2013.08.007
14. Philip B, Ito K, Moreno-Sanchez R, Ralph SJ. HIF expression and the role of hypoxic microenvironments within primary tumours as protective sites driving cancer stem cell renewal and metastatic progression. Carcinogenesis. (2013) 34:1699–707. doi: 10.1093/carcin/bgt209
15. Davoodzadeh GM, Kardar GA, Saeedi Y, Heydari S, Garssen J, Falak R. Exhaustion of t Lymphocytes in the tumor microenvironment: significance and effective mechanisms. Cell Immunol. (2017) 322:1–14. doi: 10.1016/j.cellimm.2017.10.002
16. Mellado M, de Ana AM, Moreno MC, Martinez C, Rodriguez-Frade JM. A potential immune escape mechanism by melanoma cells through the activation of chemokine-Induced T Cell death. Curr Biol. (2001) 11:691–6. doi: 10.1016/S0960-9822(01)00199-3
17. Siska PJ, Beckermann KE, Mason FM, Andrejeva G, Greenplate AR, Sendor AB, et al. Mitochondrial dysregulation and glycolytic insufficiency functionally impair cD8 T Cells infiltrating human renal cell carcinoma. JCI Insight. (2017) 2:12. doi: 10.1172/jci.insight.93411
18. Vazquez F, Lim JH, Chim H, Bhalla K, Girnun G, Pierce K, et al. PGC1alpha expression defines a subset of human melanoma tumors with increased mitochondrial capacity and resistance to oxidative stress. Cancer Cell. (2013) 23:287–301. doi: 10.1016/j.ccr.2012.11.020
19. Alexiou A, Soursou G, Chatzichronis S, Gasparatos E, Kamal MA, Yarla NS, et al. Role of gTPases in the regulation of mitochondrial dynamics in alzheimer's disease and cNS-Related disorders. Mol Neurobiol. (2019) 56:4530–8. doi: 10.1007/s12035-018-1397-x
20. Chen H, Detmer SA, Ewald AJ, Griffin EE, Fraser SE, Chan DC. Mitofusins mfn1 and mfn2 coordinately regulate mitochondrial fusion and are essential for embryonic development. J Cell Biol. (2003) 160:189–200. doi: 10.1083/jcb.200211046
21. Zorzano A, Liesa M, Sebastian D, Segales J, Palacin M. Mitochondrial fusion proteins: dual regulators of morphology and metabolism. Semin Cell Dev Biol. (2010) 21:566–74. doi: 10.1016/j.semcdb.2010.01.002
22. Cai TT, Ye SB, Liu YN, He J, Chen QY, Mai HQ, et al. LMP1-Mediated glycolysis induces myeloid-Derived suppressor cell expansion in nasopharyngeal carcinoma. PLoS Pathog. (2017) 13:E1006503. doi: 10.1371/journal.ppat.1006503
23. Bosco MC, Puppo M, Santangelo C, Anfosso L, Pfeffer U, Fardin P, et al. Hypoxia modifies the transcriptome of primary human monocytes: modulation of novel immune-Related genes and identification of cC-Chemokine ligand 20 as a new hypoxia-Inducible gene. J Immunol. (2006) 177:1941–55. doi: 10.4049/jimmunol.177.3.1941
24. Renner K, Singer K, Koehl GE, Geissler EK, Peter K, Siska PJ, et al. Metabolic hallmarks of tumor and immune cells in the tumor microenvironment. Front Immunol. (2017) 8:248. doi: 10.3389/fimmu.2017.00248
25. Wu YH, Liu W, Zhang L, Liu XY, Wang Y, Xue B, et al. Effects of MicroRNA-24 targeting c-Myc on apoptosis, proliferation, and cytokine expressions in chondrocytes of rats with osteoarthritis via mAPK signaling pathway. J Cell Biochem. (2018) 119:7944–58. doi: 10.1002/jcb.26514
26. Li ZL, Ye SB, OuYang LY, Zhang H, Chen YS, He J, et al. COX-2 promotes metastasis in nasopharyngeal carcinoma by mediating interactions between cancer cells and myeloid-Derived suppressor cells. Oncoimmunology. (2015) 4:E1044712. doi: 10.1080/2162402X.2015.1044712
27. Barsoum IB, Smallwood CA, Siemens DR, Graham CH. A mechanism of hypoxia-Mediated escape from adaptive immunity in cancer cells. Cancer Res. (2014) 74:665–74. doi: 10.1158/0008-5472.CAN-13-0992
28. Zhou L, Lopes JE, Chong MM, Ivanov II, Min R, Victora GD, et al. TGF-Beta-Induced foxp3 inhibits t(H)17 cell differentiation by antagonizing rORgammat function. Nature. (2008) 453:236–40. doi: 10.1038/nature06878
29. Dang EV, Barbi J, Yang HY, Jinasena D, Yu H, Zheng Y, et al. Control of t(H)17/T(reg) balance by hypoxia-Inducible factor 1. Cell. (2011) 146:772–84. doi: 10.1016/j.cell.2011.07.033
30. Doedens AL, Phan AT, Stradner MH, Fujimoto JK, Nguyen JV, Yang E, et al. Hypoxia-Inducible factors enhance the effector responses of cD8(+) T Cells to persistent antigen. Nat Immunol. (2013) 14:1173–82. doi: 10.1038/ni.2714
31. Palazon A, Goldrath AW, Nizet V, Johnson RS. HIF transcription factors, inflammation, and immunity. Immunity. (2014) 41:518–28. doi: 10.1016/j.immuni.2014.09.008
32. Gropper Y, Feferman T, Shalit T, Salame T, Porat Z, Shakhar G. Culturing cTLs under hypoxic conditions enhances their cytolysis and improves their anti-Tumor function. Cell Rep. (2017) 20:2547–55. doi: 10.1016/j.celrep.2017.08.071
33. Bengsch B, Johnson AL, Kurachi M, Odorizzi PM, Pauken KE, Attanasio J, et al. Bioenergetic insufficiencies due to metabolic alterations regulated by the inhibitory receptor pD-1 are an early driver of cD8 + T Cell exhaustion. Immunity. (2016) 45:358–73. doi: 10.1016/j.immuni.2016.07.008
34. Scharping NE, Menk AV, Moreci RS, Whetstone RD, Dadey RE, Watkins SC, et al. The tumor microenvironment represses T Cell mitochondrial biogenesis to drive intratumoral T Cell metabolic insufficiency and dysfunction. Immunity. (2016) 45:374–88. doi: 10.1016/j.immuni.2016.07.009
35. Jin F, Yang R, Wei Y, Wang D, Zhu Y, Wang X, et al. HIF-1alpha-Induced miR-23a approximately 27a approximately 24 cluster promotes colorectal cancer progression via reprogramming metabolism. Cancer Lett. (2019) 440-441:211–22. doi: 10.1016/j.canlet.2018.10.025
36. Cho S, Wu CJ, Yasuda T, Cruz LO, Khan AA, Lin LL, et al. miR-23 approximately 27 approximately 24 clusters control effector T Cell differentiation and function. J Exp Med. (2016) 213:235–49. doi: 10.1084/jem.20150990
37. Cui M, Yao X, Lin Y, Zhang D, Cui R, Zhang X. Interactive functions of microRNAs in the miR-23a-27a-24-2 cluster and the potential for targeted therapy in cancer. J Cell Physiol. (2020) 235:6–16. doi: 10.1002/jcp.28958
38. Manoel-Caetano FS RACD. Upregulation of the aPE1 and h2AX genes and miRNAs involved in dNA damage response and repair in gastric cancer. Genes Dis. (2019) 6:176–84. doi: 10.1016/j.gendis.2019.03.007
39. Pua HH, Steiner DF, Patel S, Gonzalez JR, Ortiz-Carpena JF, Kageyama R, et al. MicroRNAs 24 and 27 suppress allergic inflammation and target a network of regulators of t Helper 2 cell-Associated cytokine production. Immunity. (2016) 44:821–32. doi: 10.1016/j.immuni.2016.01.003
40. Brunner S, Herndler-Brandstetter D, Arnold CR, Wiegers GJ, Villunger A, Hackl M, et al. Upregulation of miR-24 is associated with a decreased dNA damage response upon etoposide treatment in highly differentiated cD8(+) T Cells sensitizing them to apoptotic cell death. Aging Cell. (2012) 11:579–87. doi: 10.1111/j.1474-9726.2012.00819.x
41. Miska J, Lee-Chang C, Rashidi A, Muroski ME, Chang AL, Lopez-Rosas A, et al. HIF-1α is a metabolic switch between glycolytic-Driven migration and oxidative phosphorylation-Driven immunosuppression of tregs in glioblastoma. Cell Rep. (2019) 27:226–37. doi: 10.1016/j.celrep.2019.03.029
42. Gemta LF, Siska PJ, Nelson ME, Gao X, Liu X, Locasale JW, et al. Impaired enolase 1 glycolytic activity restrains effector functions of tumor-Infiltrating cD8(+) T Cells. Sci Immunol. (2019) 4:31. doi: 10.1126/sciimmunol.aap9520
43. Gnanaprakasam J, Sherman JW, Wang R. MYC and hIF in shaping immune response and immune metabolism. Cytokine Growth Factor Rev. (2017) 35:63–70. doi: 10.1016/j.cytogfr.2017.03.004
44. Chou C, Pinto AK, Curtis JD, Persaud SP, Cella M, Lin CC, et al. c-Myc-Induced transcription factor aP4 is required for host protection mediated by cD8+ T Cells. Nat Immunol. (2014) 15:884–93. doi: 10.1038/ni.2943
45. Wang R, Dillon CP, Shi LZ, Milasta S, Carter R, Finkelstein D, et al. The transcription factor Myc controls metabolic reprogramming upon T Lymphocyte activation. Immunity. (2011) 35:871–82. doi: 10.1016/j.immuni.2011.09.021
46. von Eyss B, Jaenicke LA, Kortlever RM, Royla N, Wiese KE, Letschert S, et al. A mYC-Driven change in mitochondrial dynamics limits yAP/TAZ function in mammary epithelial cells and breast cancer. Cancer Cell. (2015) 28:743–57. doi: 10.1016/j.ccell.2015.10.013
47. Buck MD, O'Sullivan D, Klein GR, Curtis JD, Chang CH, Sanin DE, et al. Mitochondrial dynamics controls T Cell fate through metabolic programming. Cell. (2016) 166:63–76. doi: 10.1016/j.cell.2016.05.035
48. Liesa M, Shirihai OS. Mitochondrial dynamics in the regulation of nutrient utilization and energy expenditure. Cell Metab. (2013) 17:491–506. doi: 10.1016/j.cmet.2013.03.002
49. Eura Y, Ishihara N, Yokota S, Mihara K. Two mitofusin proteins, mammalian homologues of fZO, with distinct functions are both required for mitochondrial fusion. J Biochem. (2003) 134:333–44. doi: 10.1093/jb/mvg150
50. Li J, Chen Q, He J, Li Z, Tang X, Chen S, et al. Phase I Trial of adoptively transferred tumor-Infiltrating lymphocyte immunotherapy following concurrent chemoradiotherapy in patients with locoregionally advanced nasopharyngeal carcinoma. Oncoimmunology. (2015) 4:e976507. doi: 10.4161/23723556.2014.976507
Keywords: T cell exhaustion, mitochondrial dynamics, miR-24, nasopharyngeal carcinoma, MYC
Citation: Liu Y-N, Yang J-F, Huang D-J, Ni H-H, Zhang C-X, Zhang L, He J, Gu J-M, Chen H-X, Mai H-Q, Chen Q-Y, Zhang X-S, Gao S and Li J (2020) Hypoxia Induces Mitochondrial Defect That Promotes T Cell Exhaustion in Tumor Microenvironment Through MYC-Regulated Pathways. Front. Immunol. 11:1906. doi: 10.3389/fimmu.2020.01906
Received: 22 April 2020; Accepted: 15 July 2020;
Published: 21 August 2020.
Edited by:
Anne Spurkland, University of Oslo, NorwayCopyright © 2020 Liu, Yang, Huang, Ni, Zhang, Zhang, He, Gu, Chen, Mai, Chen, Zhang, Gao and Li. This is an open-access article distributed under the terms of the Creative Commons Attribution License (CC BY). The use, distribution or reproduction in other forums is permitted, provided the original author(s) and the copyright owner(s) are credited and that the original publication in this journal is cited, in accordance with accepted academic practice. No use, distribution or reproduction is permitted which does not comply with these terms.
*Correspondence: Song Gao, Z2Fvc29uZ0BzeXN1Y2Mub3JnLmNu; Jiang Li, bGlqaWFuZzJAbWFpbC5zeXN1LmVkdS5jbg==
†These authors have contributed equally to this work
‡ORCID: Song Gao orcid.org/0000-0001-7427-6681
Jiang Li orcid.org/0000-0001-5596-9159