 Xiangyue Zhang1
 Pingping Zheng2Tyler R. Prestwood1Hong Zhang1
 Yaron Carmi1
 Lorna L. Tolentino1Nancy Wu1Okmi Choi1
 Daniel A. Winer3,4Samuel Strober5Eun-Suk Kang6Michael N. Alonso1†
 Edgar G. Engleman1*
- 1Department of Pathology, Blood Center, Stanford University School of Medicine, Palo Alto, CA, United States
- 2Bone Marrow Transplantation, Stanford University School of Medicine, Palo Alto, CA, United States
- 3Buck Institute for Research on Aging, Novato, CA, United States
- 4Division of Cellular and Molecular Biology, Diabetes Research Group, Toronto General Hospital Research Institute (TGHRI), University Health Network, Toronto, ON, Canada
- 5Division of Immunology and Rheumatology, Department of Medicine, Stanford University of Medicine, Stanford, CA, United States
- 6Department of Laboratory Medicine and Genetics, Samsung Medical Center, Sungkyunkwan University, Seoul, South Korea
Dendritic cells (DCs) are powerful antigen presenting cells, derived from bone marrow progenitors (cDCs) and monocytes (moDCs), that can shape the immune response by priming either proinflammatory or tolerogenic immune effector cells. The cellular mechanisms responsible for the generation of DCs that will prime a proinflammatory or tolerogenic response are poorly understood. Here we describe a novel mechanism by which tolerogenic DCs are formed from monocytes. When human monocytes were cultured with CD4+FoxP3+ natural regulatory T cells (Tregs) and T helper cells (Th) from healthy donor blood, they differentiated into regulatory DCs (DCReg), capable of generating induced Tregs from naïve T cells. DCReg exhibited morphology, surface phenotype, cytokine secretion, and transcriptome that were distinct from other moDCs including those derived from monocytes cultured with Th or with GM-CSF/IL-4, as well as macrophages (MΦ). Direct cell contact between monocytes, Tregs and Th, along with Treg-derived CTLA-4, IL-10 and TGF-β, was required for the phenotypic differentiation of DCReg, although only IL-10 was required for imprinting the Treg-inducing capacity of DCReg. High ratios of Treg:Th, along with monocytes and DCReg similar in function and phenotype to those induced in vitro, were present in situ in human colorectal cancer specimens. Thus, through the combined actions of Tregs and Th, monocytes differentiate into DCs with regulatory properties, forming a positive feedback loop to reinforce Treg initiated immune regulation. This mechanism may contribute to immune tolerance in tissues such as tumors, which contain an abundance of Tregs, Th and monocytes.
Introduction
As one component of the “mononuclear phagocyte system” (MPS), monocytes constitute approximately 10% and 4% of the leukocytes in human and murine peripheral blood, respectively (1). Circulating monocytes can infiltrate into mucosal (2), inflammatory (3), cancer tissues (4), or draining lymph nodes (LNs) (5) and differentiate into either macrophages (MΦ) or dendritic cells (moDCs) (6). Monocytes are highly plastic and their differentiation is subject to the signals that they receive (7), which enables the cells to acquire distinctive features to promote or hamper immune responses (1). We previously observed that human CD4+ Th cells and monocytes frequently interact with one another in inflamed tissues of patients with autoimmune and allergic disease, and demonstrated that such interactions result in the differentiation of monocytes into pro-inflammatory immunogenic moDCs (DCTh), which in turn induce the formation of Th effector cells from naïve T cells (8, 9). The differentiation of DCTh from monocytes occurs in a cell contact, GM-CSF and TNFα dependent manner (8).
Although numerous inflammatory moDC subsets have been identified in inflammatory environments (8–11), little is known about the signals required to induce tolerogenic/immunoregulatory moDCs. Since regulatory T cells (Tregs) play a central role in promoting immune tolerance and maintaining immune homeostasis (10), we and others considered the possibility that they might directly induce regulatory moDCs (DCReg) from monocytes in a manner analogous to the induction of DCTh by Th cells. However, when monocytes are cultured with activated Tregs alone, they become macrophages (MΦ) (12). Since Tregs most often exert direct immune suppression on Th cells (11, 13, 14), we hypothesized that both Tregs and Th might be required for the generation of immune regulatory DCs from monocytes. To evaluate this hypothesis, we cultured classical human CD14+ monocytes with activated natural Tregs and Th from healthy donors. The results show that under these conditions monocytes differentiate into regulatory DCReg with the capacity to induce the formation of immune suppressive CD4+FoxP3+ Tregs. DCReg are distinctive in their morphology, phenotype, cytokine secretion, and transcriptome. DCReg similar in phenotype and function to those induced in vitro were present in situ in colorectal cancer (CRC), along with an abundance of monocytes, Tregs and Th cells. Therefore, our study reveals a novel mechanism by which Tregs can inhibit the immune response by inducing the generation of DCReg.
Materials and Methods
Processing of Human PBMCs
PBMCs were isolated from buffy coats/LRS chambers obtained from healthy adult blood donors at the Stanford Blood Center. CD14+ monocytes and CD4+CD127low T cells were isolated from PBMCs using RosetteSep Human Monocyte Enrichment Kits and CD4+CD127low T cell Enrichment Kits, respectively (Stem Cell Technologies). CD14+ monocytes were further purified to > 97% purity by magnetic separation with anti-CD14 conjugated microbeads (Miltenyi Biotec). Memory CD4+ Th and Tregs were obtained by sorting pre-enriched T cells with fluorescently labeled mAbs against CD4, CD25, CD127, CD45RA, CD45RO and lineage markers along with propidium iodide (PI; Life Technologies). Th were defined as PI–Lin–CD4+CD45RA–CD45RO+CD127+CD25–/low, and Tregs were defined as PI–Lin–CD4+CD127low CD25+. Cells were sorted with a BD FACSAria IITM after they had been stained with mAbs to CD25 (BC96), CD14 (HCD14), CD19 (H1B19), CD20 (2H7) and CD56 (HCD56) (BioLegend) and CD4 (S3.5), CD45RA (MEM-56), CD45RO (UCHL1) (Life Technologies).
Human Monocyte/T-Cell Cocultures
Monocytes (1 × 10⁶) were cultured with allogeneic Th or Tregs at a 10:1 ratio or Th and Tregs at 10:1:1 in 12-well plates (Corning) containing IMDM medium (Gibco) supplemented with 10% human serum, 2% FCS, 100U/ml penicillin, 100 μg/ml streptomycin, 2mM L-glutamine, sodium pyruvate, non-essential amino acids, 50 μM 2-ME, 50 ng/ml anti-CD3 (OKT3, BioLegend) and, where indicated, recombinant human IL-2 (Peprotech). GM-CSF and IL-4 derived DCs (DCGM) were generated as described (11). For imaging studies, cells were evaluated on day 4 by Leica DMIRB microscopy with a 40 × /0.55 Hoffman Modulation Contrast objective, and images were acquired using a digital ORCA-ER camera and Openlab acquisition software. Aliquots of cells were processed on day 4 with 5mM EDTA and subsequently stained with DAPI (Life Technologies) or LIVE/DEAD Fixable Aqua Dead Cell Stain Kit (Life Technologies), fluorescently labeled isotype control mAbs, or specific mAbs against CD3 (OKT3), CD2 (TS1/8), CD25 (BC96), CD45 (HI30), CD11c (3.9), CD163 (GHI/61), CD14 (61D3), CD40 (G28.5), CD80 (2D10), CD86 (IT2.2), CD274 (29E.2A3) from BioLegend; and/or HLA-DR (G46-6), CD209 (DCN46) from BD Pharmingen; and/or CD45RA (MEM-56), CD45RO (UCHL1) from Life Technologies; and/or CD127 (eBioRDR5) from eBioscience. Other cell aliquots were stimulated on day 3 with 1 μg/ml LPS for 16 h and stained with the above mAbs. Cells were analyzed on a BD LSRII flow cytometer, and FACS plots and MFIs were generated by FlowJo (Treestar). T cells were excluded according to their FSC:SSC profile and CD3/CD2 expression. For neutralizing studies, isotype control mAbs or neutralizing mAbs against CTLA-4 (5 μg/ml; BioLegend), IL-10 (2 μg/ml) or TGFβ (2 μg/ml; R&D Systems) were added at the initiation of culture. Transwell experiments were performed using 12/24-well 0.4 μM transwell inserts (Corning) under the indicated conditions. Flow cytometry analysis and FACS sorting were performed at Stanford Blood Center Flow Cytometry Lab.
Mixed Leukocyte Reaction (MLR)
CD14+ monocytes were cultured as indicated earlier and stimulated with 1 μg/ml LPS on day 3. After 18 h, cells were washed 3x in PBS and HLA-DR+CD2– DCs were purified by FACS and incubated with allogeneic naïve CD4+ T cells (105/well) at a DC to T cell ratio of 1:2 in the presence or absence of 2 μg/ml anti-TGFβ. The CD4+ T cells for these assays were purified from PBMCs using a RosetteSep CD4+ Human T cell Isolation Kit (Stem Cell Technologies) followed by magnetic purification (>95% CD2+CD4+CD45RA+ cells by flow cytometry) using a Naïve CD4+ T Cell Isolation Kit II (Miltenyi Biotec) and subsequently labeled with CFSE. After 6 days, responder CD4+ T cells were analyzed for CD25 and FoxP3 expression. CD2+CD4+CD25+CFSE– cells were further isolated by FACS and cocultured with 105 CFSE labeled allogeneic CD45RA+CD4+ naïve responder T cells in a new MLR with irradiated autologous DCs (5 × 10⁴), which had been purified with human CD11c microbeads (Miltenyi) and anti-CD3 (0.5 ng/ml, plate-bound).
Luminex Assays
Human Luminex 63-plex assays were performed by the Human Immune Monitoring Core at the Stanford Institute for Immunity, Transplantation and Infection. Samples were run in duplicate, and data were analyzed with GraphPad Prism6 (GraphPad-PRISM, Inc). Error bars represent SEM. Statistical differences for the mean values are indicated as follows: ∗P < 0.05; ∗∗P < 0.001; ∗∗∗P < 0.0001; ns, not significant.
Microarray Analysis
DCTh, DCReg, MΦTreg and DCGM were sorted on a FACSAria (BD) and RNA was extracted with an RNeasy Micro Kit (Qiagen). Total RNA samples were sent to Stanford Functional Genomics Facility and microarray was performed on GeneChip Human Gene 2.0 ST Array from Affymetrix. Microarray data were analyzed using the oligo (13) and annotated with data base hugene20sttranscriptcluster.db (14) in Bioconductor. limma package (15) was applied to identify the differentially expressed genes among cell populations. P-values were adjusted with false discovery rate (FDR) and genes with FDR adjusted P value < 0.05 were selected to be differentially expressed genes. Principal component analysis on the differentially expressed genes was performed using prcomp in R and plotted with ggplot2 package (version 2.2.1) (16). Heatmaps were generated using unsupervised clustering in the pheatmap package (version 1.0.8) (17). Biological functional gene ontology analysis was done with topGO (18). All the above data analyses were performed in R (version R 3.3.21). Pairwise gene set enrichment analyses (GSEA) were applied for assessment of the similarity of DCTh, DCReg, MΦTreg and DCGM with the well-defined reference gene signatures by pairwise transcriptomes comparison. GSEA was done using Bubble Map module of Bubble GUM version 1.3.19 (19). The cell-specific gene fingerprints from previous published reports were selected as references: six gene sets of human DC subsets (DC1, DC2, DC3, DC4, DC5, DC6) from Science (20); one gene set of Macrophage reference gene signature generated by Segura et al. (21); and another gene set of VITD3 DCs (22). The BubbleMap returned a bubble map of pairwise GSEA results to show enrichment of a given gene set (reference) in a pairwise comparison. The normalized enrichment score (NES) and corrected P-value (FDR) of each bubble were also generated (19). Enhanced Volcano and ggplot2 were used for volcano plots using gene expression and adjusted p value.
Processing of Human Colon Cancer Samples
Fresh CRC tissues were obtained from the Stanford Tissue Bank in accordance with IRB protocol 6304 following surgical resection of primary tumors. Some of the tissues were minced with surgical scissors and transferred to 15ml scintillation vials containing 2 mg/ml collagenase type IV (Worthington Biochemical Corporation) and 50 U/ml DNase I (Roche) for 30min at 37°C with constant agitation. Samples were subsequently filtered through a 70 μm filter and resuspended in PBS containing 2% human serum and 2mM EDTA. CD4+ T cells were isolated from the cell suspension with CD4 MicroBeads (Miltenyi Biotec) and further purified by FACS. DCs were FACS-sorted from the CD4 negative population. Samples of the same tissues were sectioned, stained and analyzed as described. The primary antibodies used were rabbit polyclonal anti-CD14 (1:200; Atlas), mouse monoclonal anti-FoxP3 (1:100) and rabbit anti-mouse T-bet (1:100; Santa Cruz Biotechnology).
Human blood collection to obtain PBMCs and CRC collection were approved by the Stanford Research Compliance Office and performed according to institutional guidelines under Stanford IRB protocol 6304, “Dendritic and T cell Signaling in Gastrointestinal Cancer.” All sequencing data are publicly available from NCBI’s Gene Expression Omnibus at GEO accession GSE148114.
See Supplemental Experimental Procedures for transmission electron microscopy, endocytosis and phagocytosis, CFSE labeling, and RNA isolation and quantitative RT-PCR.
Results
In the Presence of Both Tregs and Th, Human Monocytes Differentiate Into Regulatory DCs That Induce CD4+ FoxP3+ Tregs
To test our hypothesis, freshly isolated CD14+ monocytes from the blood of healthy donors were cultured with Th alone, Tregs alone or with Tregs and Th cells at a ratio of 1:1. Prior to culture, each population had been sorted to > 99% purity (Supplementary Figure S1A) and the Tregs shown to suppress Th proliferation (Supplementary Figure S1B). After 3 days of culture, the myeloid cells (HLA-DR+CD2–) were sorted (>99% purity), activated with LPS and incubated for 6 days with CFSE-labeled naïve CD4+ T cells. While monocytes that had been cultured with Tregs and Th at 1:1 elicited weaker CD4+ T cell proliferative responses (Figures 1A–C) compared with those cultured with Th or Tregs alone, a significant proportion of T cells that proliferated developed into CD25highFoxP3high Tregs (Figures 1D–F). In contrast, monocytes cultured with Th or Tregs alone failed to induce CD25highFoxP3high Tregs (Figures 1D–F), although Th cultured monocytes induced vigorous CD4+ T cell proliferation and CD25 expression. Treg differentiation was dependent on TGFβ, but not IL-10, since addition of neutralizing anti-TGFβ antibody, but not neutralizing anti-IL-10 antibody, during the MLR abrogated FoxP3 expression by proliferating T cells (Figure 1G).
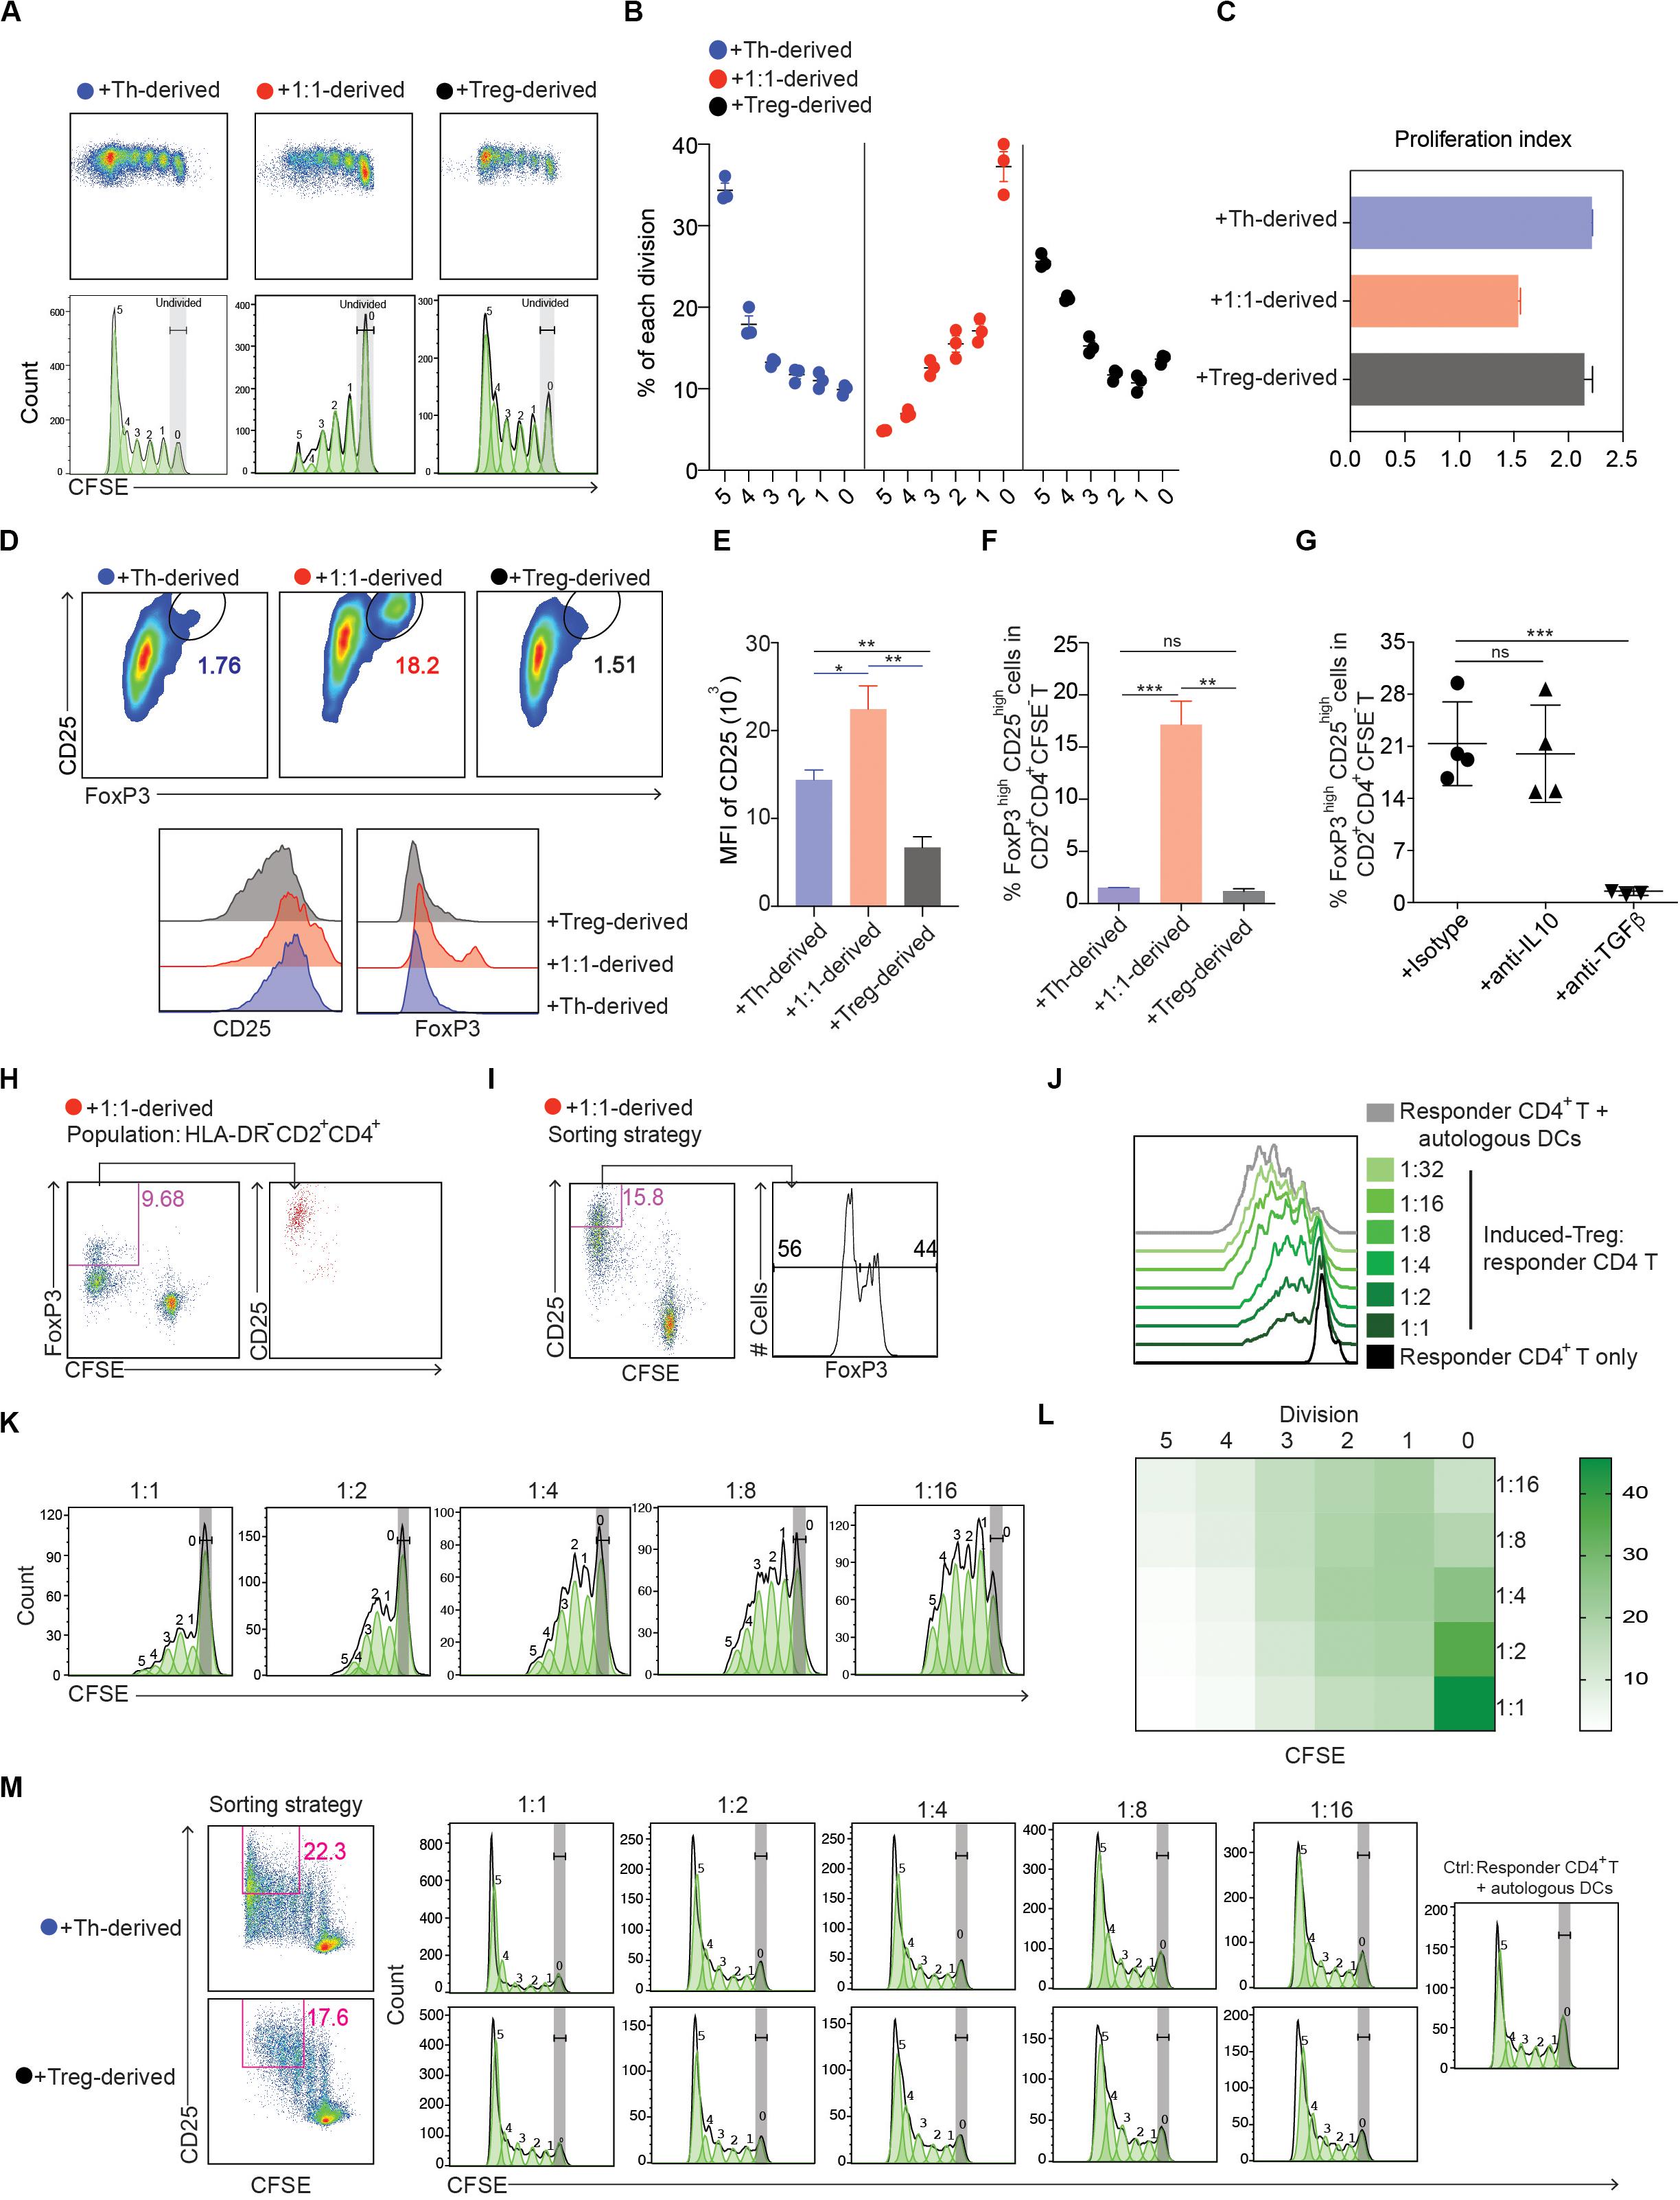
Figure 1. Human monocytes cultured with defined mixtures of Tregs and Th differentiate into cells that induce immune suppressive CD4+FoxP3+ Tregs. (A) Dotplots and histograms showing CFSE dilution of CD4+ T cells cultured with monocyte-derived cells from the CD4+ T cell-monocyte cultures. (B) Graphical representation of statistical analysis of CFSE– cell percentage (mean ± SEM, n = 3) obtained from (A). Similar results were obtained in two additional experiments. (C) Proliferation index calculated by Flowjo. (D) Expression of CD25 vs. FoxP3 in CFSE–CD2+CD4+ cells. Numbers adjacent to gated areas indicate percentage of gated cells. (E,F) Graphical representation of statistical analysis of the MFI of CD25 and the percentage of CD25highFoxP3high cells in CD2+CD4+CFSE– proliferated T cells. (G) CD14+ monocytes were cultured with Tregs and Th at a ratio of 10:1:1 in the presence of anti-IL-10, 2 μg/ml; anti-TGFβ, 2 μg/ml or isotype control antibody, 5 μg/ml. After 72 h, 1 μg/ml LPS was added, and 16 h later FACS-purified myeloid cells (DR+CD2–) were further cultured with MACS sorted CFSE-labeled naïve allogeneic CD4+ T cells. The percentage of FoxP3high cells in CD2+CD4+CFSE– cells was determined 6 days later. Mean ± SEM, n = 5. Similar results were obtained in two additional experiments. *P < 0.05; **P < 0.001; ***P < 0.0001; ns, not significant. Data were analyzed with one-way ANOVA, followed by Dunnett’s test for multiple comparisons. (H,I) 105 CFSE labeled CD45RA+CD4+ T cells were cultured with 5 × 10⁴ allogeneic myeloid cells purified from 3-day cultures of monocytes, Tregs and Th at 10:1:1. After 6 days the cells were analyzed by flow cytometry. Responder CD4+ T cells were gated as CD2+CD4+. (H) CFSE–FoxP3+ DCReg-induced Tregs were analyzed for CD25 expression. (I) CD25 expression was used as the basis for sorting CD2+CD4+CFSE– cells. Percentages of FoxP3– and FoxP3+ cells in CD2+CD4+CFSE–CD25+ cells are shown. (J–M) CD2+CD4+CFSE–CD25+ cells induced by 1:1 (Th:Treg), Th or Treg-derived myeloid cells were purified by FACS and cultured in a new MLR containing 105 CFSE labeled allogeneic CD45RA+CD4+ cells and irradiated DCs (5 × 10⁴) and anti-CD3 (0.5 ng/ml, plate-bound). After 84–90 h, proliferation of CFSE-labeled naïve responder CD4+ T cells was analyzed by flow cytometry. Cells were gated as DAPI–CD2+CD4+. Data are representative of 2 independent experiments. (J–L) Dose-dependent suppression of induced Tregs on responder CD4+ T cells. (L) Heatmap of statistical analysis of the responder CD4+ T cell proliferation as indicated by CFSE in each division defined by Flowjo. Mean ± SEM, n = 3. Similar results were obtained in both experiments.
To confirm that the FoxP3+ T cells induced from monocytes cultured with Th and Tregs at 1:1 were immunosuppressive, we FACS purified CD25highCFSE– T cells (∼50% FoxP3+) (Figures 1H,I) and tested their ability to inhibit the activation of naïve CD4+ T cells (Supplementary Figure S2) stimulated with autologous DCs and anti-CD3 mAb. The purified CD25highCFSE–CD4+ T cells suppressed naïve T cell proliferation in a dose-dependent manner (Figures 1J–L), whereas purified CD25+CFSE–CD4+ T cells obtained from the MLRs containing Th or Tregs alone had no suppressive effect (Figure 1M). Collectively, these data demonstrate that in the presence of Th, Tregs from healthy donors promote the formation of CD4+FoxP3+ Treg-inducing myeloid cells from monocytes.
Regulatory DCs Derived From Monocytes Following Their Culture With Tregs and Th Are Phenotypically and Functionally Distinct From DCTh and MΦTreg
Given the stark functional differences between the cells derived from monocytes cultured with Th alone and those cultured with mixtures of Th and Tregs, we decided to study these populations in greater detail. Consistent with a previous study (8), monocytes that had been cultured with Th alone developed prominent dendrites within 24h and these DC-like changes peaked at day 4; hence, we refer to these cells as DCTh. The addition of Tregs to fresh cultures of monocytes and Th, at a ratio of Th:Treg of 1:1, resulted in the formation of cells with fewer and shorter dendrites that were otherwise similar in appearance to the DCTh. Based on their DC-like appearance and FoxP3+ Treg-inducing capacity (Figures 1A–F), we refer to these cells as DCReg (Figure 2A). Examination of the cells by electron microscopy confirmed that both DCTh and DCReg had typical DC morphology with large nuclei, dense cytoplasm and numerous dendrites. In contrast, monocytes cultured with Tregs in the absence of Th developed numerous intracellular vesicles and a small nucleus (Figure 2B), characteristic of classical MΦ, and we refer to these cells as MΦTreg.
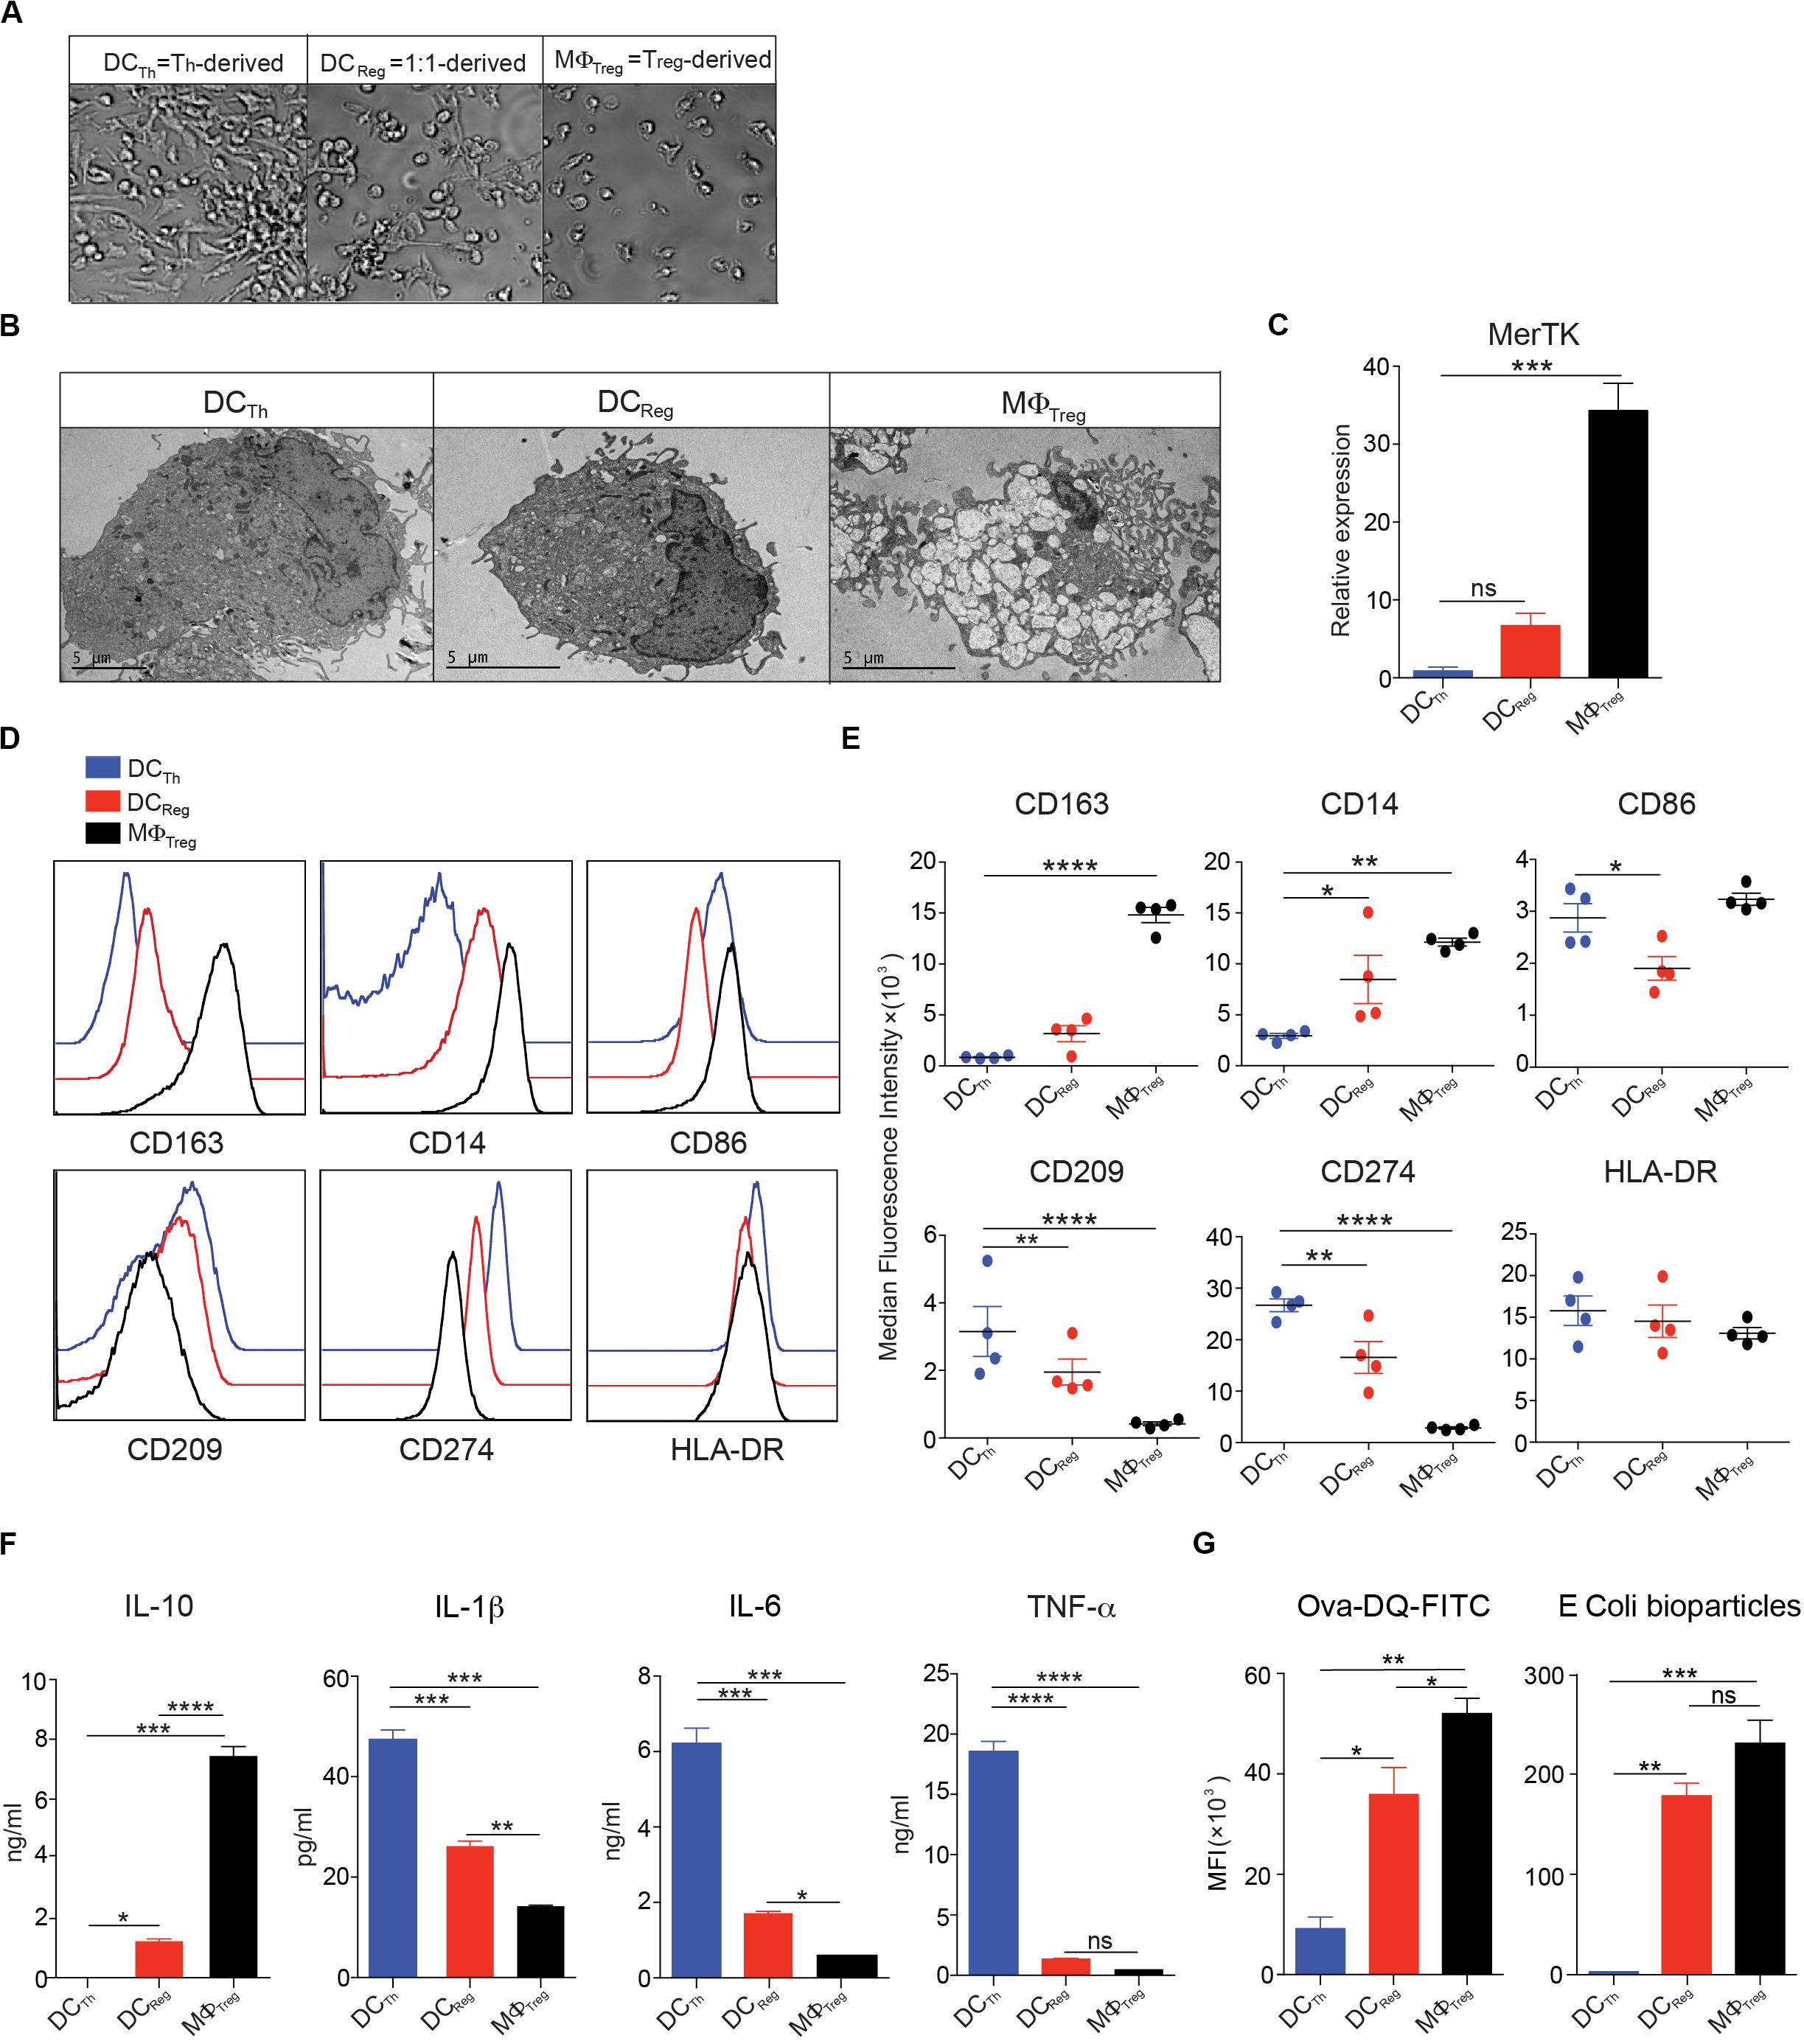
Figure 2. Monocytes cultured with Tregs and Th differentiate into DC-like cells with unique morphology and surface phenotype. (A–G) In the presence of anti-CD3 mAb, CD14+ monocytes were cultured with Tregs (10:1) or memory Th (10:1) alone, or with Tregs and Th at a 10:1:1 ratio. (A) Images were captured with a bright-field DIC microscope on day 4 of culture; original magnification 100X. (B) Transmission electron micrographs of FACS sorted HLA-DR+CD2– cells on day 4 of culture. (C) MerTK in FACS purified HLA-DR+CD2– cells assayed by real-time PCR on day 4 of culture. (D,E) Flow cytometric analysis of monocyte-derived HLA-DR+CD2– cells on day 4 of culture. (F) On day 4, HLA-DR+CD2– cells were purified by FACS, and 200,000 cells were incubated in 200 μl culture medium containing 1 μg/ml LPS. After 16h, cell-free supernatants were assayed by Luminex, and IL-10, IL-1β, IL-6, and TNFα levels are shown. (G) Left: On day 3, 1 μg/ml LPS was added and 16h later cells harvested from the cocultures were incubated with OVA-DQ for 60 min at 37°, and HLA-DR+CD2– cells were analyzed for processing of OVA. MFIs of green signal are shown. Right: Cells harvested from the cocultures were incubated with PE-conjugated E. coli bioparticles for 60 min at 37°C. MFIs of PE in HLA-DR+CD2– cells are shown. Mean ± SEM of 2 independent experiments and > 8 donors. Data are representative of at least 3 independent experiments. *P < 0.05, **P < 0.01, ***P < 0.001, ****P < 0.0001; ns, not significant. Data were analyzed with one-way ANOVA, followed by Dunnett’s test for multiple comparisons.
We next analyzed the molecular phenotype of each cell population as an additional means to assess the differences and similarities between DCReg, DCTh and MΦTreg. As expected, MΦTreg expressed high transcript levels of the MΦ-specific receptor MerTK (23–25) (Figure 2C) and high levels of CD14 and CD163 proteins. In contrast, DCTh expressed low levels of these molecules (Figures 2D,E). DCReg exhibited low expression of MerTK and CD163 and intermediate expression of CD14 and CD209 (Figures 2D,E).
To analyze the cytokine secretion profiles of DCReg, DCTh, and MΦTreg, each population was stimulated overnight with LPS, and selected cytokines were measured in the supernatants. LPS-stimulated DCReg secreted nearly 1000-fold more of the anti-inflammatory cytokine IL-10 than DCTh, but less than MΦTreg (Figure 3F). Conversely, DCReg produced significantly less IL-1β, IL-6 and TNFα than DCTh but more than MΦ (Figure 2F). Real-time PCR analysis of FACS purified myeloid cells from these cultures indicated that the RNA expression profiles matched the cytokine secretion patterns, with DCReg expressing mainly IL-10 (Supplementary Figure S3 and Figure 4D) and only small amounts of inflammatory cytokines (Supplementary Figure S3).
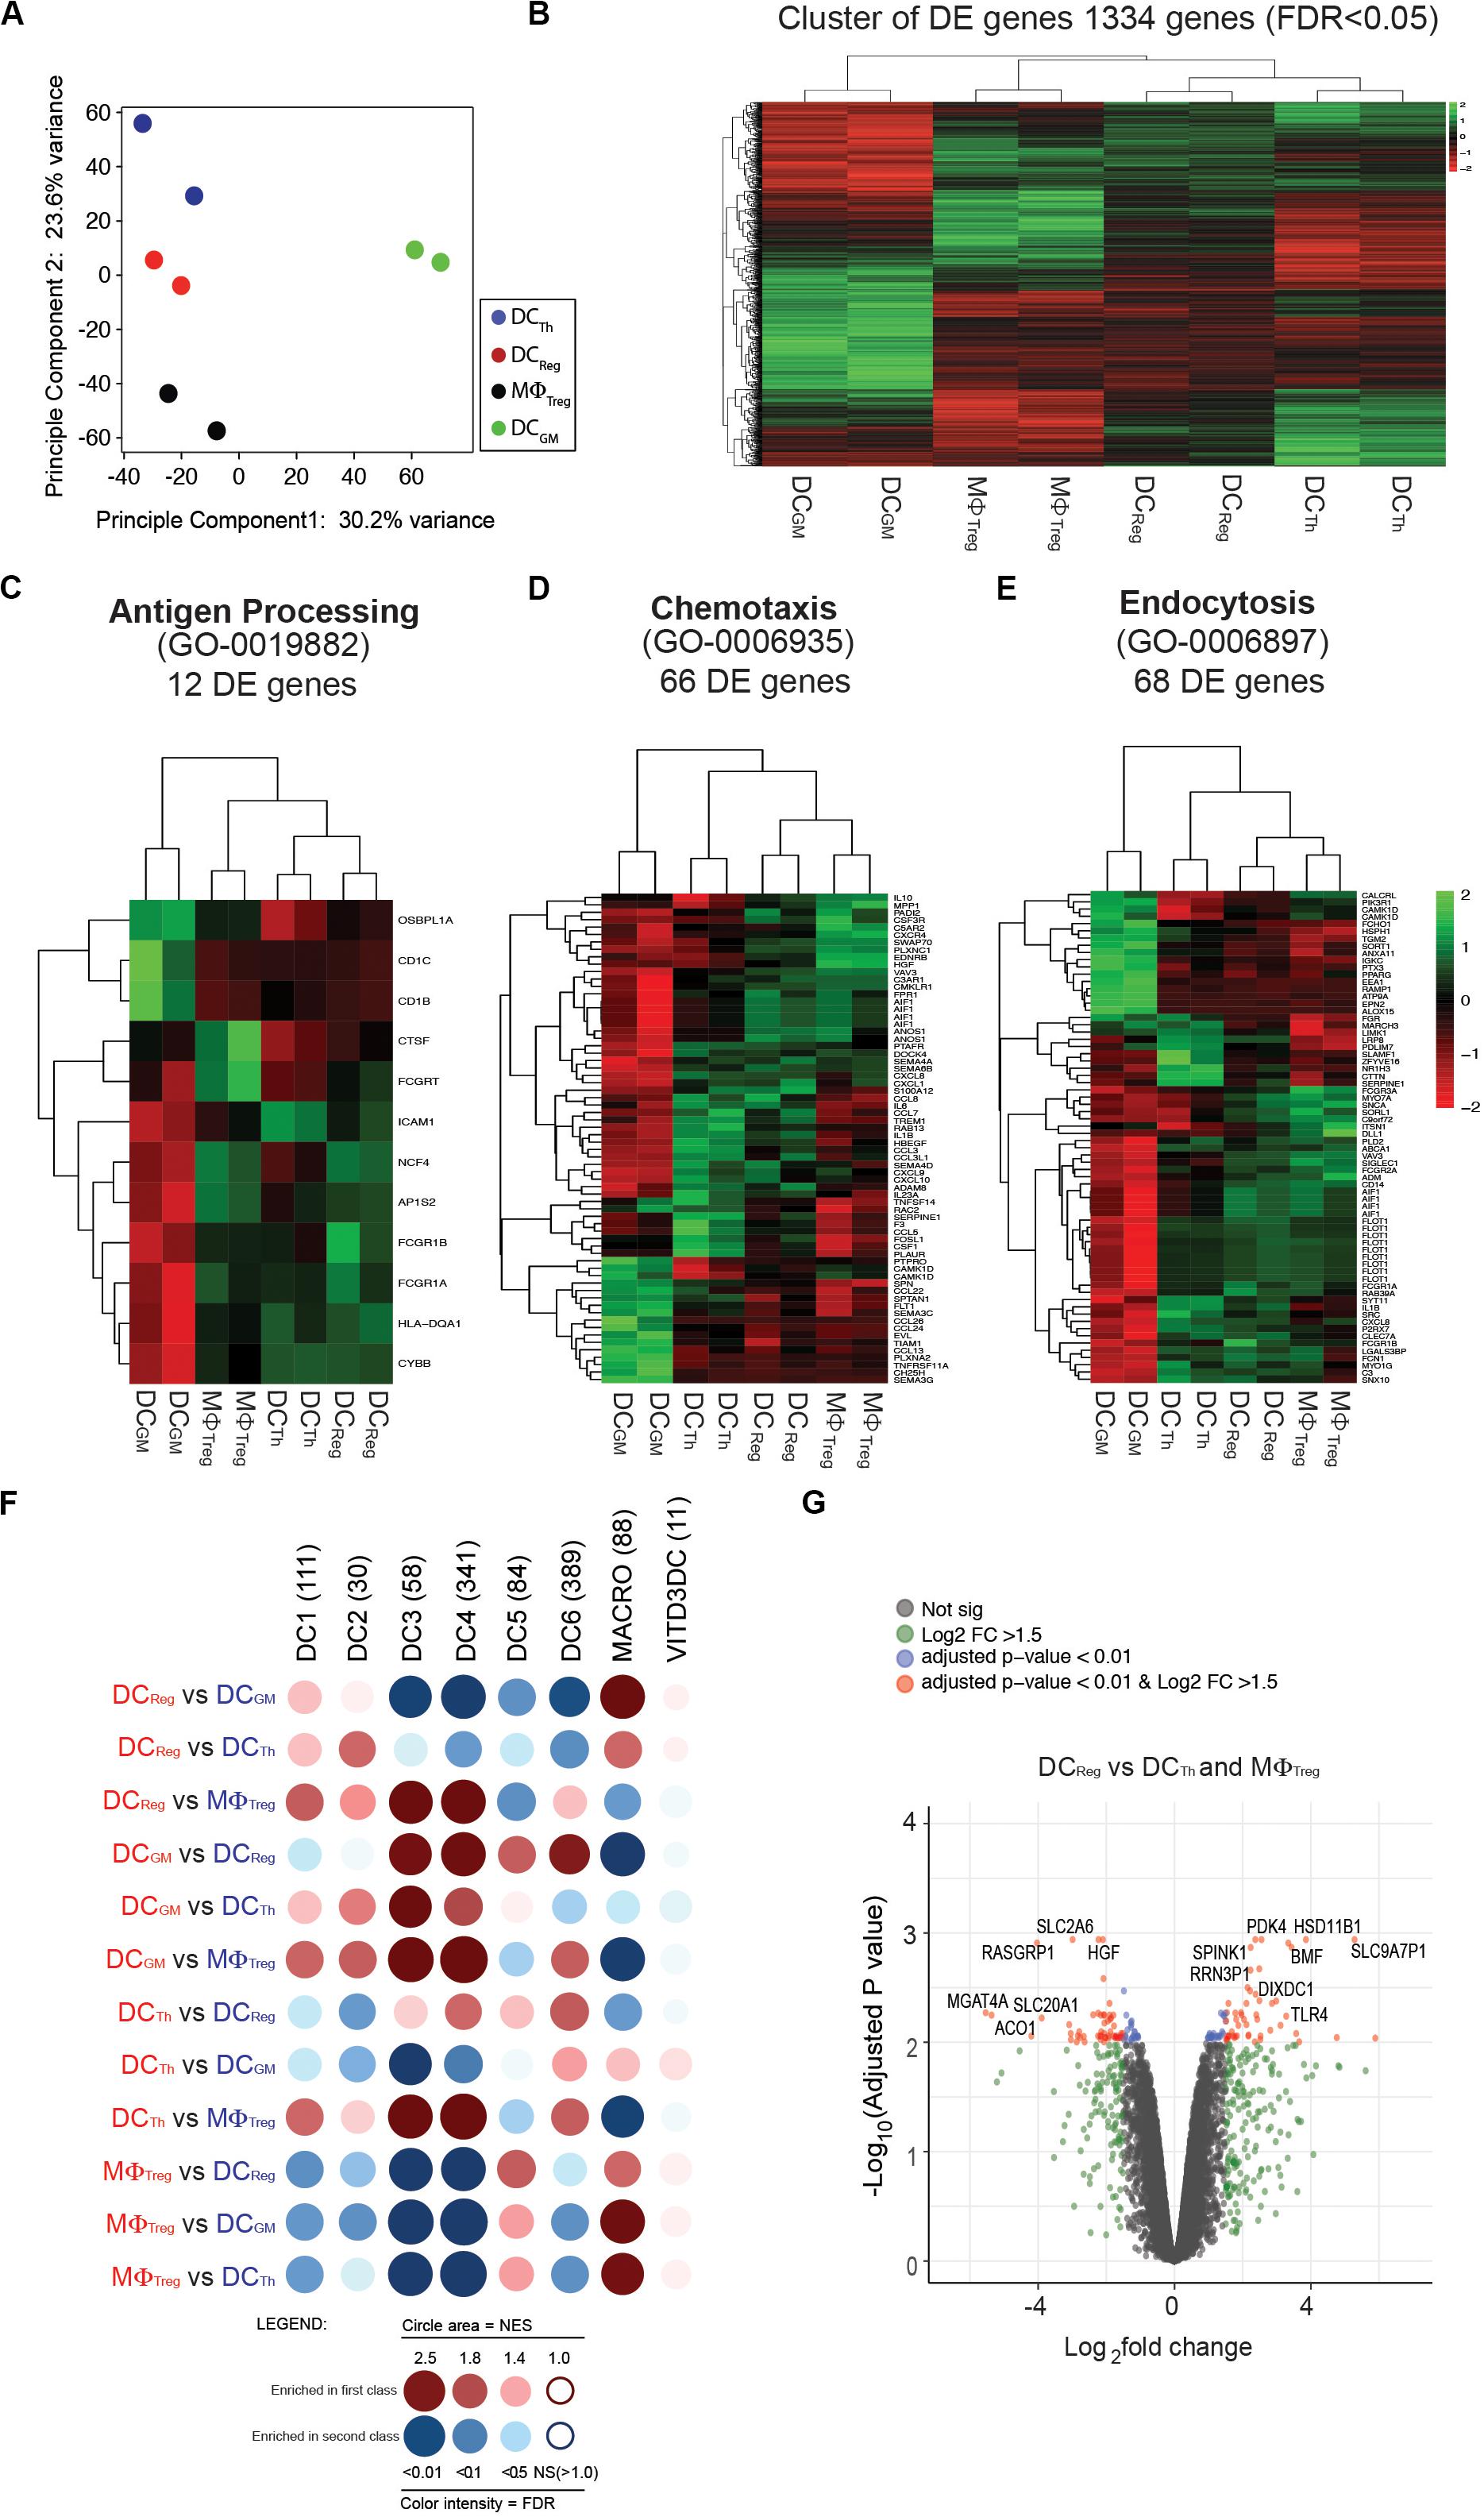
Figure 3. Transcriptomic profile of DCReg further distinguishes these cells from DCTh, MΦTreg and DCGM. (A) Principal component analysis (PCA) for DCTh, DCReg, MΦTreg and DCGM from each sample based on the mean expression of the genes with variable expression. (B) Cluster analysis of a total of 1334 differentially expressed genes [false discovery rate (FDR) < 0.05]. (C) Hierarchical clustering using sets of differentially expressed genes corresponding to the gene ontology biological functions of antigen processing (53 genes), (D) chemotaxis (73 genes), or (E) endocytosis (100 genes). (F) GSEA of the gene signature (GeneSet) of DCTh, DCReg, MΦTreg and DCGM. GSEA results for pairwise comparisons between human blood CD141+Clec9A+ (labeled as DC1), CD1c_A (DC2), CD1c_B (DC3), CD141–CD1c– DCs (DC4), pDCs (DC6), DC5/AS DCs (DC5), macrophage (MACRO), and VITD3DC gene sets. Dot blot representation of all pairwise GSEA comparisons. GeneSets comprise different number of genes (n). Dot color corresponds to the font color of the population in which the GeneSet is enriched. The dot area is proportional to the NES (Normalized enrichment score) which varies from 1 (no enrichment) to a maximum of 5. The color intensity is indicative of the FDR statistical q value, which estimates the likelihood that the enrichment of the GeneSet represents a false-positive finding. (G) Volcano plot representation of microarray data. DCReg vs. DCTh and MΦTreg were plotted according to the log2 fold change (X axis) and log10 adjusted p-value (Y axis). Log2FC represents the absolute value of log2 fold change. Log2FC and p value was calculated with the Benjamini-Hochberg (BH) method.
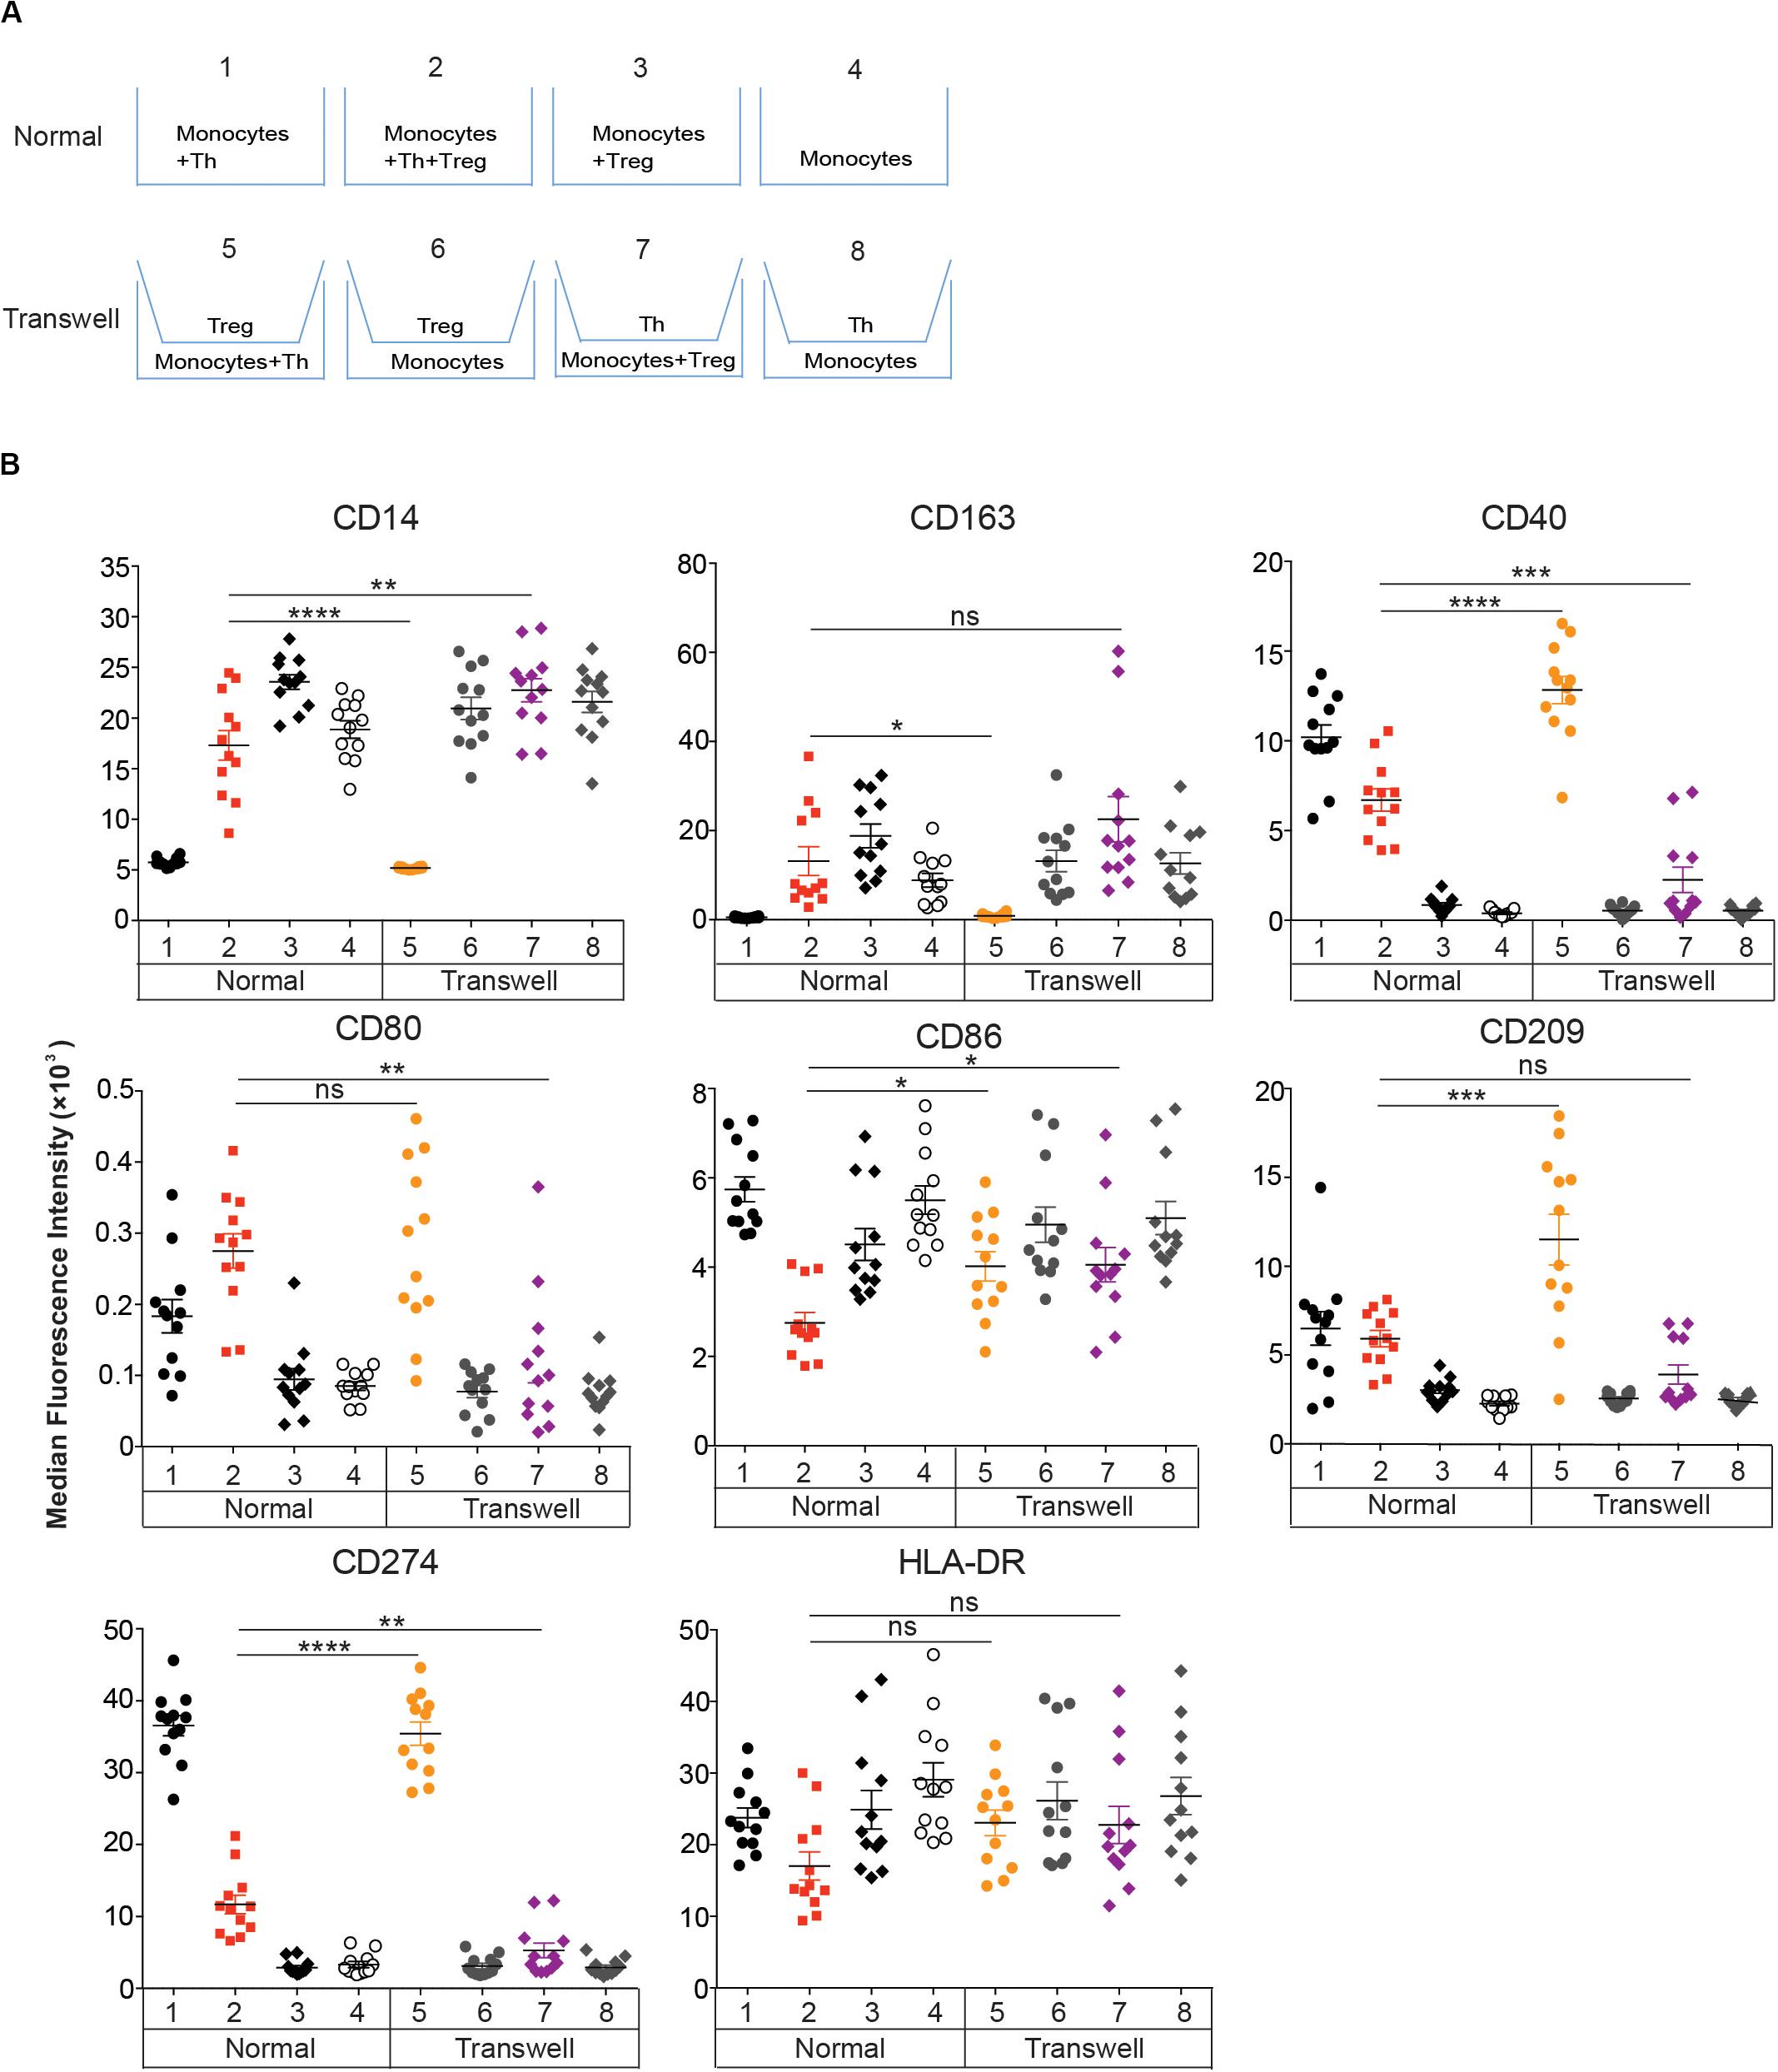
Figure 4. Effect of Tregs on DCReg differentiation requires cell-cell contact. (A,B) CD14+ monocytes were cultured for 4 days with Tregs or memory Th alone, or with Tregs and Th together at a 1:1 ratio as in Figure 2. (A) Standard and transwell cocultures were performed as described in section “Materials and Methods.” (B) MFIs of DC-associated molecules are shown after excluding CD2+HLA-DR– T cells. Mean ± SEM of 12 donors. Data are representative of 3 independent experiments. *P < 0.05, **P < 0.01, ***P < 0.001, ****P < 0.0001, ns, not significant. Data were analyzed with unpaired T-test.
To assess the endocytic capacity of these cells, we incubated each population with DQ-OVA, a self-quenched conjugate of OVA that emits green fluorescence after receptor-mediated internalization and proteolysis (26, 27). After a 60 min incubation, MΦTreg had the highest level of DQ-OVA (green fluorescence) followed by DCReg and DCTh (Figure 2G; left). Furthermore, when the phagocytic activity of these cells was assessed on the basis of E. coli particle uptake, DCReg displayed strong particle uptake, second only to that of MΦTreg (Figure 2G; right).
Taken together, these results indicate that the phenotype, cytokine secretion profile and endocytic/phagocytic capacity of DCReg are distinct from those of DCTh and MΦTreg.
DCReg Have a Unique Transcriptome
The distinctive morphology, phenotype and functions of DCReg prompted us to compare the gene expression profiles of DCReg and DCTh, MΦTreg and classical moDCs derived from monocytes cultured with GM-CSF and IL-4 (DCGM). Principal component analysis revealed that DCTh, DCReg and MΦTreg had distinct transcriptomes from that of DCGM (Figure 3A). The first principal component accounted for 61% of the overall variance and clearly separated the DCGM population from the other three populations. The DCTh, DCReg, and MΦTreg separated into divergent populations based on the second principal component, which accounted for 30.7% of the variance in the dataset (Figure 3A). Next, we analyzed the 1334 differentially expressed genes (FDR adjusted p-values, P < 0.05) between DCReg, DCTh, MΦTreg and DCGM. Consistent with principal component analysis, DCGM differed from DCReg, DCTh, and MΦTreg (Figure 3B). DCReg exhibited a transcriptome that was intermediate between that of DCTh and MΦTreg and closer to that of DCTh than MΦTreg (Figure 3B), which is consistent with their DC morphology (Figure 2B) and cell-surface phenotype (Figures 2D,E).
We further analyzed the three myeloid populations by selecting differentially expressed genes corresponding to the biological functions of antigen processing (GO 0019882) (Figure 3C), chemotaxis (GO 0006935) (Figure 3D), and endocytosis (GO 0006897) (21) (Figure 3E). Hierarchical clustering of these gene sets showed that the antigen-processing signature of DCReg was more closely related to that of DCTh than MΦTreg (Figure 3C). Also, DCs or MΦ generated from T cell-monocyte cocultures were distinct from DCGM in their antigen-processing signature (Figure 3C), which is consistent with their respective total transcriptome analysis (Figure 3B). By contrast, the chemotaxis (Figure 3D) and endocytosis (Figure 3E) transcriptomic pathways of DCReg were more similar to those of MΦTreg than to DCTh, and distinct from those of DCGM (Figures 3D,E).
Recently, single-cell RNA sequencing (scRNA-seq) led to the identification of six human DC subsets (20): DC1 (CD141+Clec9A+), DC2 (CD1c+_A), DC3 (CD1c+_B), DC4 (CD1c–CD141–CD11c+), DC5/AS DCs (AXL+ SIGLEC6+) and DC6 (pDCs). To address whether and where DCReg fit in this new DC taxonomy, we used the method of Segura et al. (21) to compare the gene signatures of DCReg, DCTh, MΦTreg and DCGM with those of these six DC subsets and macrophages (MACRO) (21) (Figure 3F). To display the data, we transformed the information for each pairwise gene set enrichment analysis (GSEA) (12) into a dot whose color corresponds to the cell in which the gene signature was more represented. The dot area size is proportional to the NES (Normalized Enrichment Score), and the color intensity indicates the p-value (a darker, larger dot indicates a stronger enrichment). The results show that DCReg were relatively enriched for a DC1 (CD141+Clec9A+) signature when compared with MΦTreg, and a DC2 (CD1c+_A) signature when compared with DCTh. As expected, compared with DCReg and DCTh, MΦTreg were more like conventional macrophages (MACRO) (21). Interestingly, DCTh were also enriched for the DC6 (pDCs) signature when compared with the other three populations. MΦTreg, DCTh, DCReg and DCGM all showed variable similarity to DC1-4 and DC6 (Figure 3F), in contrast to 1,25-dihydroxyvitamin D3 (1,25(OH)2D3) induced tolerogenic DCs (VITD3DC) (12, 22) (Figure 3F). When analyzing differentially expressed genes (DEG) between tolerogenic DCReg and other T cell-induced DCTh and MΦTreg, we found that TLR4 was overexpressed in the DCReg (Figure 3G). Interestingly, the DCReg maintained their surface phenotype (Supplementary Figure S4), even when subjected to subsequent stimulation with LPS.
These results confirm that DCs differentiated from monocytes in the presence of CD4+ T cells are transcriptomically distinct from DCs differentiated from monocytes with GM-CSF and IL-4 (DCGM), and further, that DCReg are distinct from DCTh.
Cell Contact, TGFβ, IL-10, and CTLA-4 Mediate DCReg Formation
To investigate whether direct contact between monocytes and Tregs or Th is required for DCReg differentiation, we cultured these populations on opposite sides of 0.4 μm transwell membranes, which prevent cell-cell interaction but permit diffusion of soluble molecules (Figure 4A). Separation of Tregs from monocytes and Th resulted in the induction of DCTh-like cells (Figure 4B, Transwell 5). However, when Th were separated from monocytes and Tregs, MΦ-like cells were induced (Figure 4B, Transwell 7). Monocytes cultured in transwells and separated from Th or Tregs (Figure 4B, Transwell 6&8) retained their monocyte-like phenotype. Moreover, when monocytes were cultured in transwells and separated from both Th and Tregs, the monocytes became MΦTreg-like (Supplementary Figure S5). Thus, both Tregs and Th require direct contact with monocytes to mediate their effects on DC differentiation and the contribution of activated Th cells could not be replaced by exogenous GM-CSF and IL-4 (Supplementary Figure S5).
We next sought to determine whether Treg-derived molecules that are known to impact DC function in other settings are necessary for DCReg differentiation (28). DCReg induction cultures were performed in the presence of neutralizing mAbs against CTLA-4, IL-10 or TGFβ. Each of these mAbs partially prevented DCReg formation, as indicated by the increased frequency of cells exhibiting a DCTh-like morphology with more extensive dendrites in these cultures compared to cultures containing isotype control antibody (Figure 5A). When all 3 neutralizing mAbs were used simultaneously (anti-all), the resultant cell morphology was comparable to that of DCTh (Figure 5A). We also analyzed the effects of each blocking antibody individually on the expression of DC-associated surface molecules. Blocking TGFβ affected the expression of several of these molecules, but only after blocking all 3 molecules was the surface phenotype of the resulting DCs comparable to that of DCTh (Figure 5B). These mAbs also altered surface marker expression in MΦ induction cultures (Supplementary Figure S6). Taken together, these findings suggest that TGFβ, IL-10 and CTLA-4 govern the formation of DCReg.
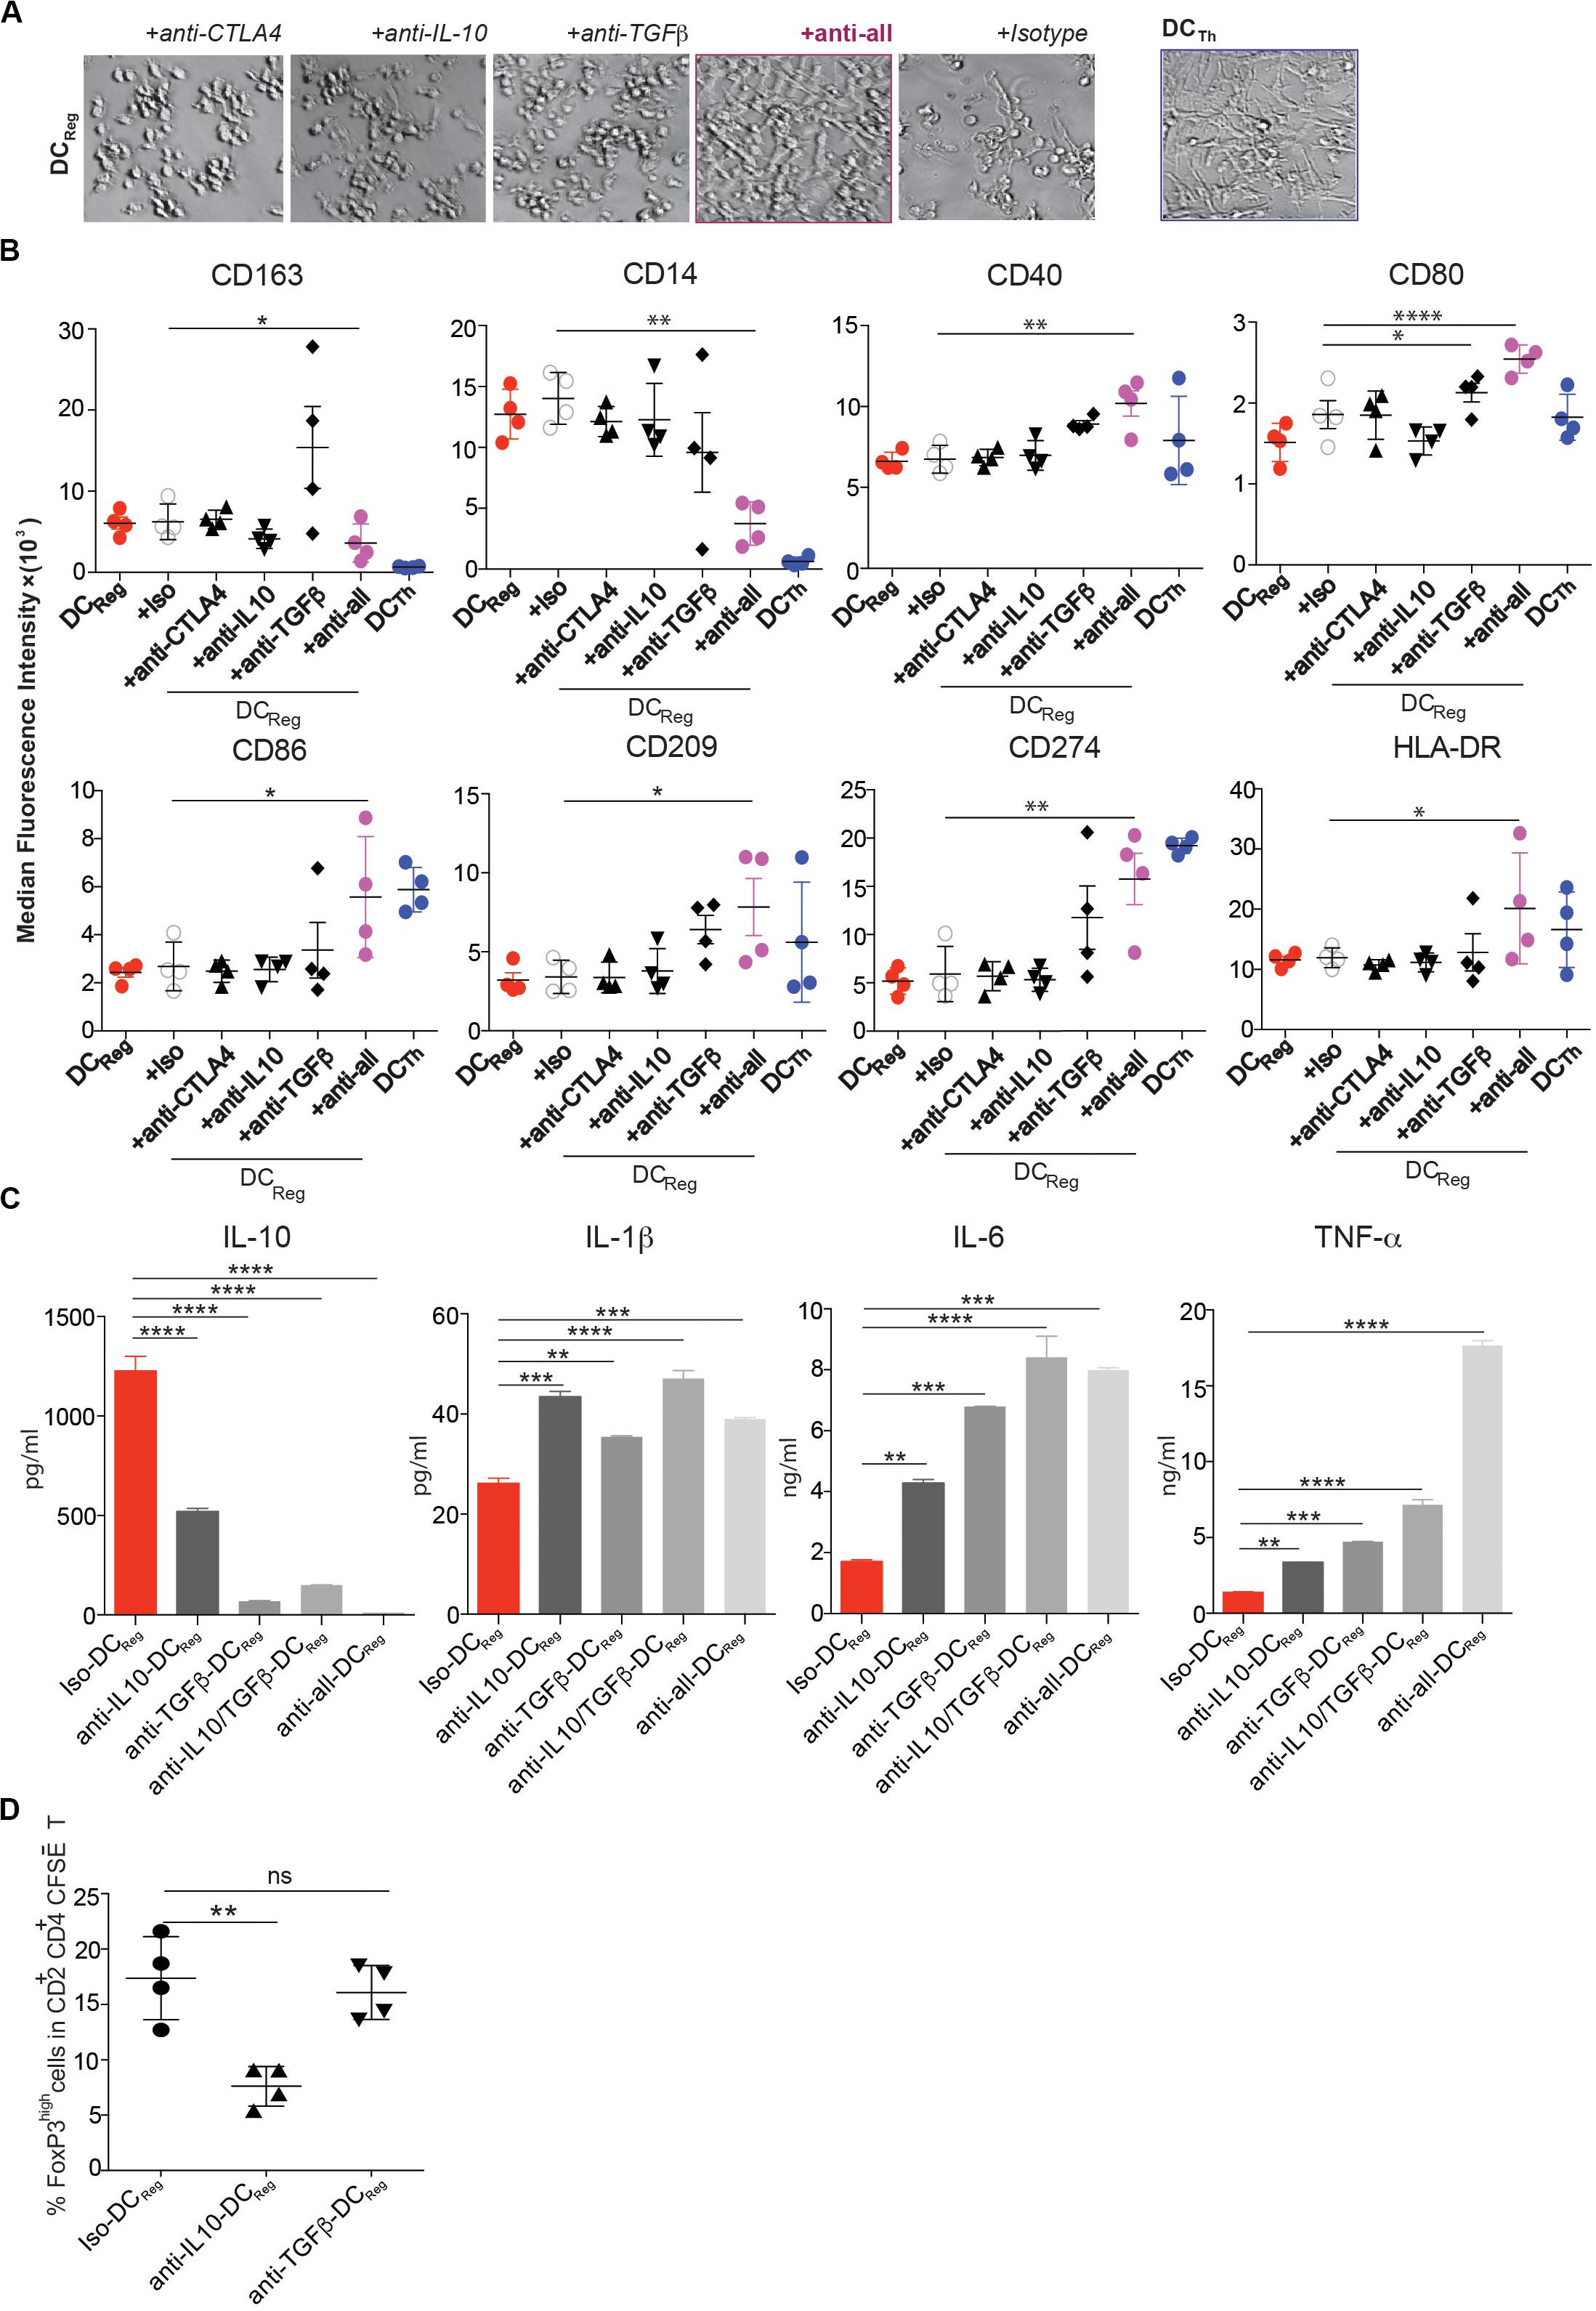
Figure 5. Blockade of CTLA-4, IL-10 and TGF-β prevents DCReg differentiation. (A–D) CD14+ monocytes were cultured for 4 days with Tregs or Th alone, or with Tregs and together at a 1:1 ratio in the presence of anti-CTLA-4 (5 μg/ml), anti-IL-10 (2 μg/ml), anti-TGFβ (2 μg/ml), or a mixture of these antibodies or isotype control antibody (5 μg/ml). (A) Images were captured with a bright-field DIC microscope on day 4. Original magnification 200×. (B) MFIs of DC-associated molecules on monocyte-derived cells are shown after excluding CD2+HLA-DR– T cells. (C) On day 4, moDCs (HLA-DR+CD2– cells) from the cultures in (A,B) were purified by FACS, and 200,000 cells were cultured in 200 μl containing 1 μg/ml LPS. After 16h, IL-10, IL-1β, IL-6 and TNFα levels in the cell-free supernatants were determined by Luminex. (D) On day 3, 1 μg/ml LPS was added to selected wells, and 16h later FACS-purified DC subsets were further cultured with MACS sorted CFSE-labeled naïve allogeneic CD4+ T cells. After another 6 days, CD2+CD4+ T cells were analyzed by flow cytometry. Mean ± SEM of 4 donors. *P < 0.05, **P < 0.01, ***P < 0.001, ****P < 0.0001, ns, not significant. Data were analyzed with one-way ANOVA, followed by Dunnett’s test for multiple comparisons.
To determine the impact of TGFβ, IL-10 and CTLA-4 on the acquisition of DCReg function, we analyzed the cytokine secretion profile and Treg-inducing potential of FACS purified DCReg formed under conditions in which one or more of these factors were neutralized. Neutralization of TGFβ or IL-10 increased the expression of proinflammatory cytokines IL-1β, IL-6 and TNFα by the DCs, while decreasing their expression of IL-10 (Figure 5C). Importantly, neutralization of IL-10, but not TGFβ prevented the resultant DCs from acquiring the capacity to induce Foxp3high T cells (Figure 5D). Thus, IL-10 is required for the formation of functionally active DCReg, while functionally active DCReg utilize TGFβ to induce new FoxP3+ Tregs.
Human Colorectal Cancers (CRC) Contain DCReg, and T Cells From the Same Tumors Induce DCReg Formation From Monocytes
Since Tregs (29) and monocytes (30) are often abundant in human tumors, including CRC, where their phenotypes and functions are often altered (31), we tested the hypothesis that interactions between these cells might result in the generation of DCReg. We utilized immunohistochemistry to identify Tregs and CD14+ cells in human CRC, and found that these cells were often in close apposition to one another (Figure 6A; left), and conventional Th (T-bet+) cells were also identified in the same regions (Figure 6A; right). Flow cytometric analysis of single cell suspensions prepared from 5 CRC patients indicated that CD25+CD127low Tregs comprised approximately 25% of total CD45+CD2+CD4+ T cells (Figure 6B), which is similar to that reported previously for CRC (20) and much higher than in surrounding uninvolved tissue (Supplementary Figure S7) or healthy donor peripheral blood (Figure 6C).
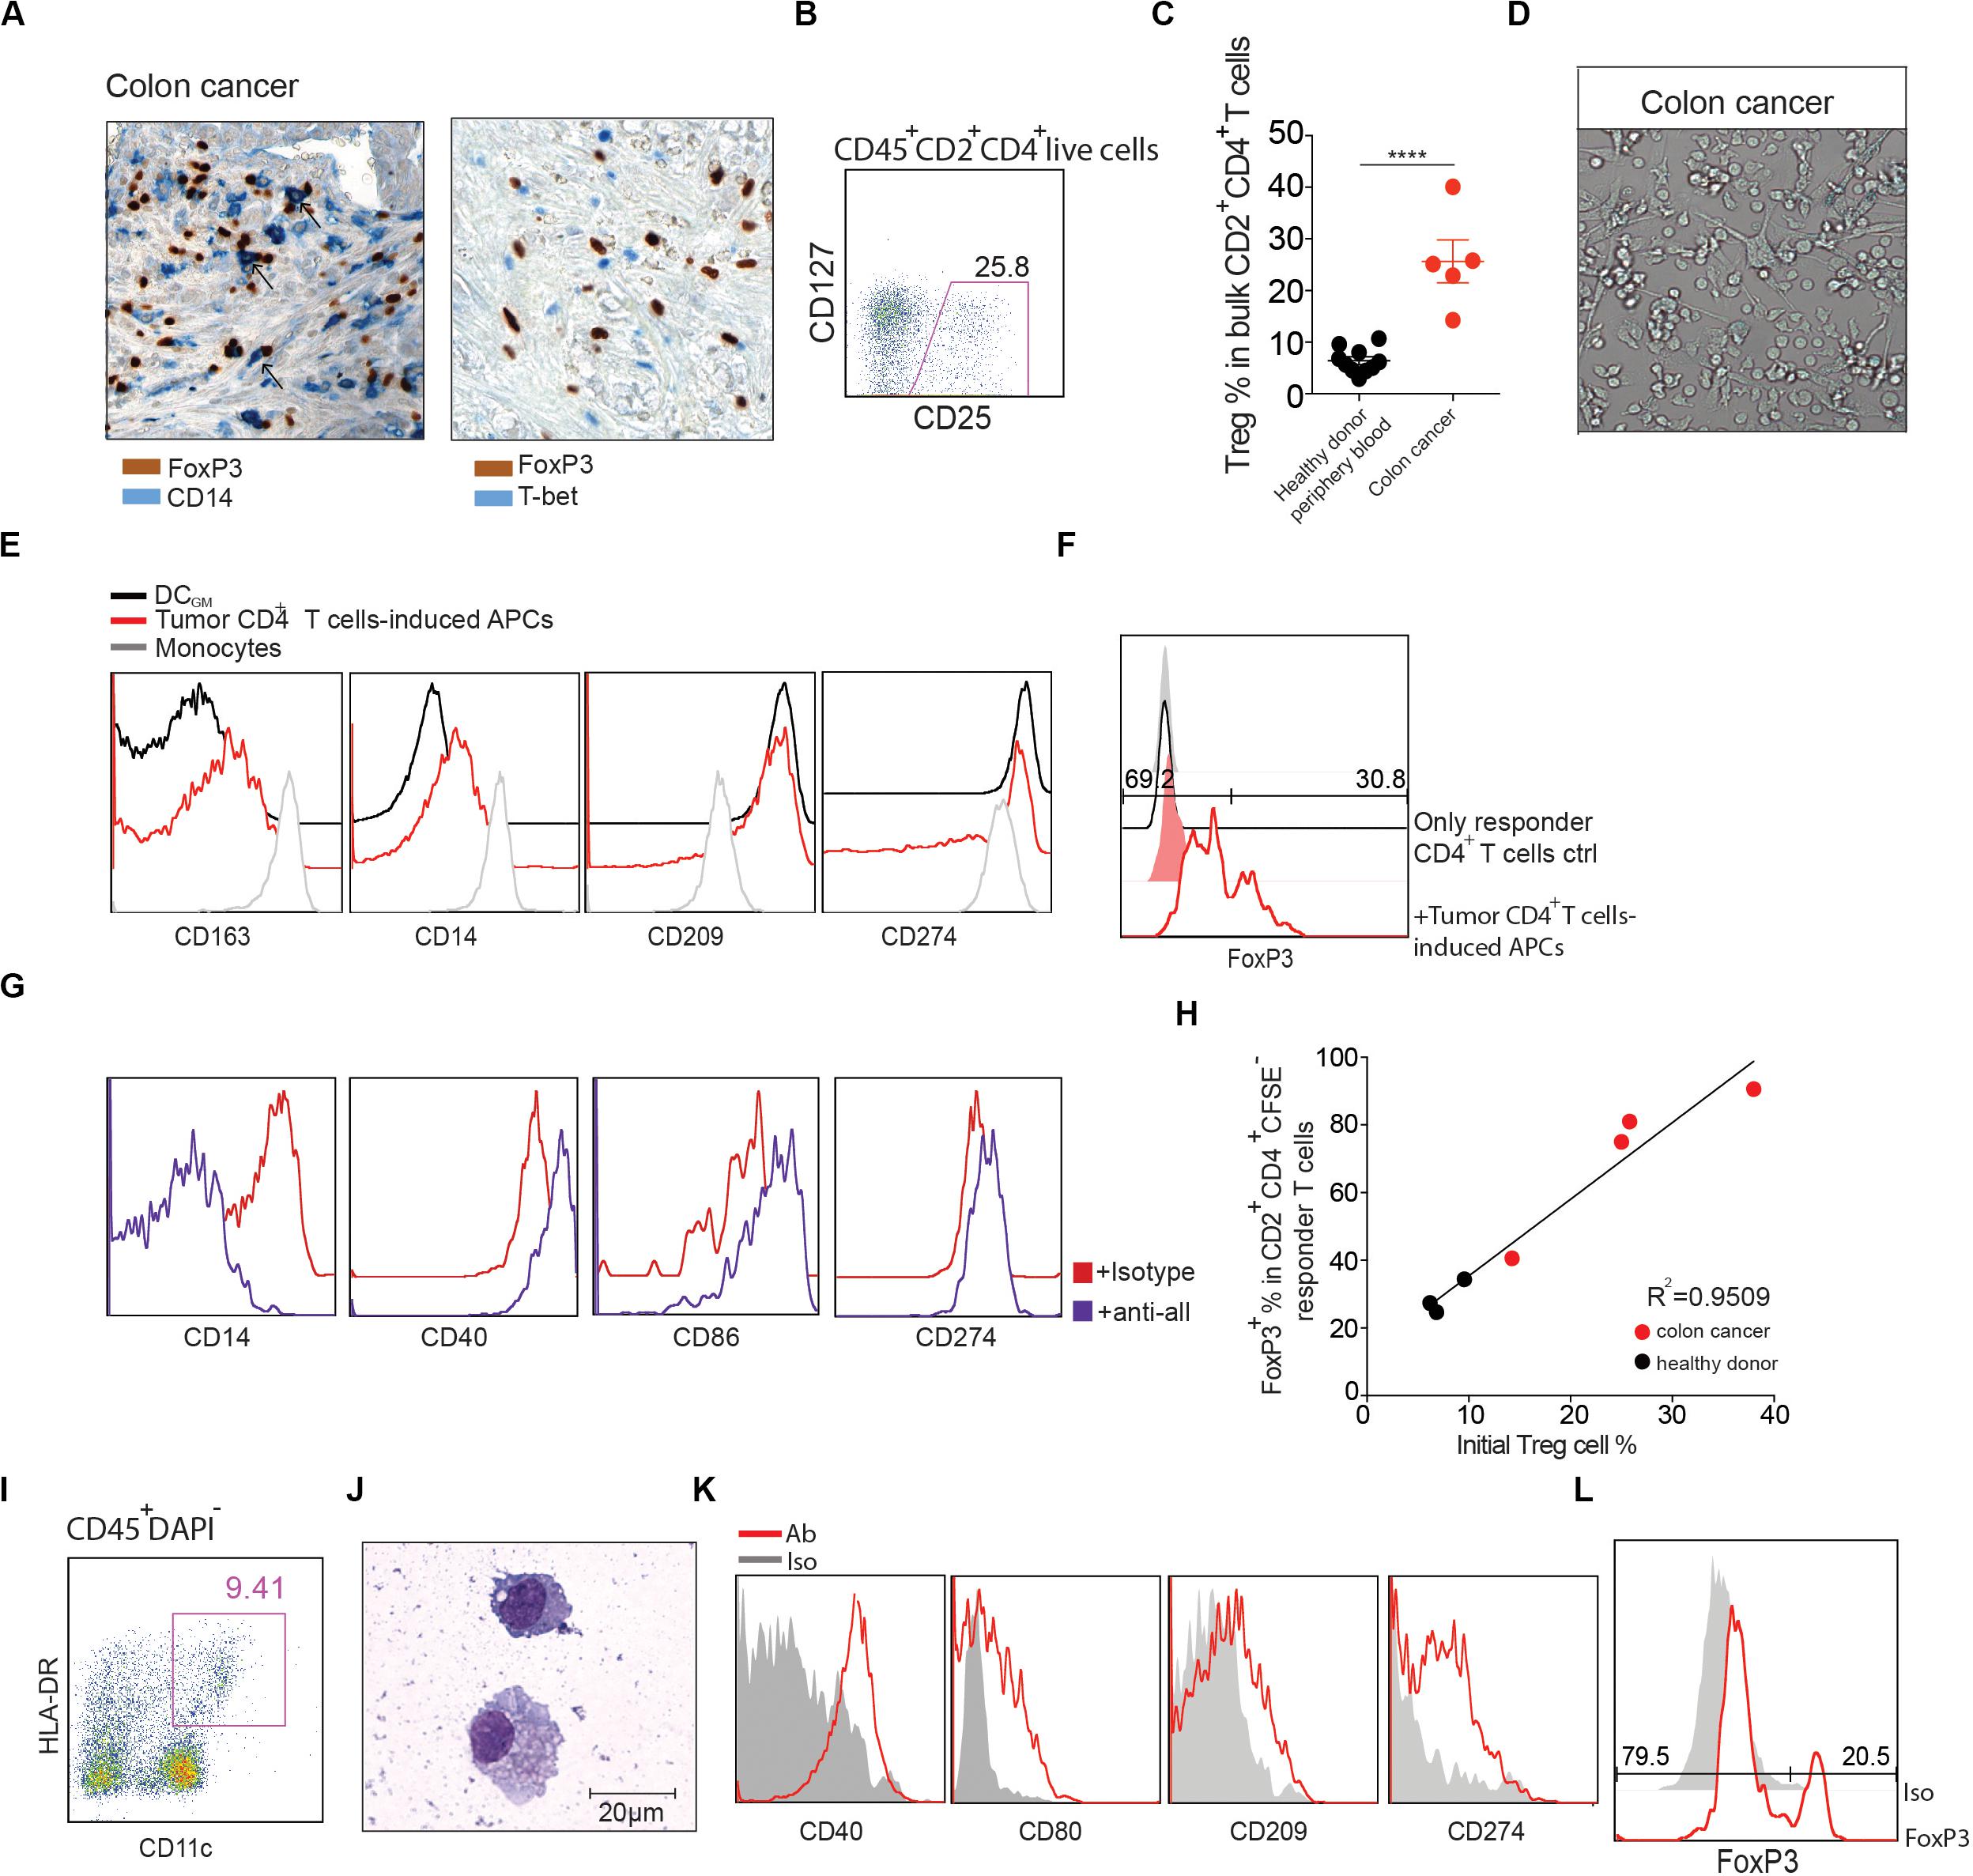
Figure 6. CRC CD4+ T cells induce DCReg formation. (A) Left: representative human colon cancer tissue stained with antibodies against FoxP3 (brown) and CD14 (blue). Black arrows represent potential monocyte-Treg interactions. Right: representative human colon cancer tissue stained with antibodies against FoxP3 (brown) and T-bet (blue). Magnification 400×. (B) Representative flow cytometry analysis of CD25+CD127low Tregs in CD45+CD2+ CD4+ T cells from colon cancer sample. (C) Comparison of the CD25+CD127low Treg percentages from healthy donor peripheral blood and colon cancer samples. Mean ± SEM. ****P < 0.0001, unpaired T test. (D,E) Lin–CD45+CD2+CD4+ T cells were purified from human CRC and co-cultured with peripheral blood CD14+ monocytes at a 1:10 ratio in the presence of anti-CD3 mAb for 4 days. (D) Images were captured with a bright-field DIC microscope on day 4. Original magnification 200×. (E) Flow cytometry analysis of the resultant antigen presenting cells (HLA-DR+CD2–) (red line) compared to monocytes cultured alone (gray line) or with GM-CSF and IL-4 (black line). (F) CD11c+HLA–DR+CD2– cells were purified via FACS and stimulated for 16 h with LPS. Cells were washed extensively and cultured with CFSE-labeled allogeneic naïve CD4+ T cells in a MLR. The percentage of FoxP3+ cells in CD2+CD4+CFSE– cells was determined 6 days later (red line). Naïve CD4+ T cells cultured alone (black line) are shown as controls. Shaded histograms represent isotype controls. Data are representative of 3 independent experiments. (G) In the presence of anti-CD3 mAb, CD14+ monocytes were cultured with bulk CD45+CD2+CD4+ T cells sorted from CRC, in the presence of a mixture of anti-CTLA-4 (5 μg/ml), anti-IL-10 (2 μg/ml), anti-TGFβ (2 μg/ml), or isotype control antibody (5 μg/ml). At day 4, cells in culture were analyzed by flow cytometry for the indicated surface markers. (H) CD14+ monocytes were cultured with bulk CD45+CD2+CD4+ T cells sorted from CRC (red) or healthy donor peripheral blood (black). CD25+CD127low Treg percentages were analyzed before coculture. The graph shows the correlation between the percentage of Tregs in CD2+CD4+ T cells prior to their initial culture with monocytes (X axis) and the percentage of CFSE–FoxP3+ T cells among the responder CD4+ T cells cultured with the DCs generated in the initial culture (Y axis). Linear regression was determined by prism. R2 = 0.9509. P = 0.0002. (I) Representative flow cytometry analysis of human CRC DCs. DAPI–CD45+ cells were further gated with CD11c, HLA-DR. (J) Cytospin of freshly FACS-sorted CD11c+HLA-DR+ DCs with Grunwald-Giemsa staining from CRC. Scale bar as indicated. (K) Flow cytometry analysis of CD40, CD80, CD86 and CD274 expression on gated CD11c+HLA-DR+ DCs. Red line: Ab staining. Shaded histograms represent isotype controls. (L) CD45+CD11c+HLA–DR+ DCs from CRC were sorted by FACS and cultured with CFSE-labeled naïve allogeneic CD4+ T cells. The percentage of FoxP3+ cells in CD2+CD4+CFSE– cells was determined 6 days later.
Given the relative ratios of monocytes, Tregs and Th in these tumors, we hypothesized that the conditions would favor formation of DCReg. As a first step to investigate this possibility, we evaluated the ability of unfractionated tumor CD4+ T cells to induce DCReg from monocytes, in vitro. Thus, FACS purified CD4+ T cells from CRC tissues were cultured with peripheral blood monocytes at a 1:10 ratio in the presence of an agonistic anti-CD3 monoclonal antibody (mAb). HLA-DR+CD2– cells with DC morphology appeared within 4 days of culture initiation (Figure 6D). Consistent with the phenotype of DCReg (Figures 2D,E), these cells expressed characteristic DC markers such as CD209, CD274, CD40, and CD86, and also expressed monocyte-defining markers including CD14 and CD163 (Figure 6E). When these DCs were cultured for 1 week with allogeneic naïve CD4+ T cells (> 99% purity; Supplementary Figure S2), > 30% of the responder T cells expressed FoxP3 (Figure 6F). Moreover, in accord with our data from healthy donors (Figure 5B), neutralization of TGFβ, IL-10 and CTLA-4 inhibited DCReg formation (Figure 6G).
Given that CD4+ T cells isolated from tumor tissue were enriched for Tregs, we hypothesized that the ratio of Tregs to Th in tumors would correlate with the capacity of the resultant DCs to induce FoxP3+ Tregs. To investigate this possibility, we quantified the percentage of Tregs in CD4+ T cells in tumor specimens and co-cultured total tumor CD4+ T cells with peripheral blood monocytes. Subsequently, we analyzed the capacity of the resultant DCs to elicit FoxP3+ Treg differentiation from naïve T cells stimulated in an MLR. The results indicate that the percentage of tumoral Tregs strongly correlated with the capacity of the ensuing DCs to induce FoxP3 expression, R2 = 0.9509 (Figure 6H).
Studies of the same tumor specimens revealed that the majority (∼80%) of tumor-associated DCs (TADCs), defined as CD45+CD11c+HLA-DR+ cells, expressed CD14, which indicates their monocytic origin and likely inclusion among the CD14+ cells associated with Tregs (Figures 6I,J). Staining for additional DC surface markers showed that they expressed CD40, CD80, CD86 and CD274 (Figure 6K). When these CRC mo-DCs were incubated with naïve CFSE-labeled naïve allogeneic CD4+ T cells (> 99% purity; Supplementary Figure S2) in a mixed leukocyte reaction (MLR), a high proportion (> 20%) of the responder T cells expressed FoxP3 (Figure 6L). In summary, our findings suggest that not only are all of the cellular requirements for generating DCReg present in these tumors, but also DCReg similar to those induced from monocytes in vitro are present in situ in the same tumors.
Discussion
Human monocytes can be induced to differentiate into tolerogenic DCs upon exposure to growth factors, cytokines, or pharmacological agents, in vitro (32). However, if and how human Tregs impact DC differentiation from monocytes has not been described. Here, we have demonstrated the ability of natural Tregs to promote the formation of DCReg directly from monocytes, and thereby reinforce an immunosuppressive environment through the induction of increased numbers of induced FoxP3+ Tregs. Our study reveals a novel mechanism whereby Tregs and Th collaborate in the induction of human regulatory DCs, thereby inducing immunosuppression and potentially contributing to “infectious tolerance” (33, 34).
By studying the effects of Tregs and Th, separately and in combination, on monocytes, we were able to analyze the mechanism responsible for DCReg formation. In agreement with our prior findings, cultures containing only activated Th and monocytes led to the formation of DCTh that secreted substantial amounts of IL-6 and TNFα and little or no IL-10 (8). Consistent with a previous report, monocytes cultured with Tregs alone differentiated into cells that are indistinguishable from macrophages (35). However, when equal numbers of Tregs and Th were added at the initiation of these cultures, the resultant morphology, surface phenotype and functionality of the monocyte–derived cells (DCReg) were distinct. Based on their large nuclei, dense cytoplasm, presence of surface dendrites and low expression of the MΦ marker MerTK (36), these monocyte-derived cells are more similar to DCs than MΦ. However, their surface phenotype and phagocytic activity indicate that they have features of both DCTh and MΦ. Their secretion of IL-10 but not proinflammatory cytokines, combined with their ability to induce the formation of FoxP3+ Tregs from naïve T cells via TGFβ, suggests that their major function is to suppress the immune response.
Monocytes are highly mobile and plastic and, therefore, ideally equipped to respond to inflammatory or immunoregulatory signals. Our studies show that the signals present during monocyte differentiation determined not only whether DCs or MΦ develop, but also the functions of the differentiated cells. DCReg differentiated from monocytes were morphologically, functionally and transcriptomically distinct from other moDCs. DCReg were also distinct from the previously described Treg-treated DC (Treg-DC) in their phagocytic capacity and cytokine secretion profile, although both can induce FoxP3+ Tregs (37). Although DCReg expressed comparatively higher levels of TLR4 compared with DCTh and MΦTreg, their phenotype remained relatively stable upon LPS stimulation. Thus, DCReg appear to be differentiated DCs that function mainly to induce Foxp3+ Tregs from CD4+ naïve T cells. These results are consistent with our previous finding that monocytes induced to differentiate into DCTh by different Th subsets develop into relatively stable DC populations that promote the polarization of the same Th subsets responsible for DC differentiation (8).
Tregs promoted the generation of DCReg from monocytes, but they did so only in the presence of activated Th, and only if all 3 cell types were in direct contact. Interestingly, IL-10 but not TGFβ was required for the formation of functionally active DCReg, while TGFβ but not IL-10 was required for FoxP3+ T cell induction by DCReg. MΦ derived from culturing monocytes with Tregs alone secreted large amounts of IL-10 (35). However, unlike DCReg, they failed to induce FoxP3+ Tregs, indicating that the formation of DCReg requires DC differentiation signals from Th, in addition to polarizing signals from Tregs.
The FoxP3+ Tregs induced by DCReg are, by definition, inducible Tregs (iTregs) as opposed to thymus-derived natural Tregs. Whereas expression of FoxP3 is considered a definitive marker of murine Tregs, this is not the case in humans. Indeed, one study showed that activation of human T cells with anti-CD3 and anti-CD28 in the presence of TGFβ resulted in the generation of FoxP3+ T cells that were not suppressive and produced high levels of effector cytokines (38). Our findings differ from this study in that DCReg induced the development of FoxP3+ T cells that are functionally suppressive. Interestingly, although both IL-10 and TGFβ contributed to the morphology and surface phenotype of DCReg induced by Tregs, IL-10 but not TGFβ was required for the formation of functionally active DCReg. On the other hand, TGFβ but not IL-10 was required for FoxP3+ T cell induction by DCReg.
We also found DCReg-like cells in CRC specimens, and they are likely present in a wide range of human tumors given the high frequency of Tregs, monocytes and DCs in many tumor types. Their expression of the monocyte/macrophage related markers CD64 and MerTK on CD11b+ TADCs described by Broz et al. also suggests their mixed ontogeny (39). Indeed, a significant portion of the myeloid cells in these and other tumors are macrophages. Comprehensive gene expression profiling at single-cell resolution will provide a more accurate indication of the frequency and location of DCReg in tumors relative to other myeloid cells. Nonetheless, in addition to DCReg, the CRC specimens contained a high proportion of Tregs relative to Th, and when monocytes were cultured with total CD4+ T cells from these tumors, they differentiated into phenotypically and functionally similar DCReg. As conditions favoring the development of DCReg are present in many tumors, these cells are likely important contributors to tumor immune tolerance across a broad range of tumor types. Moreover, we speculate that regulatory DCs similar to those described here are likely present in tissues, in addition to tumors, that contain an abundance of myeloid cells along with Th and Tregs (29, 40).
Data Availability Statement
The datasets presented in this study can be found in online repositories. The names of the repository/repositories and accession number(s) can be found below: https://www.ncbi.nlm.nih.gov/, GSE148114.
Ethics Statement
The studies involving human participants were reviewed and approved by Stanford Research Compliance Office under Stanford IRB protocol #6304. Written informed consent for participation was not required for this study in accordance with the national legislation and the institutional requirements.
Author Contributions
XZ, MA, and EE conceived the study. XZ designed and performed the research, analyzed the data, made figures, and wrote the manuscript. MA helped in designing the experiments and edited the manuscript. PZ analyzed the microarray data. TP helped in analyzing microarray data. MA, HZ, YC, DW, and E-SK performed the experiments. LT, NW, and OC performed the FACS sorting. SS helped in designing and interpreted the experiments. EE supervised the study and wrote the manuscript. All authors contributed to the article and approved the submitted version.
Funding
This study was supported by NIH grants HL075462, R01 CA222969, and AI118884.
Conflict of Interest
The authors declare that the research was conducted in the absence of any commercial or financial relationships that could be construed as a potential conflict of interest.
Supplementary Material
The Supplementary Material for this article can be found online at: https://www.frontiersin.org/articles/10.3389/fimmu.2020.01982/full#supplementary-material
Footnotes
References
1. Guilliams, M, Mildner, A, Yona, S. Developmental and functional heterogeneity of monocytes. Immunity. (2018) 49:595–613. doi: 10.1016/j.immuni.2018.10.005
2. Siddiqui, KR, Laffont, S, Powrie, F. E-cadherin marks a subset of inflammatory dendritic cells that promote T cell-mediated colitis. Immunity. (2010) 32:557–67. doi: 10.1016/j.immuni.2010.03.017
3. Nakano, H, Lin, KL, Yanagita, M, Charbonneau, C, Cook, DN, Kakiuchi, T, et al. Blood-derived inflammatory dendritic cells in lymph nodes stimulate acute T helper type 1 immune responses. Nat Immunol. (2009) 10:394–402. doi: 10.1038/ni.1707
4. Ramos, RN, Chin, LS, Dos Santos, AP, Bergami-Santos, PC, Laginha, F, Barbuto, JA. Monocyte-derived dendritic cells from breast cancer patients are biased to induce CD4+CD25+Foxp3+ regulatory T cells. J. Leukocyte Biol. (2012) 92:673–82. doi: 10.1189/jlb.0112048
5. Randolph, GJ, Inaba, K, Robbiani, DF, Steinman, RM, Muller, WA. Differentiation of phagocytic monocytes into lymph node dendritic cells in vivo. Immunity. (1999) 11:753–61. doi: 10.1016/s1074-7613(00)80149-1
6. Auffray, C, Sieweke, MH, Geissmann, F. Blood monocytes: development, heterogeneity, and relationship with dendritic cells. Annu Rev Immunol. (2009) 27:669–92. doi: 10.1146/annurev.immunol.021908.132557
7. Jakubzick, CV, Randolph, GJ, Henson, PM. Monocyte differentiation and antigen-presenting functions. Nat Rev Immunol. (2017) 17:349–62. doi: 10.1038/nri.2017.28
8. Alonso, MN, Wong, MT, Zhang, AL, Winer, D, Suhoski, MM, Tolentino, LL, et al. T(H)1, T(H)2, and T(H)17 cells instruct monocytes to differentiate into specialized dendritic cell subsets. Blood. (2011) 118:3311–20. doi: 10.1182/blood-2011-03-341065
9. Davidson, MG, Alonso, MN, Yuan, R, Axtell, RC, Kenkel, JA, Suhoski, MM, et al. Th17 cells induce Th1-polarizing monocyte-derived dendritic cells. J Immunol. (2013) 191:1175–87. doi: 10.4049/jimmunol.1203201
10. Josefowicz, SZ, Lu, LF, Rudensky, AY. Regulatory T cells: mechanisms of differentiation and function. Annu Rev Immunol. (2012) 30:531–64. doi: 10.1146/annurev.immunol.25.022106.141623
11. Zhang, AL, Colmenero, P, Purath, U, Teixeira de Matos, C, Hueber, W, Klareskog, L, et al. Natural killer cells trigger differentiation of monocytes into dendritic cells. Blood. (2007) 110:2484–93. doi: 10.1182/blood-2007-02-076364
12. Ferreira, GB, Vanherwegen, AS, Eelen, G, Gutierrez, ACF, Van Lommel, L, Marchal, K, et al. Vitamin D3 induces tolerance in human dendritic cells by activation of intracellular metabolic pathways. Cell Rep. (2015) 10:711–25. doi: 10.1016/j.celrep.2015.01.013
13. Carvalho, BS, Irizarry, RA. A framework for oligonucleotide microarray preprocessing. Bioinformatics. (2010) 26:2363–7. doi: 10.1093/bioinformatics/btq431
14. MacDonald, JW. Posting date. hugene20sttranscriptcluster.db: Affymetrix hugene20 annotation data (chip hugene20sttranscriptcluster). R package version 8.6.0. [Online.]. (2017). doi: 10.1093/bioinformatics/btq431
15. Ritchie, ME, Phipson, B, Wu, D, Hu, Y, Law, CW, Shi, W, et al. limma powers differential expression analyses for RNA-sequencing and microarray studies. Nucleic Acids Res. (2015) 43:e47. doi: 10.1093/nar/gkv007
16. Wickham, H. ggplot2: Elegant Graphics for Data Analysis. Berlin: Springer (2016). doi: 10.1093/nar/gkv007
18. Alexa, A, Rahnenfuhrer, J. topGO: Enrichment Analysis for Gene Ontology. R package version 2.28.0. (2016). doi: 10.1093/nar/gkv007
19. Spinelli, L, Carpentier, S, Montanana Sanchis, F, Dalod, M, Vu Manh, TP. BubbleGUM: automatic extraction of phenotype molecular signatures and comprehensive visualization of multiple Gene Set Enrichment Analyses. BMC Genomics. (2015) 16:814.
20. Villani, AC, Satija, R, Reynolds, G, Sarkizova, S, Shekhar, K, Fletcher, J, et al. Single-cell RNA-seq reveals new types of human blood dendritic cells, monocytes, and progenitors. Science. (2017) 356:eaah4573. doi: 10.1126/science.aah4573
21. Segura, E, Touzot, M, Bohineust, A, Cappuccio, A, Chiocchia, G, Hosmalin, A, et al. Human inflammatory dendritic cells induce Th17 cell differentiation. Immunity. (2013) 38:336–48. doi: 10.1016/j.immuni.2012.10.018
22. Navarro-Barriuso, J, Mansilla, MJ, Naranjo-Gomez, M, Sanchez-Pla, A, Quirant-Sanchez, B, Teniente-Serra, A, et al. Comparative transcriptomic profile of tolerogenic dendritic cells differentiated with vitamin D3, dexamethasone and rapamycin. Sci Rep. (2018) 8:14985.
23. Gautier, EL, Shay, T, Miller, J, Greter, M, Jakubzick, C, Ivanov, S, et al. Gene-expression profiles and transcriptional regulatory pathways that underlie the identity and diversity of mouse tissue macrophages. Nat Immunol. (2012) 13:1118–28. doi: 10.1038/ni.2419
24. Scott, RS, McMahon, EJ, Pop, SM, Reap, EA, Caricchio, R, Cohen, PL, et al. Phagocytosis and clearance of apoptotic cells is mediated by MER. Nature. (2001) 411:207–11. doi: 10.1038/35075603
25. Zizzo, G, Hilliard, BA, Monestier, M, Cohen, PL. Efficient clearance of early apoptotic cells by human macrophages requires M2c polarization and MerTK induction. J Immunol. (2012) 189:3508–20. doi: 10.4049/jimmunol.1200662
26. Mouries, J, Moron, G, Schlecht, G, Escriou, N, Dadaglio, G, Leclerc, C. Plasmacytoid dendritic cells efficiently cross-prime naive T cells in vivo after TLR activation. Blood. (2008) 112:3713–22. doi: 10.1182/blood-2008-03-146290
27. Kool, M, Soullie, T, van Nimwegen, M, Willart, MA, Muskens, F, Jung, S, et al. Alum adjuvant boosts adaptive immunity by inducing uric acid and activating inflammatory dendritic cells. J Exp Med. (2008) 205:869–82. doi: 10.1084/jem.20071087
28. Vignali, DA, Collison, LW, Workman, CJ. How regulatory T cells work. Nat Rev Immunol. (2008) 8:523–32. doi: 10.1038/nri2343
29. Magnuson, AM, Kiner, E, Ergun, A, Park, JS, Asinovski, N, Ortiz-Lopez, A, et al. Identification and validation of a tumor-infiltrating Treg transcriptional signature conserved across species and tumor types. Proc Natl Acad Sci USA. (2018) 115:E10672–81.
30. Sica, A, Porta, C, Morlacchi, S, Banfi, S, Strauss, L, Rimoldi, M, et al. Origin and functions of tumor-associated myeloid cells (TAMCs). Cancer Microenviro. (2012) 5:133–49. doi: 10.1007/s12307-011-0091-6
31. Patente, TA, Pinho, MP, Oliveira, AA, Evangelista, GCM, Bergami-Santos, PC, Barbuto, JAM. Human dendritic cells: their heterogeneity and clinical application potential in cancer immunotherapy. Front Immunol. (2018) 9:3176.
32. Marin, E, Cuturi, MC, Moreau, A. Tolerogenic dendritic cells in solid organ transplantation: where do we stand? Front Immunol. (2018) 9:274.
33. Waldmann, H. Tolerance can be infectious. Nat Immunol. (2008) 9:1001–3. doi: 10.1038/ni0908-1001
34. Leavy, O. Infectious disease: the tolerance of superspreaders. Nat Rev Immunol. (2014) 14:776–7.
35. Tiemessen, MM, Jagger, AL, Evans, HG, van Herwijnen, MJ, John, S, Taams, LS. CD4+CD25+Foxp3+ regulatory T cells induce alternative activation of human monocytes/macrophages. Proc Natl Acad Sci USA. (2007) 104:19446–51. doi: 10.1073/pnas.0706832104
36. Grabiec, AM, Goenka, A, Fife, ME, Fujimori, T, Hussell, T. Axl and MerTK receptor tyrosine kinases maintain human macrophage efferocytic capacity in the presence of viral triggers. Eur J Immunol. (2018) 48:855–60. doi: 10.1002/eji.201747283
37. Mavin, E, Nicholson, L, Rafez Ahmed, S, Gao, F, Dickinson, A, Wang, XN. Human regulatory T cells mediate transcriptional modulation of dendritic cell function. J Immunol. (2017) 198:138–46. doi: 10.4049/jimmunol.1502487
38. Tran, DQ, Ramsey, H, Shevach, EM. Induction of FOXP3 expression in naive human CD4+FOXP3 T cells by T-cell receptor stimulation is transforming growth factor-beta dependent but does not confer a regulatory phenotype. Blood. (2007) 110:2983–90. doi: 10.1182/blood-2007-06-094656
39. Laoui, D, Keirsse, J, Morias, Y, Van Overmeire, E, Geeraerts, X, Elkrim, Y, et al. The tumour microenvironment harbours ontogenically distinct dendritic cell populations with opposing effects on tumour immunity. Nat Commun. (2016) 7:13720.
Keywords: DCs, DCReg, Tregs, Th, monocytes
Citation: Zhang X, Zheng P, Prestwood TR, Zhang H, Carmi Y, Tolentino LL, Wu N, Choi O, Winer DA, Strober S, Kang E-S, Alonso MN and Engleman EG (2020) Human Regulatory Dendritic Cells Develop From Monocytes in Response to Signals From Regulatory and Helper T Cells. Front. Immunol. 11:1982. doi: 10.3389/fimmu.2020.01982
Received: 08 April 2020; Accepted: 22 July 2020;
Published: 18 August 2020.
Edited by:
Ursula Grohmann, University of Perugia, ItalyReviewed by:
Tatjana Nikolic, Leiden University, NetherlandsAlexander Steinkasserer, University Hospital Erlangen, Germany
Copyright © 2020 Zhang, Zheng, Prestwood, Zhang, Carmi, Tolentino, Wu, Choi, Winer, Strober, Kang, Alonso and Engleman. This is an open-access article distributed under the terms of the Creative Commons Attribution License (CC BY). The use, distribution or reproduction in other forums is permitted, provided the original author(s) and the copyright owner(s) are credited and that the original publication in this journal is cited, in accordance with accepted academic practice. No use, distribution or reproduction is permitted which does not comply with these terms.
*Correspondence: Edgar G. Engleman, ZWRlbmdsZW1hbkBzdGFuZm9yZC5lZHU=
†Co-last author