 Nicola Cotugno1,2
 Veronica Santilli1
 Giuseppe Rubens Pascucci1
 Emma Concetta Manno1
 Lesley De Armas3
 Suresh Pallikkuth3Annalisa Deodati4Donato Amodio1,2
 Paola Zangari1
 Sonia Zicari1
 Alessandra Ruggiero1
 Martina Fortin5Christina Bromley5Rajendra Pahwa3
 Paolo Rossi1,2
 Savita Pahwa3*Paolo Palma1,2*
- 1Academic Department of Pediatrics (DPUO), Research Unit of Congenital and Perinatal Infections, Bambino Gesù Children's Hospital, Rome, Italy
- 2Chair of Pediatrics, Department of Systems Medicine, University of Rome “Tor Vergata”, Rome, Italy
- 3Miami Center for AIDS Research, Department of Microbiology and Immunology, Miller School of Medicine, University of Miami, Miami, FL, United States
- 4Academic Department of Pediatrics (DPUO), Research Unit of Growth Disorders, Bambino Gesù Children's Hospital, Rome, Italy
- 5BioStat Solutions, Inc., Frederick, MD, United States
The number of patients affected by chronic diseases with special vaccination needs is burgeoning. In this scenario, predictive markers of immunogenicity, as well as signatures of immune responses are typically missing even though it would especially improve the identification of personalized immunization practices in these populations. We aimed to develop a predictive score of immunogenicity to Influenza Trivalent Inactivated Vaccination (TIV) by applying deep machine learning algorithms using transcriptional data from sort-purified lymphocyte subsets after in vitro stimulation. Peripheral blood mononuclear cells (PBMCs) collected before TIV from 23 vertically HIV infected children under ART and virally controlled were stimulated in vitro with p09/H1N1 peptides (stim) or left unstimulated (med). A multiplexed-qPCR for 96 genes was made on fixed numbers of 3 B cell subsets, 3 T cell subsets and total PBMCs. The ability to respond to TIV was assessed through hemagglutination Inhibition Assay (HIV) and ELIspot and patients were classified as Responders (R) and Non Responders (NR). A predictive modeling framework was applied to the data set in order to define genes and conditions with the higher predicted probability able to inform the final score. Twelve NR and 11 R were analyzed for gene expression differences in all subsets and 3 conditions [med, stim or Δ (stim-med)]. Differentially expressed genes between R and NR were selected and tested with the Adaptive Boosting Model to build a prediction score. The score obtained from subsets revealed the best prediction score from 46 genes from 5 different subsets and conditions. Calculating a combined score based on these 5 categories, we achieved a model accuracy of 95.6% and only one misclassified patient. These data show how a predictive bioinformatic model applied to transcriptional analysis deriving from in-vitro stimulated lymphocytes subsets may predict poor or protective vaccination immune response in vulnerable populations, such as HIV-infected individuals. Future studies on larger cohorts are needed to validate such strategy in the context of vaccination trials.
Introduction
The advent of vaccinations has reshaped the history of medicine and across the twenty-first century has led to a decrease in morbidity of previously fatal diseases (1, 2). However, with steadily improving survival rates due to the availability of novel therapeutic tools, the vulnerable populations with special vaccination needs is burgeoning (3–5). Nowadays vaccine development programs mainly focus on otherwise healthy populations; as such, vaccine indications are based on data arising from healthy study participants. Accordingly, most vaccine indications in vulnerable groups (VPs), elderly, pregnant women and patients affected by chronic conditions (i.e., HIV infected patients), are derived from extrapolations, assumptions, or post-licensure studies (5). Thus, limited data are currently available to tailor vaccine interventions in these populations. Since the seasonal flu vaccine is well-established in routine use in HIV, it may represent the paradigm vaccine to illustrate many of the issues that affect most or all vaccines in VPs. Despite recommendations on seasonal influenza vaccination for targeted or at-risk groups (i.e., HIV, elderly, comorbidities etc.), such populations are at increased risk of acquiring vaccine-preventable infections and suffer higher infectious morbidity and mortality than healthy individuals (6, 7). This represents a major health and economic burden to society, which will become increasingly difficult to manage given limited public resources (8). In parallel, many uncertainties remain about the optimal strategies for identifying susceptible individuals, and for offering them sustained protection through a personalized immunization schedule. Novel biomarkers of protective immune responses to vaccines are needed. Vaccinology, based on the immune response network theory (9), which utilizes immunogenetics, immunogenomics and systems biology approaches to understand the basis for inter-individual variations in vaccine induced immune responses can provide such biomarkers (10, 11). In particular, vaccinomics utilize high-throughput, high-dimensional systems biology approaches, which aims to predict differences in protective or suboptimal immune responses to vaccines (12). In this regard, the basis of personalized and predictive vaccinology is the assessment of an individual's genetic background that may impact vaccine immunogenicity and efficacy. Thus, far this approach has been mostly conducted in healthy subjects leading to important findings (13). However, these data can only be partially translated in to specific populations. We recently described distinct transcriptional signatures of purified B and T cell subsets in vertically HIV infected children that was able to distinguish between patients able to respond to Trivalent Inactivated Vaccination (TIV) compared vs. non-responders (14, 15). In addition, purified H1N1 specific B cells showed significant differences in P-TEN/PI3KC2B pathway between responders and non-responders (16, 17).
Following the idea that a single vaccine cannot “fit all” (9), we here aimed at developing a predictive score of poor or protective vaccination immune response to seasonal flu vaccination through an artificial intelligence approach fed by data deriving from a novel in vitro gene expression testing approach (IVIGET) in HIV infected patients differentially responding to TIV. We here showed that a multiplexed gene expression analysis from sorted lymphocites subsets in different in vitro conditions was able to feed an artificial inteligence model able to select predictive features of influenza vaccination immunogenicity in a pediatric population with suboptimal immune response upon the influenza vaccination.
Methods
Study Subjects
Twenty-three subjects vertically infected with HIV-1 (abbreviated as HIV) and on suppressive anti-retroviral therapy (ART) were enrolled between September and November 2012 at Bambino Gesù Children's Hospital, Rome, Italy. Written informed consent was obtained from all subjects or parents/legal guardians upon enrolment and the study was approved by the Institutional review board of the Bambino Gesù Children's Hospital. PBMCs and plasma were isolated by density gradient isolation [46] collected pre (T0) and 21 days post vaccination (T1) and cryopreserved and processed for study at a later date. Serum samples were stored at −80°C.
Immunization and Sample Collection
Patients were immunized with a single dose of Inactivated Influenza Vaccine Trivalent Types A and B (Split Virion) VAXIGRIP® (sanofi pasteur). The strains for the 2012–2013 season were: A/California/7/2009 (H1N1) pdm09-like strain (abbreviated as H1N1), A/Victoria/361/2011 (H3N2)-like strain (abbreviated as H3N2) and B/Wisconsin/1/2010-like strain (abbreviated as B).
Hemagglutination Inhibition (HI) Assay
The antibody titers to the H1N1, H3N2 and B influenza strains in sera from HIV and HC were evaluated separately by HI assay (18). The virus strains used in the HI assay were A/California/7/2009 (H1N1) pdm09-like strain, A/Victoria/361/2011 (H3N2)-like strain and B/Wisconsin/1/2010-like strain according to the 2012–2013 influenza vaccine formulation. The HI assay was performed as previously described (18). The HI antibody titers were expressed as the reciprocal of the highest serum dilution at which hemagglutination was prevented. (http://www.gmp-compliance.org/guidemgr/files/021496EN.PDF).
ELISPot
PBMCs collected at T0 and T1 from HIV and HC were thawed and policlonally activated in vitro in complete RPMI medium (Invitrogen) supplemented with 2.5 μg/mL CpG type B (Hycult biotech), 20 ng/mL IL-4 (Peprotech) and 20 ng/mL IL-21 (ProSpec). Cells were harvested after 5 days of culture at 37°C. ELISpot 96-well filtration plates (Millipore) were coated with the addition of purified H1N1, H3N2, and B influenza inactivated virus particles and subsequently loaded with 2 × 10⁵ cells/well. Membranes were punched out with an Eli.Punch device and developed spots were scanned with an Eli.Scan and counted with the ELISpot Analysis Software V5.1 (all from A.EL.VIS).
Determining Vaccine Response Status
T0 and T1 samples were employed to evaluate patient's ability to respond to the vaccination as previously described (17). Response to vaccinations was determined both by ELISPot for the 3 strains of Flu vaccines (H1N1, H3N2, B) and by Haemagglutination-Inhibition assay (HIA) detected at the time of immunization and 21 days after vaccination as previously described (14, 15). In order to compare patients with differential ability to respond to the vaccination, patients were first selected according to their seroconversion to H1N1 21 days after the immunization resulting in 2 groups, Seroconverter (HIA fold increase ≥ = 4) and Non Seroconverter (HIA fold increase < 4). As additional criteria, patients were selected according to the ELISpot responses for H1N1 at 21 days after immunization as ELISpot negative (<80 H1N1 specific spots/106 PBMCs) and ELISpot positive (>80 H1N1 specific spots/106 PBMCs). According to these 2 criteria we could select among the HIV infected children 12 non responders (NR; HIA fold increase <4 AND H1N1 specific spots <80/106 PBMCs), 11 responders (R; HIA fold increase >= 4 AND H1N1 specific spots >80/106 PBMCs).
In vitro Stimulation, Cell Sorting, and RNA Extraction
T0 PBMC were thawed and cells were counted with Countess Automated Cell counter (Life technology). Cells were resuspended in complete RPMI medium at a concentration of 5 × 10⁶ PBMCs/mL and left at 37°C for 16 h in the presence or absence of H1N1 A/California /09 HA peptides in a final concentration 20 μL/mL. PMBCs were stained for surface markers, Vivid (Pacific Blue), CD10 (PECy7), CD20 (PE), CD27 (APC), IgD (FITC), CD21 (PECy5) for the B cell panel for 15 min and for CD3 (AmCyan), CD4 (PerCP Cy5.5), CD45RO (ECD), CCR7 (Alexa Fluor 700), and CXCR5 (Alexa Fluor 647) and a live/dead marker (ViViD; Molecular Probes) for the T cell panel for 15 min. Subsequently, stained PBMCs were washed twice in PBS, finally filtered with a 40 uM mesh and sorted by FACSAriaII (BD Biosciences). The purity of the sorted cell populations were typically >99%. All antibodies were previously titrated. Viable lymphocytes were identified as live dead amine dye negative (ViViD-) cells (Invitrogen).
Five-Hundred live cells per B and T cell subset were sorted into tubes previously loaded with 9 μL of PCR buffer (see also Figure 1 for gating strategy). After sorting, cells were immediately centrifuged (3000RPM for 3 min) and kept on ice. Samples were subsequently transferred in PCR tubes and 18 PCR cycles were performed on a C1000 Thermal Cycler (Bio Rad) with the following scheme (50°C for 20′, 95°C for 2′, 95°C 15″, 60°C for 4′. Last step repeated 18 times). Cells were finally kept at −20 until further analysis. PCR buffer premix for cell sorting contained the following: Cells Direct Reaction mix 5 μL, DEPC water 1,4, Superscript III + Taq 1 μl, 0.2x diluted assay (96 primer mix) 2.5 μL, Superasein 0,1 μL.
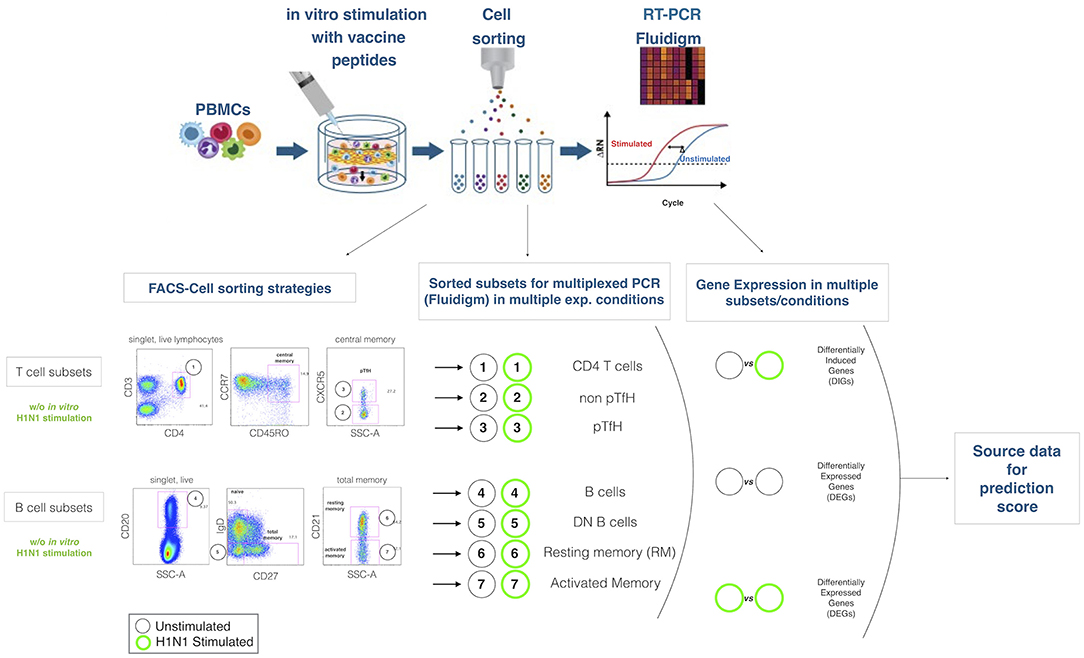
Figure 1. Experimental design. The cartoon on the top panel depicts the experimental procedure. Briefly, total PBMCs are in 2 aliquotes, one stimulated and the latter unstimulated. After sorting lymphocite subsets, gene expression is analyzed by Fluidigm Biomark. Bottom panel describes the gating strategies and the lymphocites subsets selected for sorting and gene expression analysis. Mathematical analysis applied on the subsets in order to obtain differentially expressed genes (DEGs) and differentially induced genes (DIGs) are described.
Multiplexed RT-PCR
Previously amplified samples were loaded on a Fluidigm 96.96 standard chip following manufacturer's instructions. Briefly, assay pre-mix was prepared 1:1 20X TaqMan Gene Expression Assay (Applied Biosystems) and Assay Loading Reagent (Fluidigm, Biomark®). The sample pre-mix was prepared with TaqMan Universal PCR Master Mix (2X)(Applied Biosystems), 20XGE Sample Loading Reagent (Fluidigm), and cDNA. Full list of the two panels of gene probes (B subsets and T subsets is shown in Supplemental Table 1 and 2). 5 μl of Assay and Sample mix were loaded into the chip according to manufacturers instructions. Genes' selection has been made according to previous analysis on RNA Sequencing on HIV infected children from a different cohort (data not shown), the literature and online gene banks and biological queries.
Cycle threshold value (Ct) deriving from exported files was corrected according to number of cells sorted if lower than 500. Calculations were made following the expression 67, 5/500 = Y/X where X is the number of cells sorted and Y is the cells equivalent cDNA of cell sorted. The dilution factor (n) was calculated as n = 67, 5/Y, and base 2 log of n was subsequently subtracted to Ct value in order to get Corrected Cycle Threshold (c-Ct). Expression threshold (Et), which was used for the main analysis was finally obtained with 40-cCT. Once exported and corrected, data were analyzed through Fluidigm SingluaR (SingulaR analysis toolset 3.0) package, loaded on R (software R 3.0.2 GUI 1.62). As previously described (De Armas, 2017) gene expression differences between different groups within same subset and condition were used to identify Differentially Expressed Genes (DEGs). Alternatively, paired gene expression differences between stimulated (stim) and unstimulated samples (med) (stim-med) within the same subset were used to define Differentially Induced Genes (DIGs). All raw data on gene expression analysis used for the present project are available on the Gene Expression Omnibus: NCBI gene expression and hybridization array data repository (GEO) (GSE155730).
Bioinformatics and Statistical Analysis
Predictive Modeling Framework
We propose a workflow (Figure 2) used for gene selection and model building that use the 96 genes with age and sex as covariates. This method was applied to each subset of B cells (AM, DN, REM) and T cells (CD4, NT, PBMC, TFH), further divided into two conditions, namely stimulated (stim), unstimulated (med) and the derived data of the stim-med, for 23 patients. In addition, this workflow has also been applied to the entire dataset (B and T cells) to obtain a predicted probability score. Due to the small sample size and high dimensional data, the Wilcoxon Rank Sum Test was used to select genes whose expression levels are different between responders and non-responders. As compared to other feature selection methods, this test outperforms others in terms of accuracy and robustness (19) Using the two-sided test to evaluate whether these two subpopulations had different gene levels, p-values were derived to assess significance at α = 0.05. Genes with significantly different expression levels were used in the next step of the analysis framework. The feature selection process was applied to each dataset to select those genes that are predictive of response to vaccine. Applying multiple machine learning methods, each using a different approach, increased the confidence in selecting the best genes for the model.
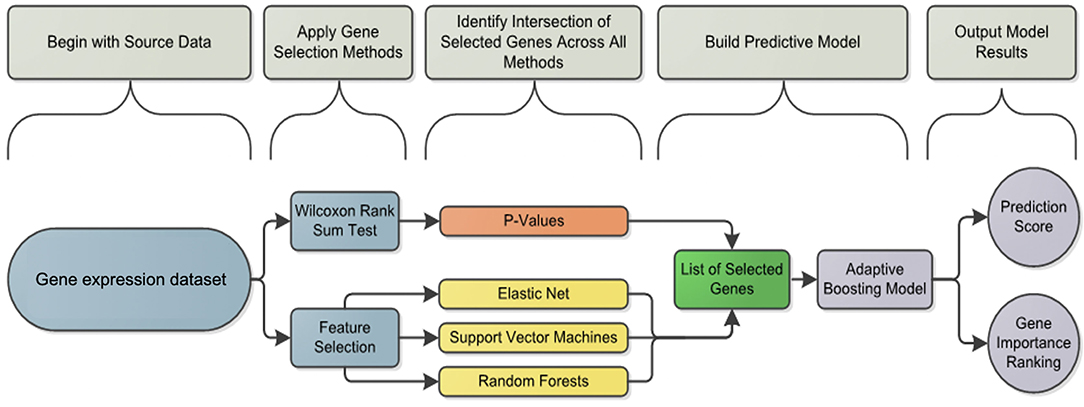
Figure 2. Analysis framework flowchart: pipeline workflow for predicting the vaccine response. Differentially induced genes between responders and non-responders were selected using a machine learning feature selection based on three different algorithms and the Wilcoxon test for each cell subset and condition. The list of selected genes was used by the Adaptive Boosting algorithm to build the predictive model and calculate the prediction score.
The machine learning methods used were Elastic Net (glmnet function in R) (20), Support Vector Machines (svm.fs function in R) (21) and Random Forests (randomForest function in R) using 3-fold cross validation repeated 8 times (22). Variable importance was also calculated by Random Forests and used to define the gene importance ranking as previously described (22). If a gene or feature was selected at least 10 times in total throughout the process, then it was considered for further analysis in the prediction model.
After selecting a subset of features by using the Wilcoxon Rank Sum Test and machine learning, an Adaptive Boosting model using continuous predictors and generating predicted probabilities of response was used as the final predictive model. The Adaptive Boosting model (http://rob.schapire.net/papers/explaining-adaboost.pdf) was used as it is less susceptible to overfitting and attempts to combine rules to create a more accurate prediction. This model was implemented in R using the caret (http://topepo.github.io/caret/index.html) package. The ADA Boost method uses a training set, a subset of the data that is set aside, and assigns a ±1 as classifier values. A classifier value indicates how important a feature is for the model. The classifiers are then weighted based on the training set, and the prediction is recalculated. Using the data, the program will assign weights to features beyond the ±1 classifier at every stage. To obtain the final results of the model, ADA Boost uses the sum of every weight and classifier combination to provide a probability of response. The result of the model is a predicted probability of response for each patient (Figures 3, 4). Considering both the Wilcoxon and feature selection significant genes, the final model uses the intersection (B cells) or union (T cells) of the genes across subsets. The R statistical software version 3.0.3 was used for all analyses (www.r-project.org).
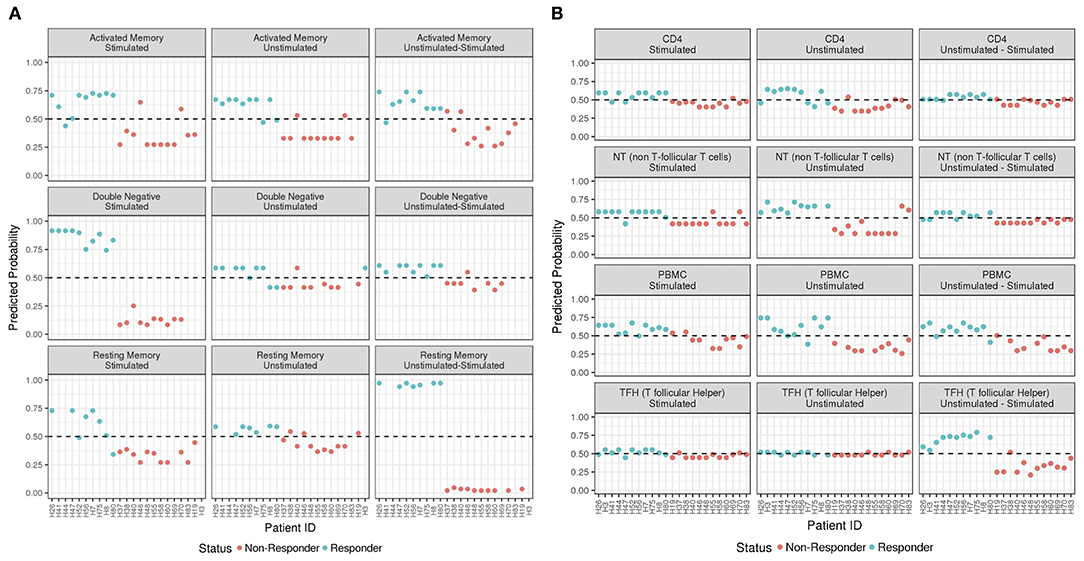
Figure 3. ADA Boost Probability Scores for T Cells (A) and B cell subsets (B). The probabilities of prediction are shown for each patient (the non-responder in red and responder in blue). If the probability is >0.50 the patient has been classified as responder, on the contrary if <0.50.
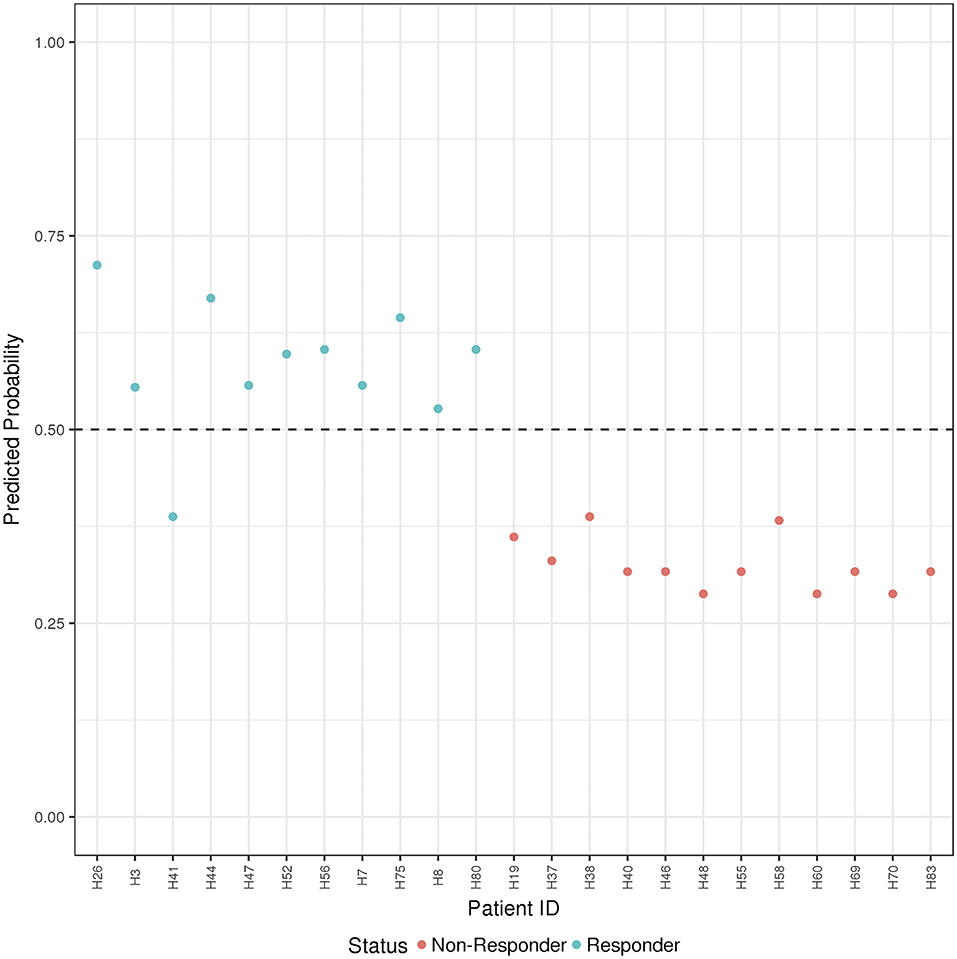
Figure 4. ADA Boost Probability Scores (B and T Cells): the combined prediction score between B and T cells are shown for each patient (the non-responder in red and responder in blue). If the probability is >0.50 the patient has been classified as responder, on the contrary if <0.50.
The R package “enrichR” v2.1 was used to perform functional annotation and pathway enrichment analysis on the genes selected to build the five models with the best prediction precision.
Results
Patients' Characteristics and H1N1 Response to Influenza Vaccination
To define the ability to elicit memory response upon H1N1 of the trivalent inactivated Influenza vaccination 2012/2013 (TIV) we investigated hemoagglutination inhibition assay in 65 HIV infected children under stable and highly active antiretroviral treatment (HAART) and viral control at the time of vaccination. Clinical characteristics are listed in Table 1. Study participants were classified as vaccine responders (R) and vaccine non-responders (NR) according to the criteria established by Food and Drug Administration Guidance for Industry as previously described (14). R were characterized by HAI titer to H1N1 antigen (Ag) at T1 of >1:40 and > four-fold increase compared to baseline. In order to validate our criteria of selection, even considering the lower reliability of serological correlates in such patients, we applied an additional measure of vaccine responsiveness in our study population performing the B cell ELISpot response to H1N1 Ag (≥ or < 80 spots /106 PBMCs in responders (R) and non-responders (NR), respectively).
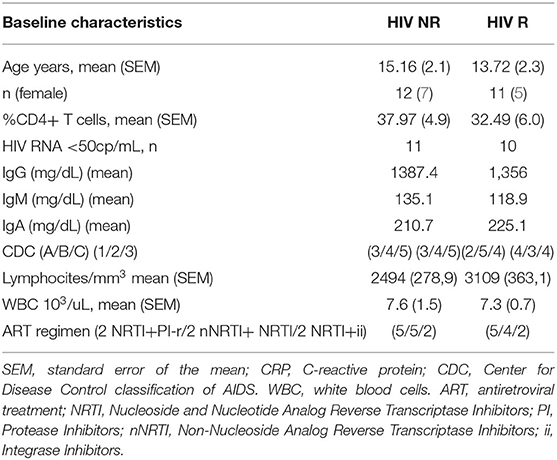
Table 1. Study subjects' characteristics.
Features Selection and Identification of Predictive Score Through Artificial Intelligence
In order to predict the vaccination response based on the expression levels of 96 genes, we have implemented a bioinformatic pipeline that was tested on six sorted subsets of B and T cells, as reported in Figure 1 and PBMC in 23 patients. For each subset, the conditions of stimulation (stim), non-stimulation (med) and the difference between the two (stim-med) have been considered. For each of these subset/condition, the algorithm, reported in Figure 2, selects the Differentially Induced Genes (DIGs) and Differentially Expressed Genes (DEGs) whose expression levels can, better than others, discriminate responding individuals from non-responders upon TIV. A total of 179 genes/conditions were initially selected among the different subsets and conditions (Table 2). As shown in Table 2, a specific number of genes were respectively, selected for the med (55 genes), stim (62 genes), and med-stim conditions (62 genes). Subsequently, these genes were then used to build statistical models. The ADA Boost models generated for each category returned a probability score that estimates the classification of each patient in responder (R) and non-responder (NR). Assuming a predicted probability >0.50 classified as a responder, the ADA Boost model was able to predict R and NR in specific subsets and conditions according to the previously selected genes. Indeed, the Resting Memory (REM) med-stim, Double Negative (DN) stim, TFH med-stim and PBMC med datasets showed the best results in terms of predicted probability as shown in Figure 3. No mispredictions were found in REM med-stim, DN stim and PBMC unstim, whereas only one misprediction was found according the ADA boost of TFH med-stim.
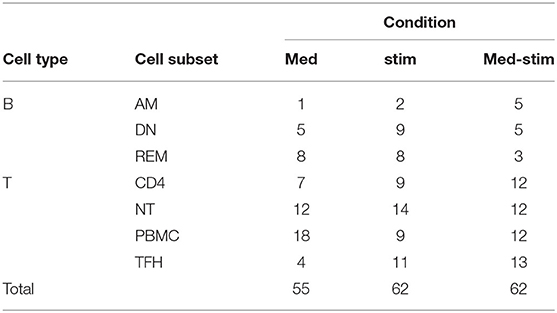
Table 2. Selected genes and conditions.
In order to provide a comprehensive description of gene expression with higher accuracy in terms of prediction probability, all gene expression analyses, from multiple subsets and conditions were ranked.
Table 3 summarizes the classification accuracy and a relative ranking for each category. Rankings were used to identify the cell subsets and conditions that yielded high prediction accuracy as well as a wider range of predicted probability values. Correct prediction ranged from 68% up to 100% when tested on the cohort. Following these criteria, five cell subsets/conditions providing the highest classification accuracy combined with the highest predicted probability were highlighted (Table 3).
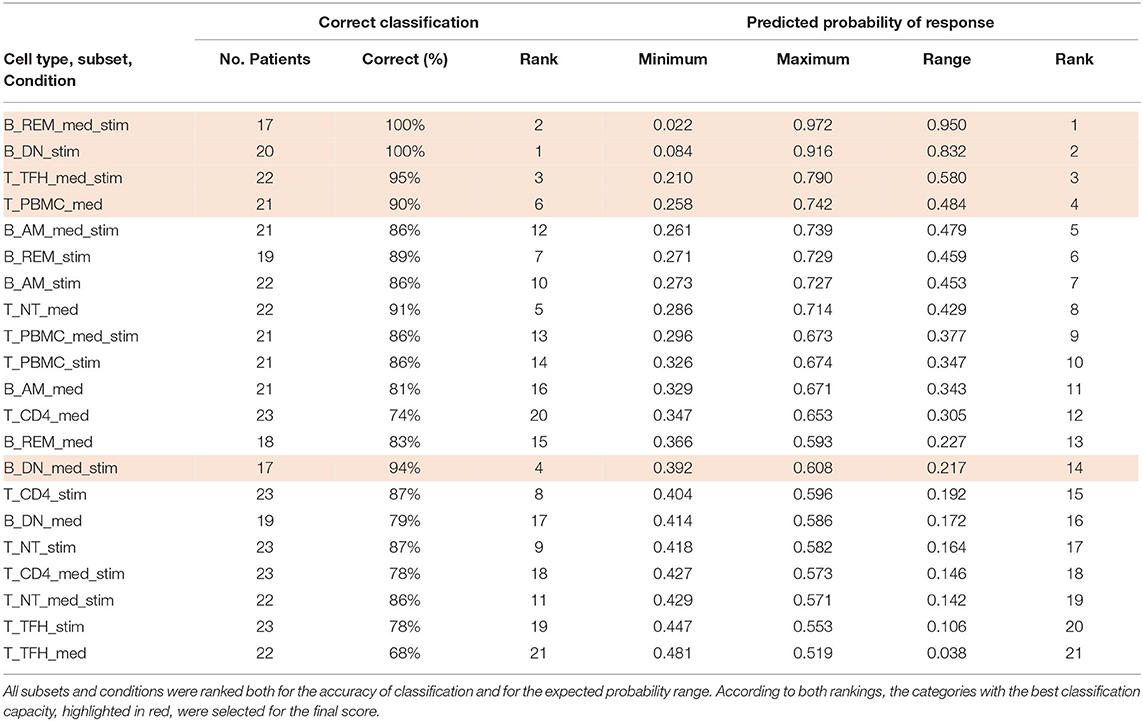
Table 3. Subsets and conditions importance ranking.
Finally, the B and T cells subsets/conditions were used to calculate a combined score. The score, was then tested in our cohort of patients which were blindly predicted as responders and non-responders. In this case, as shown in Figure 4 and Table 4, only one patient out of the entire cohort was misclassified providing a prediction accuracy of 95.6%.
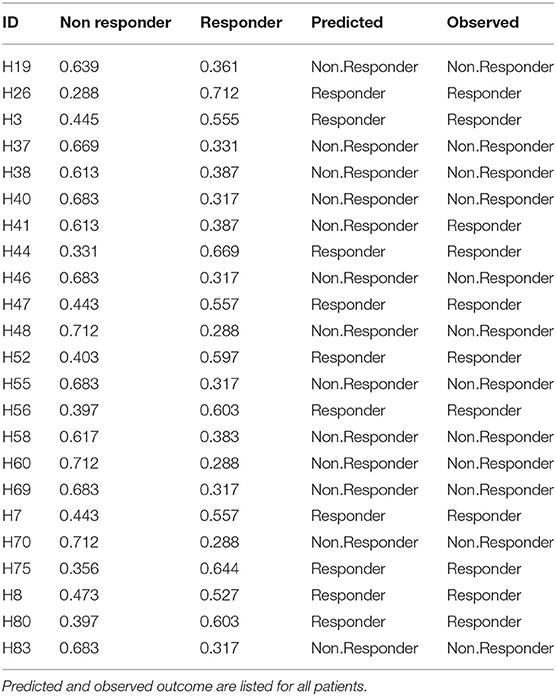
Table 4. Cross validation of the model.
Due to the small sample size, in order to overcome the unfeasibility to perform a nested cross valitation, we confirmed the stability of the accuracy in features' selection of the top 5 B/T subsets/conditions resampling the dataset according to these 5 subset/condition. This re-analysis confirmed the stability in feature's selection of the initial model. Indeed, all subset models out of the 5 selected cell subsets/ condition feature displayed between 80 and 100% accuracy according to the bootstrap replications (Supplementary Table 3). The best performing subset by this metric was the B DN med_stim subset with a confidence interval ranging from 94 to 100%. All genes from the subset models had 50–90% selection rates in bootstrap replicates.
Functional Analysis of Genes Selected by Artificial Intelligence
In order to characterize the biological functions of the genes used to build the five models with the highest prediction accuracy, we performed a functional enrichment analysis on the five sets of genes shown in Table 5. According to gene set enrichment analysis, the REM med_stim selected genes associated with transcription pathways of chemokine expression and T cell-oriented proliferation (Figure 5). These results are in line with ontologies which were particularly enriched in the positive regulation of T helper I type immune responses (Figure 5). In the T cell counterpart, pTFH cells, several genes involved in cytokine-cytokine mediated signaling were enriched. Also JAK-STAT signaling and TLR oriented stimulation pathways were upregulated (Figure 5) in patients able to respond to TIV. It is important to mention that other genes, such as IL21 and TNSF13 (APRIL), previously reported to be crucial in the T-B cell interaction (23, 24), resulted informative after in vitro stimulation to define responders. According to our previous analysis (15) these data may suggest that the functional expression of these genes after in vitro stimulation is able to predict the ability of these cells to activate a functional cascade which sustain an effective humoral response after vaccination.
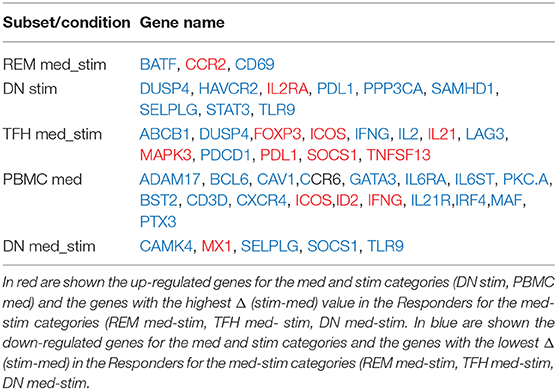
Table 5. List of the genes used to build the five models with the highest prediction accuracy.
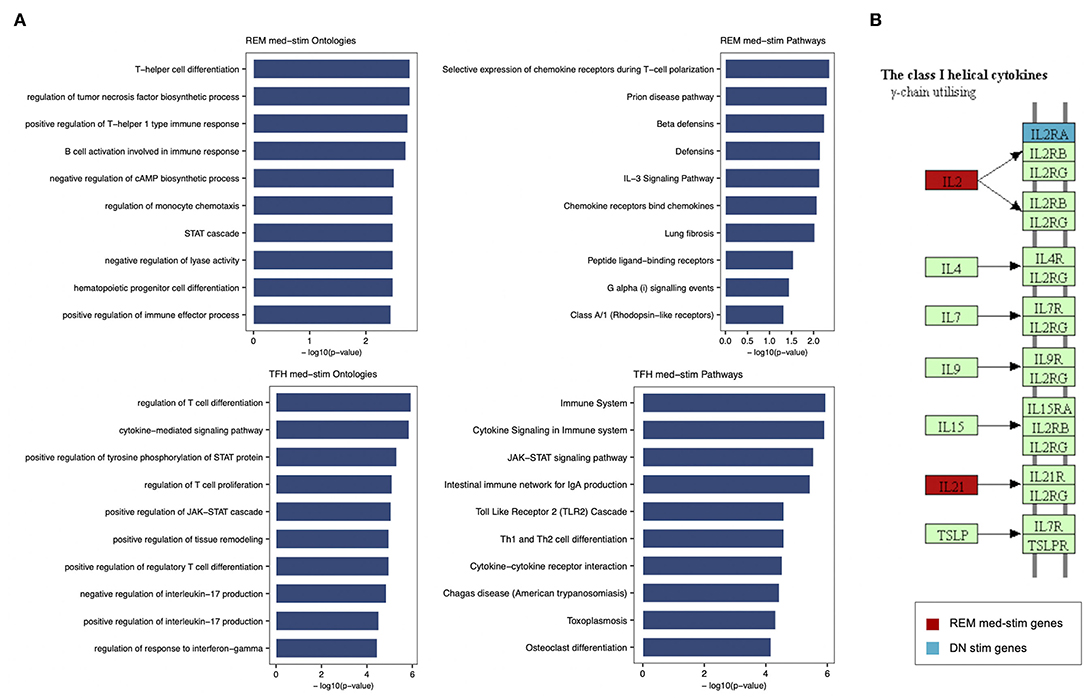
Figure 5. Enrichment analysis performed for REM med-stim and TFH med-stim genes on GO terms and pathways. (A) Bar plots with the top 10 terms sorted by p-value. (B) Cytokine-cytokine receptor Kegg map that shows in red the REM med-stim genes and in blue the DN stim gene.
Gene ontology analysis also revealed the expression of chemokine receptors with complementary activity between IgD- CD27- Double Negative (DN) B cells and pTFH. Importantly IL2 and IL2RA were both selected in the pTFH and DN, respectively. These data may suggest how activation of this pathway after in vitro stimulation represents a functional correlate of plasma cell lineage commitment after in vitro stimulation as previously reported in mice (25).
Discussion
Definitive and predictive biomarkers of vaccination efficacy are still largely unknown and may provide crucial information in the design or improvement of existing vaccines. This gap further applies to specific groups of patients presenting with underlying immunological conditions which increase their risk of suboptimal responses to vaccinations (4, 5). In the present study we developed a predictive score of immunogenicity to seasonal flu vaccination through an artificial intelligence approach fed by data deriving from a novel in vitro gene expression testing approach (IVIGET) performed prior to the immunization in a cohort of HIV infected patients.
Systems biology has helped to develop specific predictive assays in the oncology field. Also, targeted molecular assays have played an increasingly important role in identifying prognostic outcomes or predicting response to chemotherapy, starting from tumor biopsies (26). Indeed, these assays, which are now routinely performed in local pathology labs to help guide treatment decisions in breast cancer (27) lung cancer (28), and colorectal cancer (29), have been tested and validated on tumor biopsies.
On the other hand, systems vaccinology has been often analyzed in total blood or cell suspensions (e.g., PMBCs) which present an high intrinsic variability due to transitory confounding effects (e.g., concomitant infections or vaccination, inflammation, systemic immune deficiency, etc.) which may represent important variables making the aim of systems biology even more challenging. In addition, specific changes in cell frequency due to underlying immune defects or to physiologic conditions (i.e., age, pregnancy) may importantly interfere with the analysis of functional correlates of vaccine efficacy (11, 30).
Additional confounding effects are represented by inter-individual differences such as gender, age, pre-existing immunity, microbiota or systemic conditions which may further affect data analysis and their interpretation (31–33).
Following this idea, over the last few years we have described trancriptional signatures of vaccine response from purified lymphocyte subsets or single Ag specific cells in VPs (14, 16, 17). Our data demonstrated how the analysis of purified cell subpopulations may provide additional information compared to total PBMCs, and how gene expression analysis after in vitro stimulation may provide distinct predictive correlates of Ab and cellular response upon TIV (16) in VPs. In the present study, our analysis approach complement the evidence produced on single subsets applying state-of- the-art machine learning and methodology to the in vitro gene expression testing (IVIGET) which is focused on cell subsets directly involved in the immune responses upon Influenza vaccination. After multiple gene selection methods were applied for all subsets and conditions the score was interrogated at the time of vaccination on the ability to predict immune response to TIV in a previously investigated cohort of HIV infected patients (14). Albeit limited by the small sample size, which made the nested cross validation unfeasible, our analysis was able to perform a selection of genes and conditions able to predict vaccination response in specific B and T cell subsets. Conditions with higher prediction probability and correct classification were further ranked and selected to produce the final score which was blindly tested on the cohort. To further overcome the contamination of the test set, the 5 top ranked subsets after single-model re-analysis confirmed the stability of the accuracy and suggests how the model is able to build a predictive score for vaccination response by selecting important subset/condition to be validated in larger scale studies. Four out of five of the subset/condition selected for the final score included the stimulated condition and more precisely three out of the five refer to data derived from the difference in gene expression between the stimulated and unstimulated condition. Overall these results suggest that this in vitro stimulation approach in combination with others in vitro tests recently described (34) may provide important information in term of prediction of vaccine responsiveness and early pre-clinical selection of effective vaccine candidates for VPs. Our data may thus confirm that gene expression after a relatively short (16 h) in vitro stimulation may emulate early transcriptional changes that were analyzed in vivo both in mice (35) and in humans (36, 37). Early transcriptional changes, derived from whole transcriptome sequencing from blood samples collected at day 0, 1, 3, and 7 after immunization were shown to be informative in predicting long-term humoral and cell mediated responses to Hepatitis B, Ebola (38) and yellow fever (36) vaccinations. Interestingly the majority of differentially expressed genes (DEGs) resulted from the analyis between day 1 or day 3 and day 0 suggesting that early signatures were able to orchestrate and correlate with long term memory responses. In line with this, our analysis revealed how the majority of selected features were among Differentially Induced Genes (DIGs) after a peptide mix stimulation of 16 h). Following these evidence we also recently reported how early signatures after in vitro stimulation in Ag specific B cells were able to define the B cell fate after re-encountering of the antigen (39). Overall these findings suggest that both the analysis of purified cells, directly involved in the immune response triggered by a peptide-specific stimulation may provide distinct signatures of immunogenicity that may be useful to implement vaccination predictive tools.
It is important to consider as a limit of the tools presented here, that effectiveness of the score may be specific to the seasonal influenza vaccination (e.g., 2009) and may not apply to other viral strains that make up the vaccine as it continuously changes over the years. It was noted by Nakaya et al. that transcriptional differences differed between the Live Attenuated Influenza Vaccine and the TIV with respect to both classes of genes and cell subsets orchestrating the early immune response (40). Indeed, in a targeted microarray confirmatory analysis on sorted subsets, B cells showed higher DEGs in TIV vaccinee compared to LAIV with a peculiar enrichment in Antibody secreting cells genes (39, 40). Additional studies will be needed to cross validate the score in yearly vaccinated patients and in a vaccine-type/year specific manner. The overfitting caused by the model may represent another limit of the study (41). To reduce this potential problem, we adopted the Adaptive Boosting algorithm which is less susceptible to overfitting through implicit regularization and attempts to combine rules to create a more accurate prediction (http://rob.schapire.net/papers/explaining-adaboost.pdf). Moreover, we have implemented a robust feature selection based on four different methods and we used a dataset balanced between responders and non-responders. To further reduce the risk of overfitting and to increase the accuracy of the models, it would be necessary to increase the sample size and possibly use two independent datasets for the testing and training phases (42).
As previously discussed, the score applies on a relatively limited and curated panel of genes that cannot provide a complete mechanistic insight on the biology orchestrating the immune response upon TIV. However, the genes selected by the score confirm the accumulating evidence on B and T lymphocytes functional data which have been produced in the last few years in patients differentially responding to TIV. Indeed, previous results in pTFH after in vitro stimulation highlight the importance of IL21, found upregulated in R (43), confirming previous report in children, adults and elderly able to respond to TIV (44). Also the IL2 pathway, in line with previous evidence (42, 43), seems negatively correlated to the ability to respond to the vaccination when over expressed by pTFH. Overall, these data suggest how IL2 expression triggers a Th1 oriented immune response, rather than long term memory, which was confirmed in another study investigating the correlation between circulating TfH and immunogenicity upon Ebola virus vaccination (44). Our data further add information about the IL2 pathway in the B cell compartment as it was noted that IL2RA was included by the gene selection of DN after in vitro stimulation. The IL2 effect on human naïve B cells was recently investigated for the ability to induce plasmacell differentiation through ERK signaling after BACH2 silencing (25). For the first time, we showed that in TIV non responders, IL2RA receptor was upregulated in the so called “double negative” B-cell subset (expressing neither CD27 nor IgD), recently reported to be accumulated in aging populations (45). Overall, these data may suggest how the lack of downregulation in the B cell counterpart after IL2 production from the circulating TFH may interfere with an adequate memory response. Additional studies on this subset will be needed in order to define whether a manipulation or an adjuvanted vaccination specifically targeting the IL21/IL2 molecule production and receptors expression may increase vaccine immunogenicity.
Also Resting memory after in vitro stimulation were selected by the score as an informative subset of TIV response. BATF, a transcription factor which was recently showed to induce plasmacell differentiation of memory B cells after CD40L/CD40 signaling (46) was upregulated after H1N1 peptides in vitro stimulation of TIV responders. Also CD69 and CCR2 genes emerging from the score in the Resting memory subset confirm the importance of a T cell mediated response.
Although this analysis cannot provide a full mechanistic insight of the molecular mechanisms underlying the immune response since it is performed on a curated and limited panel of genes rather than the full transcriptome, it is promising in providing functional correlates to be used in a prediction score. Additional mechanistic analysis with deeper transcriptional analysis should confirm findings from these data.
In conclusion our analysis suggest that the in vitro stimulation and gene expression analysis on purified cell subsets that are involved in the immune responses upon vaccination, may represent valuable information to build a predictive score of immunogenicity. These analyses should be supported by future studies with larger sample size in order to validate this score in HIV infected children. These results may inform novel and more effective immunization strategies in HIV infected children and in other vulnerable population presenting with suboptimal immune responses.
Future studies, beyond the current approach, to evaluate protective immune responses remains an important goal to facilitate the interpretation of response to existing and emerging vaccines, particularly in VPs.
Data Availability Statement
The original contributions presented in the study are included in the article/Supplementary Materials, further inquiries can be directed to the corresponding author/s.
Ethics Statement
The studies involving human participants were reviewed and approved by Coordinamento Amminstrativo Studi Clinici e Comitato Etico Presidenza IRCCS Ospedale Pediatrico Bambino Gesù. Written informed consent to participate in this study was provided by the participants' legal guardian/next of kin.
Author Contributions
NC, LD, PP, and SaP conceived the study and designed the experiments. NC and LD performed the experimental procedures. NC and GP drafted the first version of the article. CB, MF, and NC performed statistical analysis and bioinformatics. VS, EM and PZ provided samples and participated to the design of the study. Supervision and resources were provided by PR, PP, and SP. All authors participated in writing, review and editing of the article.
Funding
This work was made possible by support from a Miami CFAR pilot award to NC, from Children's Hospital Bambino Gesù, ricerca corrente 2020 to NC and ricerca corrente 2019 to PP. We also received support from grants AI108472 and AI127347 to SP and the Laboratory Sciences Core of the Miami CFAR (P30AI073961) from the National Institutes of Health (NIH), which was supported by the following NIH Co-Funding and Participating Institutes and Centers: NIAID, NCI, NICHD, NHLBI, NIDA, NIMH, NIA, NIDDK, NIGMS, FIC, and OAR.
Conflict of Interest
MF, and CB were employed by BioStat Solutions, Inc.
The remaining authors declare that the research was conducted in the absence of any commercial or financial relationships that could be construed as a potential conflict of interest.
Acknowledgments
We would like to acknowledge all patients and guardians who decided to participate to the study. We thank Celeste Sanchez, Varghese George, Sara Alfieri. We acknowledge Timothy Ambrose from Biostat Solution who worked on the data analysis over the revision process. We thank Jennifer Faudella for her administrative assistance. We thank Andrea Rosati for discussions and suggestions during the preliminary phase of the study.
Supplementary Material
The Supplementary Material for this article can be found online at: https://www.frontiersin.org/articles/10.3389/fimmu.2020.559590/full#supplementary-material
Supplementary Figure 1. ELISpot analysis. (A) Shows representative plates for ELIspot. Dot plot in panel B shows H1N1 specific B cells per million PBMCs from samples collected 21 days after TIV.
Supplementary Table 1. Gene panels with probe list for B cells.
Supplementary Table 2. Gene panels with probe list for T cells.
Supplementary Table 3. Single model re-analysis on top 5 ranked subsets/conditions.
References
1. Roush SW, Murphy TV, Vaccine-Preventable Disease Table Working G. Historical comparisons of morbidity and mortality for vaccine-preventable diseases in the United States. JAMA. (2007) 298:2155–63. doi: 10.1001/jama.298.18.2155
2. Centers for Diseas and Prevention. Local health department costs associated with response to a school-based pertussis outbreak — Omaha, Nebraska, September-November 2008. MMWR Morb Mortal Wkly Rep. (2011) 60:5–9. Available online at: https://www.cdc.gov/mmwr/preview/mmwrhtml/mm6001a2.htm
3. Cagigi A, Cotugno N, Giaquinto C, Nicolosi L, Bernardi S, Rossi P, et al. Immune reconstitution and vaccination outcome in HIV-1 infected children: present knowledge and future directions. Hum Vaccin Immunother. (2012) 8:1784–94. doi: 10.4161/hv.21827
4. Cotugno N, Douagi I, Rossi P, Palma P. Suboptimal immune reconstitution in vertically HIV infected children: a view on how HIV replication and timing of HAART initiation can impact on T and B-cell compartment. Clin Dev Immunol. (2012) 2012:805151. doi: 10.1155/2012/805151
5. Cotugno N, Ruggiero A, Santilli V, Manno EC, Rocca S, Zicari S, et al. OMIC technologies and vaccine development: from the identification of vulnerable individuals to the formulation of invulnerable vaccines. J Immunol Res. (2019) 2019:8732191. doi: 10.1155/2019/8732191
6. Sutcliffe CG, Moss WJ. Do children infected with HIV receiving HAART need to be revaccinated? Lancet Infect Dis. (2010) 10:630–42. doi: 10.1016/S1473-3099(10)70116-X
7. Dube E, Leask J, Wolff B, Hickler B, Balaban V, Hosein E, et al. The WHO Tailoring Immunization Programmes (TIP) approach: review of implementation to date. Vaccine. (2018) 36:1509–15. doi: 10.1016/j.vaccine.2017.12.012
8. Doherty M, Buchy P, Standaert B, Giaquinto C, Prado-Cohrs D. Vaccine impact: benefits for human health. Vaccine. (2016) 34:6707–14. doi: 10.1016/j.vaccine.2016.10.025
9. Poland GA, Kennedy RB, Mckinney BA, Ovsyannikova IG, Lambert ND, Jacobson RM, et al. Vaccinomics, adversomics, and the immune response network theory: individualized vaccinology in the 21st century. Semin Immunol. (2013) 25:89–103. doi: 10.1016/j.smim.2013.04.007
10. Poland GA. Pharmacology, vaccinomics, and the second golden age of vaccinology. Clin Pharmacol Ther. (2007) 82:623–6. doi: 10.1038/sj.clpt.6100379
11. Lee AH, Shannon CP, Amenyogbe N, Bennike TB, Diray-Arce J, Idoko OT, et al. Dynamic molecular changes during the first week of human life follow a robust developmental trajectory. Nat Commun. (2019) 10:1092. doi: 10.1038/s41467-019-08794-x
12. Poland GA, Ovsyannikova IG, Kennedy RB, Lambert ND, Kirkland JL. A systems biology approach to the effect of aging, immunosenescence and vaccine response. Curr Opin Immunol. (2014) 29:62–8. doi: 10.1016/j.coi.2014.04.005
13. Pulendran B. Immunology taught by vaccines. Science. (2019) 366:1074–5. doi: 10.1126/science.aau6975
14. Cotugno N, De Armas L, Pallikkuth S, Rinaldi S, Issac B, Cagigi A, et al. Perturbation of B cell gene expression persists in HIV-infected children despite effective antiretroviral therapy and predicts H1N1 response. Front Immunol. (2017) 8:1083. doi: 10.3389/fimmu.2017.01083
15. De Armas LR, Cotugno N, Pallikkuth S, Pan L, Rinaldi S, Sanchez MC, et al. Induction of IL21 in Peripheral T follicular helper cells is an indicator of influenza vaccine response in a previously vaccinated HIV-infected pediatric cohort. J Immunol. (2017) 198:1995–2005. doi: 10.4049/jimmunol.1601425
16. De Armas LR, Pallikkuth S, Pan L, Rinaldi S, Cotugno N, Andrews S, et al. Single cell profiling reveals PTEN overexpression in influenza-specific B cells in aging HIV-infected individuals on Anti-retroviral Therapy. Sci Rep. (2019) 9:2482. doi: 10.1038/s41598-019-38906-y
17. Cotugno N, Zicari S, Morrocchi E, De Armas LR, Pallikkuth S, Rinaldi S, et al. Higher PIK3C2B gene expression of H1N1+ specific B-cells is associated with lower H1N1 immunogenicity after trivalent influenza vaccination in HIV infected children. Clin Immunol. (2020) 215:108440. doi: 10.1016/j.clim.2020.108440
18. Cagigi A, Rinaldi S, Di Martino A, Manno EC, Zangari P, Aquilani A, et al. Premature immune senescence during HIV-1 vertical infection relates with response to influenza vaccination. J Allergy Clin Immunol. (2014) 133:592–4. doi: 10.1016/j.jaci.2013.10.003
19. Haury AC, Gestraud P, Vert JP. The influence of feature selection methods on accuracy, stability and interpretability of molecular signatures. PLoS ONE. (2011) 6:e28210. doi: 10.1371/journal.pone.0028210
20. Friedman J, Hastie T, Tibshirani R. Regularization paths for generalized linear models via coordinate descent. J Stat Softw. (2010) 33:1–22. doi: 10.18637/jss.v033.i01
21. Zhang HH, Ahn J, Lin X, Park C. Gene selection using support vector machines with non-convex penalty. Bioinformatics. (2006) 22:88–95. doi: 10.1093/bioinformatics/bti736
22. Ishwaran H, Lu M. Standard errors and confidence intervals for variable importance in random forest regression, classification, and survival. Stat Med. (2019) 38:558–82. doi: 10.1002/sim.7803
23. Pallikkuth S, Pilakka Kanthikeel S, Silva SY, Fischl M, Pahwa R, Pahwa S. Upregulation of IL-21 receptor on B cells and IL-21 secretion distinguishes novel 2009 H1N1 vaccine responders from nonresponders among HIV-infected persons on combination antiretroviral therapy. J Immunol. (2011) 186:6173–81. doi: 10.4049/jimmunol.1100264
24. Matsuda Y, Haneda M, Kadomatsu K, Kobayashi T. A proliferation-inducing ligand sustains the proliferation of human naive (CD27(-)) B cells and mediates their differentiation into long-lived plasma cells in vitro via transmembrane activator and calcium modulator and cyclophilin ligand interactor and B-cell mature antigen. Cell Immunol. (2015) 295:127–36. doi: 10.1016/j.cellimm.2015.02.011
25. Hipp N, Symington H, Pastoret C, Caron G, Monvoisin C, Tarte K, et al. IL-2 imprints human naive B cell fate towards plasma cell through ERK/ELK1-mediated BACH2 repression. Nat Commun. (2017) 8:1443. doi: 10.1038/s41467-017-01475-7
26. Nielsen T, Wallden B, Schaper C, Ferree S, Liu S, Gao D, et al. Analytical validation of the PAM50-based prosigna breast cancer prognostic gene signature assay and ncounter analysis system using formalin-fixed paraffin-embedded breast tumor specimens. BMC Cancer. (2014) 14:177. doi: 10.1186/1471-2407-14-177
27. Selinka HC, Bosing-Schneider R. xid mice fail to express an anti-dextran immune response but carry alpha(1-3)dextran-specific lymphocytes in their potential repertoire. Eur J Immunol. (1988) 18:1727–32. doi: 10.1002/eji.1830181111
28. Li R, Li H, Ge C, Fu Q, Li Z, Jin Y, et al. Increased expression of the RNA-binding motif protein 47 predicts poor prognosis in non-small-cell lung cancer. Oncol Lett. (2020) 19:3111–22. doi: 10.3892/ol.2020.11417
29. Huang R, Zhou L, Chi Y, Wu H, Shi L. LncRNA profile study reveals a seven-lncRNA signature predicts the prognosis of patients with colorectal cancer. Biomark Res. (2020) 8:8. doi: 10.1186/s40364-020-00187-3
30. Cotugno N, De Armas L, Pallikkuth S, Rossi P, Palma P, Pahwa S. Paediatric HIV infection in the 'omics era: defining transcriptional signatures of viral control and vaccine responses. J Virus Erad. (2015) 1:153–8. doi: 10.1016/S2055-6640(20)30507-0
31. Furman D, Hejblum BP, Simon N, Jojic V, Dekker CL, Thiebaut R, et al. Systems analysis of sex differences reveals an immunosuppressive role for testosterone in the response to influenza vaccination. Proc Natl Acad Sci USA. (2014) 111:869–74. doi: 10.1073/pnas.1321060111
32. Nakaya HI, Bruna-Romero O. Is the gut microbiome key to modulating vaccine efficacy? Expert Rev Vaccines. (2015) 14:777–9. doi: 10.1586/14760584.2015.1040395
33. Zimmermann P, Curtis N. Factors that influence the immune response to vaccination. Clin Microbiol Rev. (2019) 32:18. doi: 10.1128/CMR.00084-18
34. Sanchez-Schmitz G, Stevens CR, Bettencourt IA, Flynn PJ, Schmitz-Abe K, Metser G, et al. Microphysiologic human tissue constructs reproduce autologous age-specific BCG and HBV primary immunization in vitro. Front Immunol. (2018) 9:2634. doi: 10.3389/fimmu.2018.02634
35. Derian N, Bellier B, Pham HP, Tsitoura E, Kazazi D, Huret C, et al. Early transcriptome signatures from immunized mouse dendritic cells predict late vaccine-induced T-cell responses. PLoS Comput Biol. (2016) 12:e1004801. doi: 10.1371/journal.pcbi.1004801
36. Querec TD, Akondy RS, Lee EK, Cao W, Nakaya HI, Teuwen D, et al. Systems biology approach predicts immunogenicity of the yellow fever vaccine in humans. Nat Immunol. (2009) 10:116–25. doi: 10.1038/ni.1688
37. Bartholomeus E, De Neuter N, Meysman P, Suls A, Keersmaekers N, Elias G, et al. Transcriptome profiling in blood before and after hepatitis B vaccination shows significant differences in gene expression between responders and non-responders. Vaccine. (2018) 36:6282–9. doi: 10.1016/j.vaccine.2018.09.001
38. Rechtien A, Richert L, Lorenzo H, Martrus G, Hejblum B, Dahlke C, et al. Systems vaccinology identifies an early innate immune signature as a correlate of antibody responses to the ebola vaccine rVSV-ZEBOV. Cell Rep. (2017) 20:2251–61. doi: 10.1016/j.celrep.2017.08.023
39. Cotugno N, Morrocchi E, Rinaldi S, Rocca S, Pepponi I, Di Cesare S, et al. Early antiretroviral therapy-treated perinatally HIV-infected seronegative children demonstrate distinct long-term persistence of HIV-specific T-cell and B-cell memory. AIDS. (2020) 34:669–80. doi: 10.1097/QAD.0000000000002485
40. Nakaya HI, Wrammert J, Lee EK, Racioppi L, Marie-Kunze S, Haining WN, et al. Systems biology of vaccination for seasonal influenza in humans. Nat Immunol. (2011) 12:786–95. doi: 10.1038/ni.2067
41. Camacho DM, Collins KM, Powers RK, Costello JC, Collins JJ. Next-generation machine learning for biological networks. Cell. (2018) 173:1581–92. doi: 10.1016/j.cell.2018.05.015
42. Gonzalez-Dias P, Lee EK, Sorgi S, De Lima DS, Urbanski AH, Silveira EL, et al. Methods for predicting vaccine immunogenicity and reactogenicity. Hum Vaccin Immunother. (2020) 16:269–76. doi: 10.1080/21645515.2019.1697110
43. Pallikkuth S, De Armas LR, Rinaldi S, George VK, Pan L, Arheart KL, et al. Dysfunctional peripheral T follicular helper cells dominate in people with impaired influenza vaccine responses: results from the FLORAH study. PLoS Biol. (2019) 17:e3000257. doi: 10.1371/journal.pbio.3000257
44. Cubas R, Van Grevenynghe J, Wills S, Kardava L, Santich BH, Buckner CM, et al. Reversible reprogramming of circulating memory T follicular helper cell function during chronic HIV infection. J Immunol. (2015) 195:5625–36. doi: 10.4049/jimmunol.1501524
45. Rinaldi S, Pallikkuth S, George VK, De Armas LR, Pahwa R, Sanchez CM, et al. Paradoxical aging in HIV: immune senescence of B Cells is most prominent in young age. Aging. (2017) 9:1307–25. doi: 10.18632/aging.101229
Keywords: gene expression, predictive biomarkers, artificial intelligence, deep learning, influenza vaccine, HIV, vaccinomics
Citation: Cotugno N, Santilli V, Pascucci GR, Manno EC, De Armas L, Pallikkuth S, Deodati A, Amodio D, Zangari P, Zicari S, Ruggiero A, Fortin M, Bromley C, Pahwa R, Rossi P, Pahwa S and Palma P (2020) Artificial Intelligence Applied to in vitro Gene Expression Testing (IVIGET) to Predict Trivalent Inactivated Influenza Vaccine Immunogenicity in HIV Infected Children. Front. Immunol. 11:559590. doi: 10.3389/fimmu.2020.559590
Received: 06 May 2020; Accepted: 18 August 2020;
Published: 05 October 2020.
Edited by:
Francesco Borriello, Boston Children's Hospital and Harvard Medical School, United StatesReviewed by:
Brett McKinney, University of Tulsa, United StatesPaulo Bettencourt, University of Oxford, United Kingdom
Copyright © 2020 Cotugno, Santilli, Pascucci, Manno, De Armas, Pallikkuth, Deodati, Amodio, Zangari, Zicari, Ruggiero, Fortin, Bromley, Pahwa, Rossi, Pahwa and Palma. This is an open-access article distributed under the terms of the Creative Commons Attribution License (CC BY). The use, distribution or reproduction in other forums is permitted, provided the original author(s) and the copyright owner(s) are credited and that the original publication in this journal is cited, in accordance with accepted academic practice. No use, distribution or reproduction is permitted which does not comply with these terms.
*Correspondence: Savita Pahwa, c3BhaHdhQG1lZC5taWFtaS5lZHU=; Paolo Palma, cGFvbG8ucGFsbWFAb3BiZy5uZXQ=