 Tiina Kelkka1,2,3,4*
 Paula Savola1,2,3,4†
 Dipabarna Bhattacharya1,2,3,4†
 Jani Huuhtanen1,2,3,4†
 Tapio Lönnberg5
 Matti Kankainen1,2,4
 Kirsi Paalanen6
 Mikko Tyster1,2,3,4Maija Lepistö7Pekka Ellonen7Johannes Smolander5Samuli Eldfors7Bhagwan Yadav1,2,3,4
 Sofia Khan5Riitta Koivuniemi8
 Christopher Sjöwall9
 Laura L. Elo5,10Harri Lähdesmäki11Yuka Maeda12Hiroyoshi Nishikawa12
 Marjatta Leirisalo-Repo8
 Tuulikki Sokka-Isler6,13
 Satu Mustjoki1,2,3,4*
- 1Hematology Research Unit Helsinki, University of Helsinki, Helsinki, Finland
- 2Department of Hematology, Helsinki University Hospital Comprehensive Cancer Center, Helsinki, Finland
- 3Department of Clinical Chemistry and Hematology, University of Helsinki, Helsinki, Finland
- 4Translational Immunology Research Program, University of Helsinki, Helsinki, Finland
- 5Turku Bioscience Centre, University of Turku and Åbo Akademi University, Turku, Finland
- 6Rheumatology, Jyväskylä Central Hospital, Jyväskylä, Finland
- 7Institute for Molecular Medicine Finland (FIMM), Helsinki Institute of Life Science (HiLIFE), University of Helsinki, Helsinki, Finland
- 8Rheumatology, University of Helsinki, Helsinki University Hospital, Helsinki, Finland
- 9Department of Biomedical and Clinical Sciences, Division of Inflammation and Infection, Linköping University, Linköping, Sweden
- 10Institute of Biomedicine, University of Turku, Turku, Finland
- 11Department of Computer Science, Aalto University School of Science, Espoo, Finland
- 12Division of Cancer Immunology, Research Institute/Exploratory Oncology Research and Clinical Trial Center (EPOC), National Cancer Center, Tokyo, Japan
- 13University of Eastern Finland, Faculty of Health Sciences, Kuopio, Finland
Rheumatoid arthritis (RA) is a complex autoimmune disease targeting synovial joints. Traditionally, RA is divided into seropositive (SP) and seronegative (SN) disease forms, the latter consisting of an array of unrelated diseases with joint involvement. Recently, we described a severe form of SN-RA that associates with characteristic joint destruction. Here, we sought biological characteristics to differentiate this rare but aggressive anti-citrullinated peptide antibody-negative destructive RA (CND-RA) from early seropositive (SP-RA) and seronegative rheumatoid arthritis (SN-RA). We also aimed to study cytotoxic CD8+ lymphocytes in autoimmune arthritis. CND-RA, SP-RA and SN-RA were compared to healthy controls to reveal differences in T-cell receptor beta (TCRβ) repertoire, cytokine levels and autoantibody repertoires. Whole-exome sequencing (WES) followed by single-cell RNA-sequencing (sc-RNA-seq) was performed to study somatic mutations in a clonally expanded CD8+ lymphocyte population in an index patient. A unique TCRβ signature was detected in CND-RA patients. In addition, CND-RA patients expressed higher levels of the bone destruction-associated TNFSF14 cytokine. Blood IgG repertoire from CND-RA patients recognized fewer endogenous proteins than SP-RA patients’ repertoires. Using WES, we detected a stable mutation profile in the clonally expanded CD8+ T-cell population characterized by cytotoxic gene expression signature discovered by sc-RNA-sequencing. Our results identify CND-RA as an independent RA subset and reveal a CND-RA specific TCR signature in the CD8+ lymphocytes. Improved classification of seronegative RA patients underlines the heterogeneity of RA and also, facilitates development of improved therapeutic options for the treatment resistant patients.
Introduction
Rheumatoid arthritis is a chronic autoimmune disease in which the patient’s own immune system targets the synovial tissue in joints. According to the American College of Rheumatology (ACR) and European League Against Rheumatism (EULAR) classification criteria for rheumatoid arthritis (RA), seropositive RA (SP-RA) is characterized by the presence of anti-cyclic citrullinated peptide antibodies (ACPA) and/or rheumatoid factor (RF). Seronegative RA (SN-RA) is diagnosed when the diagnostic autoantibodies are not present and other underlying causes of joint inflammation have been excluded (1). In practice, SN-RA diagnosis is unspecific, and most patients can be reassigned to some other diagnosis during the follow-up (2).
We have recently provided a clinical description of an unusually severe form of SN-RA (3). These patients are negative for the clinically used anti-cyclic citrullinated peptide 2 (CCP2) test, and the clinical manifestations include the progression of joint destruction despite active therapy. Thus, we named the cohort as CCP-negative destructive (CND) RA, and differently from the classical SP-RA, the destruction is predominantly localized in the wrists, ankles, and even in large joints (3). The biomedical characteristics of this RA sub-type have not been studied before.
While SP-RA is strongly associated with the MHC II coding HLA-DRB1 (4), the genetic predisposition for SN-RA is different (5–7). The profound differences in disease genetics imply that there are also fundamental differences in disease pathomechanism between SP-RA and SN-RA. As many of the disease-associated loci especially in SN-RA are localized within the HLA-I loci, the role of CD8+ lymphocytes in RA should be investigated in more detail.
Replication errors are a natural part of DNA replication. Antigen recognition and the following T-cell activation and proliferation predispose the activated cells’ genomes to somatic mutations. The instrumental role of somatic mutations as drivers of cancer has been documented in detail (8). On the other hand, somatic mutations also accumulate in healthy tissues (9) with the highest mutation burdens reported thus far in the skin (10, 11), lung (12), and esophageal epithelium (13, 14).
Some of the mutations, especially in white blood cells, may contribute to chronic inflammation and autoimmunity (15–17). This hypothesis is supported by the identification of somatic mutations in the circulating, cytotoxic CD8+ and CD4+ lymphocytes in RA, Felty’s syndrome, aplastic anemia, multiple sclerosis, chronic graft-versus-host-disease (cGVHD) and common variable immune deficiency patients (16–22). The mutation harboring CD8+ lymphocyte clones in RA are stable, cytotoxic effector memory cells (16). Somatic mutations may modulate the function of mutation carrying T-cells, and thereby participate in disease progression.
We here present biological evidence that CND-RA is an independent subgroup of SN-RA with a unique CD8+ lymphocyte signature and a narrower autoantibody repertoire than diagnostic SP-RA.
Materials and Methods
For a comprehensive description see the Supplementary Material.
Ethical Approval, Public Involvement, and Sample Collection
The study was approved by the Helsinki University Hospital Ethics Committee. Patients and healthy controls were enrolled to the study in the Departments of Rheumatology at Jyväskylä Central Hospital and Helsinki University Hospital. After the study was introduced, all patients signed written informed consent. We followed the guidelines of the Declaration of Helsinki and recorded routine laboratory and clinical parameters at the time of sampling (Table 1 and in Supplementary Tables 1 and 2).
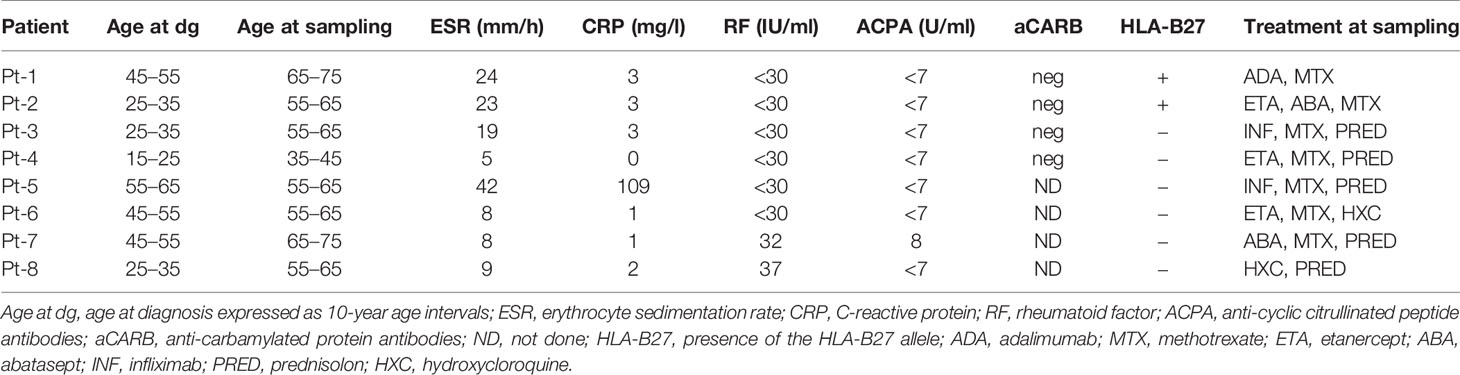
Table 1 Patients’ characteristics.
Peripheral blood samples (50 ml EDTA blood) were collected for the study. Buffy coats from healthy controls were provided by the Histocompatibility Testing Laboratory, Finnish Red Cross Blood service. Peripheral blood mononuclear cells (PBMNCs) were separated from EDTA blood or buffy coats using Ficoll gradient separation (Ficoll-Paque PLUS, GE Healthcare).
Flow Cytometry
Peripheral blood samples were stained for lymphocyte clonality analysis with anti-CD3 (SK7), anti-CD4 (SK3), and anti-CD8 (SK-1) (Becton Dickinson) and a panel of T-cell receptor β variable chain (TCR Vβ) antibodies (IOTest Beta Mark TCR V kit, Beckman Coulter Immunotech, cat. no IM3497), which recognize approximately 70% to 80% of the human TCR β V regions. After staining, red blood cells were lysed with BD FACS Lysing Solution (Becton Dickinson Biosciences) and re-suspended to phosphate-buffered saline (PBS) with 2 mM EDTA. Samples were acquired with FACSAria II or FACS Verse (Becton Dickinson) and analyzed with FlowJo software (Becton Dickinson).
Cell sorting was performed either from fresh or from cryopreserved PBMCs using FACSAria II (Becton Dickinson) or Sony SH800 (Sony Biotechnology Inc.). For sorting, MNCs were stained with anti-CD3 (SK7), anti-CD4 (SK3), anti-CD8 (SK-1), and the appropriate anti-Vβ antibody from the IOTest Beta Mark TCR V kit. Cell fractions’ purities were controlled with flow cytometry, and the purities of all sorted fractions were nearly 100%.
T-Cell Receptor Beta Repertoire Analysis
T-cell receptor beta (TCRβ) sequencing was performed from CD8+ cells’ genomic DNA according to the manufacturer’s instructions. Sequencing and data analysis were conducted as previously described in the FIMM Technology center with ImmunoSEQ assay by Adaptive Biotechnologies Corp. SP-RA, SN-RA and healthy controls have already been reported previously (16).
The analyses were started with the TCRβ matrices provided by the Adaptive Biotechnologies preprocessing pipeline. All data were transformed to VDJtools (23) format to reduce data complexity. Non-productive clonotypes were removed from the analysis. To assess the saturation of the sequencing results between the cohorts, the dependencies between samples diversity and sample size were determined with rarefaction plots inspired by Colwell et al. (24), and as implemented in VDJtools. We used a minimum sampling depth of 10 000 reads per sample and subsampled all samples to 10 000 reads. This normalization was performed to remove statistical biases for depth-dependent parameters. Multiple different diversity metrics, including Shannon-Wiener, Simpson and clonality indexes, were calculated with the CalcDiversityStats function.
For the subsampled data, we analyzed the antigen-specificities of non-singleton TCRβs, i.e. clonotypes with at least two supporting reads. To analyze the antigen-specificities of TCRβs in a supervised manner, we used VDJdb (25), the largest repository of TCR-sequences with known specificity to hard-match (=no mismatches allowed) against the TCRβ-sequences in our data. To analyze the TCR antigen-specificities in an unsupervised manner, we analyzed the amino acid mismatches (Hamming distance) within the antigen binding CDR3 part (26). TCRs that differed by one amino acid were pooled together to form a cluster with a potentially shared antigen target.
For the subsampled data, public TCRs across the samples were pooled together with the JoinSamples-command at amino acid level. Publicness was defined as clonotypes that were shared by at least two individuals. To normalize the sample numbers, subgroups were randomly resampled to yield the same number of samples (n=6 for each), and this was iterated ten times. The statistically enriched clonotypes were calculated with one-sided Fisher’s exact test, and the threshold for enrichment was chosen as uncorrected p < 0.05. After p-value correction (Benjamini-Hochberg), none of the 117 399 tested clonotypes remained significant.
Autoantibody Screen and Analysis
Autoantibodies were analyzed using the Invitrogen (Carlsbad, California, USA) ProtoArray protein microarray v5.1 platform. To compare the numbers of autoreactive antibodies in CND-RA, SP-RA and in the healthy controls, the cut-off for positivity was set to fold change 10 (FC10) compared to the average of healthy controls (n=5). The cutoff of FC15 was used for illustrations.
Cytokine Profiling
EDTA plasma samples were analyzed with Proseek Multiplex Inflammation I (Olink Biosciences) immunoassay as previously described (18). The panel includes the simultaneous measurement of 92 inflammation-related human proteins.
Variant Identification
Calling of somatic variants from whole-exome sequencing data was performed similar to our previous study (17) and included mapping reads against GRCh38 reference with BWA (27) and calling variants with the GATK toolkit and MuTect2 (28).
sc-RNA-Sequencing (sc-RNA-Seq)
Magnetic bead separated total CD8+ cells and flow-cytometry enriched Vb22 expressing clonal cells (gating strategy and purity plots are presented in Supplementary Figure 1) were partitioned using the Chromium Controller (10x Genomics), aiming at the capture of 6000 single cells from each sample. The sequencing libraries were generated using the single cell 3´ reagent kit (V1), following the manufacturer’s instructions. The libraries were sequenced using HiSeq 2500 (Illumina). The median sequencing depths were 5734 (bead-separated), and 7575 reads per cell (flow-enriched). The raw sequencing data were processed using CellRanger pipeline version 1.2.0 (10x Genomics) using the GRCh38 reference genome. The R single-cell toolkit SEURAT (29) version 2.3.4 was used for the analysis of single-cell transcriptomics data.
The single-cell gene expression matrices corresponding to the magnetic bead separated total CD8+ cells and flow-cytometry enriched Vb22 expressing clonal cells were merged into one Seurat object for downstream analysis. Dimensionality reduction for the data set was performed using PCA (with the top 2000 highly variable genes as per Seurat guidelines) and top 12 PCs were selected. Clusters were determined with a resolution of. 6 and tSNE was used (k=30) for visualization.
Additionally, Canonical Correlation analysis (CCA) was used to align (and cluster) the two data sets and to see common sources of variations between the data sets (Supplementary Materials and Methods, Supplementary Figures 2 and 3).
Data Sharing and Code Availability
TCR sequencing data are available in ImmuneAccess with the identifiers: https://doi.org/10.21417/B76C7W and (added once accepted). Other sequence data (immunogene panel, exome, and sc-RNA-sequencing) are available from corresponding authors upon request, owing to regulations pertaining to the authors’ ethics permit. Code related to TCRβ repertoire analysis can be found in https://github.com/janihuuh/snd_ra_tcrb_manu.
Statistical Analyses
Statistical analyses were performed using Prism 6, Qlucore Omics Explorer (Qlucore AB, Lund, Sweden) and R. In all analyses, p-values < 0.05 were considered as statistically significant. All statistical methods are given in figure legends. * p-values < 0.05, ** p-values < 0.01, *** p-values 0.001.
Results
Patients’ Characteristics
All CND-RA patients had developed typical joint destructions in wrists and ankles and had failed to respond to conventional anti-rheumatic therapy. Seven out of eight (n=8) included patients were on biological drugs at sampling, and detailed clinical characteristics can be found in Table 1 and Supplementary Table 1. SP-RA (n=51), SN-RA (n=11) patients, and the healthy controls (n=28) have been previously described in (16), and their characteristics are now summarized in Supplementary Table 2.
CND-RA Patients Harbor Fewer Antibodies Against Endogenous Proteins Than Patients With SP-RA
Antibody repertoires against endogenous proteins were analyzed using ProtoArray protein microarray, and assay performance was validated using a DELFIA assay that detected the therapeutic anti-TNFa antibodies in the CND-RA samples (Figure 1A).
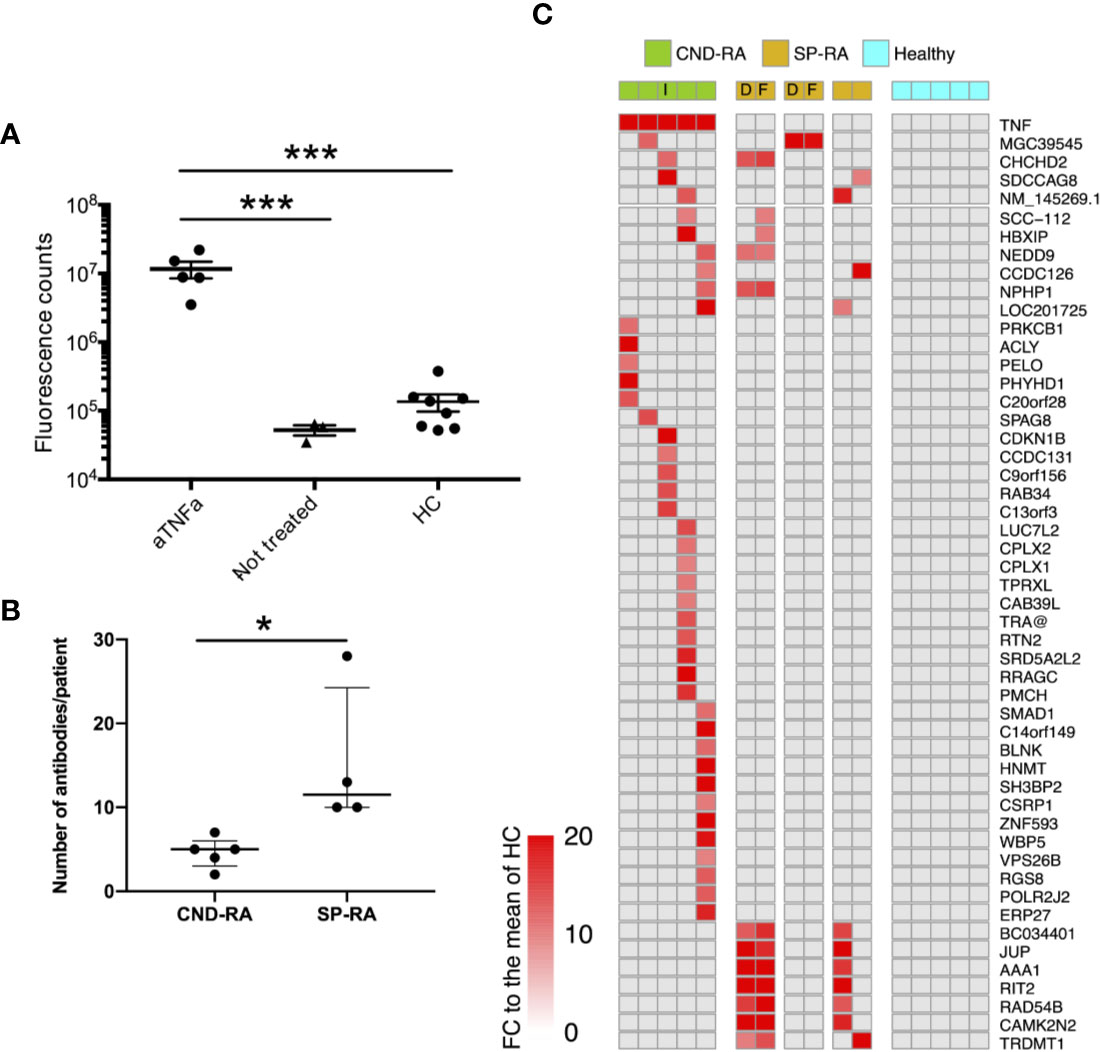
Figure 1 (A) Anti-TNFa antibodies were analyzed from plasma samples using a DELFIA based sandwich immunoassay. Statistics were calculated using One-way ANOVA with Tukey’s post-hoc test. (B) Number of positive autoantibody findings in CND-RA and diagnostic phase SP-RA samples. Samples were regarded as positive when the observed fluorescence intensity exceeded fold change (FC) 10 compared to the mean of healthy controls. Median values are presented with inter-quartile ranges, Unpaired T-test. (C) Heat-map illustrating all antibodies that were detected in CND-RA. In addition, antibodies that were identified in more than one SP-RA samples are presented in the lower panel. Healthy controls did not have any reported autoantibodies. The cut-off for positivity is FC 15 compared to the mean of HC. aTNFa, anti-tumor necrosis factor-alpha; HC, healthy controls; CND-RA, ACPA-negative destructive rheumatoid arthritis; SP-RA, seropositive rheumatoid arthritis; D, diagnostic sample; T, sample from a treated patient; I, index patient for somatic mutation and sc-RNA-seq analyses. *p < 0.05, ***p < 0.001.
CND-RA patients with decades of disease history displayed fewer antibodies against endogenous proteins than the diagnostic SP-RA patients (Figure 1B). Figure 1C shows all autoreactive antibodies (FC>15 to the mean of healthy controls) that were detected in CND-RA together with autoreactive antibodies that were detected in at least 2 SP-RA patients. All RA-associated antibodies identified in the microarray experiment, including the previously reported anti-ZNF706 autoantibody (30) are shown in the Supplementary Figure 4. The reported antibodies were not detected in any of the healthy controls (n=5). Antibody profiles were stable as paired samples from two SP-RA patients after 14- or 16-months follow-up resulted in highly comparable results (Figure 1A and Supplementary Figure 4).
T-Cell Receptor Signature Differentiates CND-RA From SN-RA, SP-RA, and Healthy Controls
Each T-cell recombines its T-cell receptor (TCR) locus during thymic maturation. The recombined TCR is unique for each naïve T-cell, and all T-cells with identical TCRs are almost certainly derived from one single cell. TCR is responsible for antigen recognition in the context of either HLA I (CD8+ lymphocytes) or HLA II (CD4+ lymphocytes). As our patient cohort differed from the HLA II-associated seropositive RA, we hypothesized that this difference might translate into a unique CD8+ TCR signature. Similarly, as previously shown in SP-RA (16), CD8+ lymphocytes were more clonal than CD4+ lymphocytes in CND-RA (Supplementary Figure 5).
We compared the CD8+ TCRβ repertoires of CND-RA patients (n=8) to the TCRβ repertoires of newly diagnosed patients with either SP-RA (n=51) or SN-RA (n=11). To avoid sequencing depth induced bias in TCR diversity metrics, we selected a cut-off of 10 000 reads and removed samples below this. All samples passing the cut-off value (CND-RA n=6, SN-RA n=7, SP-RA n=46 and HC n=28) were resampled to 10 000 reads before further data analyses.
Clonality metrics are known to correlate with age, and this was also seen in our data set (Supplementary Figure 6). By using a linear regression model with age as confounding factor, we discovered that CND-RA patients had less diverse, i.e. more clonal CD8+ TCRβ-repertoire than the other subtypes of RA (Figure 2A). There were no statistically significant differences in age between the groups.
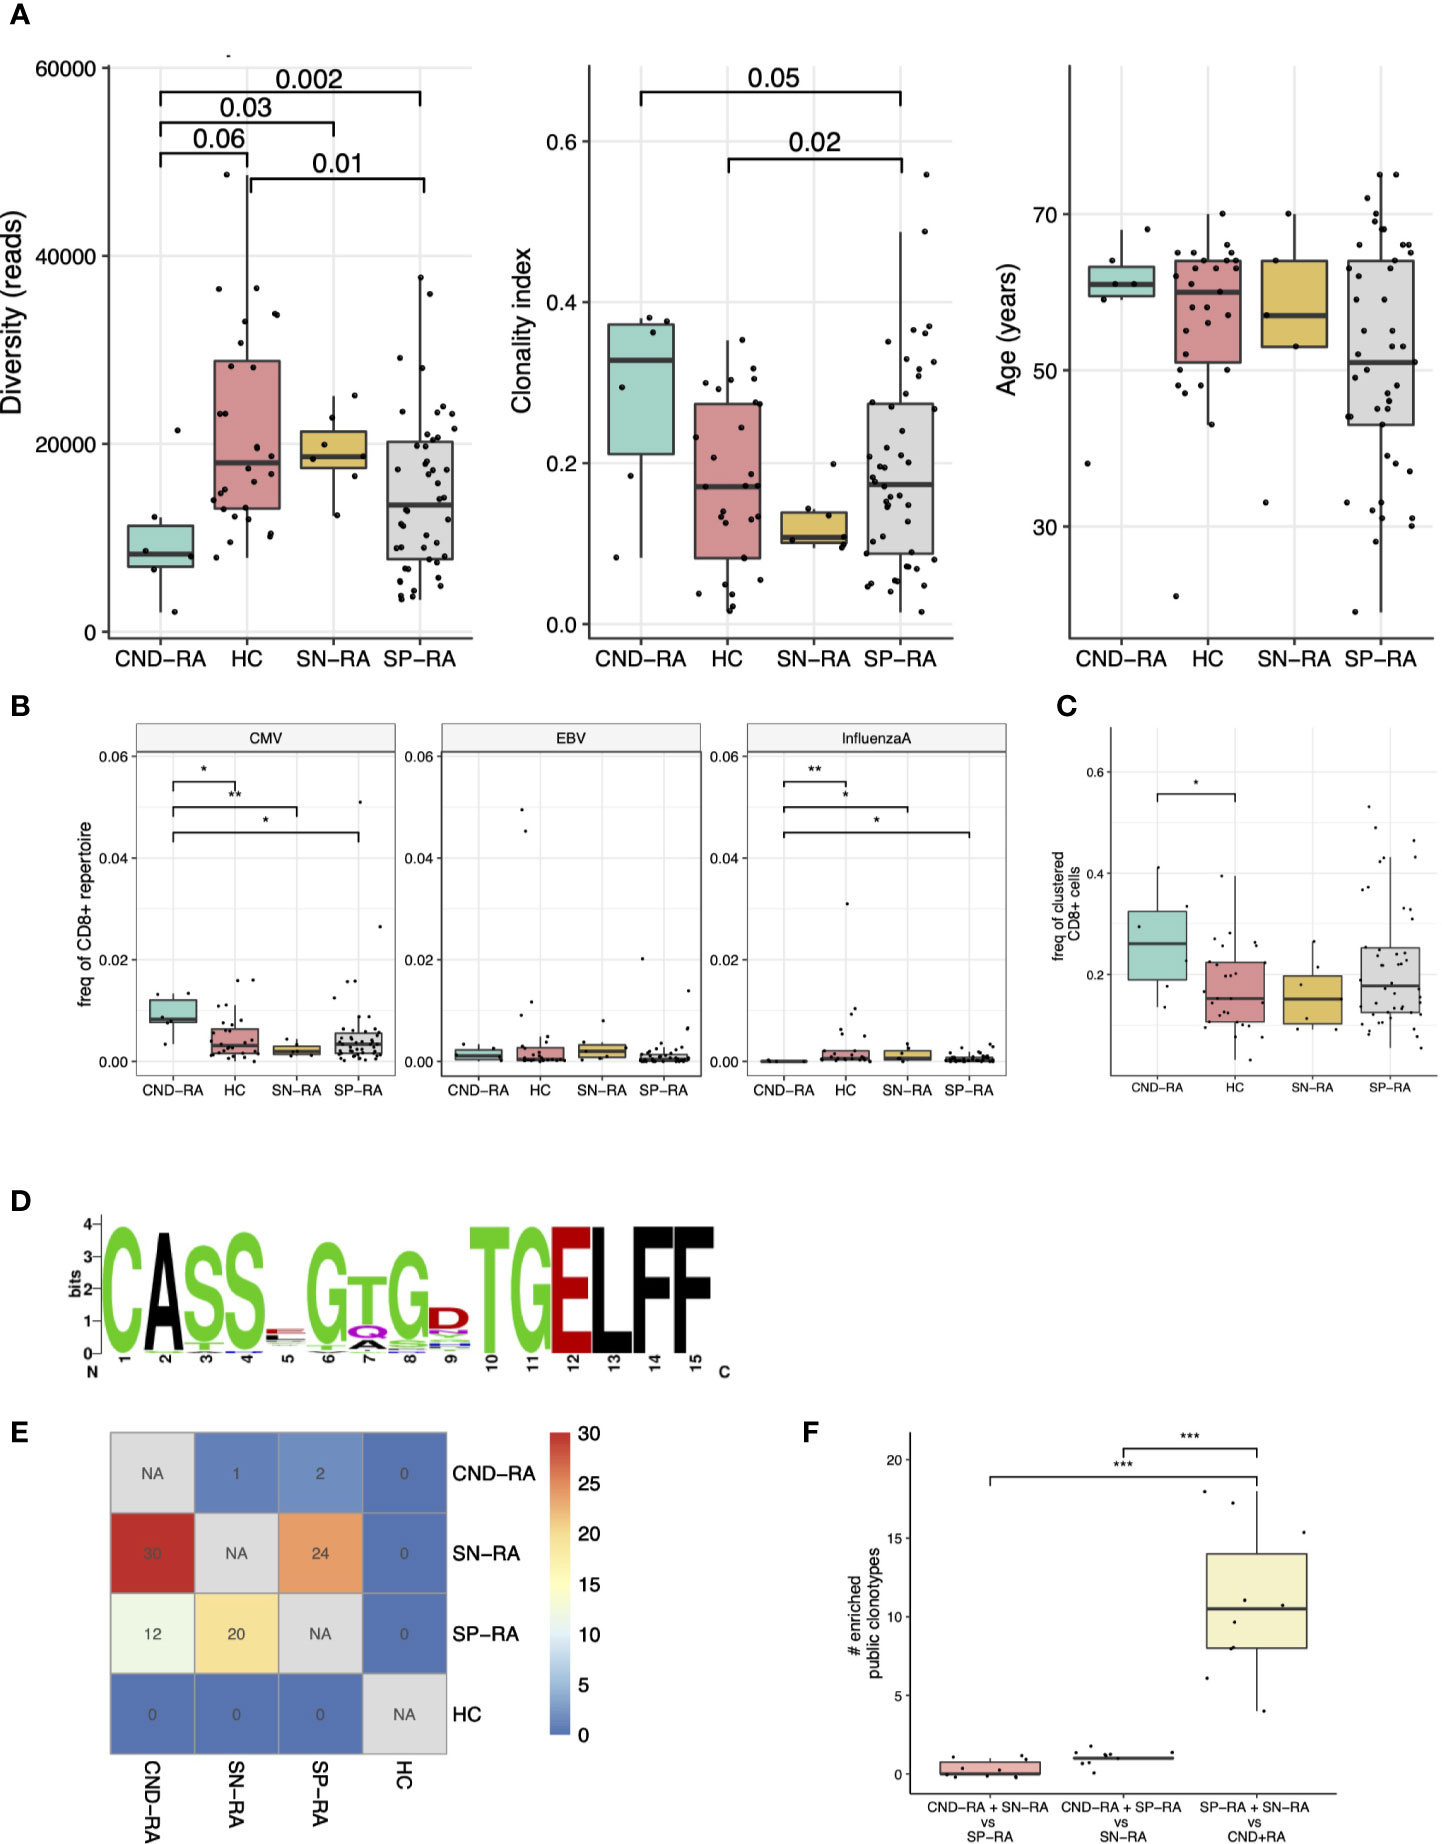
Figure 2 T-cell receptor beta (TCRβ) repertoire analysis of CND-RA patients. (A) TCRβ repertoire diversity (left) and clonality index (middle) were analyzed to reveal differences in sample clonality. There was no statistically significant difference in age between the groups (right). (B) Pooled frequency of cytomegalovirus (CMV), Epstein-Barr virus (EBV) or influenza A epitope-specific TCRs. Epitope-specificities were determined as hard-matches against VDJdb-database, the biggest repository of TCRs with known epitope-specificities. (C) Frequency of TCRβ sequences that could be assigned to potentially epitope-specific clusters. Potentially epitope-specific clusters were determined as TCRs with one amino acid mismatch (Hamming distance = 1). (D) A logoplot showing the amino acid sequence of the CDR3s in one representative epitope-specific cluster with the highest mean frequency among CND-RA patients compared to other subgroups (SN-RA, SP-RA and HC). (E) Heatmap showing the median amount of enriched (Fisher’s exact test, one-sided) public clonotypes to subgroups after resampling the groups 10 times to the same sample size (n=6). These enriched public clonotypes could be more important to disease pathogenesis than public clonotypes that are not enriched to any subgroup. (F) Numbers of enriched public clonotypes in group combinations after the same resampling as in E. In A-C: CND-RA n=6, SN-RA n=7, SP-RA n=46, HC n=28. All tests (A–F) with the Mann-Whitney test unless otherwise stated. *p < 0.05, **p < 0.01, ***p < 0.001.
As many autoimmune disorders are associated with viral infections, we hard-matched (searched for completely matching sequences) the TCRβ sequences from the patient samples against VDJdb, currently the biggest TCR data repository with annotated epitope-specificities (25). We detected an increased abundance of cytomegalovirus (CMV) reactive T-cells but a decreased abundance of influenza-A reactive CD8+ cells in CND-RA when compared to healthy controls and other RA subtypes (Figure 2B). The antigens with the most significant variation were CMV IE-1 and influenza A M1 (Supplementary Figure 7).
We (31) and others (32, 33) have recently shown that structurally similar TCRs are likely to bind similar antigens. Thus, to find T-cell specificities against previously unknown antigens, we grouped TCRs with one amino acid mismatch into potentially epitope-specific clusters. After pooling all samples, we found 631 clusters altogether. CND-RA patients had the highest proportion of clustered CD8+ T cells (the proportion of CD8+ belonging to any of the clusters), and this finding was statistically significant against healthy controls but not against other RA subtypes (Figure 2C). Interestingly, while CND-RA patients had the highest abundance of the clustered CD8+ cells, it had the lowest number of clusters meaning that the clusters in CND-RA are bigger, i.e. consist of a greater number of cells per cluster than in the other groups. This suggests a more limited T cell epitope repertoire in CND-RA. The sequence logo plot of a cluster with the highest mean frequency among CND-RA patients compared to other subgroups is shown in Figure 2D.
Public clonotypes are TCR-sequences shared between different individuals, while private sequences are unique for each individual. Such clonotypes could be public either because they are more readily generated during thymic maturation or because these clonotypes are essential for the disease pathogenesis. To find the clonotypes that are important in disease pathogenesis, we resampled the groups to have the same number of samples (n=6 for each) and calculated the number of public clonotypes that are enriched to a given patient group. A low amount of enriched public clonotypes in a certain group would signify high similarity between the tested groups, while a high amount of enriched public clonotypes within a particular patient group would mean dissimilarity between the different tested groups. When SN-RA patients were compared to CND-RA, we found a median of 30 clonotypes that were enriched to SN-RA, and similarly, SP-RA patients had 12 such clonotypes, suggesting dissimilarity between the CND-RA and other RA subtypes (Figure 2E). When we pooled SP-RA and SN-RA patients together, we found more shared clonotypes than any other group combination (Figure 2F) again, suggesting that CND-RA is a distinct group from other RA groups.
RA Patients Display Elevated Levels of Several Cytokines
Cytokines are important mediators of inflammation, and their systemic levels can be used as a proxy to understand inflammatory mechanisms. Plasma samples were analyzed using a panel of 92 soluble inflammation mediators. The analyses revealed several upregulated cytokines in RA patient groups compared to healthy controls (Figure 3A). The only cytokine with significantly higher expression in CND-RA compared to SP-RA was the bone resorption associated cytokine TNFSF14 (LIGHT) (Figure 3B). There was no correlation between disease duration and cytokine levels in CND-RA. Other important inflammation regulators that were upregulated in RA (Figures 3C–I) included CFS-1 (also known as M-CFS) (34) and CD40 that have been suggested as therapeutic targets in RA (35). In addition, osteoprotegerin (OPG) (36) levels were higher in RA groups than in healthy controls.
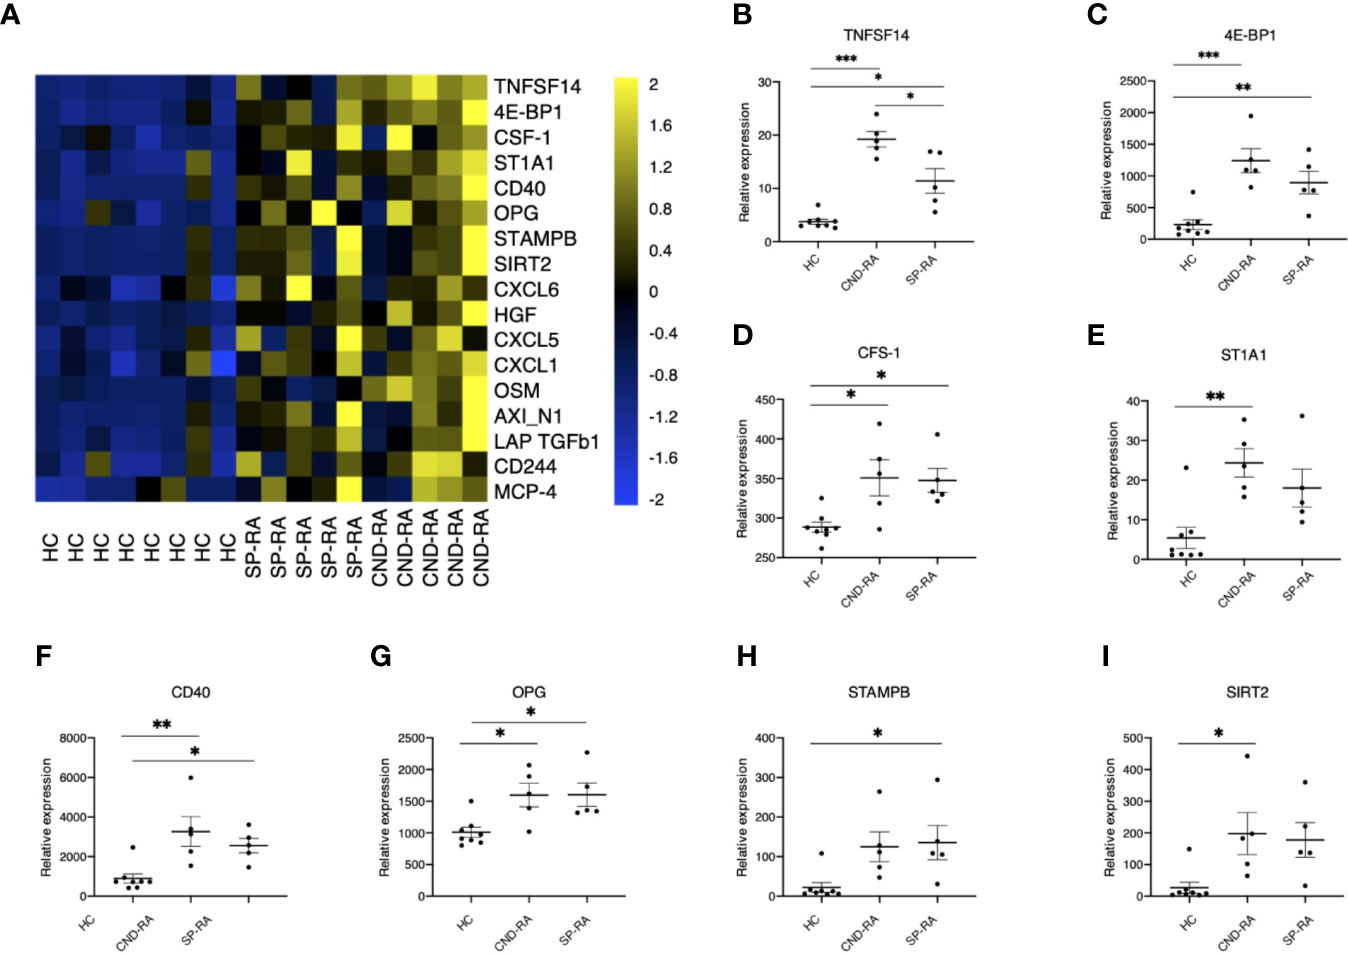
Figure 3 (A) Cytokine protein levels in healthy controls (HC), seropositive rheumatoid arthritis patients (SP-RA) and in ACPA-negative destructive rheumatoid arthritis (CND-RA) patients were measured using the Olink Pro seek inflammation panel. The heatmap displays all cytokines’ expression levels for which the Q-value (false discovery rate) was less than 0.035. Bright blue represents smaller protein concentration, while bright yellow represents higher protein concentration. (B–I) The expression levels of the top six differentially expressed cytokines expressed as NPX-units. Statistical testing with one-way ANOVA followed by Tukey post-hoc test. TNFSF14, tumor necrosis factor superfamily member 14; 4E-BP1, eukaryotic translation initiation factor 4E-binding protein 1; CSF-1, colony-stimulating factor 1; ST1A1, sulfotransferase 1A1; OPG, osteoprotegerin, tumor necrosis factor receptor superfamily member 11B; STAMPB, STAM binding protein; SIRT2, sirtuin 2. *p < 0.05, **p < 0.01, ***p < 0.001.
Somatic Mutations Are Detected in an Expanded CD8+ Lymphocyte Clone
Somatic mutations are acquired changes in the cells’ genetic material and include single nucleotide variants (SNV), deletions and insertions as well as changes affecting larger parts of the genome. When the cell divides, also the mutations are passed to the following generations and after several rounds of cell division, the mutated cells form a clone. RA patients are known to harbor somatically mutated lymphocyte clones (16), while the biological significance of the observed mutations remain speculative. Modern deep sequencing technologies (eg. Exome-wide deep sequencing) have enabled identification of rare somatic variants with low, variant allele frequencies (VAF)s.
An initial screen to identify somatic mutations in CD8+ cells was performed using the previously described gene panel (16). Only one patient out of the four tested carried somatic mutations. These SNVs were in PIK3CG and ITGAE genes, and they were restricted to the clonally expanded CD3+CD8+ cells (Figure 4A). TCRβ sequencing confirmed the presence of a TRBV2 expressing clone matching with the observed VAFs and the Vbeta22 population seen in flow cytometry analysis (Figure 4B). Notably, the clonal landscape remained stable in all three analyzed time points spanning a follow-up period of over four years (Figure 4C).
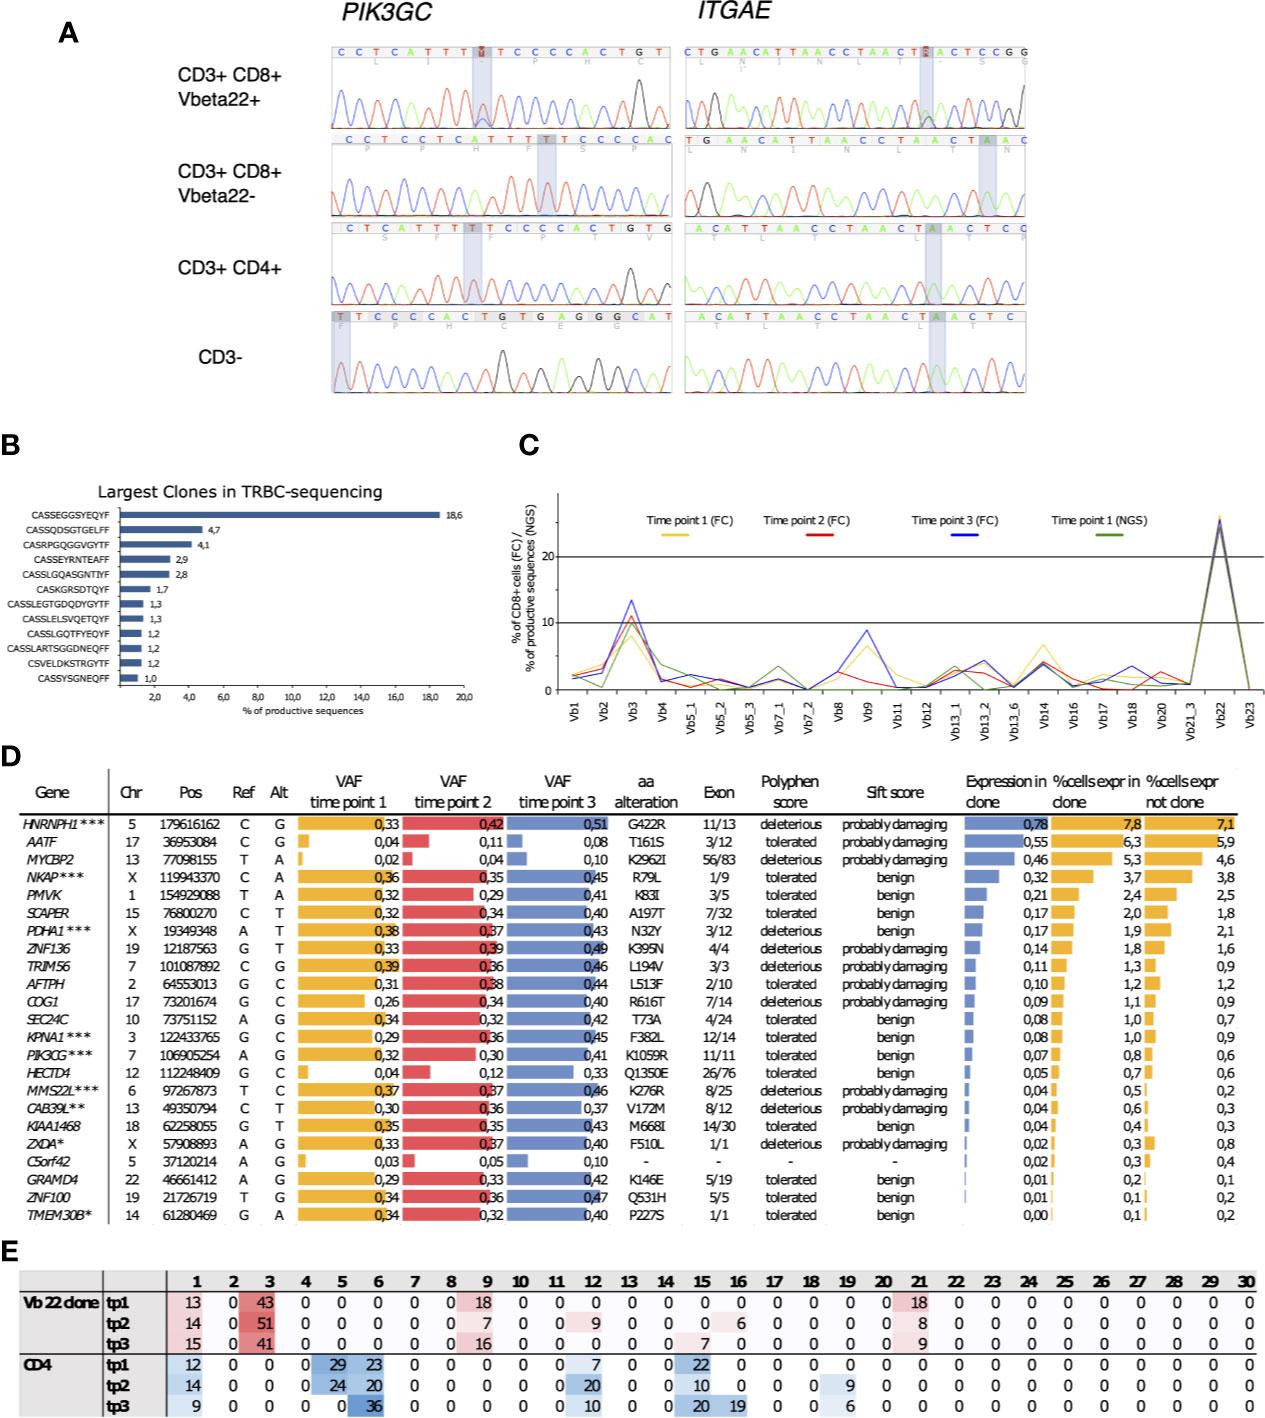
Figure 4 (A) Capillary sequencing was performed from flow cytometry sorted MNC fractions to confirm the immunopanel detected mutations and to confirm that they reside within the clonally expanded cell population. (B) The clonal expansion was confirmed to consist of an 18.6% monoclonal CD8+ population using NGS TCRB sequencing with the corresponding TCRBV02-01*01 beta-gene. (C) The clones were followed up at three time points spanning 4 years and 1 month using flow cytometry (FC). The sums of corresponding TCRBV genes were calculated from NGS TCRB sequencing. (D) The expanded clone harbored 23 somatic mutations that introduced an alteration into the mutated gene’s protein product and displayed an increasing variant allele frequency (VAF) over the follow-up period. Roughly half of the mutations were predicted as potentially deleterious for the protein function using the SIFT and PolyPhen prediction algorithms. The arbitrary expression levels of the mutated genes in the expanded clonal cells, as well as the percentages of cells expressing the mutated genes within the clonal cells and in cells outside the clone, were analyzed using sc-RNA-seq. *Lower gene expression levels in the clonal cells, **higher gene expression levels in the clonal cells, ***Somatic mutation confirmed by capillary sequencing. (E) Percentages of mutation signatures (1–30) in the flow-sorted CD3+CD8+ clonal cells compared to the polyclonal CD3+ CD4+ fraction. The most common signatures are highlighted with either red of blue shaded background. Chr, chromosome; Pos, position; Ref, reference base; Alt, mutated base; VAF, variant allele frequency; aa, amino acid; tp, time point.
Whole-exome sequencing from the sorted Vb22 enriched cells followed by variant calling revealed 23 CNVs with increasing VAFs over the follow-up (Figure 4D). (The list of all identified somatic variants is presented in Supplementary Table 3.) By using in silico prediction tools and assessing the expression levels of the mutated genes, we aimed to identify gene alterations that could lead to phenotype level changes. Depending on the prediction algorithm, roughly half of these were likely to affect protein function. Gene expression levels within the clonally expanded, and in the polyclonal CD8+ cells, were retrieved from single-cell RNA sequencing (scRNA-seq) data (Figure 5). MMS22L and CAB39L displayed significantly higher expression levels within the clonal cells, while ZXDA and TMEM30B were less expressed within the mutation harboring cells. Six additional mutations were confirmed as restricted to the Vb22 expressing population by capillary sequencing (Supplementary Figure 8).
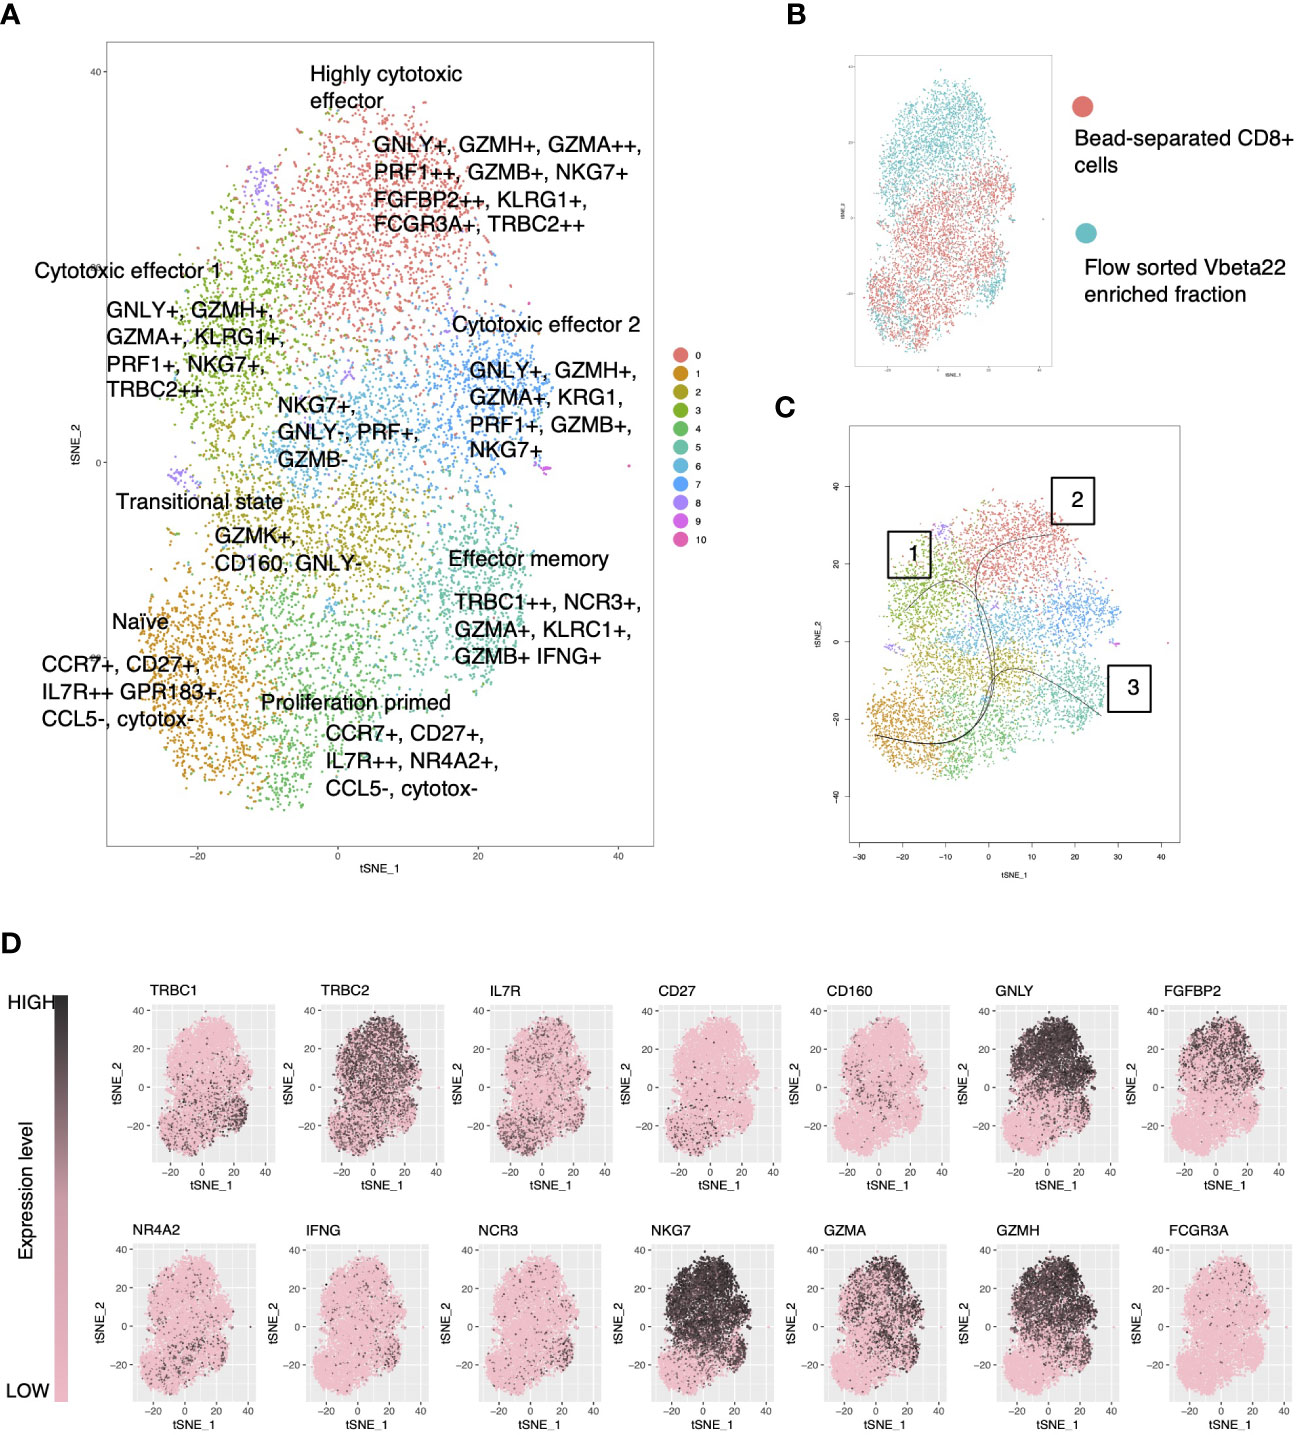
Figure 5 Single-cell RNA-sequencing reveals a cytotoxic gene expression signature in the clonally expanded, mutation harboring lymphocyte clone. (A) tSNE visualization of merged CD8+ cells with flow cytometry enriched clonally expanded CD8+ lymphocytes using Seurat-package. (B) Original identity of the cells. (C) Cell lineages using the naïve cells as the starting cluster were identified using the Slingshot tool. (D) Expression levels of selected genes over the clusters in tSNE visualization.
Somatic Mutations in the Clonal Population Display a Unique Mutation Signature
Somatic mutations were called from the clonal CD8+ cells using the patient’s own CD4+ cells as germline reference. Thus, by reversing the analysis, we also identified variants that were specific for the CD4+ compartment. Mutation signatures are characteristic combinations of different types of mutations and they are widely used in cancer genomics. Mutation signature analysis takes into account the nucleotide change (from which nucleotide to which) and the genetic context (which are the adjacent nucleotides). Different mutational signatures are known to arise from different mutagenic processes such as exposure to genotoxic agents and mismatch repair deficiency (37). Analysis of mutational signatures (38, 39), revealed a predominant, and stable signature 3 in the clonal cells (Figure 4E), while the mutations within the CD4+ compartment were distributed to signatures 2, 6 and 15. There are no previous reports linking the signature 3 to T cell leukemias (40), while the particular signature has been associated with breast, ovarian and pancreatic cancers and with double-strand break-repair by homologous recombination.
Single-Cell Level RNA-Sequencing Reveals a Cytotoxic Gene Expression Signature in the Mutation Harboring Lymphocyte Clone
ScRNA-seq data from the index patient’s CD8+ cells and flow-sorted Vb22 expressing cells were merged and clustered with the Seurat (29) toolkit using both PCA (Figures 5A–D) and CCA (Supplementary Figures 2 and 3) based methods. Vb22 sorted clonal cells (Figure 5B) accumulated to cluster 0 and 4, the first being a highly cytotoxic cluster with effector functions relying on both cytotoxic granule products (GNLY and GZMA) and overexpression of cytotoxicity associated receptors (FGFBP2 and FCGR3A). Lineage analysis identified three biologically relevant trajectories (Figure 5C). Lineages 1 and 2 described activation pathways for the clonal cells, while lineage 3 lead to a final phenotype of interferon-gamma producing cytotoxic effector cells more abundant in the non-clonal pool. The sorted Vb22 cells lacked TRBC1 expression and displayed an increased proportion of TRBC2 (Figure 5D) expressing cells, which further confirmed that the clonal cells resided in the clusters 0 and 4.
Discussion
Recently, we described a distinct SN-RA cohort with the destruction of larger joints (3). Here we sought to understand the biological mechanisms of this subtype of RA.
In addition to the diagnostic antibodies, RA patients are also known to develop antibodies against other endogenous proteins and post-translational modifications (30, 41–44). Our findings show that CND-RA patients display fewer antibodies against endogenous proteins than SP-RA patients. The lower number of autoantibodies in CND-RA supports the idea of this RA subtype being an autoantibody independent disease subtype. A similar, but an earlier version of the Protoarray platform has previously been used to examine autoreactive antibodies in HLA-restricted RA, other rheumatic diseases and healthy controls (43). In their work, Auger et al. identified significantly more autoreactive antibodies in all these conditions. This discrepancy to our findings likely originates from the different strategy in setting the positivity threshold. Probably due to our small cohort size, we could not reproduce the RA-associated positive autoreactivities against PAD4, BRAF, PKCβ1or PIP4K2C detected by Auger et al.
Further, CND-RA patients’ plasma samples were found to display higher concentration of TNFSF14 (also known as LIGHT), a cytokine known to mediate bone resorption in RA, also matching well with the destructive erosive phenotype (45). Notably, CND-RA patients with ongoing immunosuppressive treatment also displayed high levels of other pro-inflammatory cytokines. We interpret this as an indication of ongoing, treatment resistant inflammation.
Each T-cell recombines its T-cell receptor (TCR) during thymic maturation leading to a situation where each naïve T-cell has a unique TCR sequence. Upon contact with its cognate antigen, it proliferates and converts into an effector or effector memory lymphocyte. Sequencing of an individual’s TCRβ repertoire can be used to reveal past infections such as CMV, Epstein-Barr virus and influenza (26), while also autoimmune diseases such as type 1 diabetes (46), ankylosing spondylitis (47, 48) and psoriasis (49) have been suggested to associate with disease-specific TCR signatures. The majority of the reported TCR studies in RA have focused on CD4+ T-helper cells (50, 51).
We have previously studied the CD8+ TCRβ lymphocyte repertoires in early RA patients (16, 52), and here we focused on the CD8+ TCRβ repertoires in CND-RA patients. We identified a less diverse TCR-repertoire in CND-RA than in healthy controls, SP-RA or in SN-RA. Thus, our data showed that the CD8+ lymphocyte compartment in CND-RA consisted of fewer but larger clones than in other RA-subtypes. CND-RA patients also displayed a pronounced CMV-associated TCRβ-repertoire balanced by a significantly reduced influenza A-associated TCRβ signature. Interestingly, CMV seropositivity has previously been linked to more severe joint destruction in RA (53). Importantly, CND-RA patients had a unique set of enriched public clonotypes, further supporting our hypothesis of CND-RA being a separate disease from diagnostic SP-RA and SN-RA. However, with the present data set we cannot exclude the possibility that long-term inflammation with continuous attempts to pharmaceutically suppress it, may be reflected in the patients’ TCR repertoires.
Clonally expanded CD8+ effector T cells have previously been shown to harbor somatic mutations that potentially modulate their phenotype and effector functions (16, 19, 20). Knowing that CND-RA differs from SP-RA in terms of CD8+ pool composition, we studied whether these patients harbor somatic mutations in their CD8+ cells. Our data further confirm the recurring presence of somatic mutations in expanded effector clones, but as the findings are from a single patient, somatic mutations cannot be considered as part of the characteristic CND-RA signature.
We hypothesized that the biologically most important mutations are likely to enrich in the (sub)clonally expanding cells and thus, we focused on mutations in expressed genes with growing VAFs in the follow-up samples. We identified 23 coding single nucleotide variants that expanded in size over time. Interestingly, the mutational signature within the mutated clone was stable during the follow-up and differed from that observed in the non-clonal cells. These cytotoxic T cells’ mutational landscape did not follow the mutational patterns previously observed in T-cell leukemias (T-LGL and T-PLL) (40). Somatic mutations are hallmarks of cancer. However, somatic mutations are also found in morphologically normal tissue (11, 13). In our work, the identified somatic mutations are restricted to mature lymphocyte clones, and thus, they are unlikely to associate with the development of a malignant disease. The mutation harboring CD8+ T cell clone was found to express high levels of cytotoxic gene products and molecules associated with pro-inflammatory signaling. This highlights the possibility that the mutated clone may be involved in the propagation of chronic inflammation in the index patient.
The limitations of the study include the size of the CND-RA cohort. Considering the rarity of the observed clinical phenotype and the time needed today to establish the diagnosis of CND-RA, we are confident that the cohort size is sufficient to define this RA subset as an independent disease subclass. However, without sample material from the diagnostic time point, we cannot conclusively state whether the observed differences in TCR-repertoires compared to SP- and SN-RA are present at onset or whether they are, at least in part, due to poor disease control over the years.
In conclusion, we have identified a specific TCR signature from the CD8+ cytotoxic T cells from CND-RA patients. While the pathogenesis of SP-RA is driven by MHC II and CD4+ T helper lymphocytes, the observed CD8+ T cell signature may be linked to the pathogenesis of CND-RA. Narrower autoreactive antibody repertoire also fits well with the observed CD8+ TCR repertoire phenotype as antibody production is dependent on T helper cells, not on CD8+ cells. As the conventional antirheumatic compounds do not halt disease progression in CND-RA, we hypothesize that these patients would potentially benefit from treatment strategies that target immune signaling that is essential for CD8+ cells, e.g. compounds that inhibit JAK-STAT signaling. Our results emphasize the importance of understanding the various immunopathological mechanisms operating in the different subtypes of RA, so that future research can extend this knowledge to yield improved therapeutic options for the treatment resistant patients.
Data Availability Statement
TCRβ sequencing data is freely available at clients.adaptivebiotech.com/pub/kelkka-2020-jci (DOI: 10.21417/TK2020FI). All other datasets presented in this study are included in the article/Supplementary Material.
Ethics Statement
The studies involving human participants were reviewed and approved by Helsinki University Hospital Ethics Committee. The patients/participants provided their written informed consent to participate in this study.
Author Contributions
All authors were involved in drafting the article or revising it critically for important intellectual content, and all authors approved the final version to be published. SM and TK had full access to all of the data in the study and take responsibility for the integrity of the data and the accuracy of the data analysis. Study conception and design: TK, PS, TS-I, and SM. Acquisition of data: TK, PS, TL, KP, MT, ML, PE, RK, CS, KS, YM, HN, ML-R, and TS-I. Analysis and interpretation of data: TK, PS, DB, JH, TL, MK, JS, SE, BY, SK, LE, HL, TS-T, and SM. All authors contributed to the article and approved the submitted version.
Funding
European Research Council (Projects: M-IMM 647355, STRATIFY 862011, DynaOmics 677943), Academy of Finland Heal-Art consortium (314442) and ERA PerMed (JAKSTAT-TARGET consortium), Maire Lisko foundation, Finnish Medical foundation, Instrumentarium Science foundation, Biomedicum Helsinki foundation, Orion research foundation, Juhani Aho foundation, K. Albin Johansson foundation, Paulo foundation, Region Östergötland (ALF grants), European Union’s Horizon 2020 research and innovation programme (675395), Tekes the Finnish Funding Agency for Innovation (1877/31/2016), Sigrid Juselius Foundation, Finska Läkaresällskapet, and Liv och Hälsa Foundation.
Conflict of Interest
The authors declare that the research was conducted in the absence of any commercial or financial relationships that could be construed as a potential conflict of interest.
Acknowledgments
We thank Suvi Kyttänen and Tiina Hannunen for expertise in TCR- and capillary sequencing. We thank Finnish Functional Genomics Centre supported by University of Turku, Åbo Akademi University and Biocenter Finland. Cytokine analyses were provided by the Biomedicum Functional Genomics Unit at the Helsinki Institute of Life Science and Biocenter Finland at the University of Helsinki. We also wish to acknowledge Biomedicum Flow cytometry core unit (HiLIFE) for support in flow sorting.
Supplementary Material
The Supplementary Material for this article can be found online at: https://www.frontiersin.org/articles/10.3389/fimmu.2020.578848/full#supplementary-material
References
1. Aletaha D, Smolen JS. Diagnosis and Management of Rheumatoid Arthritis: A Review. JAMA (2018) 320:1360–72. doi: 10.1001/jama.2018.13103
2. Paalanen K, Rannio K, Rannio T, Asikainen J, Hannonen P, Sokka T. Does early seronegative arthritis develop into rheumatoid arthritis? A 10-year observational study. Clin Exp Rheumatol (2019) 37:37–43.
3. Nikiphorou E, Sjöwall C, Hannonen P, Rannio T, Sokka T. Long-term outcomes of destructive seronegative (rheumatoid) arthritis - description of four clinical cases. BMC Musculoskelet Disord (2016) 17:246. doi: 10.1186/s12891-016-1067-y
4. Gregersen PK, Silver J, Winchester RJ. The shared epitope hypothesis. An approach to understanding the molecular genetics of susceptibility to rheumatoid arthritis. Arthritis Rheum (1987) 30:1205–13. doi: 10.1002/art.1780301102
5. Han B, Diogo D, Eyre S, Kallberg H, Zhernakova A, Bowes J, et al. Fine mapping seronegative and seropositive rheumatoid arthritis to shared and distinct HLA alleles by adjusting for the effects of heterogeneity. Am J Hum Genet (2014) 94:522–32. doi: 10.1016/j.ajhg.2014.02.013
6. Padyukov L, Seielstad M, Ong RTH, Ding B, Rönnelid J, Seddighzadeh M, et al. Epidemiological Investigation of Rheumatoid Arthritis (EIRA) study group. A genome-wide association study suggests contrasting associations in ACPA-positive versus ACPA-negative rheumatoid arthritis. Ann Rheum Dis (2011) 70:259–65. doi: 10.1136/ard.2009.126821
7. Viatte S, Barton A. Genetics of rheumatoid arthritis susceptibility, severity, and treatment response. Semin Immunopathol (2017) 39:395–408. doi: 10.1007/s00281-017-0630-4
8. Tate JG, Bamford S, Jubb HC, Sondka Z, Beare DM, Bindal N, et al. COSMIC: the Catalogue Of Somatic Mutations In Cancer. Nucleic Acids Res (2019) 47:D941–7. doi: 10.1093/nar/gky1015
9. Yizhak K, Aguet F, Kim J, Hess JM, Kübler K, Grimsby J, et al. RNA sequence analysis reveals macroscopic somatic clonal expansion across normal tissues. Science (2019) 364:eaaw0726. doi: 10.1126/science.aaw0726
10. Jonason AS, Kunala S, Price GJ, Restifo RJ, Spinelli HM, Persing JA, et al. Frequent clones of p53-mutated keratinocytes in normal human skin. Proc Natl Acad Sci U S A (1996) 93:14025–9. doi: 10.1073/pnas.93.24.14025
11. Martincorena I, Roshan A, Gerstung M, Ellis P, Van Loo P, McLaren S, et al. High burden and pervasive positive selection of somatic mutations in normal human skin. Science (2015) 348:880–6. doi: 10.1126/science.aaa6806
12. Martincorena I. Somatic mutation and clonal expansions in human tissues. Genome Med (2019) 11:35–3. doi: 10.1186/s13073-019-0648-4
13. Martincorena I, Fowler JC, Wabik A, Lawson ARJ, Abascal F, Hall MWJ, et al. Somatic mutant clones colonize the human esophagus with age. Science (2018) 362:911–7. doi: 10.1126/science.aau3879
14. Yokoyama A, Kakiuchi N, Yoshizato T, Nannya Y, Suzuki H, Takeuchi Y, et al. Age-related remodelling of oesophageal epithelia by mutated cancer drivers. Nature (2019) 565:312–7. doi: 10.1038/s41586-018-0811-x
15. Koskela HLM, Eldfors S, Ellonen P, van Adrichem AJ, Kuusanmäki H, Andersson EI, et al. Somatic STAT3Mutations in Large Granular Lymphocytic Leukemia. N Engl J Med (2012) 366:1905–13. doi: 10.1056/NEJMoa1114885
16. Savola P, Kelkka T, Rajala HL, Kuuliala A, Kuuliala K, Eldfors S, et al. Somatic mutations in clonally expanded cytotoxic T lymphocytes in patients with newly diagnosed rheumatoid arthritis. Nat Commun (2017) 8:15869. doi: 10.1038/ncomms15869
17. Savola P, Martelius T, Kankainen M, Huuhtanen J, Lundgren S, Koski Y, et al. Somatic mutations and T-cell clonality in patients with immunodeficiency. Haematologica (2019). doi: 10.3324/haematol.2019.220889
18. Savola P, Brück O, Olson T, Kelkka T, Kauppi MJ, Kovanen PE, et al. Somatic STAT3 mutations in Felty syndrome: an implication for a common pathogenesis with large granular lymphocyte leukemia. Haematologica (2018) 103:304–12. doi: 10.3324/haematol.2017.175729
19. Valori M, Jansson L, Kiviharju A, Ellonen P, Rajala H, Awad SA, et al. A novel class of somatic mutations in blood detected preferentially in CD8+ cells. Clin Immunol (Orlando Fla) (2017) 175:75–81. doi: 10.1016/j.clim.2016.11.018
20. Van Horebeek L, Hilven K, Mallants K, Van Nieuwenhuijze A, tiina K, Savola P, et al. A robust pipeline with high replication rate for detection of somatic variants in the adaptive immune system as a source of common genetic variation in autoimmune disease. Hum Mol Genet (2019) 28:1369–80. doi: 10.1093/hmg/ddy425
21. Jerez A, Clemente MJ, Makishima H, Rajala H, Gómez-Seguí I, Olson T, et al. STAT3 mutations indicate the presence of subclinical T-cell clones in a subset of aplastic anemia and myelodysplastic syndrome patients. Blood (2013) 122:2453–9. doi: 10.1182/blood-2013-04-494930
22. Kim D, Park G, Huuhtanen J, Lundgren S, Khajuria RK, Hurtado AM, et al. Somatic mTOR mutation in clonally expanded T lymphocytes associated with chronic graft versus host disease. Nat Commun (2020) 11:2246. doi: 10.1038/s41467-020-16115-w
23. Shugay M, Bagaev DV, Turchaninova MA, Bolotin DA, Britanova OV, Putintseva EV, et al. VDJtools: Unifying Post-analysis of T Cell Receptor Repertoires. PloS Comput Biol (2015) 11:e1004503. doi: 10.1371/journal.pcbi.1004503
24. Colwell RK, Chao A, Gotelli NJ, Lin SY, Mao CX, Chazdon RL, et al. Models and estimators linking individual-based and sample-based rarefaction, extrapolation and comparison of assemblages. J Plant Ecol (2012) 5:3–21. doi: 10.1093/jpe/rtr044
25. Bagaev DV, Vroomans RMA, Samir J, Stervbo U, Rius C, Dolton G, et al. VDJdb in 2019: database extension, new analysis infrastructure and a T-cell receptor motif compendium. Nucleic Acids Res (2020) 48:D1057–62. doi: 10.1093/nar/gkz874
26. Glanville J, Huang H, Nau A, Hatton O, Wagar LE, Rubelt F, et al. Identifying specificity groups in the T cell receptor repertoire. Nature (2017) 547:94–8. doi: 10.1038/nature22976
27. Li H. Aligning sequence reads, clone sequences and assembly contigs with BWA-MEM(2013). Available at: http://arxiv.org/abs/1303.3997 (Accessed February 19, 2020).
28. Van der Auwera GA, Carneiro MO, Hartl C, Poplin R, Del Angel G, Levy-Moonshine A, et al. From FastQ data to high confidence variant calls: the Genome Analysis Toolkit best practices pipeline. Curr Protoc Bioinf (2013) 43:11.10.1–11.10.33. doi: 10.1002/0471250953.bi1110s43
29. Stuart T, Butler A, Hoffman P, Hafemeister C, Papalexi E, Mauck WM, et al. Comprehensive Integration of Single-Cell Data. Cell (2019) 177:1888–902.e21. doi: 10.1016/j.cell.2019.05.031
30. Charpin C, Arnoux F, Martin M, Toussirot E, Lambert N, Balandraud N, et al. New autoantibodies in early rheumatoid arthritis. Arthritis Res Ther (2013) 15:R78. doi: 10.1186/ar4255
31. Jokinen E, Heinonen M, Huuhtanen J, Mustjoki S, Lähdesmäki H. Determining epitope-specificity of T cell receptors with TCRGP. bioRxiv (2019) 9:542332. doi: 10.1101/542332
32. Dash P, Fiore-Gartland AJ, Hertz T, Wang GC, Sharma S, Souquette A, et al. Quantifiable predictive features define epitope-specific T cell receptor repertoires. Nature (2017) 547:89–93. doi: 10.1038/nature22383
33. De Neuter N, Bittremieux W, Beirnaert C, Cuypers B, Mrzic A, Moris P, et al. On the feasibility of mining CD8+ T cell receptor patterns underlying immunogenic peptide recognition. Immunogenetics (2017) 45:5–10. doi: 10.1101/118539
34. Avci AB, Feist E, Burmester G-R. Targeting GM-CSF in rheumatoid arthritis. Clin Exp Rheumatol (2016) 34:39–44.
35. Lai J-H, Luo S-F, Ho L-J. Targeting the CD40-CD154 Signaling Pathway for Treatment of Autoimmune Arthritis. Cells (2019) 8:927. doi: 10.3390/cells8080927
36. Walsh MC, Choi Y. Biology of the RANKL-RANK-OPG System in Immunity, Bone, and Beyond. Front Immunol (2014) 5:511. doi: 10.3389/fimmu.2014.00511
37. Alexandrov LB, Nik-Zainal S, Wedge DC, Aparicio SAJR, Behjati S, Biankin AV, et al. Signatures of mutational processes in human cancer. Nature (2013) 500:415–21. doi: 10.1038/nature12477
38. Forbes SA, Beare D, Bindal N, Bamford S, Ward S, Cole CG, et al. COSMIC: High-Resolution Cancer Genetics Using the Catalogue of Somatic Mutations in Cancer. Curr Protoc Hum Genet (2016) 91:10.11.1–10.11.37. doi: 10.1002/cphg.21
39. Rosenthal R, McGranahan N, Herrero J, Taylor BS, Swanton C. DeconstructSigs: delineating mutational processes in single tumors distinguishes DNA repair deficiencies and patterns of carcinoma evolution. Genome Biol (2016) 17:31. doi: 10.1186/s13059-016-0893-4
40. Dufva O, Kankainen M, Kelkka T, Sekiguchi N, Awad SA, Eldfors S, et al. Aggressive natural killer-cell leukemia mutational landscape and drug profiling highlight JAK-STAT signaling as therapeutic target. Nat Commun (2018) 9:1567. doi: 10.1038/s41467-018-03987-2
41. Goldbach-Mansky R, Lee J, McCoy A, Hoxworth J, Yarboro C, Smolen JS, et al. Rheumatoid arthritis associated autoantibodies in patients with synovitis of recent onset. Arthritis Res (2000) 2:236–43. doi: 10.1186/ar93
42. Auger I, Charpin C, Balandraud N, Martin M, Roudier J. Autoantibodies to PAD4 and BRAF in rheumatoid arthritis. Autoimmun Rev (2012) 11:801–3. doi: 10.1016/j.autrev.2012.02.009
43. Auger I, Balandraud N, Rak J, Lambert N, Martin M, Roudier J. New autoantigens in rheumatoid arthritis (RA): screening 8268 protein arrays with sera from patients with RA. Ann Rheum Dis (2009) 68:591–4. doi: 10.1136/ard.2008.096917
44. Manivel VA, van der Woude D, Toes R, Filer A, Raza K, Rönnelid J. Antibodies against collagen type II are not a general marker of acute arthritis onset. Ann Rheum Dis (2018) 77:954–6. doi: 10.1136/annrheumdis-2017-211974
45. Edwards JR, Sun SG, Locklin R, Shipman CM, Adamopoulos IE, Athanasou NA, et al. LIGHT (TNFSF14), a novel mediator of bone resorption, is elevated in rheumatoid arthritis. Arthritis Rheum (2006) 54:1451–62. doi: 10.1002/art.21821
46. Seay HR, Yusko E, Rothweiler SJ, Zhang L, Posgai AL, Campbell-Thompson M, et al. Tissue distribution and clonal diversity of the T and B cell repertoire in type 1 diabetes. JCI Insight (2016) 1:e88242. doi: 10.1172/jci.insight.88242
47. Komech EA, Pogorelyy MV, Egorov ES, Britanova OV, Rebrikov DV, Bochkova AG, et al. CD8+ T cells with characteristic T cell receptor beta motif are detected in blood and expanded in synovial fluid of ankylosing spondylitis patients. Rheumatol (Oxford England) (2018) 57:1097–104. doi: 10.1093/rheumatology/kex517
48. Cui J-H, Jin Y-B, Lin K-R, Xiao P, Chen X-P, Pan Y-M, et al. Characterization of peripheral blood TCR repertoire in patients with ankylosing spondylitis by high-throughput sequencing. Hum Immunol (2018) 79:485–90. doi: 10.1016/j.humimm.2018.03.007
49. Cao X, Wa Q, Wang Q, Li L, Liu X, An L, et al. High throughput sequencing reveals the diversity of TRB-CDR3 repertoire in patients with psoriasis vulgaris. Int Immunopharmacol (2016) 40:487–91. doi: 10.1016/j.intimp.2016.10.004
50. Ishigaki K, Shoda H, Kochi Y, Yasui T, Kadono Y, Tanaka S, et al. Quantitative and qualitative characterization of expanded CD4+ T cell clones in rheumatoid arthritis patients. Sci Rep (2015) 5:12937. doi: 10.1038/srep12937
51. Rossetti M, Spreafico R, Consolaro A, Leong JY, Chua C, Massa M, et al. TCR repertoire sequencing identifies synovial Treg cell clonotypes in the bloodstream during active inflammation in human arthritis. Ann Rheum Dis (2017) 76:435–41. doi: 10.1136/annrheumdis-2015-208992
52. Schneider-Hohendorf T, Görlich D, Savola P, Kelkka T, Mustjoki S, Gross CC, et al. Sex bias in MHC I-associated shaping of the adaptive immune system. Proc Natl Acad Sci USA (2018) 115:2168–73. doi: 10.1073/pnas.1716146115
Keywords: rheumatoid arthritis, seronegative, ACPA-negative, CD8+ lymphocyte, T cell receptor, somatic mutation
Citation: Kelkka T, Savola P, Bhattacharya D, Huuhtanen J, Lönnberg T, Kankainen M, Paalanen K, Tyster M, Lepistö M, Ellonen P, Smolander J, Eldfors S, Yadav B, Khan S, Koivuniemi R, Sjöwall C, Elo LL, Lähdesmäki H, Maeda Y, Nishikawa H, Leirisalo-Repo M, Sokka-Isler T and Mustjoki S (2020) Adult-Onset Anti-Citrullinated Peptide Antibody-Negative Destructive Rheumatoid Arthritis Is Characterized by a Disease-Specific CD8+ T Lymphocyte Signature. Front. Immunol. 11:578848. doi: 10.3389/fimmu.2020.578848
Received: 01 July 2020; Accepted: 15 October 2020;
Published: 19 November 2020.
Edited by:
Michael Loran Dustin, University of Oxford, United KingdomReviewed by:
Vivianne Malmström, Karolinska Institutet (KI), SwedenChangwan Hong, Pusan National University, South Korea
Copyright © 2020 Kelkka, Savola, Bhattacharya, Huuhtanen, Lönnberg, Kankainen, Paalanen, Tyster, Lepistö, Ellonen, Smolander, Eldfors, Yadav, Khan, Koivuniemi, Sjöwall, Elo, Lähdesmäki, Maeda, Nishikawa, Leirisalo-Repo, Sokka-Isler and Mustjoki. This is an open-access article distributed under the terms of the Creative Commons Attribution License (CC BY). The use, distribution or reproduction in other forums is permitted, provided the original author(s) and the copyright owner(s) are credited and that the original publication in this journal is cited, in accordance with accepted academic practice. No use, distribution or reproduction is permitted which does not comply with these terms.
*Correspondence: Satu Mustjoki, c2F0dS5tdXN0am9raUBoZWxzaW5raS5maQ==; Tiina Kelkka, dGlpbmEua2Vsa2thQGhlbHNpbmtpLmZp
†These authors have contributed equally to this work