 Prem Perumal1
 Mohamed Bilal Abdullatif1
 Harriet N. Garlant1
 Isobella Honeyborne2
 Marc Lipman3
 Timothy D. McHugh2Jo Southern4Ronan Breen5George Santis5
 Kalaiarasan Ellappan6Saka Vinod Kumar6Harish Belgode6
 Ibrahim Abubakar4
 Sanjeev Sinha7Seshadri S. Vasan1,8
 Noyal Joseph6
 Karen E. Kempsell1*
- 1Public Health England, Porton Down, Salisbury, Wiltshire, United Kingdom
- 2Centre for Clinical Microbiology, University College London, Royal Free Campus, London, United Kingdom
- 3UCL Respiratory, University College London, Royal Free Campus, London, United Kingdom
- 4Institute for Global Health, University College London, London, United Kingdom
- 5Guy’s and St Thomas’ NHS Foundation Trust, London, United Kingdom
- 6Jawaharlal Institute of Postgraduate Medical Education and Research, Dhanvantri Nagar, Gorimedu, Puducherry, India
- 7Department of Medicine, All India Institute of Medical Sciences, Ansari Nagar, New Delhi, India
- 8Department of Health Sciences, University of York, York, United Kingdom
Tuberculosis (TB) remains a major global threat and diagnosis of active TB ((ATB) both extra-pulmonary (EPTB), pulmonary (PTB)) and latent TB (LTBI) infection remains challenging, particularly in high-burden countries which still rely heavily on conventional methods. Although molecular diagnostic methods are available, e.g., Cepheid GeneXpert, they are not universally available in all high TB burden countries. There is intense focus on immune biomarkers for use in TB diagnosis, which could provide alternative low-cost, rapid diagnostic solutions. In our previous gene expression studies, we identified peripheral blood leukocyte (PBL) mRNA biomarkers in a non-human primate TB aerosol-challenge model. Here, we describe a study to further validate select mRNA biomarkers from this prior study in new cohorts of patients and controls, as a prerequisite for further development. Whole blood mRNA was purified from ATB patients recruited in the UK and India, LTBI and two groups of controls from the UK (i) a low TB incidence region (CNTRLA) and (ii) individuals variably-domiciled in the UK and Asia ((CNTRLB), the latter TB high incidence regions). Seventy-two mRNA biomarker gene targets were analyzed by qPCR using the Roche Lightcycler 480 qPCR platform and data analyzed using GeneSpring™ 14.9 bioinformatics software. Differential expression of fifty-three biomarkers was confirmed between MTB infected, LTBI groups and controls, seventeen of which were significant using analysis of variance (ANOVA): CALCOCO2, CD52, GBP1, GBP2, GBP5, HLA-B, IFIT3, IFITM3, IRF1, LOC400759 (GBP1P1), NCF1C, PF4V1, SAMD9L, S100A11, TAF10, TAPBP, and TRIM25. These were analyzed using receiver operating characteristic (ROC) curve analysis. Single biomarkers and biomarker combinations were further assessed using simple arithmetic algorithms. Minimal combination biomarker panels were delineated for primary diagnosis of ATB (both PTB and EPTB), LTBI and identifying LTBI individuals at high risk of progression which showed good performance characteristics. These were assessed for suitability for progression against the standards for new TB diagnostic tests delineated in the published World Health Organization (WHO) technology product profiles (TPPs).
Introduction
Mycobacterium tuberculosis (MTB), the causative agent of tuberculosis (TB) is the leading cause of infectious disease worldwide (1, 2), accounting for the deaths of approximately 1.3 million people each year (3). The United Kingdom (UK) has seen an increase in TB since the late 1980s, with rates higher than the rest of Europe (4), and there are currently around 6000 new cases each year (5). In 2016, 73.6% of confirmed TB cases in the UK were foreign-born, with India and Pakistan the most frequent countries of origin (6, 7). For India in the same period the estimated incidence of TB was approximately 2.8 million people per year, accounting for about a quarter of the world’s TB cases (8–10) and resulting in considerable mortality (11). Optimal patient care requires early detection, intervention with antibiotic therapy and judicious ongoing management of infectious individuals (8, 12–14). If untreated, each person with pulmonary ATB will infect others at a high rate, on average between 5 and 15 close contacts every year (15).
It is estimated that one quarter of the world’s population are latently infected with MTB (LTBI); approximately 2.3 billion individuals (2). This is an enormous reservoir of people at risk of both spreading TB and developing future disease (16–22). A key priority in TB diagnosis is to predict which of those individuals with LTBI [i.e., with a positive purified protein derivative (PPD) or interferon γ release assay (IGRA)] are in fact still harboring TB bacilli after exposure and are likely to progress to active disease, compared to those who have been exposed and mounted a successful immune response, but cleared the bacilli and are not likely progress to active disease (7, 9, 19, 23–25). Although diagnosis of ATB has been the keystone of the public health response to TB in many countries, including the UK, decreasing the infection reservoir through detection and preventative therapy of LTBI is also essential in achieving disease reduction targets (21, 22, 26–31). There is currently no gold standard method for diagnosing LTBI (32, 33). Identification of individuals with LTBI or incipient ATB (iATB), who are at risk of progression to active disease, but are still relatively asymptomatic is a priority to prevent progression to active disease and to limit disease spread to uninfected individuals (9, 34–36). The LTBI group comprises a heterogeneous group of individuals displaying an immune reaction to PPD mycobacterial antigens (37–39). This represents a spectrum of individuals from those who have completely cleared TB bacilli after exposure or infection, to individuals who are harboring actively replicating, live bacteria in the relative absence of clinical symptoms (incipient active TB (iATB)). These latter individuals are potential reservoirs of infection (40–42) and can spread disease. This is a major problem for control of disease dissemination and LTBI is a key source of infection in high income countries. People with LTBI will often go undiagnosed (14, 40) and are at high risk of progression to active disease. It is predicted that approximately 5% to 10% of individuals with LTBI will progress to ATB during their lifetime (7, 23, 31). The risk of progression from latent to active TB is particularly high among children under the age of 5 years and among people with compromised immunity (1).
As treatment entails risks and costs (43), preventive treatment of LTBI infection should be selectively targeted to the population groups at highest risk for progression to ATB disease, who would benefit most from treatment (9, 34, 44). If caught early enough treatment can be implemented which is less rigorous and results in less severe disease/long term organ damage and fewer relapses (16, 22, 40). Isoniazid monotherapy for 6 months is the primary recommended treatment for LTBI in both adults and children in countries with high and low TB incidence, in contrast to the more intensive combined treatment/DOTS for ATB (13). Non-compliance with anti-mycobacterial therapies contribute to difficulties in disease eradication (25, 45, 46). The treatment for TB is lengthy and patient compliance to long-term drug treatment is varied, with patients often stopping therapy when their symptoms cease (1, 47–50). Failure to complete the treatment regimen promotes the development of multi drug resistance (25, 51–54) and contributes to ongoing barriers for disease eradication (14, 55–57).
The current WHO guidelines for diagnosis and management of TB are outlined as part of their End-TB strategy (2, 58), the primary pillar being diagnosis, as stated in the report “Early diagnosis of TB including universal drug-susceptibility testing, and systematic screening of contacts and high-risk groups”. The report further states that “TB is the 10th leading cause of death worldwide, and since 2007 it has been the leading cause of death from a single infectious agent, ranking above HIV/AIDS. Most of these deaths could be prevented with early diagnosis and appropriate treatment”. The current WHO-endorsed platform for diagnosis of sputum positive TB is the Cepheid GeneXpert, although comprehensive diagnosis still relies on a combination of this with other traditional methods, e.g., chest X-ray and mycobacterial culture from sputum (12). GeneXpert has been widely implemented in many countries globally and has had a positive impact on TB diagnosis and patient management (59–64). However, some high-burden countries like India have reported operational issues with the platform and associated hardware and consumables costs (65, 66) and it not universally available in all high burden countries (34, 67). Its use in India is being recommended for diagnosis of pediatric TB (64, 65). Opportunities for other diagnostic tests to bridge gaps in the current testing portfolio are still evident but will require investment (34, 67, 68). Many TB patients, particularly with EPTB and also LTBI/iATB do not have MTB positive sputum, are consequently harder to diagnose and can further contribute to TB under-diagnosis (12, 21, 33, 69, 70).
Despite considerable investment in research and development for new diagnostics and therapeutics, TB control and eradication has proved challenging (34, 71). Development of rapid, simple and cost-effective diagnostic tests for ATB, particularly EPTB and LTBI are imperative for TB control (72–80). A simple, rapid and cost-effective alternative, which could perhaps be run on a variety of already embedded laboratory platforms and which could diagnose all sub-types of disease is an attractive proposition. Indirect, non-pathogen directed assays employing host immune biomarkers have become the focus of much interest in bridging gaps in the diagnostic portfolio (77, 79–81). These may play an important role in improving primary diagnosis for EPTB (82–88) and LTBI (82, 89–92), assisting clinicians in informing anti-TB treatments and to determine/monitor the response to treatment (14, 83, 87, 91, 93–101). According to Scriba and co-workers a biomarker-based test would reduce incidence by 20% and could reduce over-diagnosis and treatment using methods like IGRA (102), which are poor predictors of disease progression, with pooled positive predictive values of less than 3%.
Numerous studies and reviews have been published evaluating the current status of biomarkers with potential for active, latent and incipient TB diagnosis, many derived from work profiling the host peripheral blood, immune cell transcriptional response (85, 86, 102–106) (82, 90, 93, 94, 96, 101, 107–113). In one of the initial studies Berry and co-workers identified a complex 393 gene panel which could identify individuals with active TB compared with controls and a 86 gene signature which discriminated active TB from other inflammatory and infectious diseases (107). The same group then went on to identify panels which could distinguish pulmonary TB, pulmonary sarcoidosis, pneumonia and lung cancer (114). This field of research has subsequently become a focus of intense interest and these and a number of other groups have identified various discriminatory signatures for the various forms and stages of TB; ATB, EPTB, LTBI and incipient TB and also for exposure in household contacts, risk of progression to active disease and response to therapy (82, 96, 108–113, 115–136). Some of these have subsequently been reviewed or further validated in comparative cohort studies by other workers in the field (88–90, 110, 126, 136–139). Of the previously published blood transcriptional biomarker panels for active pulmonary tuberculosis reviewed recently by Turner et al. (137), four panels achieved the highest diagnostic accuracy and two met the minimum but not optimum WHO target product profiles (TPP) requirements for a triage test (74, 140); Sweeney et al. [Sweeney3 (120)], Roe et al. [Roe3 and BATF2 (119, 121)] (78) and Kaforou et al. [Kaforou25 (132)]. In a similar study by Gupta et al. (89), eight panels showed promise for discrimination of incipient TB with receiver operating characteristic curves ranging from 0·70 to 0·77. These predominantly reflected genes from interferon and tumor necrosis factor-inducible gene expression modules. There is still a need to define biomarker panels which will fulfill the WHO TPP optimal requirements for a triage test and for a confirmatory test.
We have previously shown differential expression of PBL gene mRNAs in response to MTB infection in a Macaca fascicularis model of TB (141). These non-human primate models are considered to most closely reflect the disease seen in humans (142, 143) and are widely used, particularly for vaccine development (144–146). Microarray hybridization analyses of macaque peripheral blood mRNAs to human whole genome arrays revealed many temporally expressed, gene expression changes, in response to MTB challenge. A selection of significant, differentially regulated immune mRNA biomarkers was identified, which were shared with previously published human data sets (Patent WO2015170108A1). Here we investigate 72 of the most highly-significant biomarkers by quantitative, real-time PCR (qPCR) in two new cohorts of TB patients and controls from the UK and India. This study was conducted to validate previous findings from the NHP model and confirm biomarker suitability for ongoing diagnostic test development for both ATB (both EPTB and PTB) and LTBI. We discuss the performance of these biomarkers, both singly and in combination with reference to WHO target product profiles and their suitability for inclusion in low complexity qPCR assays. We also present initial observations on the utility of some biomarkers/biomarker configurations to identify LTBI individuals at high risk of progression to ATB and which may differentiate different sub-types of TB, i.e., pulmonary (PTB) and extra-pulmonary (EPTB).
Materials and Methods
Study Participants and Sample Collection
All participants recruited to the study were aged ≥18 years old. Patients with PTB and EPTB were recruited at two of India's medical institutes of national importance (1) The All India Institute of Medical Sciences (AIIMS), New Delhi and (2) The Jawaharlal Institute of Postgraduate Medical Education & Research (JIPMER), Puducherry, located in regions of high TB incidence [designated groups IPTB (n = 47) and IEPTB (n = 42)]. Patients with PTB were also recruited at Guy’s and St Thomas’ and Royal Free London NHS Foundation Trusts, London UK (low TB incidence site; designated group UKPTB (n = 63)). Individuals with suspected LTBI (n = 103) and matched negative controls [CNTRLB (n = 102)] were recruited from individuals variably-domiciled in the UK and Asia, resident in the greater London area as part of the UK PREDICT TB study, i.e (4, 42)., by Public Health England Centre for Infections, 61 Colindale Avenue London and University College, London UK. This was a prospective cohort study, recruiting participants from 54 centers in London, Birmingham, and Leicester, at high risk for latent tuberculosis infection (i.e., recent contact with someone with active tuberculosis [contacts] or a migrant who had arrived in the UK in the past 5 years from-or who frequently travelled to-a country with a high burden of tuberculosis [migrants]). Exclusion criteria included prevalent cases of tuberculosis. Individuals with suspected LTBI were identified using the standard Mantoux tuberculin skin test ((TST) i.e., skin-test positive) and/or positivity for one or more of the interferon γ release assay tests (IGRA)—QuantiFERON® TB Gold In-Tube ((QFG) QIAGEN GmbH, Hilden, Germany) and T-SPOT®.TB ((TSPOT) Oxford Immunotec Ltd, Oxford, UK). CNTRLB were identified as negative using these test combinations. All patient sample details are given in Supplementary Table S1 (inside file: Supplementary Table 1.1), the number of samples obtained per study site given in Supplementary Table S1 (inside file: Supplementary Table 1.2). Several individuals from the LTBI group were found to have progressed to active disease during study follow up [see Supplementary Table S1 (inside file: Supplementary Table 1.3)]. LTBI were analyzed either as a combined group (LTBI, n = 103) or stratified into non-progressors to active TB (LTBI_NPR, n = 95) or progressors to active TB (LTBI_PR, n = 8) for all ongoing analyses. Other negative controls (CNTRLA, n = 20) were recruited at PHE, Porton Down, Salisbury, UK (Study Number 12/WA/0303).
All patients recruited to the study at partner sites in India were recruited under an approval from the JIPMER Institute Ethics committee (Human studies), AIIMS Institute Ethics committee and PHE, UK (India Study Number JIP/IEC/2015/11/522, UK Study Number PHE0186). The experiments were carried out in accordance with the approved guidelines of the collaborating institutions. Whole blood samples were collected by venipuncture at a single time point in PAXgene™ (PreAnalytiX, SWZ) or Tempus™ Blood RNA tubes (Applied Biosystems, UK) and stored at −80°C until further processing.
Total RNA Extraction and cDNA Synthesis
Total RNA was extracted from the blood samples of study participants using either the PAXgene Blood RNA or Tempus Spin RNA extraction kits, in accordance with the manufacturer’s instructions. The PAXgene Blood RNA kit (QIAGEN) was used to extract total RNA from all UK group samples and the Tempus Spin RNA Isolation Kit (Applied Bio systems) was used to extract total RNA from all Indian group samples. Although two different RNA extraction methods were used, there are no conflicting reports as to the likely impact of these on the accuracy of downstream qPCR gene target determination (118–123). Differences are reported as relating mainly to miRNAs and not mRNAs (as quantified in this study). To minimize experimental technical variation between samples, mRNA targets were normalized to the average of three internal house-keeping control genes prior to data export and downstream analysis, to minimize any potential sources of technical variation. The concentration and purity of mRNAs were then assessed using a Nanodrop ND-1000 spectrophotometer (Thermo Scientific, EUA). mRNA integrity was further assessed using the Agilent 2100 Bioanalyzer (Agilent Technologies). Purified RNA was immediately processed for complementary DNA (cDNA) conversion using Transcriptor First Strand cDNA synthesis Kit (Roche) as per the instructions provided by the manufacturer. The cDNA was then immediately analyzed using qPCR or stored at −20°C until use.
Roche Real-Time Ready qPCR Assays
Seventy-two test genes of significance were selected for qPCR validation from our previous studies (141). Details and function of all target genes are given in Supplementary Table S1 (inside file: Supplementary Table 1.4). A summary of the overlap with select previously published gene panels is given in Supplementary Table S2 (inside files: Supplementary Tables 2.1 to 2.8) (genes overlapping with those analyzed in this study highlighted in red text). Glucose-6-phosphate dehydrogenase (G6PD), phosphoglycerate kinase 1 (PGK1) and ribosomal protein L13a (RPL13A) were selected for inclusion as controls from available default control gene options in the Roche Real-Time ready (RTR) assay design center, which showed consistent, invariant expression across control and test groups in the previously published NHP data set.
Expression levels of all human test and control genes were determined using pre-designed or bespoke RTR assays, designed using the RTR assay design configurator (configuration numbers 10059401, 100059386 and 10059377) and arrayed in 384 well format. All qPCR assays were performed in duplicate on the Roche LightCycler 480 (LC480) using TaqMan PCR Probe Master Mix (Roche) and according to the manufacturer’s instructions, using the following cycling conditions (i) preheat for 1 cycle at 95°C for 10 minutes (ii) amplification for 45 cycles: 95°C for 10 s, 60°C for 30 s, 72°C for 1 s (ii) cooling to 40°C for 10 s. Data were normalized to the average of the three control genes prior to export using the LC480 software. Normalized data (ΔCt values) were then exported in .txt file format prior to further analysis.
Data Analysis and Visualization of qPCR Outputs Using GeneSpring 14.9™
Normalized data exported from the Roche LC480 were imported into Microsoft Excel. The mean of two duplicate data points was calculated using the Average function. Averaged data was then imported into GeneSpring 14.9™ (GX14.9) for further statistical and differential gene expression analyses, using baseline transformation to the median of all samples (without further normalization). All data were then assessed for quality and filtered by error, where the % coefficient of variance (%CV) was >200 (maximizing the number of entities exhibiting expression differences across all samples and removing those with poor or no signals). Statistically significant features were identified using either one-way analysis of variance (ANOVA) analysis using Benjamini-Hochberg false discovery rate (BH FDR, at a corrected p-value cutoff p < 0.05) across all groups, or t-tests for comparisons between individual groups (also using BH FDR and a cutoff p < 0.05). All further analyses and graphical depiction of data outputs were conducted using other functions in GX14.9 using default settings, e.g., scatter plot, regression and unbiased hierarchical cluster analyses (either Euclidean (EUC) or Pearson’s centered (PC) distance metrics using Ward’s linkage rule and the cluster entities setting). Other data analyses were conducted using various functions in “R”, Microsoft Excel or Sigmaplot 12.0 (Systat Software Inc.).
Receiver Operating Characteristic/Area Under the Curve and Performance Analysis
Receiver Operating Characteristic/area under the curve (ROC/AUC) analyses were performed using normalized, exported mean LC480 qPCR ΔCt values. ROC curves were plotted using “R” × 64 3.4.0 Software using the ROCR package or the ROC analysis tool of Sigmaplot 12.0. The accuracy and performance of each candidate single biomarker was measured by calculating area under the curve (AUC) values. Cutoff values were predicted by measuring the optimal accuracy of the curve, from which the sensitivity and specificity of each biomarker/biomarker panel test were determined. Optimal cutoffs were selected to obtain best sensitivity and specificity and to compare biomarker performance. Combined panels of biomarkers were also assessed to determine whether these could show improved discrimination between control and infected TB groups over single biomarkers. Simple algorithms consisting of biomarkers combined additively were assessed by ROC analysis and the diagnostic performance further assessed using sensitivity, specificity, cutoff values, likelihood ratios and positive (PPV) and negative (NPV) predictive value calculations. Select biomarker panel configurations were also evaluated to WHO TPP requirements for triage minimum and optimum and confirmatory test minimum requirements using the Sigmaplot 12.0 ROCR/ROC analysis functions. Outputs were depicted graphically using either Sigmaplot 12.0 or GraphPad 8.0.
Receiver Operating Characteristic/Area Under the Curve and Performance Analysis for Optimal Biomarker Panels on Previously Published Data Sets
Previously published data sets from Singhania et al. [GSE107991, GSE107992, GSE107993, GSE107994 (109)], Leong et al. [GSE101705 (110)], Turner et al. [E-MTAB-8290 (137)], and Zak et al. [GSE79362 (111)] studies were downloaded and normalized numeric expression values for the relevant panel gene entities extracted. These were analyzed for ROC/AUC and overall performance to WHO TPP requirements for select, significant composite gene biomarker panels from this study as described above (section 2.5).
Results
Quality Assessment of Normalized Data Signals and Cluster Analysis
Normalized, exported mean Roche Lightcycler qPCR ΔCt values were imported into GX14.9 and assessed for signal quality. Fifty-three of seventy-two gene entities remained after filtering by error (%CV >200). Samples were assigned to their specific control and disease groups, i.e., (i) low TB incidence region UK control (CNTRLA) (ii) low TB incidence region UK control from the PREDICT TB study (CNTRLB) (iii) low TB incidence region UK LTBI from the PREDICT TB study (LTBI), variously stratified according to progression (LTBI_PR) or non-progression (LTBI_NPR) to ATB (iv) low TB incidence region UK TB (UKPTB) (v) high TB incidence region India extra-pulmonary TB (IEPTB) (vi) high TB incidence region India pulmonary TB (IPTB).
An unbiased EUC cluster analysis was then performed on filtered data, the results are given in Figure 1. Two clear main clusters of entity expression could be seen using this analysis; clusters 1 and 2, with associated sub-clusters. Overall, there was an observed pattern of increasing differential regulation of biomarkers in the TB disease groups compared with the control groups, from LTBI through IEPTB, UKPTB and IPTB. The composition of biomarkers varied slightly in the comparisons between groups, although there was also some overlap of entity expression between groups. Gene entities in cluster 1 appeared to delineate groups associated with generalized presumed exposure and/or infection with MTB. Cluster 2 and associated sub-cluster gene entities exhibited variable expression between exposed or infected groups, clusters 2i and 2j featured entities which associated more strongly with ATB. CD52 (cluster 2h) appears more generically differentially expressed across the groups, but slightly down-regulated in LTBI.
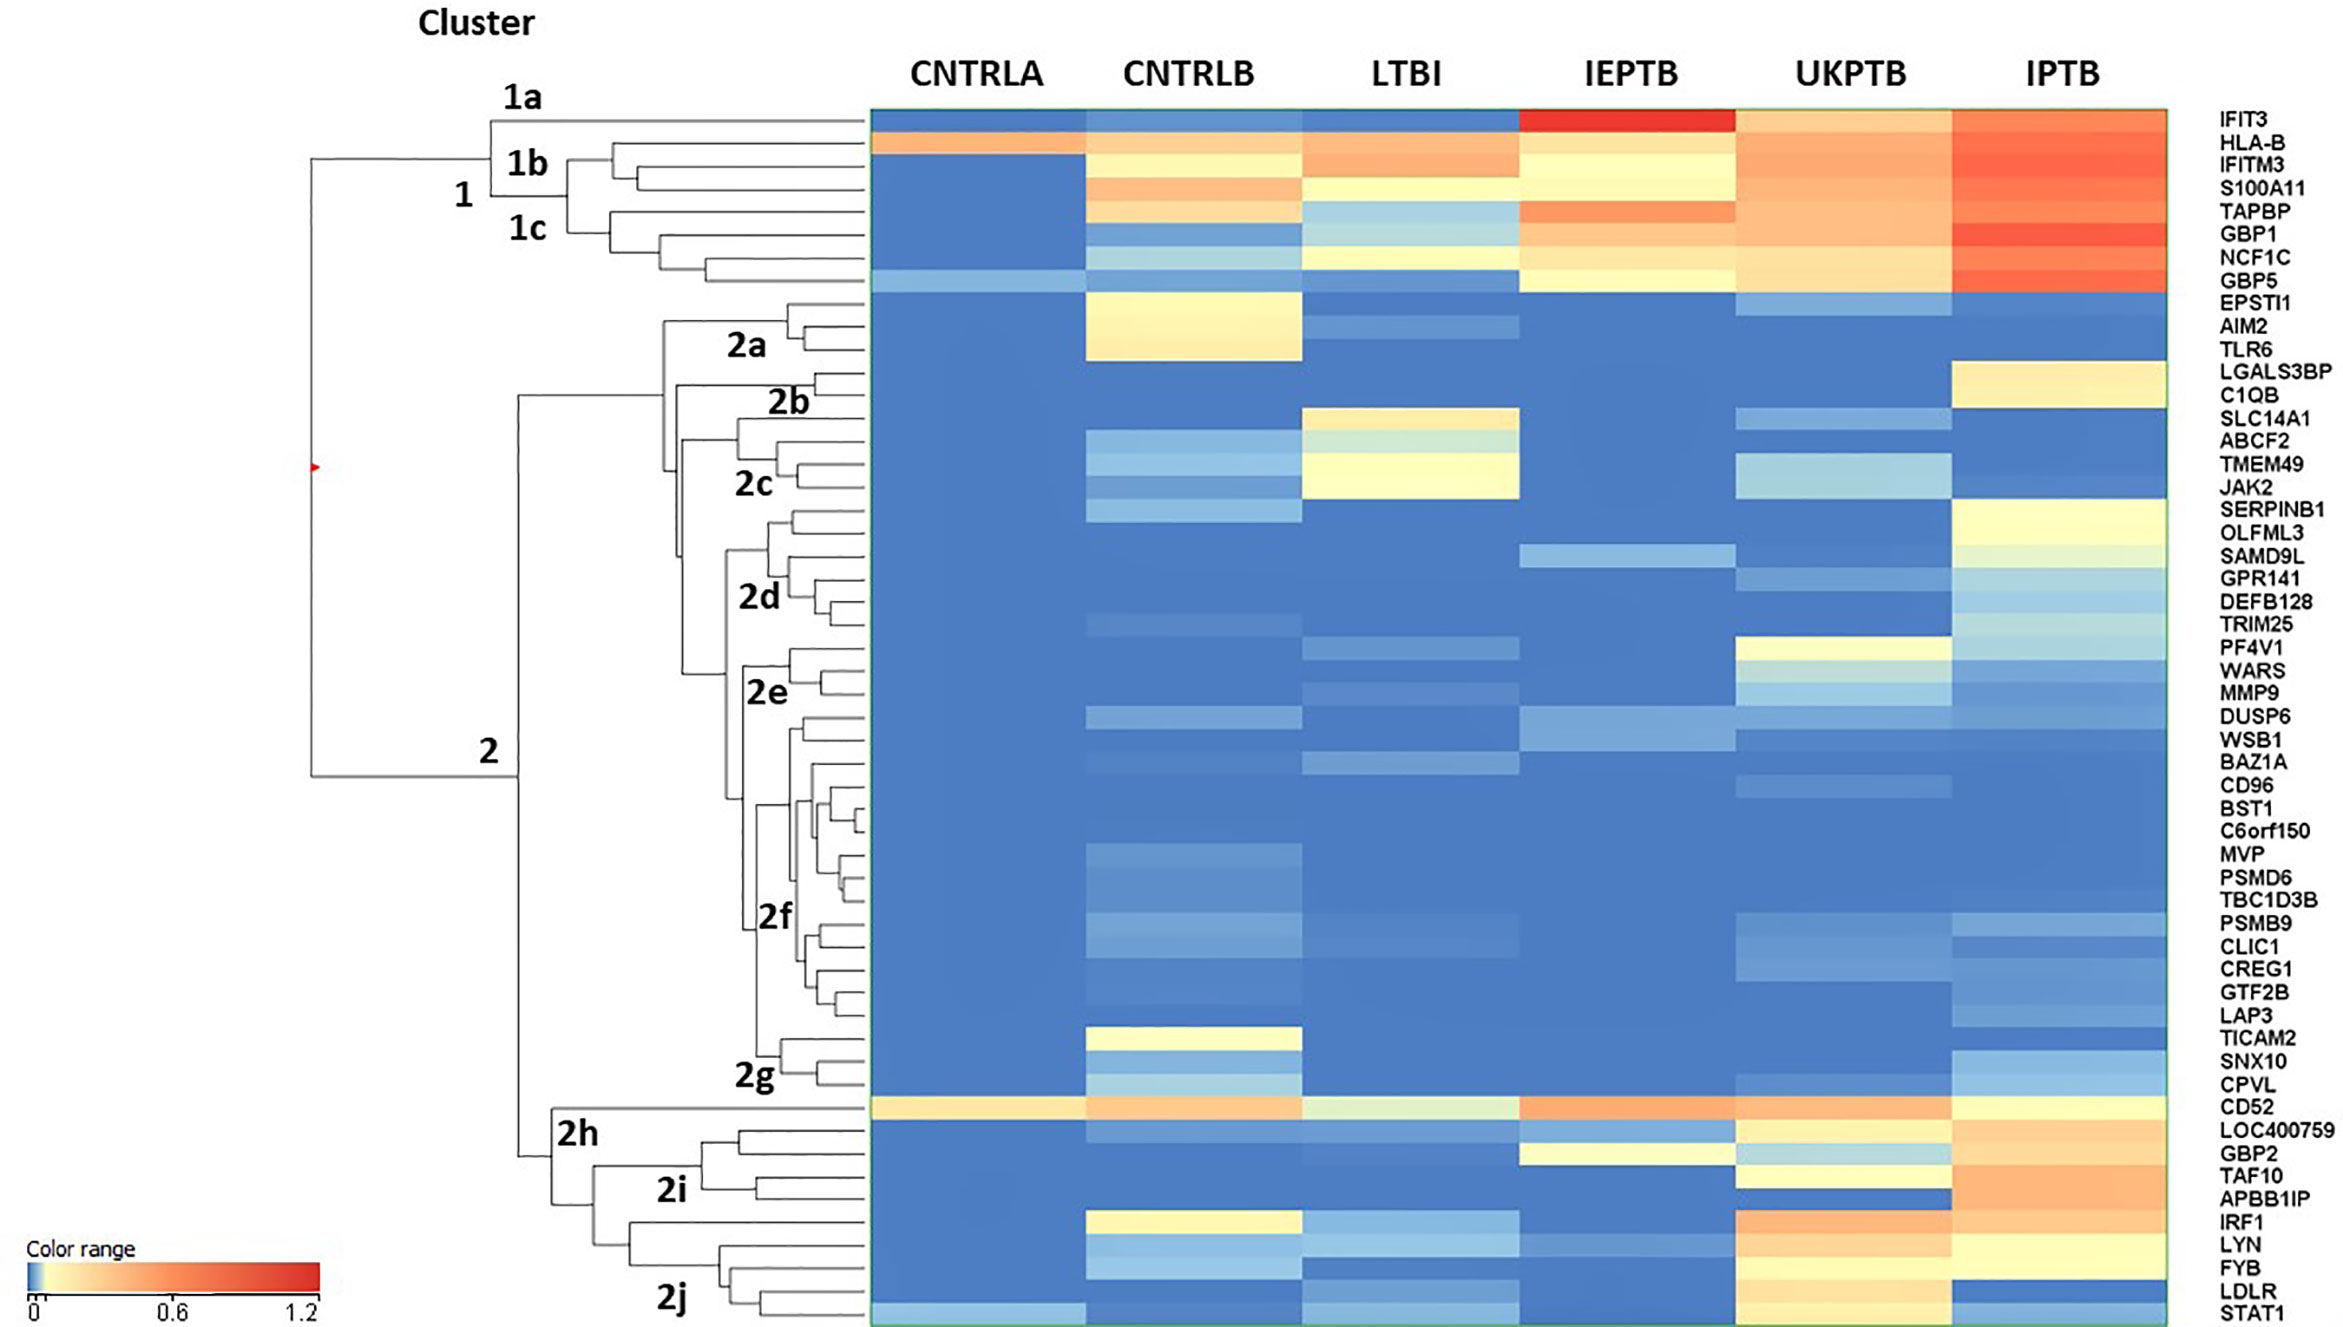
Figure 1 Cluster analysis on all fifty-three significant, filtered entities on group averaged data CNTRLA - low TB incidence region UK control group CNTRLB - low TB incidence region UK control group from the PREDICT TB study group LTBI - low TB incidence region LTBI from the PREDICT TB study group IEPTB - high TB incidence region extra-pulmonary TB group UKPTB - low TB incidence region UK TB group IPTB - high TB incidence region Indian pulmonary TB group.
Cluster 1 includes only eight entities, some of which are interferon regulated, e.g., IFIT3 and GBP1, others include entities associated with MHC class I antigen processing, e.g., HLA-B and TAPBP and associated with neutrophil and/or other innate immune cell activity, e.g., IFITM3, S100A11 and NCF1C; (i) in cluster 1a, IFIT3 is only associated with the ATB disease groups (ii) cluster 1b the entities associate mainly with the high incidence control (CNTRLB) and ATB groups, although HLA-B also appears expressed in the low incidence (CNTRLA) group and (iii) cluster 1c, the entities associate with the LTBI, IEPTB, UKPTB and IPTB groups (Figure 1).
Cluster 2 featured immune-related entities which were differentially regulated between sub-groups, (i) cluster 2a with the CNTRLB group, (ii) clusters 2b, 2d, and 2j with the IPTB group, (iii) cluster 2c with the UKPTB group, (iv) cluster 2e predominantly with the UKPTB group, (v) cluster 2f weakly with the CNTRLB, UKPTB and IPTB groups and (vi) cluster 2g with the CNTRLB and more weakly with the IPTB group, (vii) cluster 2h associated across all groups but more weakly with the LTBI and IPTB groups, (viii) cluster 2i with the IEPTB, UKPTB and IPTB groups and (ix) cluster 2j with the CNTRLB, LTBI, UKPTB and IPTB groups (i.e., all test groups except the IEPTB group). Thus, good differential expression of gene entities was observed between the low TB incidence controls (CNTRLA) and the other groups, i.e., those with ATB from low TB (UKPTB) and high TB incidence regions (IEPTB and IPTB).
Analysis of Normalized qPCR Data Using Analysis of Variance
To determine the best performing biomarkers for onward progression from those displaying a positive signal post-filtration, Analysis of Variance (ANOVA) was performed across all groups using BH FDR (corrected p value < 0.05) and using the Student–Newman–Keuls differences in means (SNK), post-hoc test. Seventeen of the fifty-three gene entities from the %CV filtered data set were found to be statistically significant and differentially regulated across the groups using this analysis; including CD52, GBP1, GBP2, GBP5, HLA-B, IFIT3, IFITM3, IRF1, LOC400759 (GBP1P1), NCF1C, PF4V1, S100A11, SAMD9L, STAT1, TAF10, TAPBP, and TRIM25 (17-plex signature). The number of entities that were discriminatory between groups from the ANOVA SNK analysis are summarized in Supplementary Table S1 (inside file: Supplementary Table 1.5) and Supplementary Information S1, Figure 1.1.
Cluster and Scatterplot Analysis of Significant Differentially Regulated Entities
To further investigate group-specific changes in the seventeen, statistically significant differentially regulated biomarkers, PC unbiased cluster analysis was performed a cross the control, stratified LTBI (LTBI_NPR and LTBI_PR) and other ATB disease groups (Supplementary Information S2, Figure 2.1 and ANOVA p- and fold change values in Supplementary Table S3 (inside files: Table 3.1 with pairwise, p values from the SNK post hoc test table given in Table 3.2). individual line plots (average expression +/− standard error) for each of these entities are given in Supplementary Information S1, Figures 1.2 to 1.18.
Two distinct clusters were observed, each of which could be divided into four sub-clusters, which further delineate differential expression of the key biomarkers between the control and TB-exposed or infected groups. In addition, clear differences in expression could be seen between the LTBI progressors and non-progressors for a number of these gene biomarkers (boxed in red).
The 17-plex signature was further analyzed in greater detail using scatter plot analysis (Figure 2), for the LTBI_NPR and LTBI_PR groups. Seven of these biomarkers showed clear differential expression between the two groups (Supplementary Information S2, Figure 2.1, with fold change differences given in Supplementary Table S3 (inside file: Table 3.3). IFITM3, S100A11, GBP1, GBP5, STAT1 and LOC400759 (GBP1P1), were upregulated in the LTBI-PR group and HLA-B, TAPBP, NCF1C, PF4V1, CD52 and IRF1 were downregulated. Regression analysis using the 17-plex signature gave a best fit line R2 value of 0.735 (Figure 2A), however using the six upregulated biomarkers plus HLA-B (7-plex signature) alone, the R2 value increased to 0.828 (Figure 2B). Addition of any other differentially markers to the panel did not provide any further improvement to the R2 value. These showed therefore good potential for identifying “high risk” pre-progressor LTBI patients at an early stage of disease for preventative interventions.
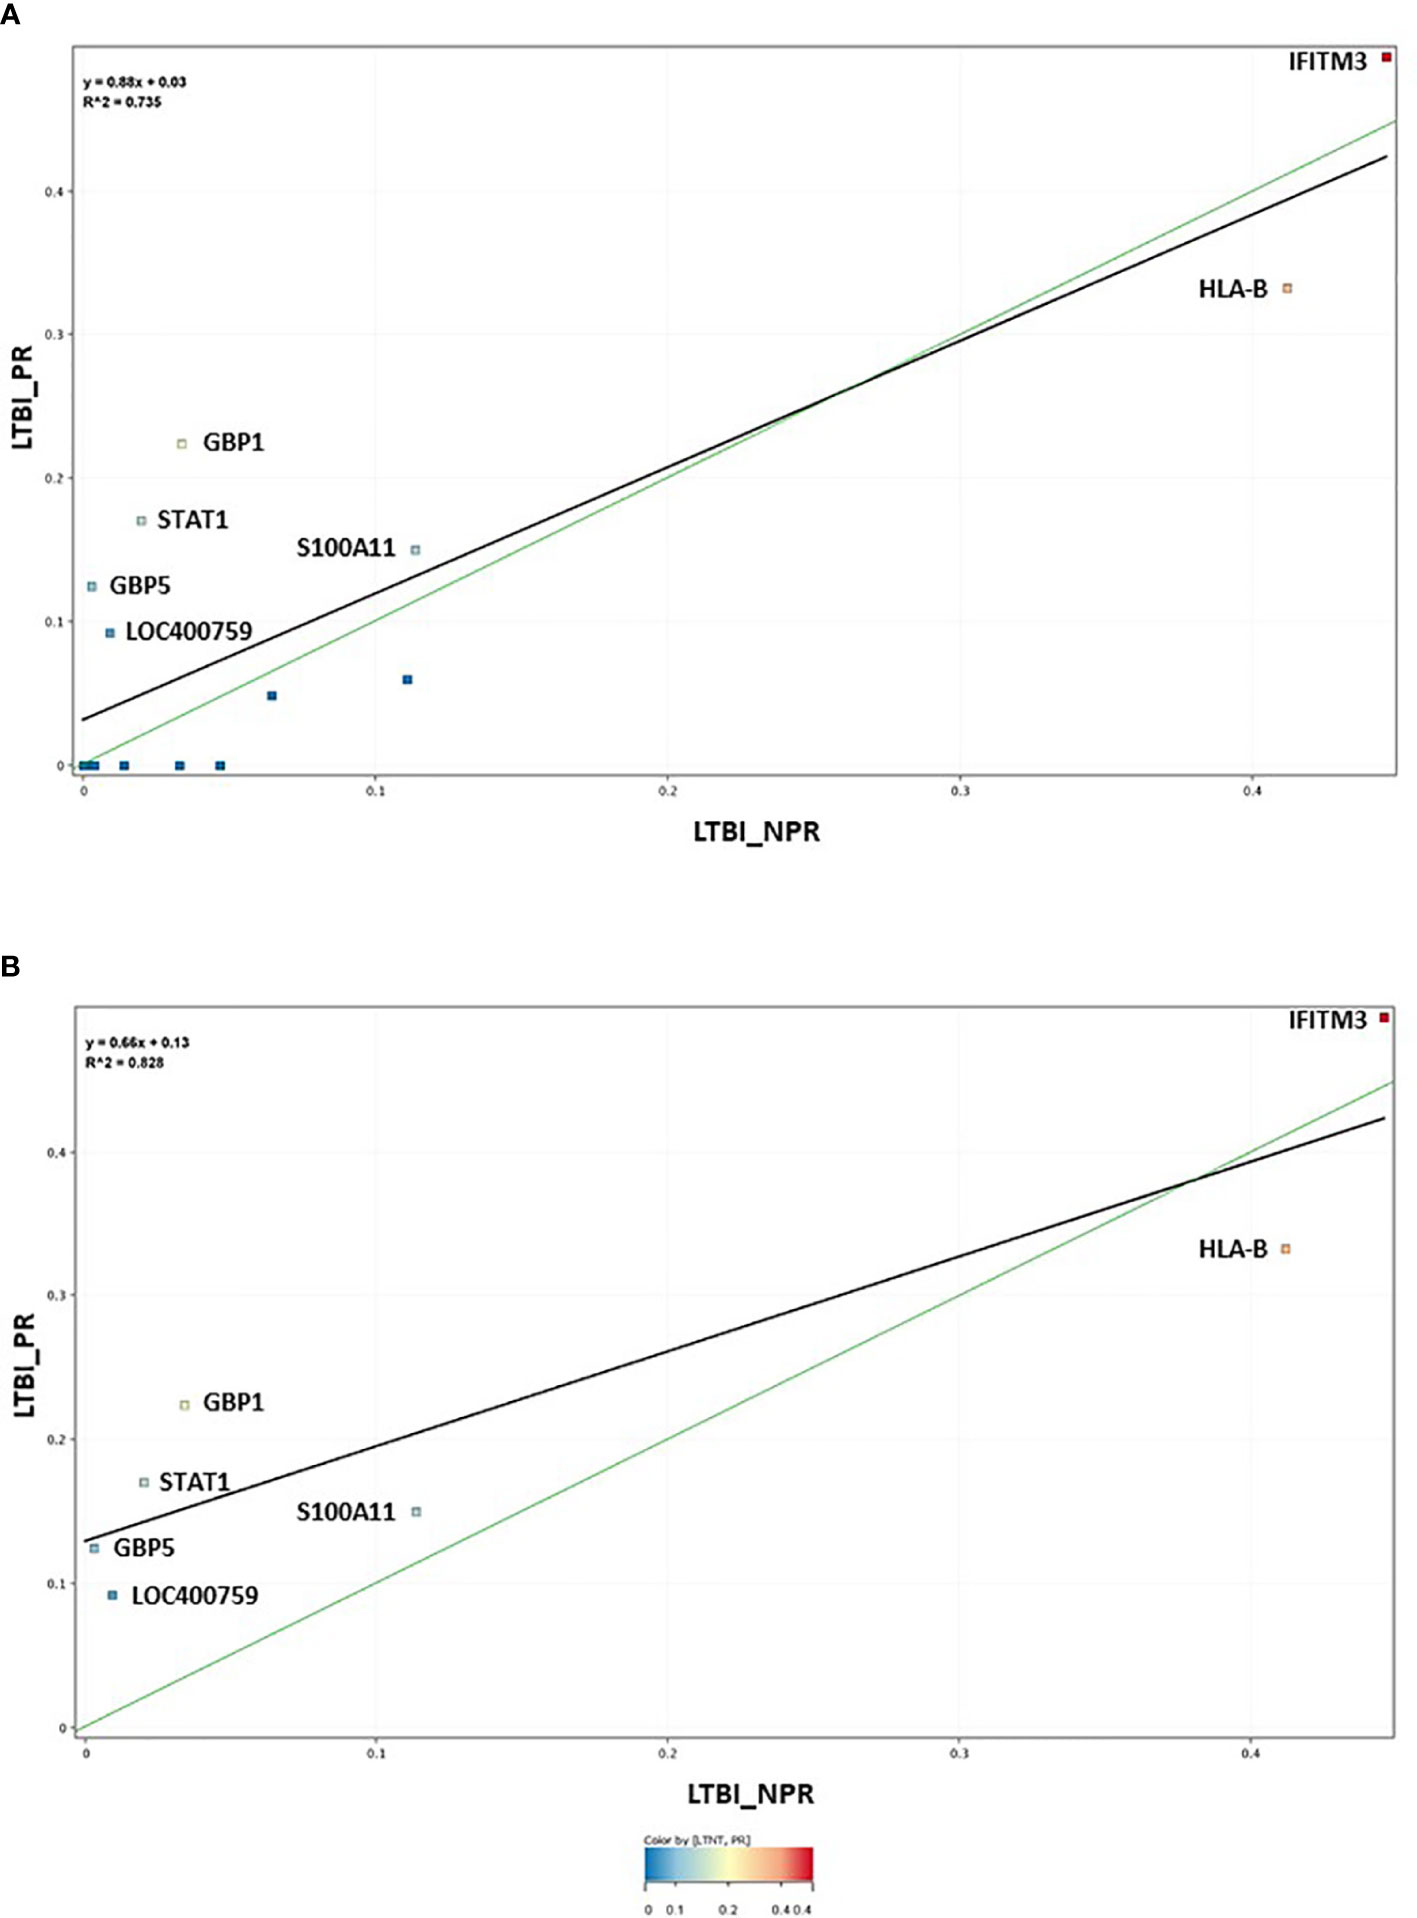
Figure 2 (A) Scatter graph depiction of the seventeen statistically significant entities in LTBI non-progressor and LTBI progressor groups, with associated linear regression (R2) significance analysis (B) Scatter graph depiction of the seven preferred, differentially expressed entities in LTBI non-progressor and LTBI progressor groups, with associated linear regression (R2) significance analysis.
Analysis of Control and LTBI Groups Using 7plex Cumulative Average Expression
Inherent variability in biomarker expression was observed between individuals within all the groups (depicted in heatmap format in Supplementary Information 4, Figure 4.1) and particularly control group CNTRLB. Some individuals within this group have high positivity for select key biomarkers. Using the normalized numeric ΔCt values for the 7-plex signature, we assessed whether these markers could provide a means for stratifying individuals in the control, LTBI_NPR and LTBI_PR groups into high, medium and low risk categories, using a simple arithmetic cumulative index (Supplementary Table S3 (inside file: Table 3.4). ROC curve analyses were not conducted due to an imbalance in the number of individuals in the control and LTBI_NPR groups, relative to the LTBI_PR group (n = 8) Supplementary Table S3 (inside files: Table 3.1 with pairwise, group t-test p values given in Table 3.2). Individuals in these groups were ranked according to their cumulative average expression values (CAE) for the 7-plex signature, then cutoff points set at (i) equal to and greater than the mean (ii) equal to and greater than the mean plus one standard deviation or (ii) equal to and greater than the mean plus two standard deviations . Three LTBI_NPR, two LTBI_PR, four CNTRLB (including patients 1053, 2439 and 1864 highlighted in Supplementary Information 4, Figure 4.1) had cumulative values over . No CNTRLA individuals had cumulative values over . Ten LTBI_NPR, one LTBI_PR, ten CNTRLB and no CNTRLA individuals had cumulative values between and . Twenty-nine LTBI_NPR, 1 LTBI_PR, 16 CNTRLB and 6 CNTRLA individuals had cumulative values greater than , but less than . These results would suggest that both the CNTRLB and LTBI groups are heterogeneous. The CNTRLB group may be a mixture of true negative, exposed uninfected and LTBI infected and the LTBI group a mixture of exposed (currently) uninfected and exposed (currently) infected. Those in the upper ranges for the CAE in both groups are potentially at higher risk of progression to ATB. However, further work needs to be done to assess the performance of this 7-plex panel for stratification purposes, with a greater number of patients and controls to follow up.
These results suggest that the TST and IGRA tests used to define these groups may have incorrectly assigned some individuals in the CNTRLB and LTBI groups. There were near equivalent numbers in each stratified category and the groups look similar in ranked distribution. This information further suggests use of individual or low-complexity gene biomarker panels will be unlikely to be sufficient for stratification of LTBI and high-risk control groups, due to inherent variabilities in expression between individuals, which may lead to omissions in identifying “true” infected individuals. A more complex multi-biomarker approach will be required to give requisite test sensitivity.
Determination of Single Biomarker Receiver Operating Characteristic Profiles
Pairwise comparisons for all seventeen significant differentially-expressed single biomarkers were conducted across all infected and control groups [Supplementary Table S3 (inside files: Table 3.5, 3.5A for controls vs ATB, 3.5B for controls vs LTBI and Table 3.5C for controls<BI vs ATB)], ranked according to specificity). The accuracy of single biomarker discriminatory performance across the main active TB disease groups is summarized in Supplementary Table S1 (inside file: Supplementary Table 1.6) and between the LTBI_PR and LTBI_NPR groups in Supplementary Table S1 (inside file: Supplementary Table 1.7). Many of these single biomarkers gave AUC values above 0.9, the cutoff considered to be an indicator of very high accuracy (up-regulated in the test group, highlighted in bold black text and dark grey fill). Others gave AUC values above 0.8, considered to be an indicator of high accuracy (highlighted in normal text and medium gray fill). Many others gave AUC values above 0.7, the cutoff considered to be an indicator of moderate accuracy (highlighted in normal text and light grey fill). Some gene biomarkers gave AUC curve values below a cutoff of 0.3 indicating an inverse relationship of the markers between the control and test groups ((i.e., down-regulated in the test group) highlighted in white italic text and very dark grey fill). From these analyses, many of the significant gene biomarkers were observed to show good performance between disease and control groups. The best performing across all groups were GBP1, GBP2, IFIT3 and SAMD9L (up-regulated) and TAF10 (down-regulated). Several others with more moderate or group-specific performance were also considered viable candidates for ongoing diagnostic algorithm development. IFITM3 showed the best performance in delineating the LTBI group from both groups of controls and IRF1, TAPBP, and TRIM25 may highlight subtle differences in expression between the two LTBI groups.
Performance/accuracy and discrimination between control and disease groups were assessed for likelihood ratios (LR) and positive/negative predictive values (PPV/NPV), using defined qPCR thresholds. Cutoff values which discriminated all ATB from controls were selected at a fixed sensitivity of 80% for PPV and NPV calculations. The accuracy and discriminatory performance between control and disease groups was very good for many biomarkers. Using predicted cutoff values at 80% sensitivity, the LR+ values approached 10 and LR- were correspondingly low. GBP1 attained a specificity of 91.8% at 80% sensitivity and good PPV/NPV (92.42% and 78.87% respectively) when discriminating all ATB from all controls, IFIT3 also showed good performance with a specificity of 90.98% at 80% sensitivity (PPV/NPV; 90.98% and 78.57% respectively). These results suggest both biomarkers would be very good diagnostic candidates for ATB.
GBP1 and IFIT3 showed less impressive performances for LTBI. GBP1 attained a specificity of 61.68% at 80% sensitivity and PPV/NPV (72.53% and 68.84% respectively) and IFIT3 37.38% specificity at 80% sensitivity (PPV/NPV; 69.69% and 57.14% respectively). The best performing marker for discrimination of LTBI from all controls was IFITM3, with a specificity of 64.49% at 80% sensitivity and PPV/NPV (74.19% and 72.06% respectively). These results emphasize again the difficulties in discriminating LTBI from controls, compared with the superior performance of select biomarkers for the ATB group and suggest that the use of individual gene biomarkers would be unlikely to be sufficient for primary disease diagnosis, due to somewhat lower NPV values. This may lead to omissions in identifying infected individuals, due to the likelihood of false negatives and to some lesser extent false positives with individual biomarkers. It was decided therefore to investigate a multi-biomarker panel approach for on-going diagnostic development.
Determination of Biomarker Panel Receiver Operating Characteristic Profiles and Determination of Diagnostic Algorithms for Diagnostic Test Development
To improve the overall sensitivity and performance, various combinations of gene biomarkers were trialed to determine the optimal configuration to distinguish the various TB disease groups (LTBI (both LTBI_NPR and LTBI_PR), IEPTB, UKPTB, and IPTB) from the control groups (CNTRLA and CNTRLB), with a view to identifying diagnostic panels. qPCR values were combined or subtracted additively according to empirically designed algorithms, then tested using pairwise ROC curve analyses. Illustrations of the best performing combinations are given in full in Supplementary Table S3 (inside files: Table 3.6, 3.6A for controls vs ATB, 3.6B for controls vs LTBI and Table 3.6C for controls<BI vs ATB). These are summarized in Table 1 across the main active TB disease groups and Table 2 across the LTBI_PR and LTBI_NPR groups respectively.
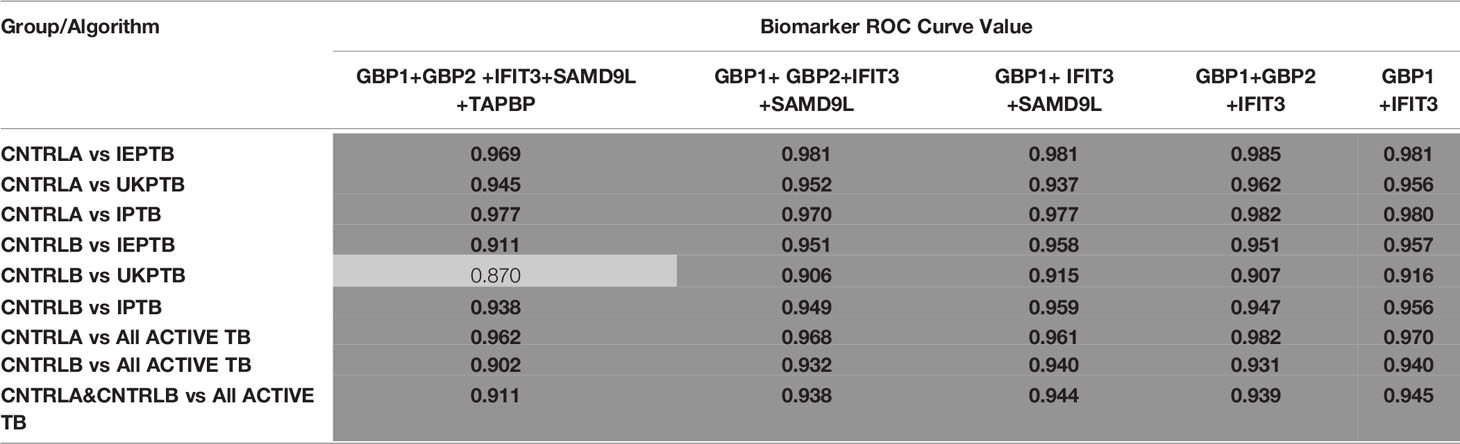
Table 1 Summary of AUC ROC values for control and ATB group pairwise comparisons using simple, composite arithmetic algorithms.
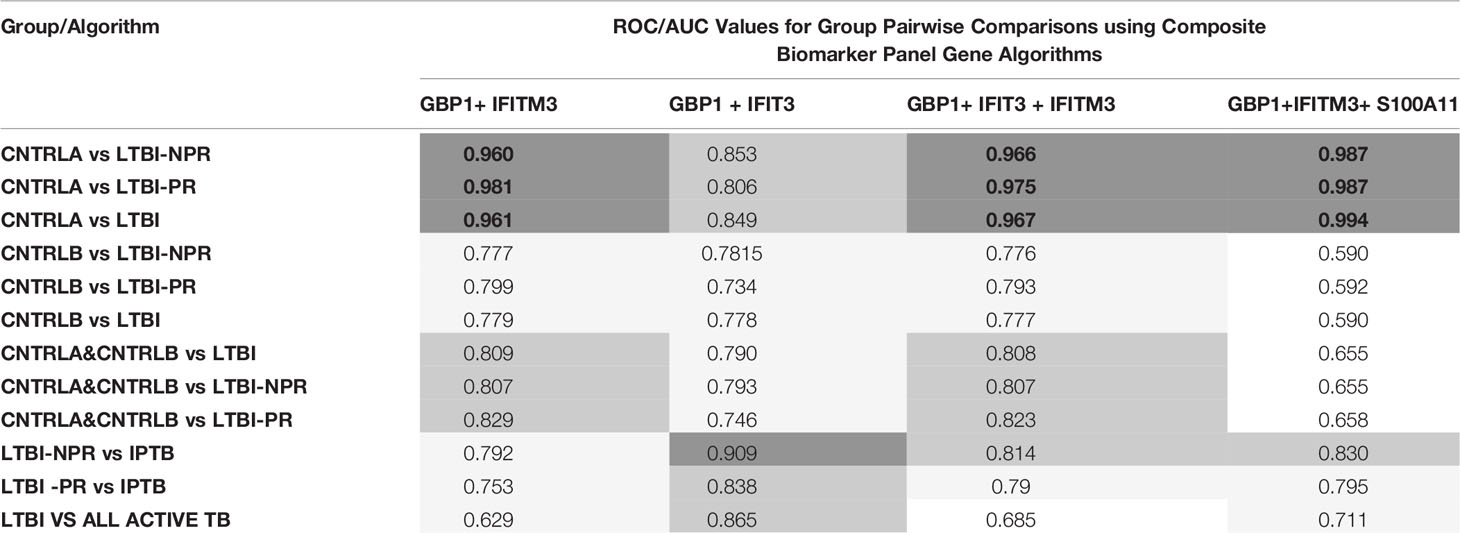
Table 2 Summary of AUC ROC values for control, latent and combined ATB group pairwise comparisons using simple, composite arithmetic algorithms.
The gene combinations which gave most consistent high accuracy discrimination between all control and ATB groups were GBP1+IFIT3 (ROC/AUC = 0.945, Figure 3A and depicted in scatterplot format in Figure 4A). Inclusion of SAMD9L (GBP1+IFIT3+SAMD9L) reduced the AUC value slightly (ROC/AUC = 0.944, Figure 3B and Figure 4B), but increased the specificity and PPV and NPV values, suggesting combining these three biomarkers may give the best overall test performance. This latter 3-plex gene combination also worked reasonably well for discrimination of Control<BI vs ATB groups (Supplementary Table S3 (inside file: Table 3.6C). The distribution of individuals above the defined cutoffs for each of these two combinations seen in Figures 4A, B show the high accuracy discrimination across all three ATB groups, compared with the CNTRLA group. The UKPTB group shows a greater range of positive and negative results above and below the cutoff value (−0.46) and may be more heterogeneous. At this cutoff only three IPTB patients and one IEPTB appear as false negatives. More moderate accuracy discrimination was observed between the LTBI and both control groups at the same cutoff (AUC = 0.79). Similar results were shown for GBP1+IFIT3+SAMD9L (Figure 4B). As discussed above the combination of GBP1+IFITM3 improved the ability to discriminate LTBI from combined controls but not from ATB (Figures 3C and 4C).
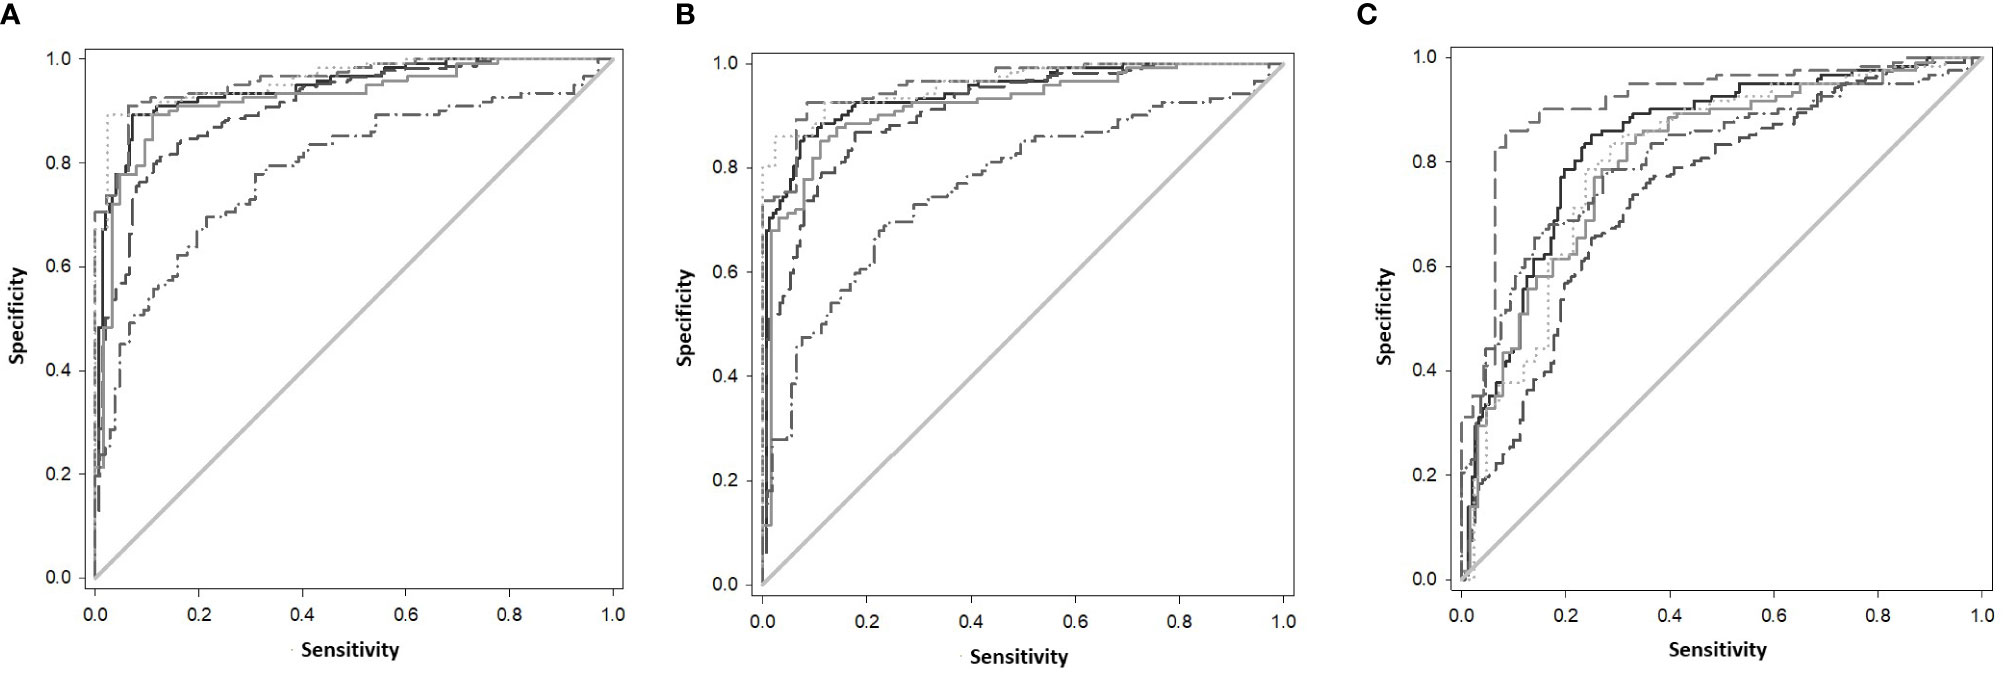
Figure 3 (A) ROC Curve analysis of all individual TB disease groups compared to the CNTRLA group and combined CNTRL<BI vs ATB groups, using the GBP1+IFIT3 algorithm (B) ROC Curve analysis of all individual TB disease groups compared to the CNTRLA group and combined CNTRL<BI vs ATB groups, using the GBP1+IFIT3 +SAMD9L algorithm (C) ROC Curve analysis of all individual TB disease groups compared to the CNTRLA group and combined CNTRL<BI vs ATB groups, using the GBP1+IFITM3 algorithm All CNTRLS vs ATB  , All CNTRLS vs IPTB
  , All CNTRLS vs UKPTB
  , All CNTRL vs IEPTB
  , All CNTRL vs LTBI
  , All CNTRL<BI vs ATB
  .
.
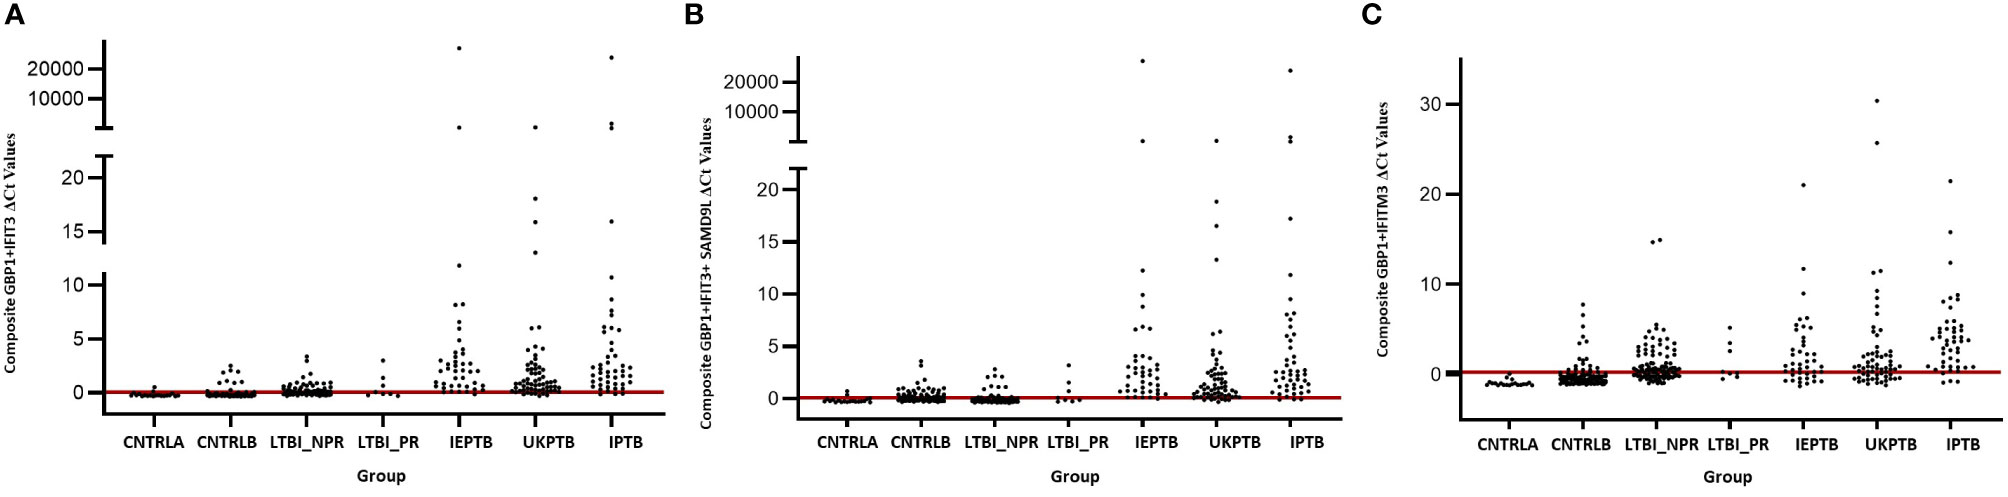
Figure 4 Scatter plot representations of data from analyses using the GBP1+IFIT3, GBP1+IFIT3 +SAMD9L and GBP1+IFITM3 algorithms across all control and TB disease groups including the LTBI non-progressor and progressors (A) GBP1+IFIT3 algorithm using the calculated cut-off value which discriminates ATB from all combined control groups (-0.046). (B) GBP1+IFIT3 +SAMD9L algorithm using the calculated cut-off value which discriminates ATB from all combined control groups (-0.036) (C) GBP1+IFITM3 algorithm using the calculated cut-off value which discriminates the LTBI from all combined control groups (0.074).
Other combination panels of gene biomarkers were trialed to determine the optimal configurations distinguishing LTBI (LTBI_NPR and LTBI_PR) from control groups (see Table 2 and Supplementary Table S3 (inside file: Table 3.6B)). GBP1 + IFITM3 showed high accuracy for discrimination of the LTBI groups from the CNTRLA group (AUC = 0.96) and more moderately when including the CNTRLB group (AUC = 0.809), (Figures 3C and 4C). GBP1+IFIT3 showed best performance for discriminating LTBI from ATB (Table 2) with an AUC of 0.865. Small differences were detected between non-progressor and progressor groups. Additionally, the combination of GBP1 + IFIT3 + IFITM3 achieved an ROC/AUC = 0.808, showing this combination could also be used for discrimination of LTBI and ATB. The ability to discriminate ATB from controls with or without LTBI was shown for all three panel combinations (shown in boxplot format in Figures 5A–C).
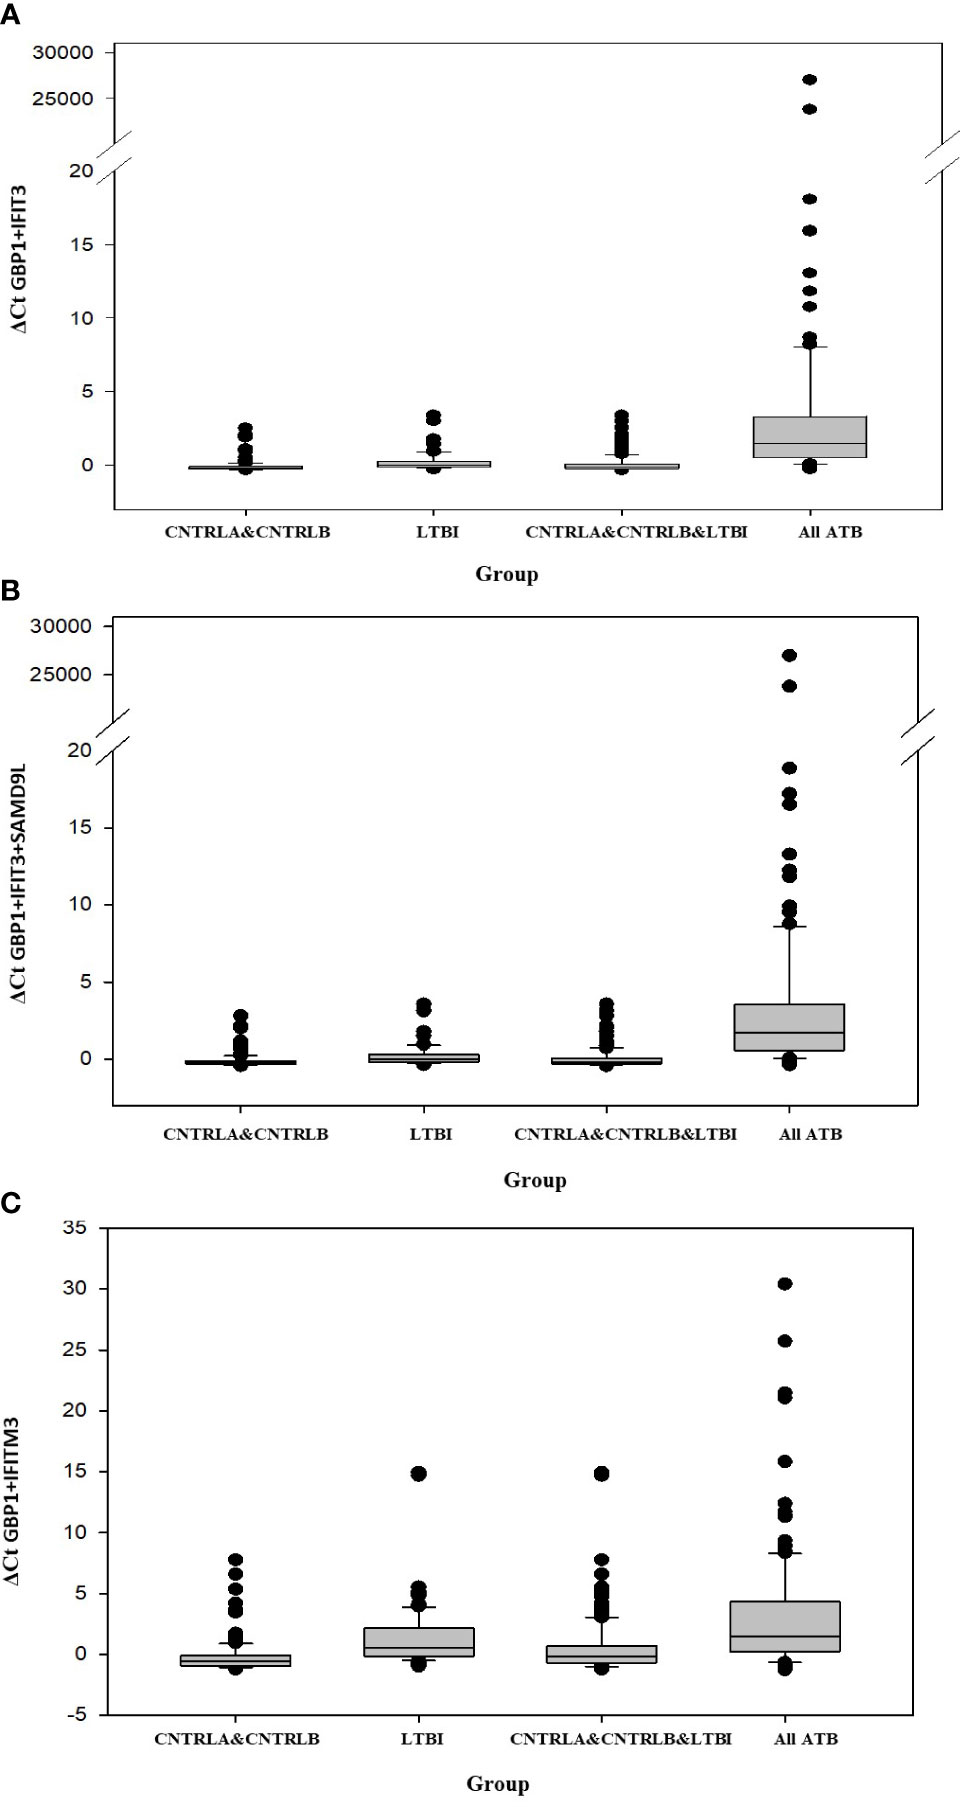
Figure 5 Bar chart representation of the comparison between the combined CNTRLA and CNTRLB control groups, the LTBI group, the combined CNTRLA, CNTRLB and LTBI groups and the combined ATB groups (A) using the GBP1+IFIT3 algorithm (from Table 2), (B) using the GBP1+IFIT3+SAMD9L algorithm (from Table 2) (C) using the GBP1+IFITM3 algorithm (from Table 3).
Diagnostic accuracy was further assessed using fixed sensitivities and/or specificities for the WHO TPPs (74, 140) for triage or confirmatory tests (given in Supplementary Table S3 (inside file: Table 3.7) — TB triage test; minimum ≥ 90% sensitivity and 70% specificity, TB optimal test; ≥ 95% sensitivity and 80% specificity, TB confirmatory test; ≥ 98% specificity and 65% sensitivity), with a side by side comparison of the panels’ performance given in Supplementary Table S3 (inside file: Table 3.8). The combination of GBP1+IFIT3 met the minimum and optimal triage and the confirmatory test requirements for all pairwise comparisons using CNTRLA alone, but not with CNTRLB alone or when CNTRLB was combined with CNTRLA, with the exception of the EPTB group. GBP1+IFIT3+SAMD9L met the minimum and optimal triage and the confirmatory test requirements for all pairwise comparisons using CNTRLA alone, except the UKPTB group. However, it showed good performance for the CNTRLB and CNTRLA&B combinations vs all ATB for the confirmatory test performance.
Determination of Biomarker Panel Receiver Operating Characteristic Profiles and Performance of the Optimal Biomarker Panels on Previously Published Data Sets
The performance of the panels on previously published data sets was then conducted [Supplementary Table S4, (inside Table: 4.1)]. Overall the performance of the panels was good, with high ROC/AUC values, however the results were variable. Most of the panels met either the minimal triage or confirmatory test requirements, except for the GSE107993 (Singhania_Leicester LTBI non-progressor study set), GSE79362 and E-MTAB-8290 data sets, where there was no minimal requirement positivity observed. Several of the preferred biomarker combinations met the minimum triage requirements for many of the study sets, including GSE107994 (Singhania_Leicester LTBI progressor study set). GBP1+GBP2+IFIT3+SAMD9L also met the confirmatory test minimum for controls vs ATB. The 7plex signature met the minimum and optimum triage and confirmatory test requirements for controls vs ATB and LTBI vs ATB and the minimum requirements for controls vs LTBI progressors. The GSE107992 data set showed good performance for most of the panels, except the optimal triage requirement for GBP1 + IFIT3, GBP1 + IFIT3+ SAMD9L and GBP1 + GBP2 + IFIT3 + SAMD9L +TAPBP.
Discussion
Here we describe Roche LightCycler 480 qPCR validation of differentially-regulated whole blood PBL mRNA gene biomarkers, previously identified in an NHP model of pulmonary TB (141), in 2 cohorts of patients with active TB (ATB) and a cohort of patients with latent TB (LTBI), compared with two groups of controls (CNTRLA and CNTRLB). Determination of candidate biomarker expression was conducted across ATB patient groups with pulmonary TB (UKPTB and IPTB), extra-pulmonary TB (IEPTB) and latent TB (LTBI_NPR and NPR_PR). Fifty-three of seventy-two biomarkers showed differential gene expression signals between disease groups and controls after quality filtration (%CV >200), on this platform. Seventeen highly significant markers were identified from this filtered data set using ANOVA; CALCOCO2, CD52, GBP1, GBP2, GBP5, HLA-B, IFIT3, IFITM3, IRF1, LOC400759 (GBP1P1), NCF1C, PF4V1, SAMD9L, S100A11, TAF10, TAPBP, and TRIM25 were further analyzed. The results showed a predominance of interferon-regulated gene entities, i.e., IRF1, STAT1, IFIT3, IFITM3, GBP1, LOC400759 (GBP1P1), GBP2, GBP5, and TRIM25 along with other entities associated with immune function. Using unbiased cluster analysis, the significant markers showed differential expression profiles across the control and study groups and increasing patterns of expression in active disease groups. Involvement of interferons and dysregulation of interferon-regulated genes in TB has been documented extensively elsewhere (101, 105, 107, 147–151), and our study further confirms these observations. Some inferences as to the underlying biology of biased expression across the groups could be made (a fuller description of gene biological function and group specific expression is given in Supplementary Table S1 (inside file: Supplementary Table 1.4 and Supplementary Information S4). Gene expression patterns may suggest some phased expression of interferon-regulated genes associated with different stages of disease.
ROC analyses revealed the single best performing biomarkers for discriminating both ATB and LTBI groups. Individual best performing biomarkers were then assessed for performance in combination using simple algorithms with the aim of developing minimal, multiplex biomarker panels for diagnosis. Various combinations were trialed empirically, with smaller two and three multiplexes giving good performance characteristics. The panels have shown good sensitivity, specificity and PPV/NPV. Combinations of GBP1, IFIT3, IFITM3 and SAMD9L using simple arithmetic algorithms looked promising for diagnosis of most ATB presentations. They may also be useful for diagnosis of LTBI and identification of individuals at high risk of progression.
The key diagnostic panel for all types of ATB was determined to be GBP1 and IFIT3, which gave the best performance both individually and in combination (combined AUC = 0.95). The combination of GBP1+IFIT3 could also discriminate LTBI samples from controls with a fairly good degree of accuracy (combined AUC = 0.79), but with reduced resolution compared with the preferred combination of GBP1 + IFITM3 (combined AUC = 0.809). The combination of GBP1 and IFIT3 met both the minimum and optimum TTP profile criteria for both the triage and confirmatory test when single and combined ATB groups were compared with the CNTRLA group. When the CNTRLB group was used as comparator this combination met the minimum triage test criteria only for the UKPTB, IPTB and IEPTB groups and the combined ATB group. It met the minimum criteria for the confirmatory test for the IEPTB and IPTB, but not the UKPTB or combined ATB groups. When the CNTRLA and CNTRLB groups were combined and the ATB groups then compared, this combination met the minimum triage criteria for all single ATB groups and the combined ATB group, but the optimal criteria for the triage test for the IEPTB group and the minimum confirmatory test for the IEPTB and IPTB groups only. When the CNTRLA, CNTRLB and LTBI groups were combined and compared with the single and combined ATB groups, this biomarker combination met the minimum criteria for the triage test only. These results demonstrated the potential for this minimum biomarker set to be used as both a triage and confirmatory test; however, its performance is influenced by the comparator group used. The results show clear differences between the control groups, again suggesting the CNTRLB group is a biased comparator, due to the likely presence of TB positive individuals. If these tests were used in an unbiased fashion, a proportion of the samples in the CNTRLB and LTBI groups would flag up as positive above the assigned threshold test cutoffs and be identified for potential follow up. This biomarker combination was not useful for discrimination of any combination of control or LTBI groups.
Inclusion of SAMD9L (GBP1+IFIT3 +SAMD9L) achieved a reduced AUC value of 0.94 but improved sensitivity and positive and negative predictive values (PPV & NPV), suggesting that this combination could give overall best performance (i.e., reducing the number of false negatives). This combination met many of the minimum and optimum TTP profile criteria for both the triage and confirmatory test, similarly to GBP1 and IFIT3, but its performance did not compare as favorably for the confirmatory test, except for all ATB groups vs CNTRLB singly as comparator and in combination with CNTRLA. Similar results were also observed with the other combinations, some of which show improved performance for discriminating between LTBI and ATB for the minimum triage requirement. It can be seen that the various biomarker combinations give slightly different results and any resulting developed test could potentially be tailored according to intended end use, particularly for discrimination between LTBI and ATB.
GBP1+ IFITM3 met the minimum and optimal performance criteria for the LTBI_NPR and combined LTBI groups for the triage test in comparison with CNTRLA, but the minimum criteria for the LTBI_PR group only. It met the confirmatory test criteria for the LTBI_PR group, but not for the LTBI_NPR and combined LTBI groups. These results are likely to be influenced by differences between LTBI and the two different control groups, due to heterogeneity in the CNTRLB group, which may contain mis-assigned LTBI or preclinically infected individuals, as discussed previously. The GBP1+ IFITM3 panel distinguishes LTBI from unambiguously uninfected negative control groups, with good sensitivity and thus be useful as a rule out test. It may also pick up previously unidentified LTBI classified negative using the Mantoux or IGRA tests. However, more complex multiplex assays may be required for high confidence detection of LTBI and asymptomatic pre-progressor TB patients at a relatively early, latent stage of disease, due to high inherent variability between individuals in the control and LTBI groups and also a relatively low level of biomarker gene expression in these individuals compared with those in the ATB groups. Various combinations of GBP1, IFITM3, GBP5, HLA-B, LOC400759, S100A11 and STAT1 may be useful for LTBI primary diagnosis and stratification, however this requires further study.
There have been a significant number of comparative studies investigating various biomarkers/biomarker panels for MTB diagnosis (88–91, 97, 110, 137, 138, 152–155). Some of the biomarkers validated in this study have been identified by other workers in the field previously as highly useful key components of other TB-diagnostic panels, e.g., GBP1, GBP2, LOC400759 (GBP1P1), GBP5, STAT1, IFIT3 & IFITM3 (110, 114, 115), adding confidence to our own observations. The overall view that this is a valid approach and a productive pipeline for new diagnostic test development, as evidenced in published market evaluation reports (60, 75–77, 79, 81, 85, 87, 155–157). However, to date few have been postulated to fulfill the WHO minimum requirements for progression (89, 110, 137). GBP1 and IFITM3 have been previously reported as components of a four-gene signature from Maertzdorf et al. for discrimination of TB infected from healthy individuals (123). This panel was included as part of prior signature evaluation studies by Leong et al (110, 138). They showed that both complex and relatively simple biomarker combinations, could be useful diagnostically and that some of the smaller panels evaluated previously exhibit good performance characteristics. These would be more amenable to simple, cost-effective assay development. Turner and co-workers also evaluated a number of previously published biomarker signatures to benchmark their diagnostic accuracy against the WHO TPPs for a tuberculosis triage test and found none which met the optimum criteria and two which met the minimum criteria, Roe3 and Sweeney3. These did not meet the minimum requirement for a confirmatory test (89, 137). Our study may offer biomarker panels which fulfill the WHO minimum criteria and triage optimum and confirmatory minimum requirements, dependent on the control group(s) used for comparison.
Zak et al. reported GBP1 in a signature for disease risk (111), where GBP1, STAT1, and TAP1 were considered to be protective and associated with a good clinical outcome. Sweeney et al. re-ported a three-gene signature GBP5+DUSP3+KLF2 that can correctly identify ATB from healthy controls and LTBI at high risk of progression (120). In comparison to these panels, our GBP1+ IFIT3 and GBP1+IFIT3 +SAMD9L panels gave similar results for discrimination of ATB from controls (AUC - 0.95 and 0.94), and for discrimination of ATB from LTBI non-progressors (AUC - 0.91). Additionally, our GBP1+ IFITM3 panel could identify LTBI from both combined control groups with an AUC of 0.81. When just the CNTRLA control group only was used, the AUC increased to 0.96. The performance of our GBP1+ IFIT3 and GBP1+IFIT3 +SAMD9L panels for ATB also compare favorably with the Indian-lasso-24 signature published by Leong [(110) AUC 0.984] and the RISK6 signature published recently by Penn-Nicholson et al. (AUC 0.936). Our panels exhibited slightly reduced ROC curve values than the lasso-24 on the same data set, however they are smaller and more amenable to multiplex assay development.
One observation from the Leong study is the small number of ATB outlier patient samples which fall outside of the experimental error and appear as false negatives in the scatter plots. There appears to be a subgroup of patients which segregate with the control samples. This is consistent with our own observations in our study where a proportion of patients in the ATB groups test negative for most of the biomarkers assayed. It would be interesting to determine whether these represent a subgroup of patients displaying a different clinical profile to the others or symptom status as proposed previously by Blankley and co-workers (112), e.g., disease severity, defective immune response/developed anergy. This is worth further investigation and could perhaps be characterized using other analytical means, e.g. flow cytometry.
In summary, we have validated a number of TB-associated whole blood PBL immune gene markers in new cohorts of patients and controls using qPCR, of which seventeen were significant. Their utility in primary determination of ATB (both pulmonary and extra-pulmonary manifestations) and LTBI has been assessed using ROC curve analysis and evaluated against the WHO TPP requirements for a triage and confirmatory test. ATB disease could be detected with a high degree of accuracy and sensitivity, including EPTB with LTBI detected at a somewhat reduced level. We have shown that minimally small configurations of biomarkers show comparable performance in relation to other studies. They exhibit the requisite TPP requirements for further evaluation and development on our data set, however variable performance was observed with other previously published data sets. This may be due in part to technical variation with the variety of assay platforms used, the contribution of which may be underestimated in contemporary comparison studies. Our biomarker panels could be easily formulated into a simple multiplex qPCR assay format and used in diagnosis/screening surveillance for all TB presentations, however further validation is required. The assays in this study were conducted on the Roche lightCycler 480, but these could be adapted easily to run on any qPCR platform as part of a low cost, rapid testing/screening program. Further work is underway to develop these panels as clinically useful, utilitarian diagnostic tests.
Study Limitations
A key limitation of the study is the choice of control groups. The study includes controls, latent TB and TB patients recruited in the UK, but only TB patients in India. The preferred control group for the Indian group samples would be region-matched disease-free individuals and those with other respiratory conditions/infections. The number of LTBI individuals progressing to active disease is also relatively small and this limits the power of the statistical analysis, as they could not be analyzed as a separate group with the analytical methods used. In addition, the Indian blood samples were banked in Tempus tubes while those in the UK were banked into PAXgene tubes, which may have had an impact on the consistency of RNA extraction and recovery. Limited demographic information was available on the patients included in the study. Future studies would be planned to address these issues and further empower the analyses.
Data Availability Statement
The raw data supporting the conclusions of this article will be made available by the authors, without undue reservation.
Ethics Statement
The studies involving human participants were reviewed and approved by JIPMER Institute Ethics committee, AIIMS Institute Ethics committee, the NHS Health Research Authority Research Ethics (NRES) Committee for London - Camden & Islington and PHE. The patients/participants provided their written informed consent to participate in this study.
Author Contributions
PP, MA, and KE conducted the experimental work. IH, ML, TM, JS, RB, GS, SK, IA, SS, and NJ provided control and patient samples and clinical and scientific expertise to the project. PP, NJ, SV, and KK designed the study protocol and managed the study. PP, MA, HG, and KK conducted the data analysis, and HG, IH, ML, TM, KE, NJ, and KK wrote and edited the paper. All authors contributed to the article and approved the submitted version.
Funding
This study was funded by the UK Department of Health and Social Care Grant in Aid and the Public Health England Pipeline fund. The views expressed in this publication are those of the authors and not necessarily those of PHE or the DH.
Conflict of Interest
The authors declare that the research was conducted in the absence of any commercial or financial relationships that could be construed as a potential conflict of interest.
Acknowledgments
We acknowledge Mark Sutton for assistance with proof-reading the manuscript.
Supplementary Material
The Supplementary Material for this article can be found online at: https://www.frontiersin.org/articles/10.3389/fimmu.2020.612564/full#supplementary-material
Supplementary Table S1 | Table 1.1. Details of Patient and Control Samples Table 1.2 Summary of numbers of patients per group and affiliations Table 1.2. Summary of patients or controls recruited per collaborating site used in the study Table 1.3. Number of participants per PREDICT TB LTBI and CNTRLB study groups study groups classified by TST IGRA status and progression to active TB Table 1.4 Gene entities validated in study using Roche Real-time Ready qPCR assays with assay configuration identifiers and ascribed biological function Table 1.5 Summary of the differentially expressed gene entities between the control, latent and active TB disease groups in the study from ANOVA SNK analysis Table 1.6 ROC/AUC values from pairwise comparisons for single biomarkers between control, latent and active TB disease groups Table 1.7 ROC/AUC values from pairwise comparisons for single biomarkers between control and latent TB progressor and non-progressor groups.
Supplementary Table S2 | Summary of genes from previously published studies overlapping with those analyzed in this study (highlighted in red text) and performance to WHO TPP requirements based on source or reviewed sensitivity and specificity values.
Supplementary Table S3 | Table 3.1. p values of entities differentially regulated be-tween groups from ANOVA performed across all groups using BH FDR (corrected p value < 0.05) and the SNK post hoc test, plus direction of regulation. Table 3.2. Detailed comparison of entities differentially regulated between groups from the SNK post hoc test table, comparison and p values for significant entities only. Table 3.3. Fold change comparison for all 17 statistically significant biomarkers between the LTBI-NPR and LTBI-PR groups. Table 3.4. Individuals in the CNTRLA, CNTRLB, LTBI_NPR, and LTBI_PR groups ranked according to their cumulative average expression values for the 7plex signature, using cutoff points set at equal to and greater than the mean and or standard deviations above the mean; Greater than  , between and
  , between and
  Table 3.5. ROC/AUC results, plus sensitivity, specificity, likelihood ratios and positive and negative predictive values for single significant biomarkers across all ATB and LTBI groups compared with controls Table 3.6. ROC/AUC results, plus sensitivity, specificity, likelihood ratios and positive and negative predictive values for key combinations of significant biomarkers across all ATB and LTBI groups compared with controls Table 3.7. Diagnostic accuracy of biomarker panels assessed using fixed sensitivities and/or specificities defined by the WHO technology product profiles for triage or confirmatory tests Table 3.8. Comparison of performance of biomarker panels (A–F) with regard to control and patient groups and the WHO technology product profiles for the minimum and optimal triage and confirmatory tests.
Supplementary Table S4 | Performance of optimal biomarker panels on other previously published data sets.
Supplementary Information S1 | Figure 1.1 Distribution of the number of entities differentially regulated between groups from ANOVA, performed across all groups using BH FDR (corrected p value < 0.05) and using the SNK post hoc test. Figure 1.2. Line graph of CD52 normalized intensity values across all TB disease and control groups. Figure 1.3. Line graph of GBP1 normalized intensity values across all TB disease and control groups. Figure 1.4. Line graph of GBP2 normalized intensity values across all TB disease and control groups. Figure 1.5. Line graph of GBP5 normalized intensity values across all TB disease and control groups. Figure 1.6. Line graph of HLA-B normalized intensity values across all TB disease and control groups. Figure 1.7. Line graph of IFIT3 normalized intensity values across all TB disease and control groups. Figure 1.8. Line graph of IFITM3 normalized intensity values across all TB disease and control groups. Figure 1.9. Line graph of IRF1 normalized intensity values across all TB disease and control groups. Figure 1.10. Line graph of LOC400759 normalized intensity values across all TB dis-ease and control groups. Figure 1.11. Line graph of NCF1C normalized intensity values across all TB disease and control groups. Figure 1.12. Line graph of PF4V1 normalized intensity values across all TB disease and control groups. Figure 1.13. Line graph of S100A11 normalized intensity values across all TB disease and control groups. Figure 1.14. Line graph of SAMD9L normalized intensity values across all TB disease and control groups. Figure 1.15. Line graph of STAT1 normalized intensity values across all TB disease and control groups. Figure 1.16. Line graph of TAF10 normalized intensity values across all TB disease and control groups. Figure 1.17. Line graph of TAPBP normalized intensity values across all TB disease and control groups. Figure 1.18. Line graph of TRIM25 normalized intensity values across all TB disease and control groups.
Supplementary Information S2 | Figure 2.1. Cluster analysis on group averaged data for all statistically significant entities from ANOVA (p < 0.05) (A) low TB incidence region UK control group (CNTRLA) (B) low TB incidence region UK control from the PREDICT TB study group (CNTRLB) (C) low TB incidence region UK Latent TB from the PREDICT TB study group (LTBI) (D) high TB incidence region extra-pulmonary TB group (IEPTB) (E) low TB incidence region UK pulmonary TB group (UKPTB) (F) high TB incidence region pulmonary TB group (IPTB). Entities which show expression differences between the LTBI_NPR and LTBI_PR groups are boxed in red, with the boxed region showing the highest expression compared to that in the relative other group.
Supplementary Information S3 | Figure 3.1 Heatmap of the 17-plex entities showing individual expression profiles across the disease and control groups. The top three ranked patient samples 2439, 1053 and 1864 from the cumulative scoring analysis using the 7-plex signature are highlighted with red arrows.
Supplementary Information S4 | Description of the group association and biological function of the 17 statistically significant biomarkers from Supplementary Information S4.
References
1. Bloom BR, Atun R, Cohen T, Dye C, Fraser H, Gomez GB, et al. Tuberculosis. In: KK H, Bertozzi S, BR B, Jha P, editors. Major Infectious Diseases. Washington (DC (2017). doi: 10.1596/978-1-4648-0524-0_ch11
2. World Health Organisation. 2020 Global Tuberculosis Report. The World Health Organisation (2020). Available at: https://www.who.int/tb/publications/global_report/en/.
3. Holmes KK, Bertozzi S, Bloom BR, Jha P, Gelband H, DeMaria LM, et al. Major Infectious Diseases: Key Messages from Disease Control Priorities. In: Holmes KK, Bertozzi S, Bloom BR, Jha P, editors. Major Infectious Diseases, 3rd ed. Washington (DC (2017). doi: 10.1596/978-1-4648-0524-0_ch1
4. Abubakar I, Lalvani A, Southern J, Sitch A, Jackson C, Onyimadu O, et al. Two interferon gamma release assays for predicting active tuberculosis: the UK PREDICT TB prognostic test study. Health Technol Assess (2018) 22(56):1–96. doi: 10.3310/hta22560
5. Hayward S, Harding RM, McShane H, Tanner R. Factors influencing the higher incidence of tuberculosis among migrants and ethnic minorities in the UK. F1000Res (2018) 7:461. doi: 10.12688/f1000research.14476.2
6. Abarca Tomas B, Pell C, Bueno Cavanillas A, Guillen Solvas J, Pool R, Roura M. Tuberculosis in migrant populations. A systematic review of the qualitative literature. PLoS One (2013) 8(12):e82440. doi: 10.1371/journal.pone.0082440
7. Crawshaw AF, Pareek M, Were J, Schillinger S, Gorbacheva O, Wickramage KP, et al. Infectious disease testing of UK-bound refugees: a population-based, cross-sectional study. BMC Med (2018) 16(1):143. doi: 10.1186/s12916-018-1125-4
8. Jilani TN, Avula A, Zafar Gondal A, Siddiqui AH. Active Tuberculosis. Treasure Island (FL: StatPearls (2020).
9. Sharma N, Basu S, Chopra KK. Achieving TB elimination in India: The role of latent TB management. Indian J Tuberc (2019) 66(1):30–3. doi: 10.1016/j.ijtb.2018.10.006
10. Pattnaik S. Analysis of tuberculosis case report in Hyderabad district of Telangana state. J Family Med Prim Care (2018) 7(3):561–4. doi: 10.4103/jfmpc.jfmpc_110_18
11. Mathur N, Chatla C, Syed S, Patel Y, Pattnaik S, Mathai D, et al. Prospective 1-year follow-up study of all cured, new sputum smear positive tuberculosis patients under the Revised National Tuberculosis Control Program in Hyderabad, Telangana State, India. Lung India (2019) 36(6):519–24. doi: 10.4103/lungindia.lungindia_143_19
12. Long B, Liang SY, Koyfman A, Gottlieb M. Tuberculosis: a focused review for the emergency medicine clinician. Am J Emerg Med (2019) 38(5):1014–22. doi: 10.1016/j.ajem.2019.12.040
13. Jelinska A, Zajac M, Dadej A, Tomczak S, Geszke-Moritz M, Muszalska-Kolos I. Tuberculosis - Present Medication and Therapeutic Prospects. Curr Med Chem (2020) 27(4):630–56. doi: 10.2174/0929867325666181120100025
14. Tiberi S, du Plessis N, Walzl G, Vjecha MJ, Rao M, Ntoumi F, et al. Tuberculosis: progress and advances in development of new drugs, treatment regimens, and host-directed therapies. Lancet Infect Dis (2018) 18(7):e183–e98. doi: 10.1016/S1473-3099(18)30110-5
15. World Health Organisation. Tuberculosis. The World Health Organization (2020). Available at: https://www.who.int/news-room/fact-sheets/detail/tuberculosis.
16. Harries AD, Kumar AMV, Satyanarayana S, Takarinda KC, Timire C, Dlodlo RA. Treatment for latent tuberculosis infection in low- and middle-income countries: progress and challenges with implementation and scale-up. Expert Rev Respir Med (2020) 14(2):195–208. doi: 10.1080/17476348.2020.1694907
17. Chaw L, Chien LC, Wong J, Takahashi K, Koh D, Lin RT. Global trends and gaps in research related to latent tuberculosis infection. BMC Public Health (2020) 20(1):352. doi: 10.1186/s12889-020-8419-0
18. Knight GM, McQuaid CF, Dodd PJ, Houben R. Global burden of latent multidrug-resistant tuberculosis: trends and estimates based on mathematical modelling. Lancet Infect Dis (2019) 19(8):903–12. doi: 10.1016/S1473-3099(19)30307-X
19. Houben R, Esmail H, Emery JC, Joslyn LR, McQuaid CF, Menzies NA, et al. Spotting the old foe-revisiting the case definition for TB. Lancet Respir Med (2019) 7(3):199–201. doi: 10.1016/S2213-2600(19)30038-4
20. Houben RM, Dodd PJ. The Global Burden of Latent Tuberculosis Infection: A Re-estimation Using Mathematical Modelling. PLoS Med (2016) 13(10):e1002152. doi: 10.1371/journal.pmed.1002152
21. Jagger A, Reiter-Karam S, Hamada Y, Getahun H. National policies on the management of latent tuberculosis infection: review of 98 countries. Bull World Health Organ (2018) 96(3):173–84F. doi: 10.2471/BLT.17.199414
22. Getahun H, Matteelli A, Abubakar I, Aziz MA, Baddeley A, Barreira D, et al. Management of latent Mycobacterium tuberculosis infection: WHO guidelines for low tuberculosis burden countries. Eur Respir J (2015) 46(6):1563–76. doi: 10.1183/13993003.20154606.E60
23. Zenner D, Loutet MG, Harris R, Wilson S, Ormerod LP. Evaluating 17 years of latent tuberculosis infection screening in north-west England: a retrospective cohort study of reactivation. Eur Respir J (2017) 50(1):1602505. doi: 10.1183/13993003.02505-2016
24. Zenner D, Hafezi H, Potter J, Capone S, Matteelli A. Effectiveness and cost-effectiveness of screening migrants for active tuberculosis and latent tuberculous infection. Int J Tuberc Lung Dis (2017) 21(9):965–76. doi: 10.5588/ijtld.16.0935
25. Gupta RK, Lipman M, Story A, Hayward A, de Vries G, van Hest R, et al. Active case finding and treatment adherence in risk groups in the tuberculosis pre-elimination era. Int J Tuberc Lung Dis (2018) 22(5):479–87. doi: 10.5588/ijtld.17.0767
26. Assefa Y, Woldeyohannes S, Gelaw YA, Hamada Y, Getahun H. Screening tools to exclude active pulmonary TB in high TB burden countries: systematic review and meta-analysis. Int J Tuberc Lung Dis (2019) 23(6):728–34. doi: 10.5588/ijtld.18.0547
27. Uplekar M, Weil D, Lonnroth K, Jaramillo E, Lienhardt C, Dias HM, et al. WHO’s new end TB strategy. Lancet (2015) 385(9979):1799–801. doi: 10.1016/S0140-6736(15)60570-0
28. Uplekar M, Raviglione M. WHO’s End TB Strategy: From stopping to ending the global TB epidemic. Indian J Tuberc (2015) 62(4):196–9. doi: 10.1016/j.ijtb.2015.11.001
29. Uplekar M. Implementing the End TB Strategy: Well begun will be half done. Indian J Tuberc (2015) 62(2):61–3. doi: 10.1016/j.ijtb.2015.03.001
30. Zenner D, Stagg HR, Harris RJ, Abubakar I. Treatment of latent tuberculosis infection. Ann Intern Med (2015) 162(5):394–5. doi: 10.7326/L15-5058-3
31. Zenner D, Beer N, Harris RJ, Lipman MC, Stagg HR, van der Werf MJ. Treatment of Latent Tuberculosis Infection: An Updated Network Meta-analysis. Ann Intern Med (2017) 167(4):248–55. doi: 10.7326/M17-0609
32. Ling DI, Pai M, Schiller I. Dendukuri N. A Bayesian framework for estimating the incremental value of a diagnostic test in the absence of a gold standard. BMC Med Res Methodol (2014) 14:67. doi: 10.1186/1471-2288-14-67
33. Norbis L, Miotto P, Alagna R, Cirillo DM. Tuberculosis: lights and shadows in the current diagnostic landscape. New Microbiol (2013) 36(2):111–20.
34. Reid MJA, Arinaminpathy N, Bloom A, Bloom BR, Boehme C, Chaisson R, et al. Building a tuberculosis-free world: The Lancet Commission on tuberculosis. Lancet (2019) 393(10178):1331–84. doi: 10.1016/S0140-6736(19)30024-8
35. Ahmad S. Pathogenesis, immunology, and diagnosis of latent Mycobacterium tuberculosis infection. Clin Dev Immunol (2011) 2011:814943. doi: 10.1155/2011/814943
36. Segal-Maurer S. Tuberculosis in Enclosed Populations. Microbiol Spectr (2017) 5(2):TNMI7-0041-2017. doi: 10.1128/microbiolspec.TNMI7-0041-2017
37. Esmail H, Barry CE,3, Young DB, Wilkinson RJ. The ongoing challenge of latent tuberculosis. Philos Trans R Soc Lond B Biol Sci (2014) 369(1645):20130437. doi: 10.1098/rstb.2013.0437
38. Robertson BD, Altmann D, Barry C, Bishai B, Cole S, Dick T, et al. Detection and treatment of subclinical tuberculosis. Tuberculosis (Edinb) (2012) 92(6):447–52. doi: 10.1016/j.tube.2012.06.004
39. Barry CE,3, Boshoff HI, Dartois V, Dick T, Ehrt S, Flynn J, et al. The spectrum of latent tuberculosis: rethinking the biology and intervention strategies. Nat Rev Microbiol (2009) 7(12):845–55. doi: 10.1038/nrmicro2236
40. Chee CBE, Reves R, Zhang Y, Belknap R. Latent tuberculosis infection: Opportunities and challenges. Respirology (2018) 23(10):893–900. doi: 10.1111/resp.13346
41. Lin PL, Flynn JL. Understanding latent tuberculosis: a moving target. J Immunol (2010) 185(1):15–22. doi: 10.4049/jimmunol.0903856
42. Abubakar I, Drobniewski F, Southern J, Sitch AJ, Jackson C, Lipman M, et al. Prognostic value of interferon-gamma release assays and tuberculin skin test in predicting the development of active tuberculosis (UK PREDICT TB): a prospective cohort study. Lancet Infect Dis (2018) 18(10):1077–87. doi: 10.1016/S1473-3099(18)30355-4
43. Fox GJ, Dobler CC, Marais BJ, Denholm JT. Preventive therapy for latent tuberculosis infection-the promise and the challenges. Int J Infect Dis (2017) 56:68–76. doi: 10.1016/j.ijid.2016.11.006
44. Sharma SK, Mohanan S, Sharma A. Relevance of latent TB infection in areas of high TB prevalence. Chest (2012) 142(3):761–73. doi: 10.1378/chest.12-0142
45. Huddart S, MacLean E, Pai M. Location, location, location: tuberculosis services in highest burden countries. Lancet Glob Health (2016) 4(12):e907–e8. doi: 10.1016/S2214-109X(16)30248-0
46. Bacelo AC, do Brasil PE, Cople-Rodrigues CD, Ingebourg G, Paiva E, Ramalho A, et al. Dietary counseling adherence during tuberculosis treatment: A longitudinal study. Clin Nutr ESPEN. (2017) 17:44–53. doi: 10.1016/j.clnesp.2016.11.001
47. Kendall EA, Sahu S, Pai M, Fox GJ, Varaine F, Cox H, et al. What will it take to eliminate drug-resistant tuberculosis? Int J Tuberc Lung Dis (2019) 23(5):535–46. doi: 10.5588/ijtld.18.0217
48. Wurie FB, Cooper V, Horne R, Hayward AC. Determinants of non-adherence to treatment for tuberculosis in high-income and middle-income settings: a systematic review protocol. BMJ Open (2018) 8(1):e019287. doi: 10.1136/bmjopen-2017-019287
49. Subbaraman R, de Mondesert L, Musiimenta A, Pai M, Mayer KH, Thomas BE, et al. Digital adherence technologies for the management of tuberculosis therapy: mapping the landscape and research priorities. BMJ Glob Health (2018) 3(5):e001018. doi: 10.1136/bmjgh-2018-001018
50. Sabate E. Adherence to Long Term Therapies: Evidence for Action. WHO Library (2003). Available at: https://www.who.int/chp/knowledge/publications/adherence_introduction.pdf?ua=1.
51. Ahsan MJ, Garg SK, Vashistha B, Sharma P. Tuberculosis vaccines: hopes and hurdles. Infect Disord Drug Targets (2013) 13(5):318–21. doi: 10.2174/1871526513666131201125513
52. Ormerod LP. Multidrug-resistant tuberculosis (MDR-TB): epidemiology, prevention and treatment. Br Med Bull (2005) 73-74:17–24. doi: 10.1093/bmb/ldh047
53. Pozniak AL, Miller RF, Lipman MC, Freedman AR, Ormerod LP, Johnson MA, et al. BHIVA treatment guidelines for tuberculosis (TB)/HIV infection 2005. HIV Med (2005) 6 Suppl 2:62–83. doi: 10.1111/j.1468-1293.2005.00293.x
54. Palomino JC, Martin A. Tuberculosis clinical trial update and the current anti-tuberculosis drug portfolio. Curr Med Chem (2013) 20(30):3785–96. doi: 10.2174/09298673113209990166
55. Ahuja SD, Ashkin D, Avendano M, Banerjee R, Bauer M, Bayona JN, et al. Multidrug resistant pulmonary tuberculosis treatment regimens and patient outcomes: an individual patient data meta-analysis of 9,153 patients. PLoS Med (2012) 9(8):e1001300. doi: 10.1371/journal.pmed.1001300
56. Tiberi S, Munoz-Torrico M, Duarte R, Dalcolmo M, D’Ambrosio L, Migliori GB. New drugs and perspectives for new anti-tuberculosis regimens. Pulmonology (2018) 24(2):86–98. doi: 10.1016/j.rppnen.2017.10.009
57. Fox GJ, Mitnick CD, Benedetti A, Chan ED, Becerra M, Chiang CY, et al. Surgery as an Adjunctive Treatment for Multidrug-Resistant Tuberculosis: An Individual Patient Data Metaanalysis. Clin Infect Dis (2016) 62(7):887–95. doi: 10.1093/cid/ciw002
58. World Health Organisation. The End TB Strategy. The World Health Organization (2020). Available at: https://www.who.int/tb/strategy/en/.
59. Sohn H, Kasaie P, Kendall E, Gomez GB, Vassall A, Pai M, et al. Informing decision-making for universal access to quality tuberculosis diagnosis in India: an economic-epidemiological model. BMC Med (2019) 17(1):155. doi: 10.1186/s12916-019-1384-8
60. Pai M, Schito M. Tuberculosis diagnostics in 2015: landscape, priorities, needs, and prospects. J Infect Dis (2015) 211 Suppl 2:S21–8. doi: 10.1093/infdis/jiu803
61. Schumacher SG, Wells WA, Nicol MP, Steingart KR, Theron G, Dorman SE, et al. Guidance for Studies Evaluating the Accuracy of Sputum-Based Tests to Diagnose Tuberculosis. J Infect Dis (2019) 220(Supplement_3):S99–107. doi: 10.1093/infdis/jiz258
62. Schumacher SG, Thangakunam B, Denkinger CM, Oliver AA, Shakti KB, Qin ZZ, et al. Impact of point-of-care implementation of Xpert(R) MTB/RIF: product vs. process innovation. Int J Tuberc Lung Dis (2015) 19(9):1084–90. doi: 10.5588/ijtld.15.0120
63. Zar HJ, Workman LJ, Prins M, Bateman LJ, Mbhele SP, Whitman CB, et al. Tuberculosis Diagnosis in Children Using Xpert Ultra on Different Respiratory Specimens. Am J Respir Crit Care Med (2019) 200(12):1531–8. doi: 10.1164/rccm.201904-0772OC
64. Sarin S, Huddart S, Raizada N, Parija D, Kalra A, Rao R, et al. Cost and operational impact of promoting upfront GeneXpert MTB/RIF test referrals for presumptive pediatric tuberculosis patients in India. PLoS One (2019) 14(4):e0214675. doi: 10.1371/journal.pone.0214675
65. TBfacts.org. Genexpert. The World Health Organization (2020). Available at: https://tbfacts.org/genexpert/.
66. Nathavitharana RR, Yoon C, Macpherson P, Dowdy DW, Cattamanchi A, Somoskovi A, et al. Guidance for Studies Evaluating the Accuracy of Tuberculosis Triage Tests. J Infect Dis (2019) 220(Supplement_3):S116–S25. doi: 10.1093/infdis/jiz243
67. Cazabon D, Pande T, Kik S, Van Gemert W, Sohn H, Denkinger C, et al. Market penetration of Xpert MTB/RIF in high tuberculosis burden countries: A trend analysis from 2014 - 2016. Gates Open Res (2018) 2:35. doi: 10.12688/gatesopenres.12842.2
68. Cazabon D, Alsdurf H, Satyanarayana S, Nathavitharana R, Subbaraman R, Daftary A, et al. Quality of tuberculosis care in high burden countries: the urgent need to address gaps in the care cascade. Int J Infect Dis (2017) 56:111–6. doi: 10.1016/j.ijid.2016.10.016
69. Ramirez-Lapausa M, Menendez-Saldana A, Noguerado-Asensio A. [Extrapulmonary tuberculosis]. Rev Esp Sanid Penit (2015) 17(1):3–11. doi: 10.4321/S1575-06202015000100002
70. Das P, Ahuja A, Gupta SD. Incidence, etiopathogenesis and pathological aspects of genitourinary tuberculosis in India: A journey revisited. Indian J Urol (2008) 24(3):356–61. doi: 10.4103/0970-1591.42618
71. Agins BD, Ikeda DJ, Reid MJA, Goosby E, Pai M, Cattamanchi A. Improving the cascade of global tuberculosis care: moving from the “what” to the “how” of quality improvement. Lancet Infect Dis (2019) 19(12):E437–43. doi: 10.1016/S1473-3099(19)30420-7
72. Hatherill M, Chaisson RE, Denkinger CM. Addressing critical needs in the fight to end tuberculosis with innovative tools and strategies. PLoS Med (2019) 16(4):e1002795. doi: 10.1371/journal.pmed.1002795
73. Drain PK, Gardiner J, Hannah H, Broger T, Dheda K, Fielding K, et al. Guidance for Studies Evaluating the Accuracy of Biomarker-Based Nonsputum Tests to Diagnose Tuberculosis. J Infect Dis (2019) 220(Supplement_3):S108–S15. doi: 10.1093/infdis/jiz356
74. Denkinger CM, Schumacher SG, Gilpin C, Korobitsyn A, Wells WA, Pai M, et al. Guidance for the Evaluation of Tuberculosis Diagnostics That Meet the World Health Organization (WHO) Target Product Profiles: An Introduction to WHO Process and Study Design Principles. J Infect Dis (2019) 220(Supplement_3):S91–S8. doi: 10.1093/infdis/jiz097
75. Zhao YL, Pang Y, Xia H, Du X, Chin D, Huan ST, et al. Market assessment of tuberculosis diagnostics in China in 2012. Int J Tuberc Lung Dis (2016) 20(3):295–303. doi: 10.5588/ijtld.15.0156
76. Maheshwari P, Chauhan K, Kadam R, Pujani A, Kaur M, Chitalia M, et al. Market assessment of tuberculosis diagnostics in India in 2013. Int J Tuberc Lung Dis (2016) 20(3):304–13. doi: 10.5588/ijtld.15.0571
77. Kik SV, Denkinger CM, Casenghi M, Vadnais C, Pai M. Tuberculosis diagnostics: which target product profiles should be prioritised? Eur Respir J (2014) 44(2):537–40. doi: 10.1183/09031936.00027714
78. Kik SV, Denkinger CM, Chedore P, Pai M. Replacing smear microscopy for the diagnosis of tuberculosis: what is the market potential? Eur Respir J (2014) 43(6):1793–6. doi: 10.1183/09031936.00217313
79. Kik SV, Denkinger CM, Jefferson C, Ginnard J, Pai M. Potential market for novel tuberculosis diagnostics: worth the investment? J Infect Dis (2015) 211 Suppl 2:S58–66. doi: 10.1093/infdis/jiu817
80. Cobelens F, Kik S, Esmail H, Cirillo DM, Lienhardt C, Matteelli A. From latent to patent: rethinking prediction of tuberculosis. Lancet Respir Med (2017) 5(4):243–4. doi: 10.1016/S2213-2600(16)30419-2
81. Denkinger CM, Kik SV, Cirillo DM, Casenghi M, Shinnick T, Weyer K, et al. Defining the needs for next generation assays for tuberculosis. J Infect Dis (2015) 211 Suppl 2:S29–38. doi: 10.1093/infdis/jiu821
82. Penn-Nicholson A, Hraha T, Thompson EG, Sterling D, Mbandi SK, Wall KM, et al. Discovery and validation of a prognostic proteomic signature for tuberculosis progression: A prospective cohort study. PLoS Med (2019) 16(4):e1002781. doi: 10.1371/journal.pmed.1002781
83. Manngo PM, Gutschmidt A, Snyders CI, Mutavhatsindi H, Manyelo CM, Makhoba NS, et al. Prospective evaluation of host biomarkers other than interferon gamma in QuantiFERON Plus supernatants as candidates for the diagnosis of tuberculosis in symptomatic individuals. J Infect (2019) 79(3):228–35. doi: 10.1016/j.jinf.2019.07.007
84. Keshavjee S, Amanullah F, Cattamanchi A, Chaisson R, Dobos KM, Fox GJ, et al. Moving toward Tuberculosis Elimination. Critical Issues for Research in Diagnostics and Therapeutics for Tuberculosis Infection. Am J Respir Crit Care Med (2019) 199(5):564–71. doi: 10.1164/rccm.201806-1053PP
85. Walzl G, McNerney R, du Plessis N, Bates M, McHugh TD, Chegou NN, et al. Tuberculosis: advances and challenges in development of new diagnostics and biomarkers. Lancet Infect Dis (2018) 18(7):e199–210. doi: 10.1016/S1473-3099(18)30111-7
86. Walzl G, Haks MC, Joosten SA, Kleynhans L, Ronacher K, Ottenhoff TH. Clinical immunology and multiplex biomarkers of human tuberculosis. Cold Spring Harb Perspect Med (2014) 5(4):a018515. doi: 10.1101/cshperspect.a018515
87. Wallis RS, Pai M, Menzies D, Doherty TM, Walzl G, Perkins MD, et al. Biomarkers and diagnostics for tuberculosis: progress, needs, and translation into practice. Lancet (2010) 375(9729):1920–37. doi: 10.1016/S0140-6736(10)60359-5
88. MacLean E, Broger T, Yerlikaya S, Fernandez-Carballo BL, Pai M, Denkinger CM. A systematic review of biomarkers to detect active tuberculosis. Nat Microbiol (2019) 4(5):748–58. doi: 10.1038/s41564-019-0380-2
89. Gupta RK, Turner CT, Venturini C, Esmail H, Rangaka MX, Copas A, et al. Concise whole blood transcriptional signatures for incipient tuberculosis: a systematic review and patient-level pooled meta-analysis. Lancet Respir Med (2020) 8(4):395–406. doi: 10.1016/S2213-2600(19)30282-6
90. Warsinske H, Vashisht R, Khatri P. Host-response-based gene signatures for tuberculosis diagnosis: A systematic comparison of 16 signatures. PLoS Med (2019) 16(4):e1002786. doi: 10.1371/journal.pmed.1002786
91. Warsinske HC, Rao AM, Moreira FMF, Santos PCP, Liu AB, Scott M, et al. Assessment of Validity of a Blood-Based 3-Gene Signature Score for Progression and Diagnosis of Tuberculosis, Disease Severity, and Treatment Response. JAMA Netw Open (2018) 1(6):e183779. doi: 10.1001/jamanetworkopen.2018.3779
92. Mulenga H, Bunyasi EW, Mbandi SK, Mendelsohn SC, Kagina B, Penn-Nicholson A, et al. Performance of host blood transcriptomic signatures for diagnosing and predicting progression to tuberculosis disease in HIV-negative adults and adolescents: a systematic review protocol. BMJ Open (2019) 9(5):e026612. doi: 10.1136/bmjopen-2018-026612
93. Wallis RS, Jakubiec W, Kumar V, Bedarida G, Silvia A, Paige D, et al. Biomarker-assisted dose selection for safety and efficacy in early development of PNU-100480 for tuberculosis. Antimicrob Agents Chemother (2011) 55(2):567–74. doi: 10.1128/AAC.01179-10
94. Sumner T, Scriba TJ, Penn-Nicholson A, Hatherill M, White RG. Potential population level impact on tuberculosis incidence of using an mRNA expression signature correlate-of-risk test to target tuberculosis preventive therapy. Sci Rep (2019) 9(1):11126. doi: 10.1038/s41598-019-47645-z
95. Ronacher K, Chegou NN, Kleynhans L, Djoba Siawaya JF, du Plessis N, Loxton AG, et al. Distinct serum biosignatures are associated with different tuberculosis treatment outcomes. Tuberculosis (Edinb) (2019) 118:101859. doi: 10.1016/j.tube.2019.101859
96. Darboe F, Mbandi SK, Naidoo K, Yende-Zuma N, Lewis L, Thompson EG, et al. Detection of Tuberculosis Recurrence, Diagnosis and Treatment Response by a Blood Transcriptomic Risk Signature in HIV-Infected Persons on Antiretroviral Therapy. Front Microbiol (2019) 10:1441. doi: 10.3389/fmicb.2019.01441
97. Singhania A, Wilkinson RJ, Rodrigue M, Haldar P, O’Garra A. The value of transcriptomics in advancing knowledge of the immune response and diagnosis in tuberculosis. Nat Immunol (2018) 19(11):1159–68. doi: 10.1038/s41590-018-0225-9
98. Thompson EG, Du Y, Malherbe ST, Shankar S, Braun J, Valvo J, et al. Host blood RNA signatures predict the outcome of tuberculosis treatment. Tuberculosis (Edinb) (2017) 107:48–58. doi: 10.1016/j.tube.2017.08.004
99. Jacobs R, Tshehla E, Malherbe S, Kriel M, Loxton AG, Stanley K, et al. Host biomarkers detected in saliva show promise as markers for the diagnosis of pulmonary tuberculosis disease and monitoring of the response to tuberculosis treatment. Cytokine (2016) 81:50–6. doi: 10.1016/j.cyto.2016.02.004
100. Jacobs R, Malherbe S, Loxton AG, Stanley K, van der Spuy G, Walzl G, et al. Identification of novel host biomarkers in plasma as candidates for the immunodiagnosis of tuberculosis disease and monitoring of tuberculosis treatment response. Oncotarget (2016) 7(36):57581–92. doi: 10.18632/oncotarget.11420
101. Cliff JM, Kaufmann SH, McShane H, van Helden P, O’Garra A. The human immune response to tuberculosis and its treatment: a view from the blood. Immunol Rev (2015) 264(1):88–102. doi: 10.1111/imr.12269
102. Scriba TJ, Mendelsohn SC. Headway made towards biosignatures for incipient tuberculosis. Lancet Respir Med (2020) 8(4):328–30. doi: 10.1016/S2213-2600(19)30355-8
103. Mendelsohn SC, Mbandi SK, Hatherill M, Scriba TJ. Blood transcriptional signatures for tuberculosis testing. Lancet Respir Med (2020) 8(4):330–1. doi: 10.1016/S2213-2600(20)30045-X
104. Blankley S, Berry MP, Graham CM, Bloom CI, Lipman M, O’Garra A. The application of transcriptional blood signatures to enhance our understanding of the host response to infection: the example of tuberculosis. Philos Trans R Soc Lond B Biol Sci (2014) 369(1645):20130427. doi: 10.1098/rstb.2013.0427
105. O’Garra A, Redford PS, McNab FW, Bloom CI, Wilkinson RJ, Berry MP. The immune response in tuberculosis. Annu Rev Immunol (2013) 31:475–527. doi: 10.1146/annurev-immunol-032712-095939
106. Berry MP, Blankley S, Graham CM, Bloom CI, O’Garra A. Systems approaches to studying the immune response in tuberculosis. Curr Opin Immunol (2013) 25(5):579–87. doi: 10.1016/j.coi.2013.08.003
107. Berry MP, Graham CM, McNab FW, Xu Z, Bloch SA, Oni T, et al. An interferon-inducible neutrophil-driven blood transcriptional signature in human tuberculosis. Nature (2010) 466(7309):973–7. doi: 10.1038/nature09247
108. Rajan JV, Semitala FC, Mehta T, Seielstad M, Montalvo L, Andama A, et al. A Novel, 5-Transcript, Whole-blood Gene-expression Signature for Tuberculosis Screening Among People Living With Human Immunodeficiency Virus. Clin Infect Dis (2019) 69(1):77–83. doi: 10.1093/cid/ciy835
109. Singhania A, Verma R, Graham CM, Lee J, Tran T, Richardson M, et al. A modular transcriptional signature identifies phenotypic heterogeneity of human tuberculosis infection. Nat Commun (2018) 9(1):2308. doi: 10.1038/s41467-018-04579-w
110. Leong S, Zhao Y, Joseph NM, Hochberg NS, Sarkar S, Pleskunas J, et al. Existing blood transcriptional classifiers accurately discriminate active tuberculosis from latent infection in individuals from south India. Tuberculosis (Edinb) (2018) 109:41–51. doi: 10.1016/j.tube.2018.01.002
111. Zak DE, Penn-Nicholson A, Scriba TJ, Thompson E, Suliman S, Amon LM, et al. A blood RNA signature for tuberculosis disease risk: a prospective cohort study. Lancet (2016) 387(10035):2312–22. doi: 10.1016/S0140-6736(15)01316-1
112. Blankley S, Graham CM, Turner J, Berry MP, Bloom CI, Xu Z, et al. The Transcriptional Signature of Active Tuberculosis Reflects Symptom Status in Extra-Pulmonary and Pulmonary Tuberculosis. PLoS One (2016) 11(10):e0162220. doi: 10.1371/journal.pone.0162220
113. Blankley S, Graham CM, Levin J, Turner J, Berry MP, Bloom CI, et al. A 380-gene meta-signature of active tuberculosis compared with healthy controls. Eur Respir J (2016) 47(6):1873–6. doi: 10.1183/13993003.02121-2015
114. Bloom CI, Graham CM, Berry MP, Rozakeas F, Redford PS, Wang Y, et al. Transcriptional blood signatures distinguish pulmonary tuberculosis, pulmonary sarcoidosis, pneumonias and lung cancers. PLoS One (2013) 8(8):e70630. doi: 10.1371/journal.pone.0070630
115. Penn-Nicholson A, Mbandi SK, Thompson E, Mendelsohn SC, Suliman S, Chegou NN, et al. RISK6, a 6-gene transcriptomic signature of TB disease risk, diagnosis and treatment response. Sci Rep (2020) 10(1):8629. doi: 10.1038/s41598-020-65043-8
116. Kwan PKW, Periaswamy B, De Sessions PF, Lin W, Molton JS, Naftalin CM, et al. A blood RNA transcript signature for TB exposure in household contacts. BMC Infect Dis (2020) 20(1):403. doi: 10.1186/s12879-020-05116-1
117. Jacobsen M, Repsilber D, Gutschmidt A, Neher A, Feldmann K, Mollenkopf HJ, et al. Candidate biomarkers for discrimination between infection and disease caused by Mycobacterium tuberculosis. J Mol Med (Berl) (2007) 85(6):613–21. doi: 10.1007/s00109-007-0157-6
118. Laux da Costa L, Delcroix M, Dalla Costa ER, Prestes IV, Milano M, Francis SS, et al. A real-time PCR signature to discriminate between tuberculosis and other pulmonary diseases. Tuberculosis (Edinb) (2015) 95(4):421–5. doi: 10.1016/j.tube.2015.04.008
119. Roe JK, Thomas N, Gil E, Best K, Tsaliki E, Morris-Jones S, et al. Blood transcriptomic diagnosis of pulmonary and extrapulmonary tuberculosis. JCI Insight (2016) 1(16):e87238. doi: 10.1172/jci.insight.87238
120. Sweeney TE, Braviak L, Tato CM, Khatri P. Genome-wide expression for diagnosis of pulmonary tuberculosis: a multicohort analysis. Lancet Respir Med (2016) 4(3):213–24. doi: 10.1016/S2213-2600(16)00048-5
121. Roe J, Venturini C, Gupta RK, Gurry C, Chain BM, Sun Y, et al. Blood Transcriptomic Stratification of Short-term Risk in Contacts of Tuberculosis. Clin Infect Dis (2020) 70(5):731–7. doi: 10.1093/cid/ciz252
122. Maertzdorf J, Repsilber D, Parida SK, Stanley K, Roberts T, Black G, et al. Human gene expression profiles of susceptibility and resistance in tuberculosis. Genes Immun (2011) 12(1):15–22. doi: 10.1038/gene.2010.51
123. Maertzdorf J, McEwen G, Weiner J,3, Tian S, Lader E, Schriek U, et al. Concise gene signature for point-of-care classification of tuberculosis. EMBO Mol Med (2016) 8(2):86–95. doi: 10.15252/emmm.201505790
124. Qian Z, Lv J, Kelly GT, Wang H, Zhang X, Gu W, et al. Expression of nuclear factor, erythroid 2-like 2-mediated genes differentiates tuberculosis. Tuberculosis (Edinb) (2016) 99:56–62. doi: 10.1016/j.tube.2016.04.008
125. Gjoen JE, Jenum S, Sivakumaran D, Mukherjee A, Macaden R, Kabra SK, et al. Novel transcriptional signatures for sputum-independent diagnostics of tuberculosis in children. Sci Rep (2017) 7(1):5839. doi: 10.1038/s41598-017-05057-x
126. Gliddon HD, Kaforou M, Alikian M, Habgood-Coote D, Zhou C, Oni T, et al. Identification of reduced host transcriptomic signatures for tuberculosis and digital PCR-based validation and quantification. bioRxiv (2019) 583674. doi: 10.1101/583674
127. Sambarey A, Devaprasad A, Mohan A, Ahmed A, Nayak S, Swaminathan S, et al. Unbiased Identification of Blood-based Biomarkers for Pulmonary Tuberculosis by Modeling and Mining Molecular Interaction Networks. EBioMedicine (2017) 15:112–26. doi: 10.1016/j.ebiom.2016.12.009
128. Sambarey A, Devaprasad A, Baloni P, Mishra M, Mohan A, Tyagi P, et al. Meta-analysis of host response networks identifies a common core in tuberculosis. NPJ Syst Biol Appl (2017) 3:4. doi: 10.1038/s41540-017-0005-4
129. Verhagen LM, Zomer A, Maes M, Villalba JA, Del Nogal B, Eleveld M, et al. A predictive signature gene set for discriminating active from latent tuberculosis in Warao Amerindian children. BMC Genomics (2013) 14:74. doi: 10.1186/1471-2164-14-74
130. de Araujo LS, Vaas LA, Ribeiro-Alves M, Geffers R, Mello FC, de Almeida AS, et al. Transcriptomic Biomarkers for Tuberculosis: Evaluation of DOCK9. EPHA4, and NPC2 mRNA Expression in Peripheral Blood. Front Microbiol (2016) 7:1586. doi: 10.3389/fmicb.2016.01586
131. Duffy D, Nemes E, Llibre A, Rouilly V, Musvosvi M, Smith N, et al. Immune profiling enables stratification of patients with active TB disease or M. tuberculosis infection. Clin Infect Dis (2020) ciaa1562. doi: 10.1093/cid/ciaa1562
132. Kaforou M, Wright VJ, Oni T, French N, Anderson ST, Bangani N, et al. Detection of tuberculosis in HIV-infected and -uninfected African adults using whole blood RNA expression signatures: a case-control study. PLoS Med (2013) 10(10):e1001538. doi: 10.1371/journal.pmed.1001538
133. Anderson ST, Kaforou M, Brent AJ, Wright VJ, Banwell CM, Chagaluka G, et al. Diagnosis of childhood tuberculosis and host RNA expression in Africa. N Engl J Med (2014) 370(18):1712–23. doi: 10.1056/NEJMoa1303657
134. Suliman S, Thompson E, Sutherland J, Weiner Rd J, Ota MOC, Shankar S, et al. Four-gene Pan-African Blood Signature Predicts Progression to Tuberculosis. Am J Respir Crit Care Med (2018) 197(9):1198–208. doi: 10.1164/rccm.201711-2340OC
135. Sutherland JS, Loxton AG, Haks MC, Kassa D, Ambrose L, Lee JS, et al. Differential gene expression of activating Fcgamma receptor classifies active tuberculosis regardless of human immunodeficiency virus status or ethnicity. Clin Microbiol Infect (2014) 20(4):O230–8. doi: 10.1111/1469-0691.12383
136. Estevez O, Anibarro L, Garet E, Pallares A, Barcia L, Calvino L, et al. An RNA-seq Based Machine Learning Approach Identifies Latent Tuberculosis Patients With an Active Tuberculosis Profile. Front Immunol (2020) 11:1470. doi: 10.3389/fimmu.2020.01470
137. Turner CT, Gupta RK, Tsaliki E, Roe JK, Mondal P, Nyawo GR, et al. Blood transcriptional biomarkers for active pulmonary tuberculosis in a high-burden setting: a prospective, observational, diagnostic accuracy study. Lancet Respir Med (2020) 8(4):407–19. doi: 10.1016/S2213-2600(19)30469-2
138. Leong S, Zhao Y, Ribeiro-Rodrigues R, Jones-López EC, Acuña-Villaorduña C, Rodrigues PM, et al. Cross-validation of existing signatures and derivation of a novel 29-gene transcriptomic signature predictive of progression to TB in a Brazilian cohort of household contacts of pulmonary TB. Tuberculosis (Edinb) (2020) 120:101898. doi: 10.1016/j.tube.2020.101898
139. Walter ND, Miller MA, Vasquez J, Weiner M, Chapman A, Engle M, et al. Blood Transcriptional Biomarkers for Active Tuberculosis among Patients in the United States: a Case-Control Study with Systematic Cross-Classifier Evaluation. J Clin Microbiol (2016) 54(2):274–82. doi: 10.1128/JCM.01990-15
140. World Health Organisation. High-priority target product profiles for new tuberculosis diagnostics: report of a consensus meeting. (2014). Available at: https://apps.who.int/iris/bitstream/handle/10665/135617/WHO_HTM_TB_2014.18_eng.pdf;jsessionid=66D7C7B71A2F6506FF0DFDFF9F671CC8?sequence=1.
141. Javed S, Marsay L, Wareham A, Lewandowski KS, Williams A, Dennis MJ, et al. Temporal Expression of Peripheral Blood Leukocyte Biomarkers in a Macaca fascicularis Infection Model of Tuberculosis; Comparison with Human Datasets and Analysis with Parametric/Non-parametric Tools for Improved Diagnostic Biomarker Identification. PLoS One (2016) 11(5):e0154320. doi: 10.1371/journal.pone.0154320
142. Foreman TW, Mehra S, Lackner AA, Kaushal D. Translational Research in the Nonhuman Primate Model of Tuberculosis. ILAR J (2017) 58(2):151–9. doi: 10.1093/ilar/ilx015
143. Pena JC, Ho WZ. Non-Human Primate Models of Tuberculosis. Microbiol Spectr (2016) 4(4):TBTB2-0007-2016. doi: 10.1128/microbiolspec.TBTB2-0007-2016
144. Darrah PA, Zeppa JJ, Maiello P, Hackney JA, Wadsworth MH 2nd, Hughes TK, et al. Prevention of tuberculosis in macaques after intravenous BCG immunization. Nature (2020) 577(7788):95–102. doi: 10.1038/s41586-019-1817-8
145. Dijkman K, Sombroek CC, Vervenne RAW, Hofman SO, Boot C, Remarque EJ, et al. Prevention of tuberculosis infection and disease by local BCG in repeatedly exposed rhesus macaques. Nat Med (2019) 25(2):255–62. doi: 10.1038/s41591-018-0319-9
146. Harris SA, White A, Stockdale L, Tanner R, Sibley L, Sarfas C, et al. Development of a non-human primate BCG infection model for the evaluation of candidate tuberculosis vaccines. Tuberculosis (Edinb) (2018) 108:99–105. doi: 10.1016/j.tube.2017.11.006
147. Singhania A, Graham CM, Gabryšová L, Moreira-Teixeira L, Stavropoulos E, Pitt JM, et al. Transcriptional profiling unveils type I and II interferon networks in blood and tissues across diseases. Nat Commun (2019) 10(1):2887. doi: 10.1038/s41467-019-10601-6
148. Moreira-Teixeira L, Mayer-Barber K, Sher A, O’Garra A. Type I interferons in tuberculosis: Foe and occasionally friend. J Exp Med (2018) 215(5):1273–85. doi: 10.1084/jem.20180325
149. Michalska A, Blaszczyk K, Wesoly J, Bluyssen HAR. A Positive Feedback Amplifier Circuit That Regulates Interferon (IFN)-Stimulated Gene Expression and Controls Type I and Type II IFN Responses. Front Immunol (2018) 9:1135. doi: 10.3389/fimmu.2018.01135
150. Donovan ML, Schultz TE, Duke TJ, Blumenthal A. Type I Interferons in the Pathogenesis of Tuberculosis: Molecular Drivers and Immunological Consequences. Front Immunol (2017) 8:1633. doi: 10.3389/fimmu.2017.01633
151. McNab F, Mayer-Barber K, Sher A, Wack A, O’Garra A. Type I interferons in infectious disease. Nat Rev Immunol (2015) 15(2):87–103. doi: 10.1038/nri3787
152. Togun TO, MacLean E, Kampmann B, Pai M. Biomarkers for diagnosis of childhood tuberculosis: A systematic review. PLoS One (2018) 13(9):e0204029. doi: 10.1371/journal.pone.0204029
153. Togun T, Pai M. The uncertain science of predicting tuberculosis. Lancet Respir Med (2017) 5(4):239–40. doi: 10.1016/S2213-2600(17)30059-0
154. Yerlikaya S, Broger T, MacLean E, Pai M, Denkinger CM. A tuberculosis biomarker database: the key to novel TB diagnostics. Int J Infect Dis (2017) 56:253–7. doi: 10.1016/j.ijid.2017.01.025
155. Fiore-Gartland A, Carpp LN, Naidoo K, Thompson E, Zak DE, Self S, et al. Considerations for biomarker-targeted intervention strategies for tuberculosis disease prevention. Tuberculosis (Edinb) (2018) 109:61–8. doi: 10.1016/j.tube.2017.11.009
156. Pai M, Nicol MP, Boehme CC. Tuberculosis Diagnostics: State of the Art and Future Directions. Microbiol Spectr (2016) 4(5):TBTB2-0019-2016. doi: 10.1128/microbiolspec.TBTB2-0019-2016
157. UNITAID. TUBERCULOSIS: Diagnostics Technology Landscape, 5th Edition. Unitaid (2017) Available at: https://unitaid.org/assets/2017-Unitaid-TB-Diagnostics-Technology-Landscape.pdf.
Keywords: tuberculosis, biomarker, qPCR, validation, diagnosis, immune
Citation: Perumal P, Abdullatif MB, Garlant HN, Honeyborne I, Lipman M, McHugh TD, Southern J, Breen R, Santis G, Ellappan K, Kumar SV, Belgode H, Abubakar I, Sinha S, Vasan SS, Joseph N and Kempsell KE (2021) Validation of Differentially Expressed Immune Biomarkers in Latent and Active Tuberculosis by Real-Time PCR. Front. Immunol. 11:612564. doi: 10.3389/fimmu.2020.612564
Received: 30 September 2020; Accepted: 23 December 2020;
Published: 16 March 2021.
Edited by:
Adam Penn-Nicholson, Foundation for Innovative New Diagnostics, SwitzerlandReviewed by:
Andre G. Loxton, South African Medical Research Council, South AfricaHazel Marguerite Dockrell, University of London, United Kingdom
Copyright © 2021 Perumal, Abdullatif, Garlant, Honeyborne, Lipman, McHugh, Southern, Breen, Santis, Ellappan, Kumar, Belgode, Abubakar, Sinha, Vasan, Joseph and Kempsell. This is an open-access article distributed under the terms of the Creative Commons Attribution License (CC BY). The use, distribution or reproduction in other forums is permitted, provided the original author(s) and the copyright owner(s) are credited and that the original publication in this journal is cited, in accordance with accepted academic practice. No use, distribution or reproduction is permitted which does not comply with these terms.
*Correspondence: Karen E. Kempsell, S2FyZW4uS2VtcHNlbGxAcGhlLmdvdi51aw==