 Marta Riba1,2,3†
 Elisabet Augé1,2,3†
 Iraida Tena1
 Jaume del Valle1,2,3
 Laura Molina-Porcel4,5
 Teresa Ximelis4,5
 Jordi Vilaplana1,2,3*‡
 Carme Pelegrí1,2,3‡
- 1Secció de Fisiologia, Departament de Bioquímica i Fisiologia, Universitat de Barcelona, Barcelona, Spain
- 2Institut de Neurociències, Universitat de Barcelona, Barcelona, Spain
- 3Centros de Biomedicina en Red de Enfermedades Neurodegenerativas (CIBERNED), Madrid, Spain
- 4Alzheimer’s Disease and Other Cognitive Disorders Unit, Neurology Service, Hospital Clínic, Institut d’Investigacions Biomèdiques August Pi i Sunyer (IDIBAPS), Universitat de Barcelona, Barcelona, Spain
- 5Neurological Tissue Bank, Biobanc-Hospital Clínic-IDIBAPS, Barcelona, Spain
Corpora amylacea (CA) in the human brain are polyglucosan bodies that accumulate residual substances originated from aging and both neurodegenerative and infectious processes. These structures, which act as waste containers, are released from the brain to the cerebrospinal fluid, reach the cervical lymph nodes via the meningeal lymphatic system and may be phagocytosed by macrophages. Recent studies indicate that CA present certain neoepitopes (NEs) that can be recognized by natural antibodies of the IgM class, and although evidence of different kinds suggests that these NEs may be formed by carbohydrate structures, their precise nature is unknown. Here, we adapted standard techniques to examine this question. We observed that the preadsorption of IgMs with specific carbohydrates has inhibitory effects on the interaction between IgMs and CA, and found that the digestion of CA proteins had no effect on this interaction. These findings point to the carbohydrate nature of the NEs located in CA. Moreover, the present study indicates that, in vitro, the binding between certain natural IgMs and certain epitopes may be disrupted by certain monosaccharides. We wonder, therefore, whether these inhibitions may also occur in vivo. Further studies should now be carried out to assess the possible in vivo effect of glycemia on the reactivity of natural IgMs and, by extension, on natural immunity.
Introduction
Corpora amylacea (CA) in the human brain are polyglucosan aggregates that were first described by J.E. Purkinje in 1837 (1). They are intracellular astrocytic bodies that accumulate mainly in the periventricular and subpial regions of the aged brain (2–4), but are also present in large numbers in specific areas of the brain in neurodegenerative conditions (5–8). Different studies postulate that the function of CA is to entrap residual products derived from aging or degenerative processes (2, 4, 9–12). Accordingly, while essentially constituted of polymerized hexoses (2, 3), with glucose the predominant one (3), a wide range of components have been attributed to CA. These products are mainly derived from neurons, astrocytes, oligodendrocytes or the blood (8, 12–17), or even related to viral, fungal or microbial infections (18–20). However, the presence of some of these components remain controversial (10, 21). In 2017, we reported that some positive immunostainings described in CA may have been induced by contaminant immunoglobulins M (IgMs) present in commercial antibodies, giving rise to false positive results (10). Later, in 2018, we reviewed and ruled out some of the components that have been reported to occur in CA. We observed that CA contain glycogen synthase (GS), which is presumed to take part in the formation of the polyglucosan structure, as well as ubiquitin and p62 proteins, which are both involved in the processing of waste products (21). Recently, an immunofluorescence study, which excluded the possible false positive staining caused by IgMs, reported that CA contain tau protein (22). The possible role of CA in trapping residual products is also supported by electron microscopy studies, which have described some cell debris inside the CA, including impaired mitochondria and lysosome-like vesicles, originating from degenerative processes (9, 12, 23). Moreover, we recently revealed that CA are released from the brain into the cerebrospinal fluid (CSF), reaching the cervical lymph nodes via the meningeal lymphatic system, and we observed that CA can be phagocytosed by macrophages in vitro. All these findings indicate that CA can act as containers that remove waste products from the brain (24).
CA share some features with a type of polyglucosan bodies, referred to as PAS granules, which appear in the mouse brain. Both, PAS granules and CA, are round or oval shaped and have a high polysaccharide content, and therefore become positively stained with periodic acid-Schiff (PAS). Both structures are age-related deposits that entrap residual products and present some neoantigens, or more specifically neoepitopes (NEs), which can be recognized by natural antibodies of the IgM isotype (9, 10, 21, 24–30). NEs are epitopes that originate de novo in physiological conditions and also in pathological situations such as ischemia, diabetes, atherosclerosis, cancer and inflammatory events, as well as in aging (31–35). For its part, natural antibodies are generated throughout a lifetime, even during fetal development and before external antigen exposure (36–39). Their repertoire and reactivity pattern have been determined throughout evolution and are remarkably stable within species and even between species (40, 41), explaining their presence as contaminants in a wide range of commercial antibodies. They constitute a first line of immune defense, but also have important functions in the physiology of the organism (42). Some of these natural antibodies are able to recognize the NEs that occur in, for example, cell remnants and senescent or apoptotic cells, taking part in their controlled elimination and, thus, contributing to the maintenance of tissue homeostasis (31, 37, 38, 41–45). Therefore, the presence of NEs in both CA and PAS granules and the existence of natural IgMs that target them reinforce the idea that CA and PAS granules are involved in brain cleaning or in protective processes.
The nature of the NEs present in CA and recognized by natural IgMs remains unknown but several observations suggest that they can be of a carbohydrate nature. For instance, the NEs contained in PAS granules of the mouse brain, recognized by natural IgMs, have a carbohydrate nature (27, 30). In addition, natural IgM antibodies have been described to recognize some carbohydrates, such as advanced glycation end products, whose production is increased with aging (37, 44–48). In fact, many α-glycan antibodies present in human sera belong to the IgM class and are natural antibodies (49). In any case, IgMs often recognize epitopes that act as markers of own residual structures (42) and, as mentioned previously, CA contain some of these residual structures. Therefore, it seemed appropriate to explore whether the NEs of CA do have a carbohydrate nature. However, it has to be taken into account that in living beings glycans show great complexity, greater than that of proteins, nucleic acids and lipids, and currently there are few or at least insufficient tools to study glycans with the same ease and precision as that associated with the study of proteins (50). Thus, in this first attempt we adapted standard techniques to determine the nature of NEs of CA.
Two different approaches were used. First, IgM preadsorptions with increasing concentrations of specific carbohydrates were performed to ascertain if the preadsorption produced a partial or total inhibition of CA staining with the IgMs. As a control, the same preadsorption studies were undertaken by staining the CA with concanavalin A (ConA). ConA staining of CA has been previously described in the literature (24, 51). ConA is a plant lectin that binds to hexoses in which the d-pyranose ring system presents hydroxyl groups at C-3 and C-4 in the equatorial plane, as well as a hydroxyl group at C-6. These types of hexoses include d-mannose (Man) and d-glucose (Glc), but not d-galactose (Gal), in which the hydroxyl group at C-4 is in the axial plane. ConA also binds to certain sugars with a five-membered furanoid ring form, such as ketohexose d-fructose, in which the hydroxyl groups at C-3, C4 and C-6 are oriented similarly to those in the mannopyranosyl ring, and aldopentose d-arabinose, in which the hydroxyl groups at C-2, C-3 and C-5 show a similar orientation (52–54). Thus, if carbohydrate preadsorption works well, CA staining with fluorochrome-labeled ConA will be blocked by Glc, Man, d-fructose (Fru) and N-acetyl-d-glucosamine (GlcNAc), but not by Gal or N-acetyl-d-galactosamine (GalNAc). Another control of the preadsorption with sugars was based on the staining of CA with an α-p62 antibody. As p62 is a protein, the preadsorption of the α-p62 antibody with the different sugars should not interfere with the staining of CA. This control was used to demonstrate that the preadsorption with the sugars did not block the antibodies directed against the proteins in the CA.
The second approach to study the interaction of the IgMs with CA involved staining the CA after digestion with the peptidic enzyme pepsin. If IgM recognizes glycosides that are not linked to proteins, the staining should be maintained after the digestion. As control experiments, AF555 NHS ester probe, α-p62 antibody and fluorescein-labeled ConA were used to stain CA. The AF555 NHS ester probe labels primary amines (R-NH2) of proteins, amine-modified oligonucleotides, and other amine-containing molecules. On the one hand, since AF555 NHS ester probe and α-p62 bind to proteins, pepsin digestion might prevent the staining of CA with them; on the other hand, the staining with ConA should not be affected since ConA binds to carbohydrate structures.
Material and Methods
Preadsorption Studies
Human Brain Samples
Post-mortem brain samples were obtained from the Banc de Teixits Neurològics (Biobanc-Hospital Clínic-IDIBAPS, Barcelona). Frozen hippocampal sections (6 µm-thick; stored at -80°C) were obtained from three cases of neuropathologically confirmed Alzheimer’s disease, two cases of subcortical vascular encephalopathy and one case of Lewy body dementia. Medical data of these cases are detailed in Table S1 (Supplementary Material). All procedures involving human samples were performed in accordance with appropriate guidelines and regulations. All experiments involving human tissue were approved by the Bioethical Committee of the Universitat de Barcelona.
Immunofluorescence and ConA Staining
Frozen hippocampal sections were air dried for 10 min and then fixed with acetone for 10 min at 4°C. After 2 h of drying, sections were rehydrated in phosphate-buffered saline (PBS) and then blocked and permeabilized with 1% bovine serum albumin in PBS (Sigma-Aldrich) (blocking buffer, BB) with 0.1% Triton X-100 (Sigma-Aldrich) for 20 min. They were then washed with PBS and incubated with the primary antibody overnight at 4°C. The slides were then washed and incubated for 1 h at room temperature with the secondary antibody. Nuclear staining was performed with Hoechst (2 μg/mL, H-33258, Fluka, Madrid, Spain) and the slides were washed and coverslipped with Fluoromount (Electron Microscopy Sciences, Hatfeld, PA, USA). Staining controls were performed by incubating with BB instead of the primary antibody before incubation with the secondary antibody.
The following were used as primary antibodies: mouse monoclonal IgG2a against p62 (diluted 1:200; Abcam, ab56416), human IgMs purified from myeloma serum (MS-IgMs) (1:10; AbD Serotec, OBT1524) and human IgMs purified from normal serum (NS-IgMs) (1:25; Sigma, I8260). Previous studies indicated that both pools of IgMs contain IgMs that bind to CA. The following were used as the secondary antibodies: Alexa Fluor (AF) 488 goat α-mouse IgG2a (1:250; Life Technologies, A-21131) and AF488 goat α-human IgM (heavy chain) (1:200; Life Technologies, A-21215).
In some of the experiments, samples were incubated overnight with fluorescein-labeled ConA (1:250; Vector Laboratories) instead of the primary antibody and, as incubation with the secondary antibody was not needed, the slides were immediately washed and coverslipped with Fluoromount.
Preadsorption With Carbohydrates
Primary antibodies and ConA were preadsorbed in different assays with the monosaccharides Glc (Scharlab, GL01271000), Man (Sigma Aldrich, M2D69), Fru (Sigma Aldrich, F0127), Gal (Sigma Aldrich, G0750), GlcNAc (Sigma Aldrich, A8625) and GalNAc (Sigma Aldrich, A2795). For each monosaccharide, we first prepared sugar dilutions of 0 (control), 50, 100, 200 and 400 mM in PBS, as well as 800 mM in some of the indicated cases. The preadsorption was then performed by using these sugar solutions to dilute the primary antibodies or ConA at the indicated concentrations, and the mixtures were maintained overnight at 4°C with agitation. The different hippocampal sections were incubated with each mixture instead of the primary antibody. Some preadsorption series of different sugars were performed at the same time and the 0 mM tissue section was shared. Thus, these series show the same fluorescence values and images at 0 mM. To reduce variability, consecutive hippocampal sections were used in each assay, i.e., in the study of the preadsorption of an antibody (or ConA) with a determinate sugar.
Image Acquisition
Images were captured with a fluorescence laser and optical microscope (BX41, Olympus, Germany) and saved in tiff format. All the images for each combination of antibody (or ConA) and sugar were taken using the same microscope, laser and software settings. The time of capture was adapted to each staining, but the control or reference images were acquired with the same time of capture as that of the respective set of images.
Image Processing and Fluorescence Intensity Measurements
The merging of the images from the different fluorescence channels was performed using the FIJI program (National Institutes of Health, USA). Image analysis and quantifications were also performed with the FIJI program, not using the composite image, but the original image in the appropriate color. All CA of each hippocampal section were analyzed. The degree of staining of each CA was quantified as described below. For each CA, we first defined the region of interest (ROI) manually by tracing the outline of the CA using the elliptical selection tool of the FIJI program. We then obtained the mean gray value of the ROI, which corresponded to the mean fluorescence intensity (in arbitrary units) of the outlined CA. To minimize possible differences in the basal intensity of each image, for each CA, we moved the ROI to an area next to the CA and obtained the mean fluorescence intensity of the background. Thereafter, we obtained the relative intensity (RI) for each CA, which was defined as the difference between the mean fluorescence intensity of the CA and the mean fluorescence intensity of the respective background. To standardize the data obtained from the different preadsorption studies, for each combination of antibody and sugar, we defined the mean value of all the RIs obtained with 0 mM of the monosaccharide as the reference value (RV). The intensity of each CA was expressed as a percentage with respect to the reference value (RI%), i.e., 100*RI/RV. It should be noted that in all the cases, the mean RI% value will be 100% for 0 mM. If the carbohydrate preadsorption interferes with the CA staining, this percentage will decrease with increasing carbohydrate concentrations. The original data of the fluorescence intensities of the CA and their corresponding backgrounds are included in the Supplementary Materials.
Statistical Analysis
Statistical analysis was performed with the ANOVA module of SPSS Statistics (IBM). For each study, to determine if the sugar concentration influences the RI%, the variable sugar concentration has been defined as the independent variable and the RI% variable as the dependent one. When the ANOVA indicates that the variable sugar concentration influences the RI%, the Scheffe test was used for post hoc comparisons in order to compare the values obtained at each sugar concentration to the values obtained at 0 mM. Differences were considered significant when p < 0.01. However, as commented in the Editorial of Nature dated 20th March 2019 (55), using only p values to determine significance can also lead to some analyses being biased, some false positives being overhyped and some genuine effects being overlooked. Logic, background knowledge and experimental design should be considered alongside p values and similar metrics to reach a conclusion and decide on its certainty. Accordingly, in the present study, p values were used alongside other findings to reach conclusions based on a general view.
Digestion Studies
Human CSF Samples Used to Obtain CA
Post-mortem ventricular CSF samples were obtained from three cases of neuropathologically affected patients and one non-neuropathologically affected patient. When extracted, the CSF samples were centrifuged at 4,000 g at 4°C for 10 min and the pellets obtained were stored at -80°C until use. All these procedures were performed at the Banc de Teixits Neurològics (Biobanc-Hospital Clínic-IDIBAPS, Barcelona). Medical data about these cases are detailed in Table S2 (Supplementary Material).
CA Extraction and Pepsin Digestion
CSF pellets were re-suspended in PBS and filtered through a 35-µm porous filter (Fisher Scientific, 12934257). The samples were then centrifuged at 700 g for 10 min. The supernatants were then rejected and pellets were re-suspended in PBS to obtain 500-µL aliquots. Another centrifugation at 700 g for 10 min was performed, and the pellet was re-suspended in 500 μL of a solution of 4 mg/mL of pepsin (Merck, P6887) in 10 mM HCl (pH 2).The suspension was maintained under agitation overnight at 37°C. Control experiments were performed by incubating the samples overnight with PBS instead of the pepsin solution.
Immunofluorescence, AF555 NHS Ester Staining, and ConA Staining
After pepsin digestion, samples were washed 3 times by centrifugation at 700 g for 10 min and the pellet was re-suspended in 1,000 μL of PBS. The samples were then incubated with the primary antibody overnight at 4°C. Thereafter, samples were washed 3 times by centrifugation and incubated for 1 h at room temperature with the secondary antibody. Samples were then washed twice and centrifuged again at 700 g for 10 min to obtain pellets that were then re-suspended in 40 μL of PBS. These 40-μL samples were spread on to slides, air dried and coverslipped with Fluoromount. Staining controls were performed by incubating with PBS instead of the primary antibody.
The following were used as the primary antibodies: mouse monoclonal IgG2a against p62 (diluted 1:200; Abcam, ab56416) and NS-IgMs (1:25; Sigma, I8260). The following were used as the secondary antibodies: AF555 goat α-mouse IgG2a (1:250; Life Technologies, A-21131) and AF488 goat α-human IgM (heavy chain) (1:200; Life Technologies, A-21215).
In some of the immunofluorescence experiments, samples were incubated with fluorescein-labeled ConA (1:250; Vector Laboratories, FL-1001-25) overnight or with AF555 NHS ester probe (1 mg/mL; ThermoFisher Scientific, A37571) 1h at room temperature with agitation, instead of the primary antibodies.
In some cases, sequential double staining was performed with the α-p62 antibody and ConA and with the α-p62 antibody and NS-IgMs. The α-p62 antibody and ConA double staining was carried out in the same way as the simple immunofluorescence procedure, but adding an overnight incubation at 4°C with ConA after the incubation with the secondary antibody. Regarding the α-p62 antibody and NS-IgM double immunostaining, the samples were incubated with the α-p62 antibody overnight at 4°C first and then with NS-IgMs overnight at 4°C, before being incubated with the secondary antibodies simultaneously for 1 h at room temperature.
Image Acquisition and Processing
Image acquisition and processing were performed as described above for the sugar preadsorption studies.
Results
Sugar Preadsorption Studies
Effects of Sugar Preadsorption on ConA Staining of CA
As mentioned before, it is well established that ConA binds to CA and that fluorochrome-labeled ConA can be used to stain CA (24, 51). Thus, we performed the preadsorption studies with the different sugars using fluorochrome-labeled ConA. As shown in the upper row of Figure 1, preadsorption with glucose interfered with the staining. While ConA staining of the CA can be clearly observed when the Glc concentration is 0 mM (i.e., positive control), the staining is practically absent in the presence of glucose at all the tested concentrations. The same pattern was observed when the preadsorption was performed with Man, Fru or GlcNAc. However, when the preadsorption was performed with Gal or GalNAc, the staining with ConA was maintained, even at the highest concentration of sugar.
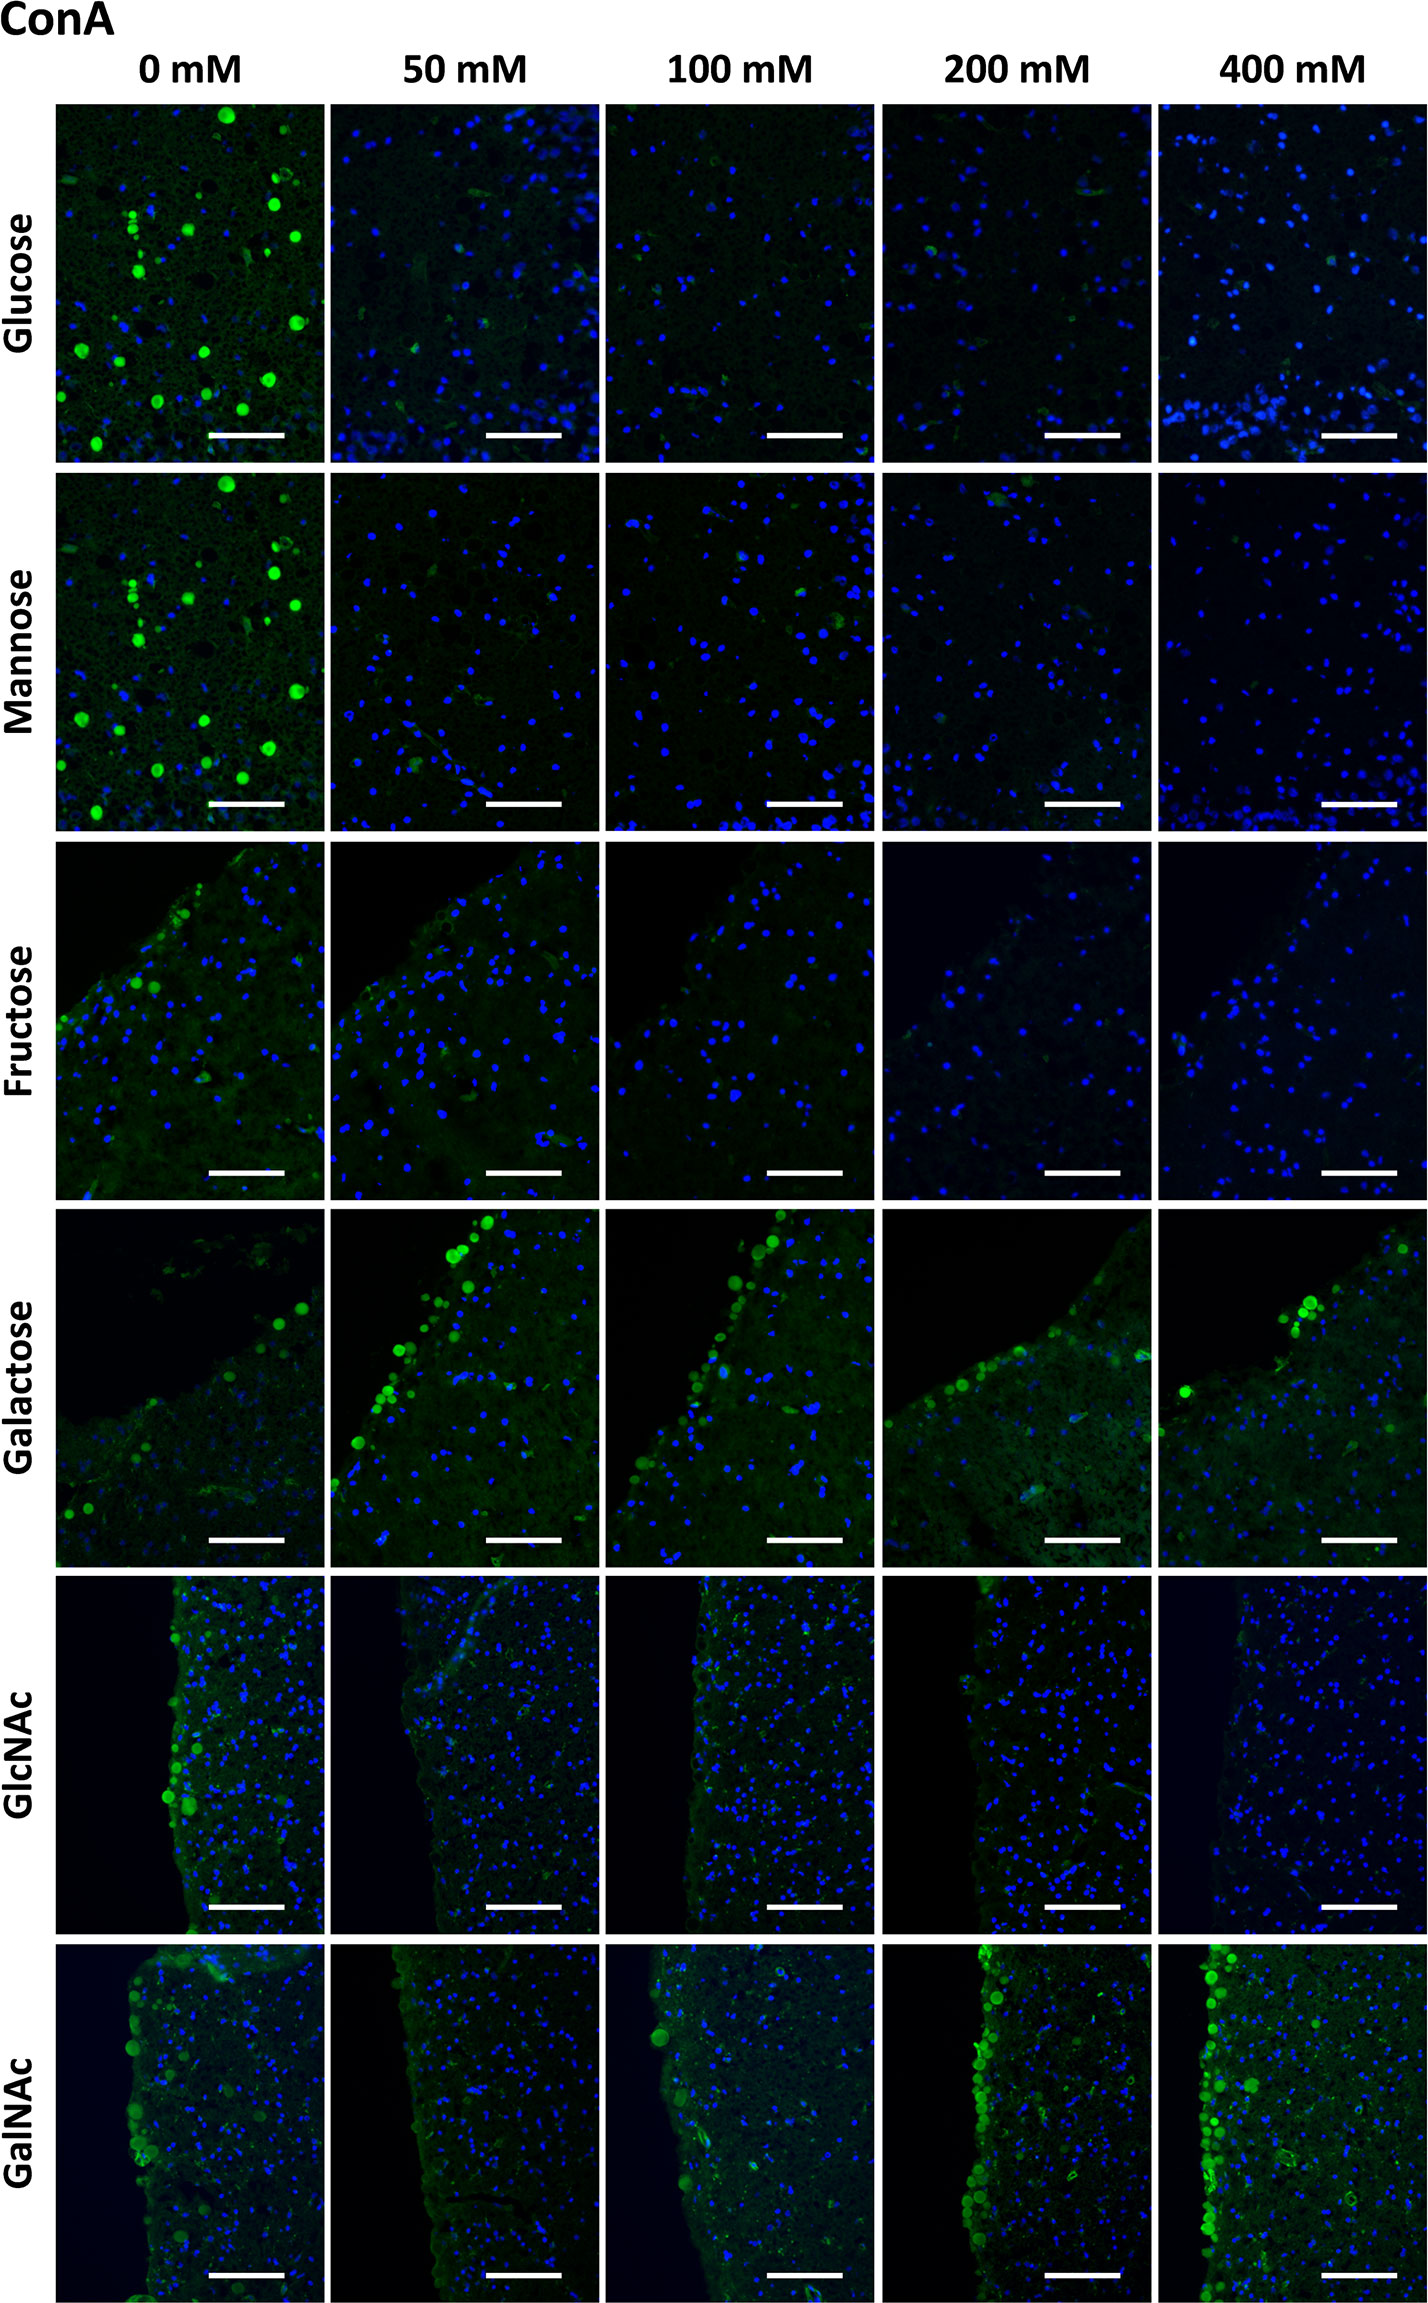
Figure 1 Representative images of hippocampal sections stained with ConA (green) and Hoechst (blue). Each row corresponds to a preadsorption study performed with the indicated carbohydrate. Sugar concentrations are indicated above. The staining of CA (green) disappeared or decreased when the preadsorption was performed with Glc, Man, Fru or GlcNAc, but was not affected by Gal or GalNAc. Some discrepancies in the basal staining can be appreciated between the different preadsorption experiments (see, for example, the first column corresponding to the positive controls); for the statistical analysis, these discrepancies have been corrected in basis of the background intensity, as indicated in the Methods section. Scale bar: 100 μm.
Table 1 presents the mean RI% values for each carbohydrate experiment and each carbohydrate concentration. This table contains the summary of all the results of the section to allow and facilitate the comparison between them. As can be observed, in the case of ConA staining, statistical analysis of the data from the Glc experiments indicated that the RI% decreased with the preadsorption, being significantly lower than 100% for all the tested concentrations (p < 0.01), i.e., lower than that of the reference value at 0 mM. This indicates that Glc significantly interfered with the ConA staining of CA. For Man, Fru and GlcNAc, there was also a significant decrease in the staining with increasing sugar concentrations. This was not the case for Gal and GalNAc, which did not reduce the staining. There were no significant differences with respect to their controls, except for GalNAc at 800 mM, which resulted in a mean RI% of 168.49 that was higher than the value at 0 mM. This was considered an outlier because of the absence of any clear trend at the other concentrations (see below). In any case, GalNAc did not decrease the staining when used to preadsorb ConA.
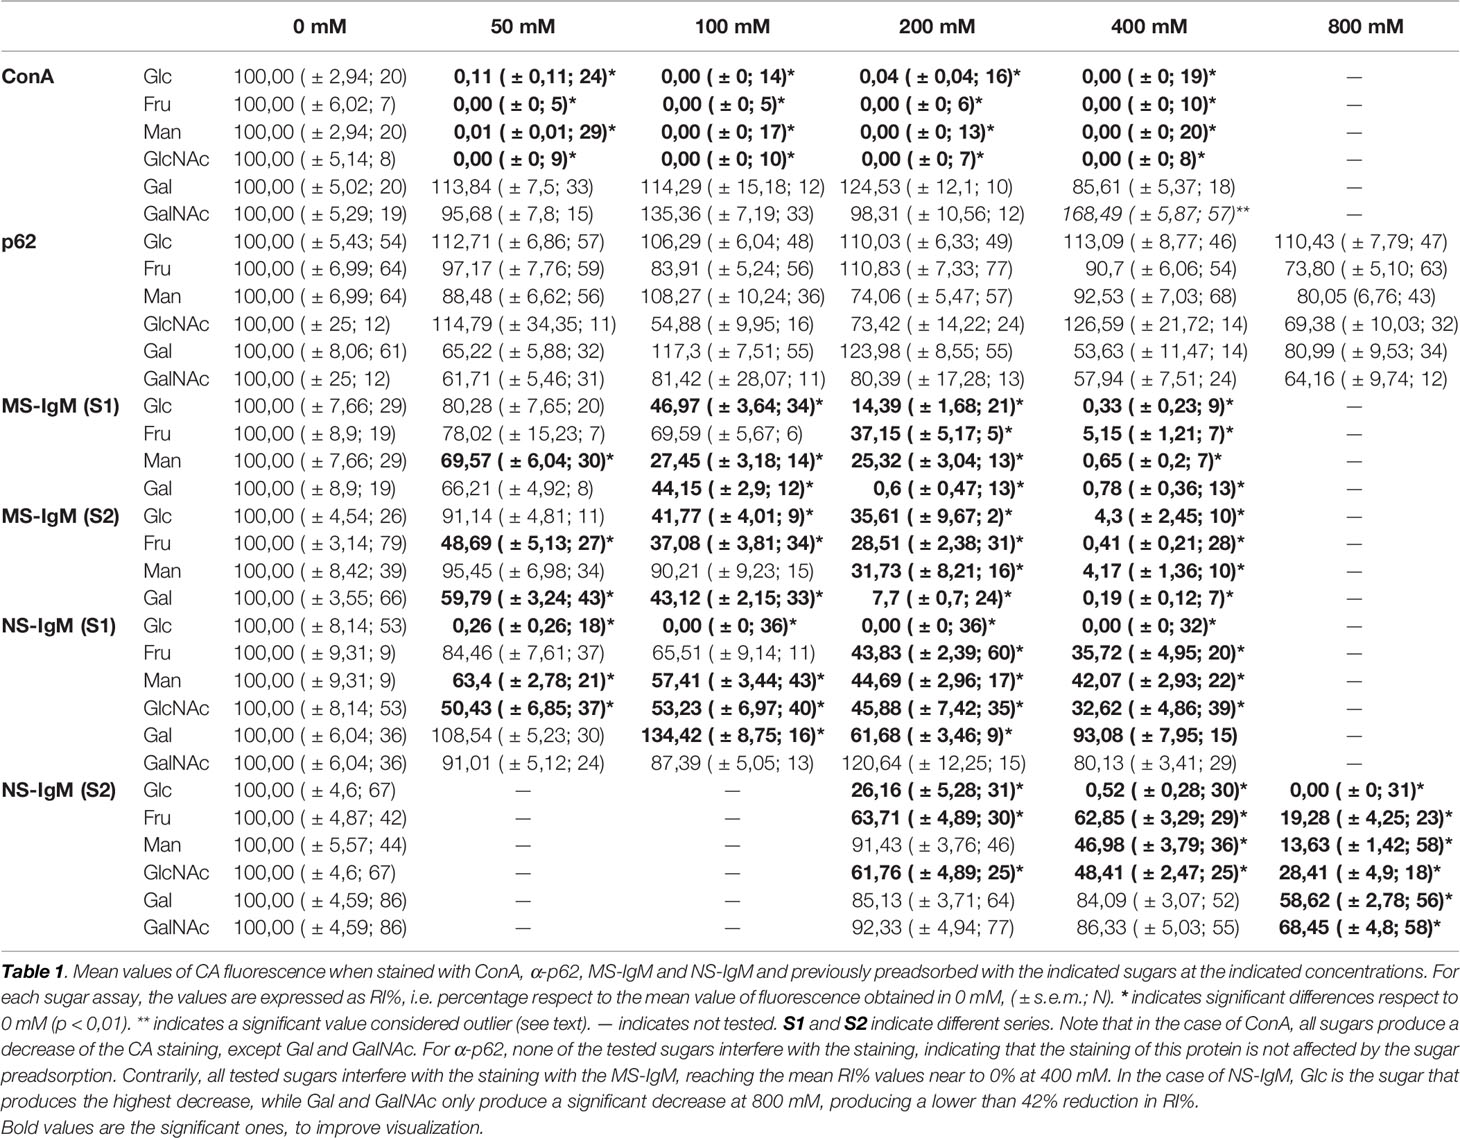
Table 1 Fluorescence intensity of CA staining expressed as mean RI% (± s.e.m.; N).
Figure 7A presents a graphical view of these data, showing the different dynamics for Gal and GalNAc with respect to the other sugars. These results were expected according to the carbohydrate-binding domain of ConA, indicating that sugar preadsorption could be an optimal method for studying the nature of the interaction. This figure contains the summary of all the results of the section, and is located at the end of the section.
Effects of Sugar Preadsorption on α-p62 Staining of CA
Before using the preadsorption with sugars to study the interaction between IgMs and CA, we applied the preadsorption method to analyze the interaction between the α-p62 antibody and CA. As the α-p62 antibody stains the protein p62, it was expected that preadsorption with the different sugars would not interfere with this immunostaining and, thus, α-p62 antibody staining would be used as a negative control to validate the sugar preadsorption method.
Figure 2 shows representative images of CA stained with the α-p62 antibody, previously preadsorbed with Glc, Man, Fru, Gal, GlcNAc and GalNAc at different concentrations ranging from 0 mM to 800 mM. As can be observed, the staining was maintained at all the sugar concentrations tested, indicating that the presence of the different sugars did not affect the α-p62 antibody staining.
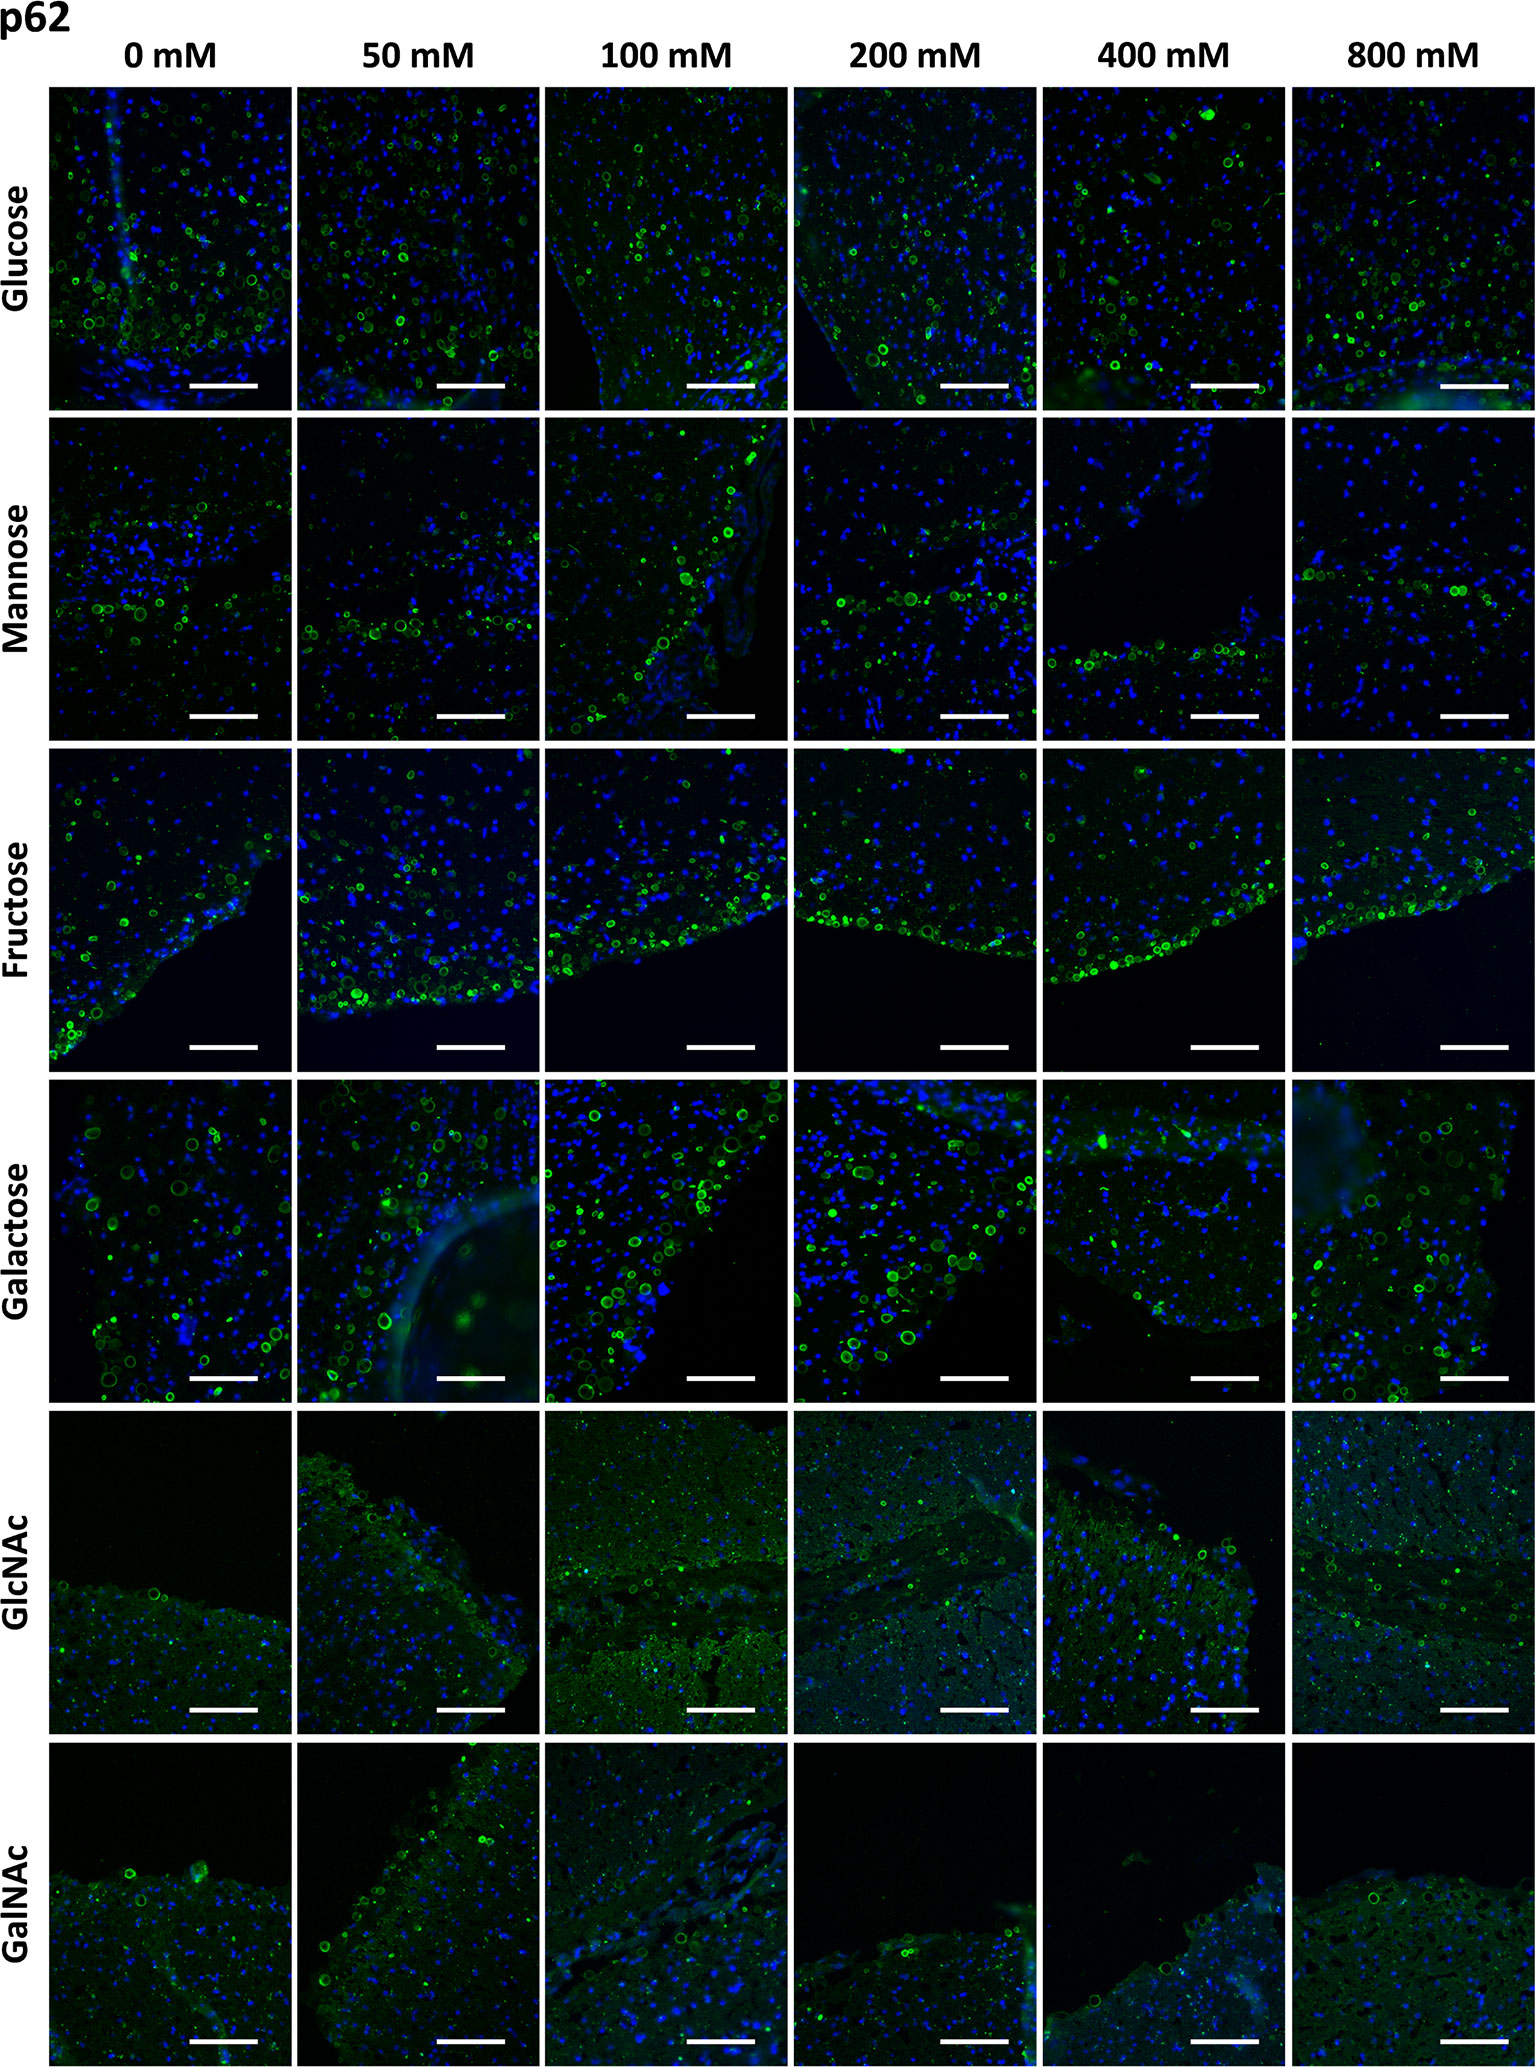
Figure 2 Representative images of hippocampal sections stained with the α-p62 antibody (green) and Hoechst (blue). Each row corresponds to a preadsorption study performed with the indicated carbohydrate. Sugar concentrations are indicated above. The staining of CA (green) is always present for all the sugars tested and at all the sugar concentrations. Scale bar: 100 μm.
Table 1 presents the mean RI% values obtained from the different p62 assays. The values ranged from 53.63% to 127%, with no significant differences compared to the values obtained at 0 mM (p < 0.01 in all cases). Moreover, the graphical view of these data (Figure 7B) shows no downward trends in relation to the sugar concentration for any of the four sugars tested.
Effects of Sugar Preadsorption on IgMs Staining of CA
As the preadsorption method used was reliable in describing the sugar-based interaction between ConA and CA and given that the staining of CA with antibodies directed against proteins was not affected by the sugar preadsorption, we applied the preadsorption method to analyze if sugars interfered with the interaction between IgMs and CA. We used two different sources of IgMs: those obtained from myeloma serum (MS-IgMs) and those obtained from normal human serum (NS-IgMs).
In the case of MS-IgMs, we tested the preadsorption of IgMs with Glc, Gal, Fru and Man at concentrations ranging from 0 mM to 400 mM. As it was necessary to replicate the assay with the NS-IgMs (see below), the experiment with MS-IgMs was also replicated in order to analyze the robustness of the results. Thus, the preadsorption of MS-IgMs included two series, S1 and S2.
Figures 3 and 4 show representative images of the staining of CA with MS-IgMs for each sugar at each concentration, corresponding to S1 and S2, respectively. In the absence of sugars, i.e. the positive controls of the staining, the staining of CA can be appreciated. When increasing the sugar concentration, the staining becomes weaker or even disappears.
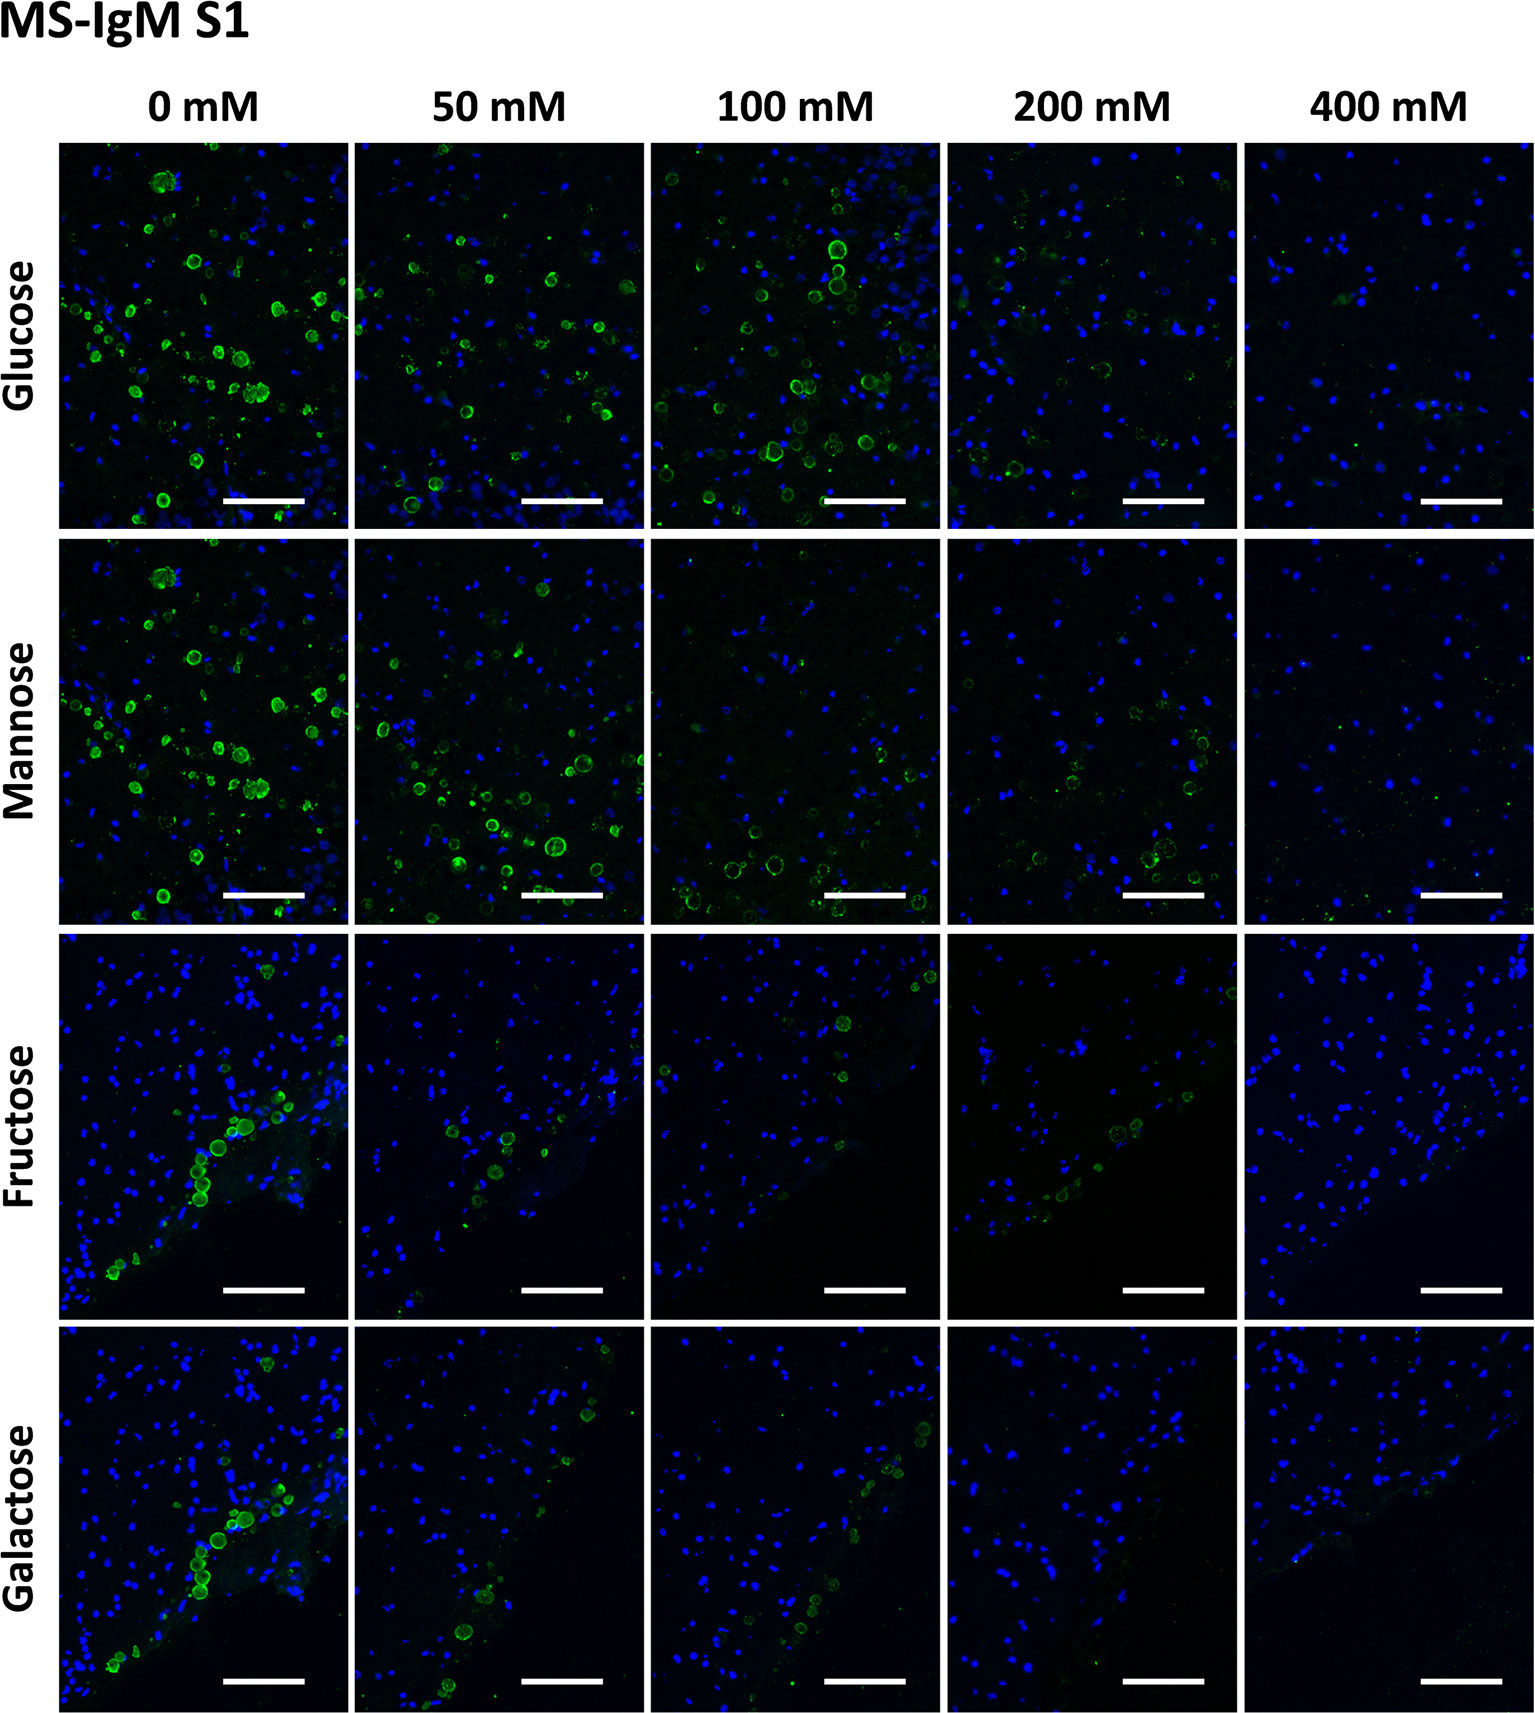
Figure 3 Representative images of hippocampal sections stained with MS-IgMs and Hoechst (blue) obtained in the first series (S1). Each row corresponds to a preadsorption study performed with the indicated carbohydrate. Sugar concentrations are indicated above. Note that the staining of CA becomes weaker with increasing sugar concentrations and even disappears. Scale bar: 100 μm.
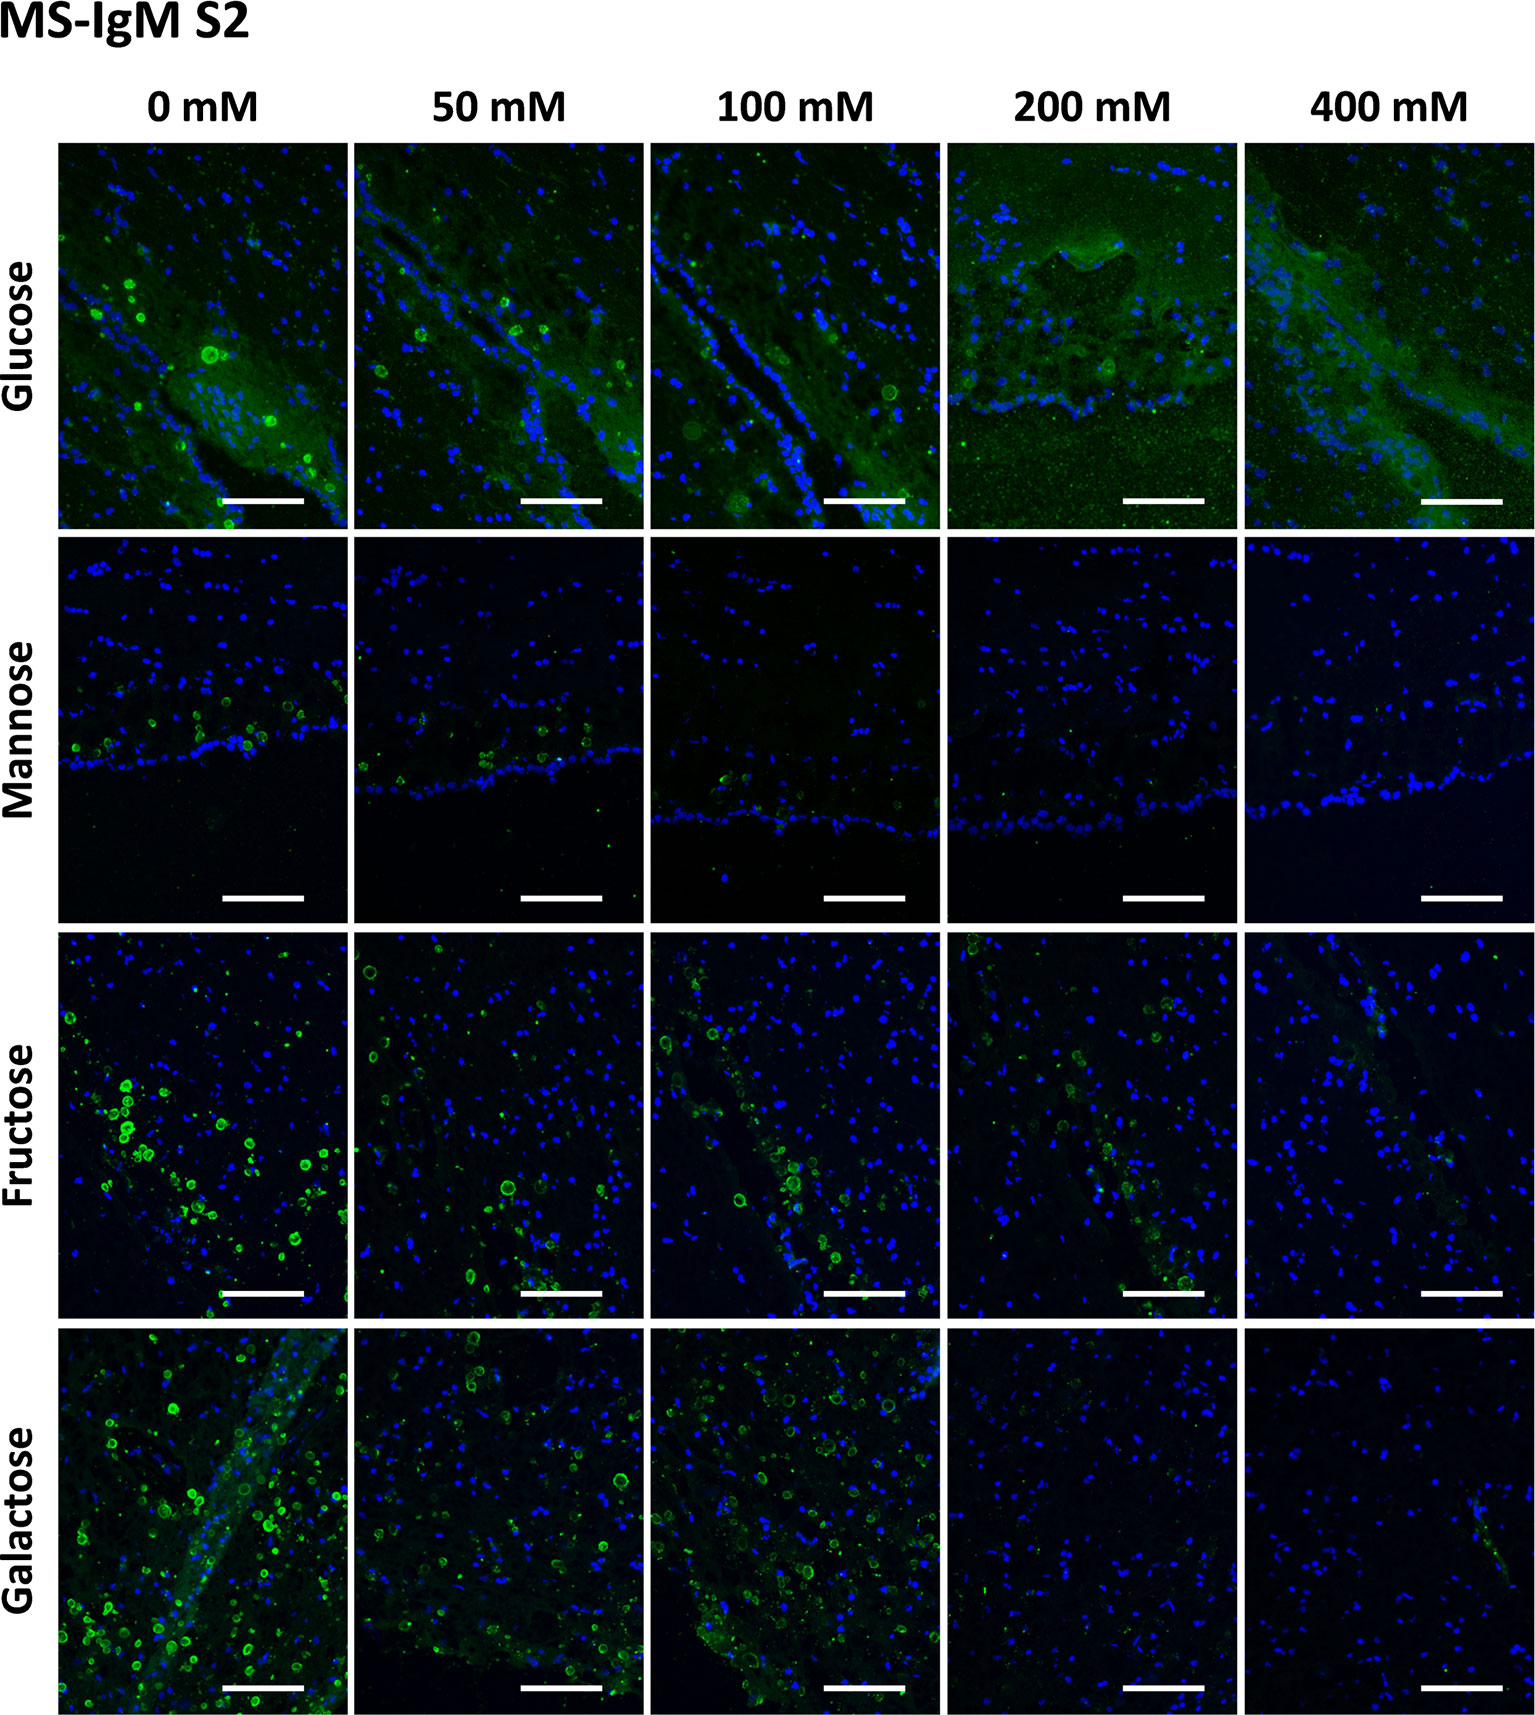
Figure 4 Representative images of hippocampal sections stained with MS-IgMs and Hoechst (blue) obtained in the second series (S2). Each row corresponds to a preadsorption study performed with the indicated carbohydrate. Sugar concentrations are indicated above. As observed in Figure S3, the staining of CA becomes weaker with increasing sugar concentrations and even disappears. Scale bar: 100 μm.
Table 1 shows the mean RI% values for each experimental condition, including the results from S1 and S2. Statistical significances with respect to the values obtained at 0 mM are indicated. As can be observed, all the sugars interfered with the staining, with the sugar concentrations of 200 mM and 400 mM producing a significant decrease. Moreover, as can be observed in the graphical view of these data (Figures 7C, D corresponding to S1 and S2, respectively), there was a gradual decrease in staining when the sugar concentration increased. Although there were some discrepancies when comparing S1 and S2 (see, for example, Man at 50 and 100 mM), the general trends observed in S1 were the same as those observed in S2. Furthermore, the downward trends were similar for the different sugars, with the RI% values at 400 mM close to 0%. Thus, the results obtained with MS-IgMs indicated that the interaction between the MS-IgMs and CA was affected by all the sugars tested.
In the case of NS-IgMs, we first tested the preadsorption with Glc, Gal, Fru, Man, GlcNAc and GalNAc at concentrations ranging from 0 mM to 400 mM (S1). After considering the need to include the concentration of 800 mM, we performed a second series (S2) with all the sugars at concentrations of 0, 200, 400 and 800 mM. Representative images corresponding to S1 and S2 can be found in Figures 5 and 6.
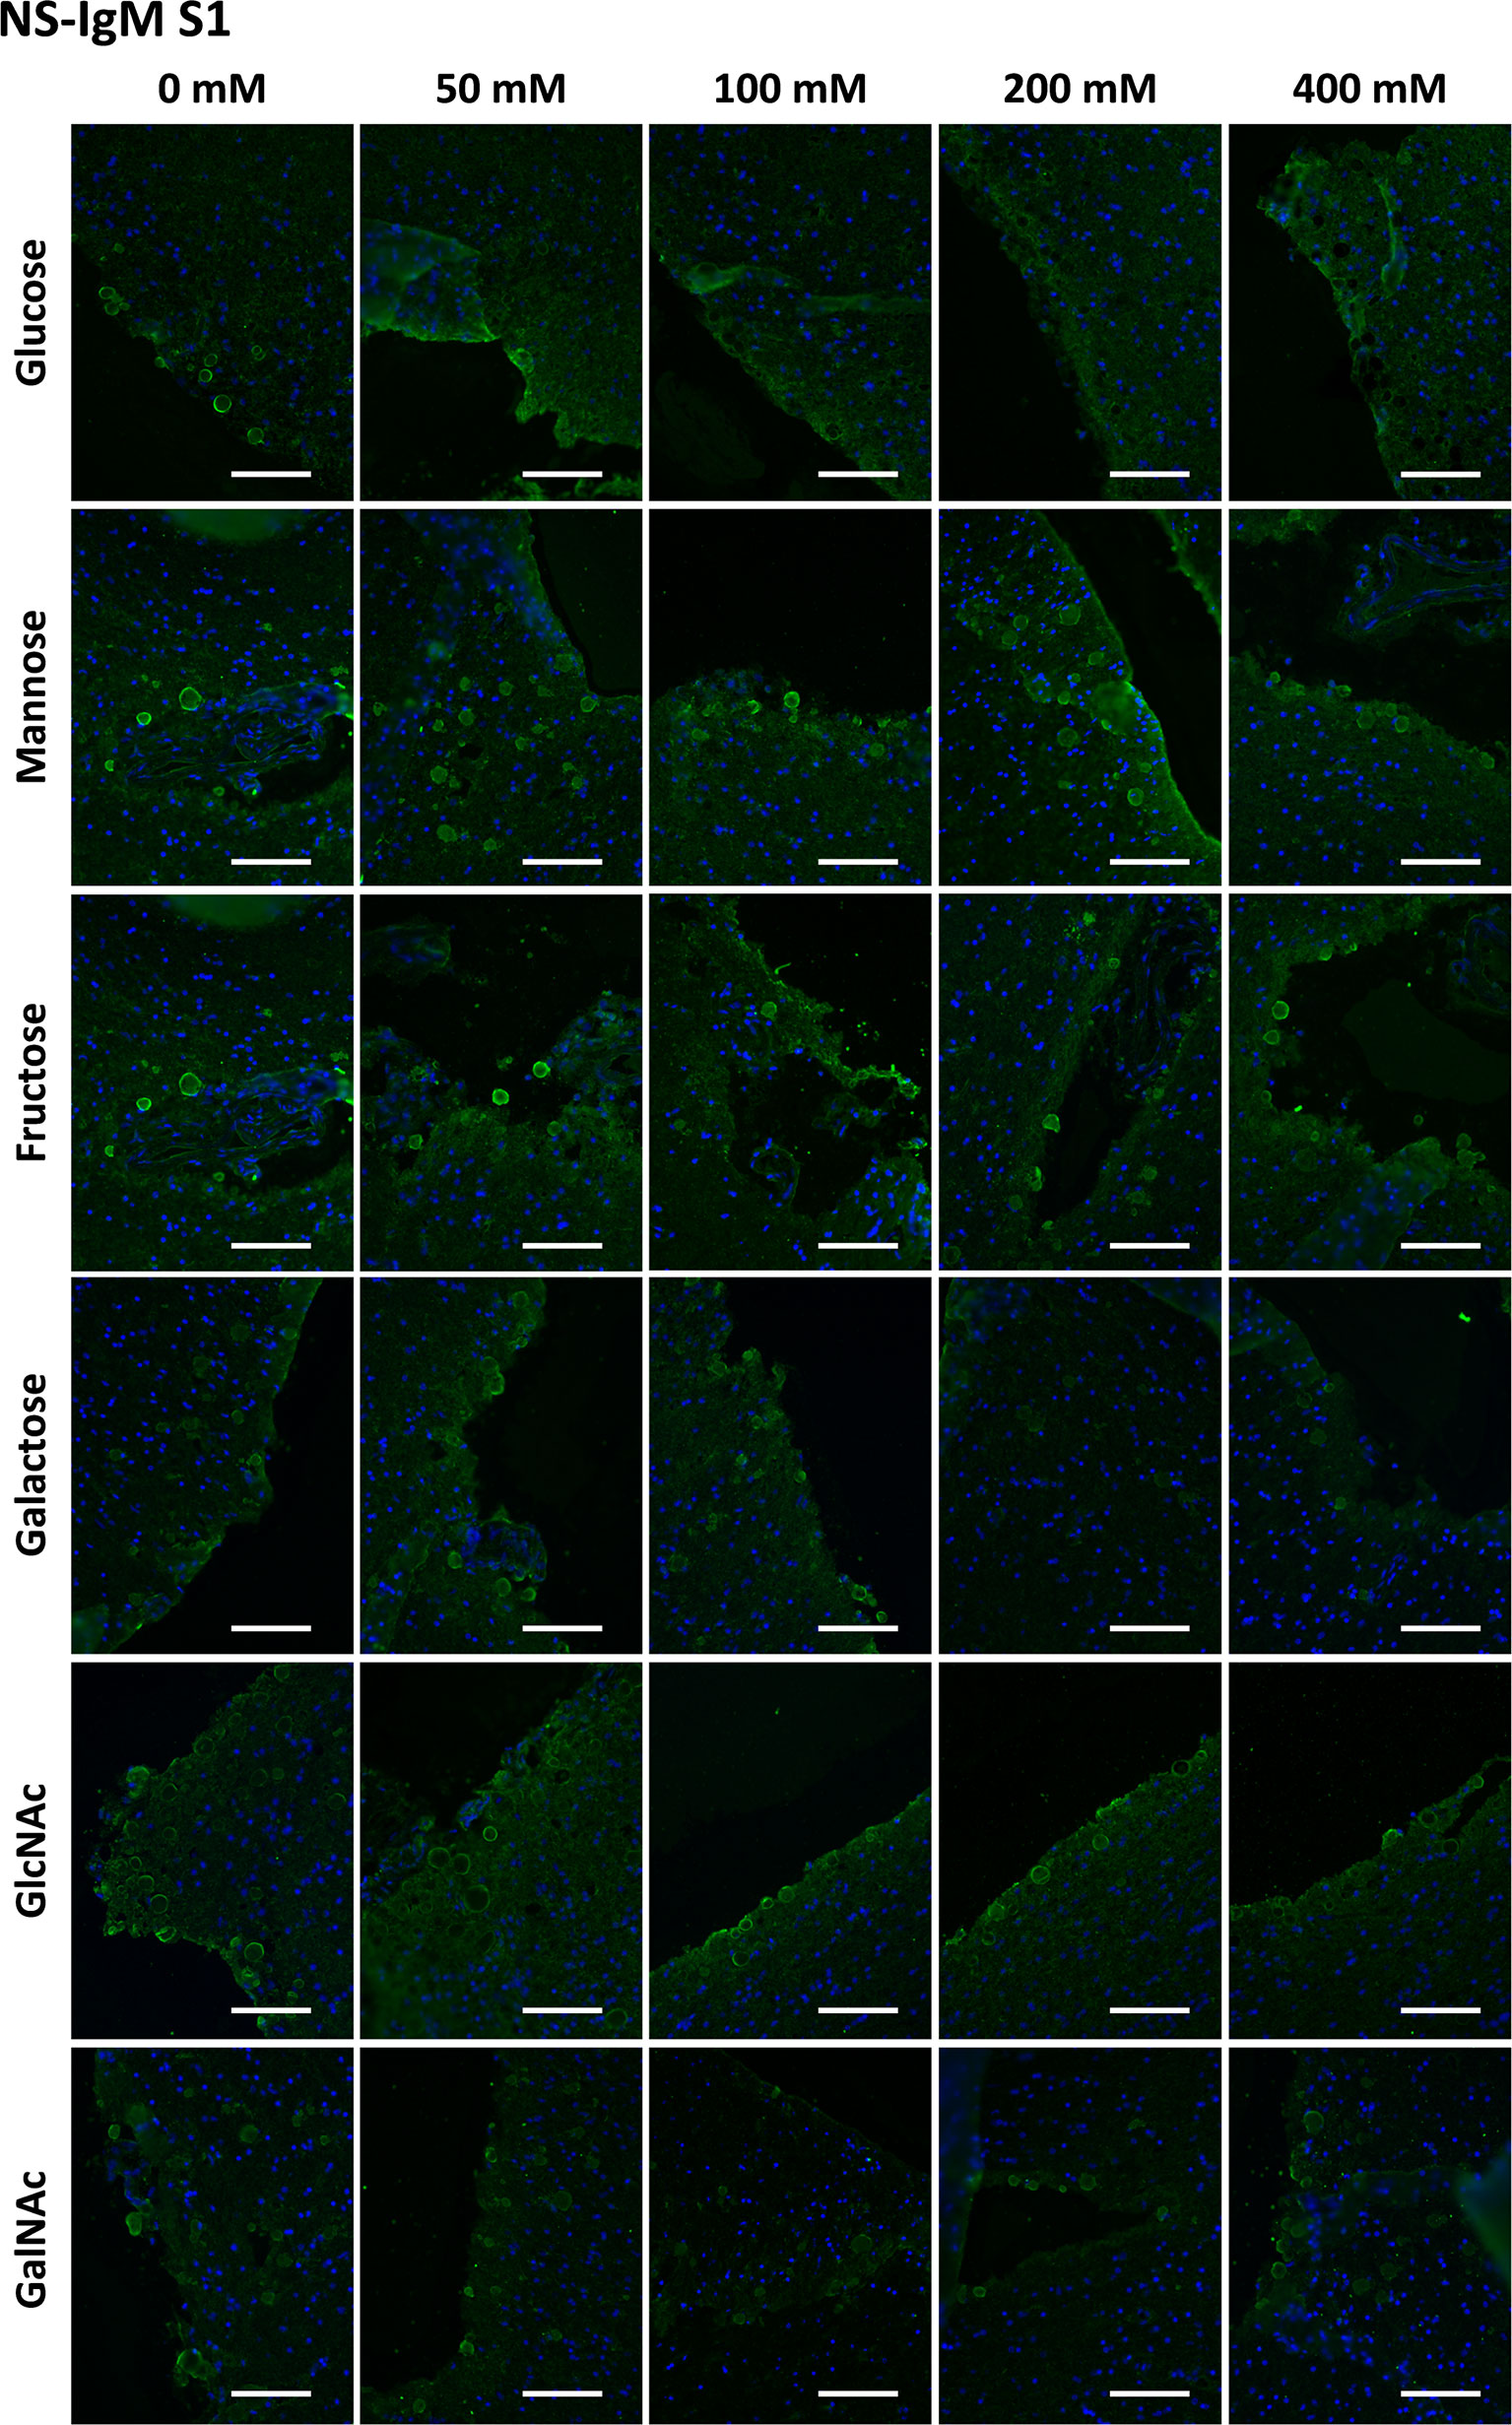
Figure 5 Representative images of hippocampal sections stained with NS-IgMs and Hoechst (blue) obtained in the first series (S1). Each row corresponds to a preadsorption study performed with the indicated carbohydrate. Sugar concentrations are indicated above. Scale bar: 100 μm.
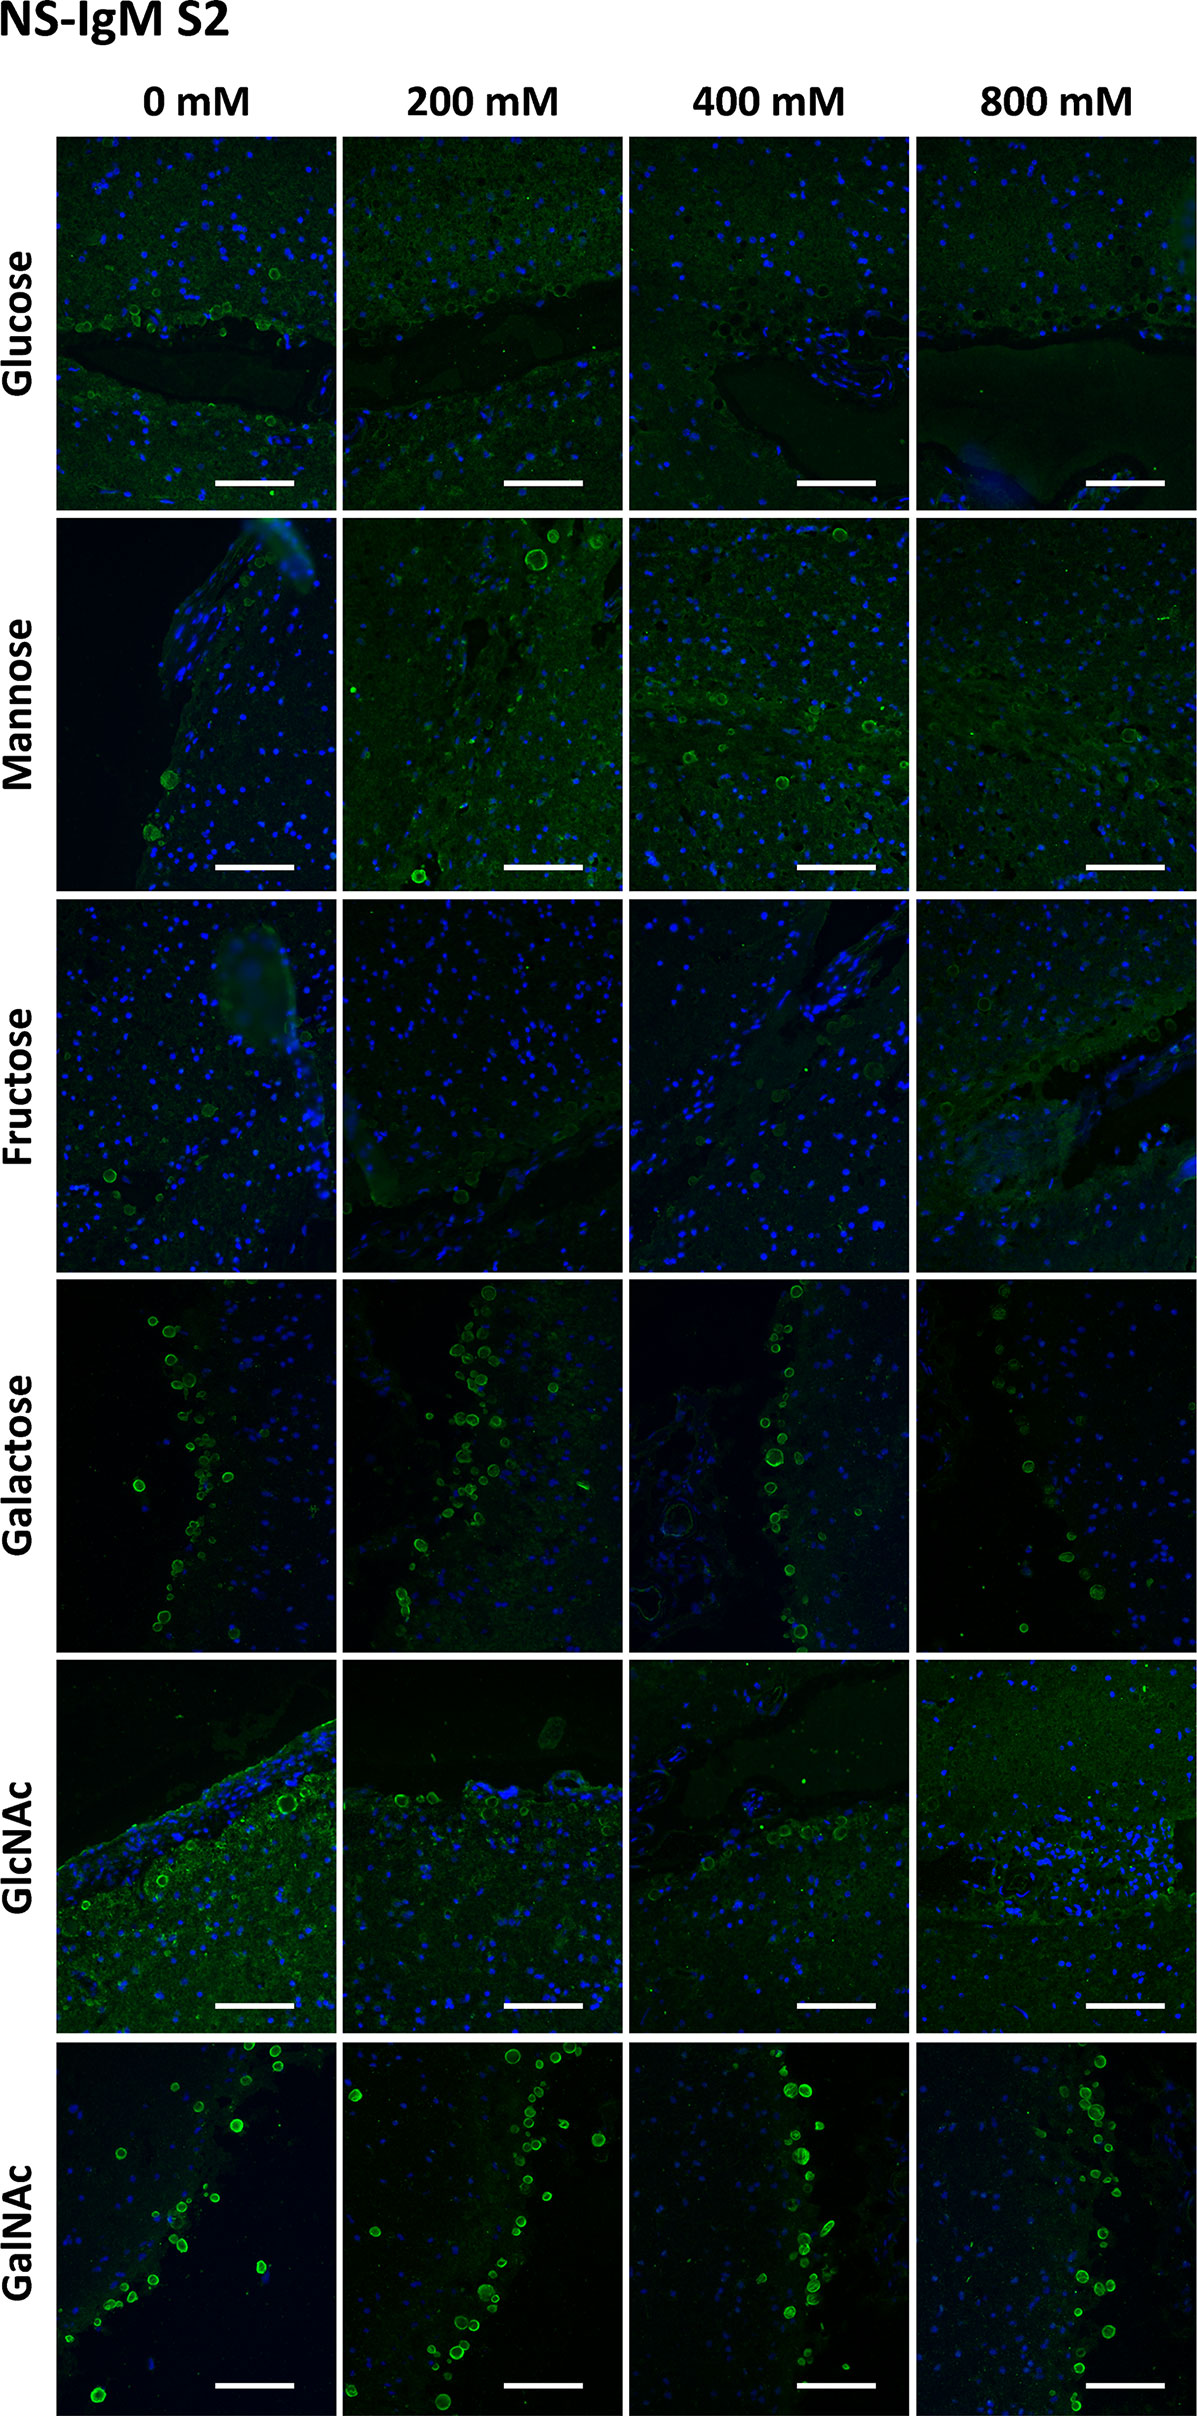
Figure 6 Representative images of hippocampal sections stained with NS-IgMs and Hoechst (blue) obtained in the second series (S2). Each row corresponds to a preadsorption study performed with the indicated carbohydrate. Sugar concentrations are indicated above. Scale bar: 100 μm.
Table 1 presents the mean RI% values from S1 and S2 and the statistical significances with respect to the values obtained at 0 mM. The graphical view of these data is presented in Figures 7E, F. As can be observed, the results from S1 and S2 were very similar. The different sugars seem to interfere in different ways with the staining of CA with NS-IgM. Glc had the largest effect on the staining, with the RI% close to 0% for practically all the tested concentrations, being significantly lower than the control values. Man, Fru and GlcNAc also decreased the RI%. However, this decrease seems to be not as pronounced as that produced by Glc, with values at 800 mM being around 20%. The results from the experiments with Gal and GalNAc appear to be different to those with the other sugars, with no clear trend observed. Table 1 shows that significant differences compared to the control values were observed only for 800 mM of Gal or GalNAc. At this concentration, the RI% values were 58.62 for Gal and 68.45 for GalNAc, i.e., far from 0% and far from the values obtained with the other sugars at 800 mM. Thus, Glc showed the largest effect on the interaction between the NS-IgMs and CA, while Fru, Man and GlcNAc had an intermediate effect, and Gal and GalNAc had a minor effect. This indicates that there are some differences in the way in which MS-IgMs and NS-IgMs interact with CA, in terms of immunoreactivity. However, generally, the interaction between IgMs and CA seems to involve carbohydrates, suggesting that the NEs have a carbohydrate nature.
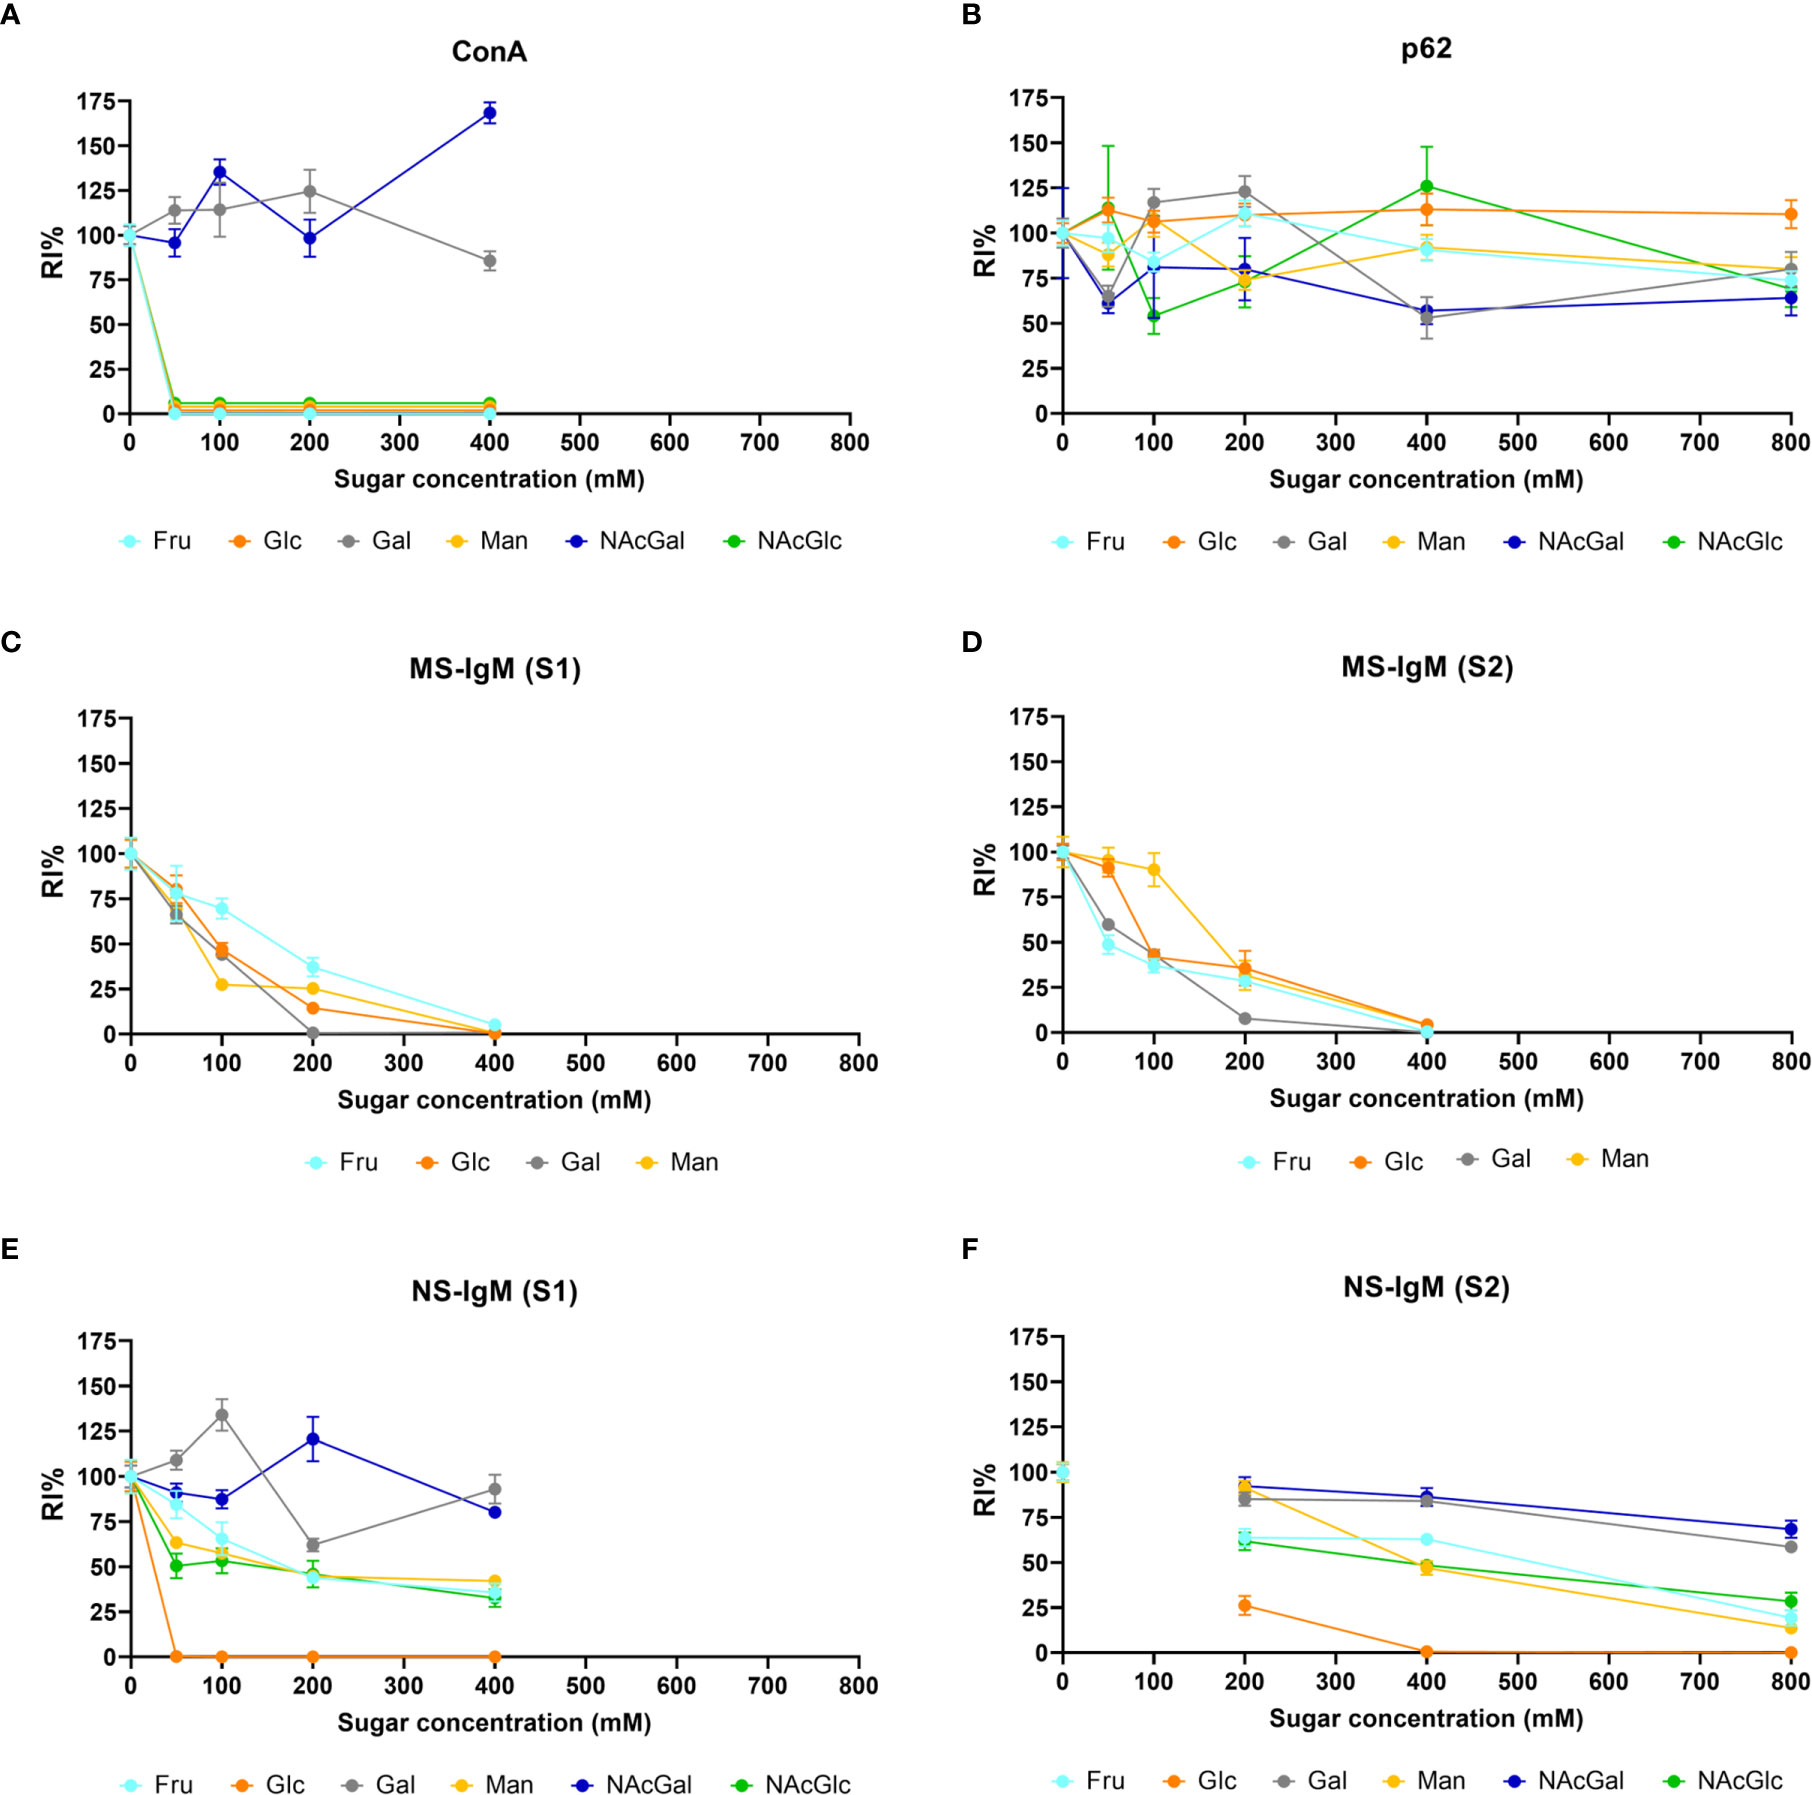
Figure 7 Graphical view of the RI% mean values (± s.e.m.) of fluorescence resulting from the staining of CA with ConA, α-p62 antibody, MS‐IgM or NS-IgM that have been preadsorbed with the indicated sugars at the indicated concentrations. S1 and S2 correspond to data from the different series. The data and significant differences are detailed in Table 1. Note in (A) the decrease produced by Glc, Fru, Man and GlcNAc, but not by Gal and GalNAc, in the ConA staining of CA. In (B) (corresponding to α-p62 antibody staining), note that the lines do not show the downward trend in relation to the sugar concentration for any of the four sugars tested. On the contrary, (C, D) show that staining with MS‐IgMs (S1 and S2) is affected by the presence of the sugars. Staining with NS-IgMs (E, F) is also affected by the presence of the sugars. See text for details.
Digestion Studies
As explained before, to exclude the possible peptidic composition of the NEs recognized by the IgMs, we checked the IgM staining of CA obtained from the CSF after their digestion with the peptidic enzyme pepsin. Staining with AF555 NHS ester probe, α-p62 antibody and fluorescein-labeled ConA were used as controls. After the digestion with pepsin, the AF555 NHS ester and α-p62 staining should not appear if the proteins have been digested, but the staining with ConA should not be affected, as ConA binds to carbohydrate structures.
First of all, we performed single staining of CA with NHS ester probe, α-p62, ConA and NS-IgM (Figure 8A). For each product, we used matching aliquots, one of them digested with pepsin and the other simply diluted in PBS. As expected, CA were stained with the NHS ester probe in the absence of pepsin digestion, but not when CA have been previously digested with pepsin, indicating that the digestion with pepsin, eliminated all the peptidic components of the CA. Accordingly, CA were stained with the α-p62 in absence of pepsin digestion, but not when CA have been previously digested. Staining with ConA was not affected by the pepsin digestion, indicating that the glucidic structure recognized by ConA was not affected by the peptidic enzyme. Finally, staining with NS-IgMs occurred with and without the pepsin digestion, indicating that the targets of the IgMs were not affected by this digestion and, thus, they do not have a peptidic nature.
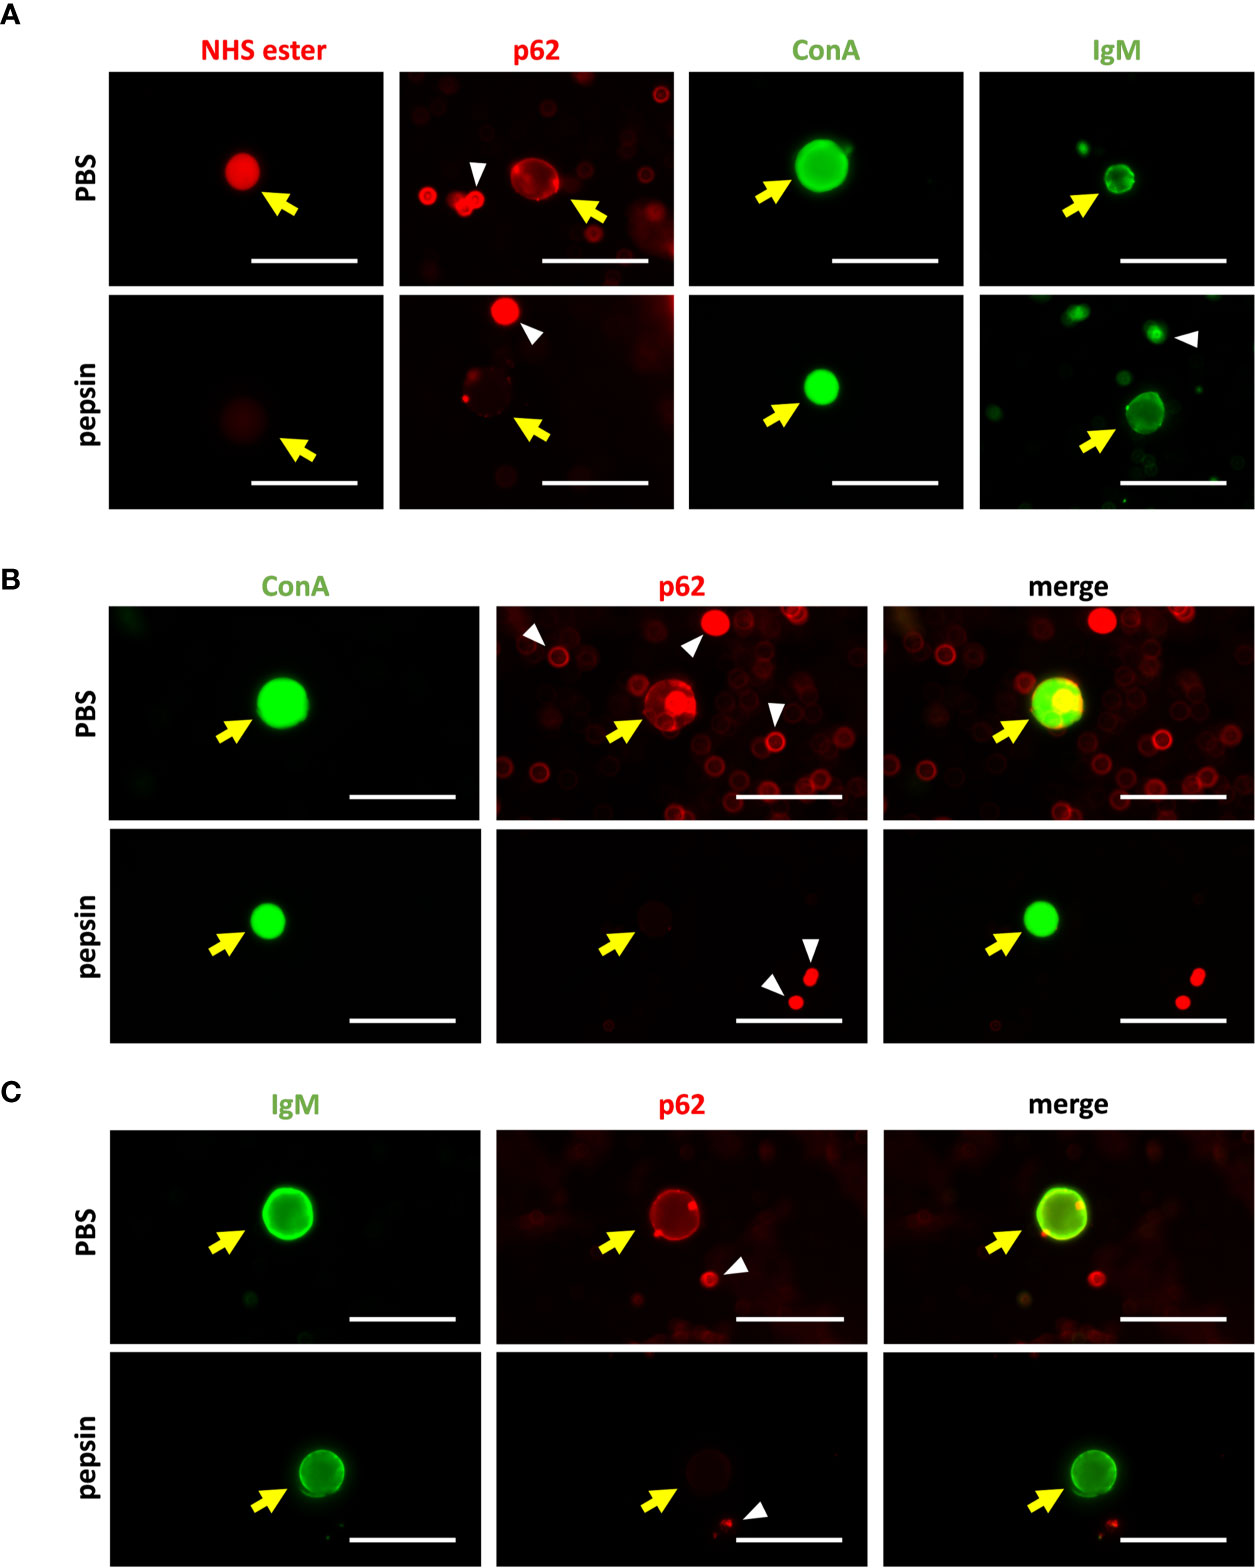
Figure 8 (A) Representative images of single staining of CA from CSF with AF555 NHS ester probe, α-p62 antibody, ConA or NS-IgM (left to right). The staining has been performed after the incubation with pepsin (upper row), or after the incubation with PBS (lower row; controls). The digestion prevented the staining with the AF555 NHS ester probe and the α-p62 antibody, but not the staining with ConA or NS-IgM. CA are indicated by yellow arrows, while some artifacts or cell debris are pointed with white arrowheads. (B) Double staining of CA with ConA and the α-p62 antibody. The staining has been performed after the incubation with pepsin (upper row), or after the incubation with PBS (lower row; controls). Left: green channel (ConA); center: red channel (p62); right: merged images. Pepsin eliminated the staining of CA with the α-p62 antibody, but not that with ConA. (C): Double staining of CA with NS-IgM and the α-p62 antibody, without and with the pepsin digestion (upper and lower rows, respectively). Left: green channel (IgM); center: red channel (p62); right: merged images. Pepsin eliminated the staining of CA with the α-p62 antibody, but not that with NS-IgM. Scale bar: 50 μm.
Two double staining procedures were performed, using ConA and the α-p62 antibody in one case and NS-IgMs and α-p62 antibodies in the other. In the first case, CA were stained with both ConA and the α-p62 antibody in the absence of the pepsin digestion, while after the pepsin digestion the ConA staining can be observed but not that of p62 (Figure 8B). Similarly, pepsin digestion led to the disappearance of the α-p62 antibody staining, but did not affect NS-IgM staining in the double immunostaining with the α-p62 antibody and NS-IgMs (Figure 8C), indicating that the NEs recognized by the IgMs are not of a peptidic nature.
Discussion
In previous studies, we had determined that CA in the human brain exhibit NEs that are recognized by plasma IgMs, which are in fact natural IgMs (10). The present study aimed to clarify the nature of these NEs, and we adapted standard techniques to this purpose.
Since the preadsorption of ConA with specific sugars interferes with the interaction between ConA and CA, and given that the sugar preadsorption of antibodies directed against proteins do not disrupt their interaction with CA, we used this strategy to study the interaction between IgMs and CA. We observed that the preadsorption of IgMs with specific carbohydrates had inhibitory effects. On the other hand, we found that the digestion of CA with pepsin, that eliminates their proteinaceous components, removes the staining with NHS ester probe and α-p62 while that of ConA is maintained, indicating that the sugar target of ConA has not been altered. We also observed that the pepsin digestion has no effect on IgM staining, thus excluding the peptidic nature of the NEs. Altogether, all these results strongly support that the NEs contained in CA have a carbohydrate nature.
Glycans have multiple complex functions, including acting as “eat-me” signals to induce phagocytosis by macrophages or dendritic cells, either directly or indirectly, for example, via opsonization with natural IgMs (46, 50). Recently, Xia and Gildersleeve, analyzing α-glycan IgM repertoires in newborn human cord blood, reported that many α-glycan antibodies present in human sera belong to the IgM class and are natural antibodies (49), with natural IgMs estimated to constitute between 80% and 90% of natural antibodies (46). Membrane-derived epitopes are among the NEs recognized by these antibodies (56). Such epitopes include carbohydrate determinants generally anchored to intracellular membranes that act as “eat-me” signals when exposed to the outside of the cell, for example, when apoptosis occurs or in cell debris (56). In fact, under physiological conditions, there are multiple elements inside cells that can act as “eat-me” signals when externalized. This is an energy-saving process for the body because in the case of functional or structural alterations, it is not necessary to generate these signals de novo, but it is enough to relocate them to the outside of the cell (56). For all these reasons, given that CA accumulate different residual elements and that they can act as waste containers that are part of the brain cleaning system, it would not be surprising that different species of NEs with a carbohydrate nature occur in CA. Some of these could participate in the phagocytosis of CA by macrophages, a process that has been observed in nerve tissue samples from cases of neuromyelitis optica (17) and in in vitro studies (24).
In the present study, we used two different pools of IgMs (NS-IgMs and MS-IgMs). The binding of the NS-IgMs to CA was affected to varying levels by the different sugars, with Glc having the largest effect, reducing the RI% to 0% at a concentration of 50 mM. Gal and GalNAc had the smallest effects, producing a slight decrease in staining only at the highest concentration tested (800 mM), when the RI% value was around 60%. This suggests that the equatorial arrangement of the hydroxyl group at C-4 in the monosaccharide is critical for its interaction with IgMs. Moreover, the equatorial or axial arrangement of the hydroxyl group at C-2 might also have some importance. This is illustrated by the lower inhibition exerted by Man compared to Glc and also in the comparison of the inhibitions produced by Glc and GlcNAc, in which the hydroxyl group at C-2 is substituted with NAc. The effects of the changes at C-2, however, are not as strong as those at C-4.
The four monosaccharides tested interfered with the binding of the MS-IgMs to CA, with no significant differences observed among the sugars. This different behavior of MS-IgMs compared to NS-IgMs could be due to the fact that the former come from an extract of myeloma serum and, therefore, this pool of IgMs is restricted and possibly altered with respect to the pool of IgMs found in normal serum (NS-IgMs). However, it should be noted that in both cases, the interaction between the IgMs and CA was inhibited by the sugars, further supporting the carbohydrate nature of the NEs of CA that were recognized by these IgMs. We do not know whether there is only one type of NE in CA or whether there is a collection of different NEs. In any case, the binding of the IgMs to these NEs of CA can be completely blocked by certain monosaccharides.
The present work indicates that the binding between certain human IgMs and certain antigens or epitopes present in human structures can be inhibited in vitro by certain monosaccharides, especially glucose. Therefore, we wondered whether these inhibitions also occur in vivo. In human sera, the IgM concentration in early adulthood is 1.46 ± 0.12 mg/ml (57), while the normal plasma glucose two hours after eating is about 7.8 mM (58). In our study, the NS-IgM concentration was 0.044 mg/ml, while the lowest glucose concentration used to preadsorb the NS-IgM was 50 mM or, more precisely, 48.1 mM if we take into account the addition of the antibody during the antibody dilution. Therefore, the Glc/IgM ratio in our experimental conditions was about 205 times higher than that in physiological conditions. In any case, taking into account that in our experimental conditions the RI% decreases to about 0% at 48.1 mM of Glc concentration, we may consider that physiological levels of Glc could also induce some inhibitory effects on IgM. In this sense, it must be pointed that short-term hyperglycemia influence the innate immune system (59). Furthermore, diabetes mellitus increases susceptibility to viral, bacterial and fungal infections through modulating the immune system (59–61). Although different mechanisms have been described to explain this, including the activation of protein kinase C and the glycosylation of some proteins (59), the possible inhibition of IgM reactivity by glucose or other sugars has not been investigated to date. Thus, the present work introduces a new focus of interest.
In summary, the present work indicates that the NEs in CA have a carbohydrate nature. Furthermore, it indicates that the natural IgMs that recognize these NEs can be blocked in vitro by preadsorption with different sugars, particularly glucose. Finally, our findings reveal the need to study the effects that glycemia produce in vivo on the reactivity of natural IgMs and, consequently, on natural immunity.
Data Availability Statement
The original contributions presented in the study are included in the article/Supplementary Material. Further inquiries can be directed to the corresponding author.
Ethics Statement
The studies involving human samples were reviewed and approved by Bioethical Committee of the Universitat de Barcelona. The ethics committee waived the requirement of written informed consent for participation.
Author Contributions
MR, EA, CP, and JV designed research. MR, EA, IT, JDV, LM-P, TX, CP, and JV performed research. MR, EA, JDV, CP, and JV analyzed data. MR, EA, JDV, CP, and JV wrote the paper. All authors contributed to the article and approved the submitted version.
Conflict of Interest
The authors declare that the research was conducted in the absence of any commercial or financial relationships that could be construed as a potential conflict of interest.
Acknowledgments
This study was funded by grant BFU2016-78398-P awarded by the Spanish Ministerio de Economía y Competitividad, by Agencia Estatal de Investigación, and by Fondo Europeo de Desarrollo Regional. We thank the Generalitat de Catalunya for funding our research group (2017/SGR625). We are sincerely grateful to the Spanish Ministerio de Ciencia, Innovación y Universidades for awarding a predoctoral fellowship to MR (Formación de Profesorado Universitario, 2018). We are indebted to the Biobanc-Hospital Clínic-Institut d’Investigacions Biomèdiques August Pi i Sunyer (IDIBAPS), integrated in the Spanish National Biobank Network, for samples and data procurement. We are sincerely grateful to Michael Maudsley for correcting the English version of the manuscript.
Supplementary Material
The Supplementary Material for this article can be found online at: https://www.frontiersin.org/articles/10.3389/fimmu.2021.618193/full#supplementary-material
References
1. Catola G, Achúcarro N. Über Die Enstehung De Amyloidkörperchen in Zentralnervensystem. Virchows Arch f Path Anat (1906) (1906) 184:454–69. doi: 10.1007/BF01999854
2. Cavanagh JB. Corpora-Amylacea and the Family of Polyglucosan Diseases. Brain Res Rev (1999) 29:265–95. doi: 10.1016/S0165-0173(99)00003-X
3. Sakai M, Austin J, Witmer F, Trueb L. Studies of Corpora Amylacea. Arch Neurol (1969) 21:526–44. doi: 10.1001/archneur.1969.00480170098011
4. Sbarbati A, Carner M, Colletti V, Osculati F. Extrusion of Corpora Amylacea From the Marginal Glia at the Vestibular Root Entry Zone. J Neuropathol Exp Neurol (1996) 55:196–201. doi: 10.1097/00005072-199602000-00008
5. Pirici D, Margaritescu C. Corpora Amylacea in Aging Brain and Age-Related Brain Disorders. J Aging Gerontol (2014) 2:33–57.
6. Radhakrishnan A, Radhakrishnan K, Radhakrishnan VV, Mary PR, Kesavadas C, Alexander A, et al. Corpora Amylacea in Mesial Temporal Lobe Epilepsy: Clinico-Pathological Correlations. Epilepsy Res (2007) 74:81–90. doi: 10.1016/j.eplepsyres.2007.01.003
7. Rohn TT. Corpora Amylacea in Neurodegenerative Diseases: Cause or Effect? Int J Neurol Neurother (2015) 2:031. doi: 10.23937/2378-3001/2/2/1031
8. Singhrao SK, Neal JW, Piddlesden SJ, Newman GR. New Immunocytochemical Evidence for a Neuronal/Oligodendroglial Origin for Corpora Amylacea. Neuropathol Appl Neurobiol (1994) 20:66–73. doi: 10.1111/j.1365-2990.1994.tb00958.x
9. Augé E, Bechmann I, Llor N, Vilaplana J, Krueger M, Pelegrí C. Corpora Amylacea in Human Hippocampal Brain Tissue Are Intracellular Bodies That Exhibit a Homogeneous Distribution of Neo-Epitopes. Sci Rep (2019) 9:2063. doi: 10.1038/s41598-018-38010-7
10. Augé E, Cabezón I, Pelegrí C, Vilaplana J. New Perspectives on Corpora Amylacea in the Human Brain. Sci Rep (2017) 7:41807. doi: 10.1038/srep41807
11. Schipper HM, Cissé S. Mitochondrial Constituents of Corpora Amylacea and Autofluorescent Astrocytic Inclusions in Senescent Human Brain. Glia (1995) 14:55–64. doi: 10.1002/glia.440140108
12. Selmaj K, Pawłowska Z, Walczak A, Koziołkiewicz W, Raine CS, Cierniewski CS. Corpora Amylacea From Multiple Sclerosis Brain Tissue Consists of Aggregated Neuronal Cells. Acta Biochim Pol (2008) 55:43–9. doi: 10.18388/abp.2008_3199
13. Ferraro A, Damon LA. The Histogenesis of Amyloid Bodies in the Central Nervous System. Arch Pathol (1931) 12:229–44.
14. Meng H, Zhang X, Blaivas M, Wang MM. Localization of Blood Proteins Thrombospondin1 and ADAMTS13 to Cerebral Corpora Amylacea. Neuropathology (2009) 29:664–71. doi: 10.1111/j.1440-1789.2009.01024.x
15. Martin JE, Mather K, Swash M, Garofalo O, Leigh PN, Anderton BH. Heat Shock Protein Expression in Corpora Amylacea in the Central Nervous System: Clues to Their Origin. Neuropathol Appl Neurobiol (1991) 17:113–9. doi: 10.1111/j.1365-2990.1991.tb00702.x
16. Gáti I, Leel-Ossi L. Heat Shock Protein 60 in Corpora Amylacea. Pathol Oncol Res (2001) 7:140–4. doi: 10.1007/BF03032581
17. Suzuki A, Yokoo H, Kakita A, Takahashi H, Harigaya Y, Ikota H, et al. Phagocytized Corpora Amylacea as a Histological Hallmark of Astrocytic Injury in Neuromyelitis Optica. Neuropathology (2012) 32:587–94. doi: 10.1111/j.1440-1789.2012.01299.x
18. Libard S, Popova SN, Amini RM, Kärjä V, Pietiläinen T, Hämäläinen KM, et al. Human Cytomegalovirus Tegument Protein pp65 is Detected in All Intra- and Extra-Axial Brain Tumours Independent of the Tumour Type or Grade. PloS One (2014) 9:e108861. doi: 10.1371/journal.pone.0108861
19. Pisa D, Alonso R, Rábano A, Carrasco L. Corpora Amylacea of Brain Tissue From Neurodegenerative Diseases Are Stained With Specific Antifungal Antibodies. Front Neurosci (2016) 10:86. doi: 10.3389/fnins.2016.00086
20. Pisa D, Alonso R, Marina AI, Rábano A, Carrasco L. Human and Microbial Proteins From Corpora Amylacea of Alzheimer’s Disease. Sci Rep (2018) 8:9880. doi: 10.1038/s41598-018-28231-1
21. Augé E, Duran J, Guinovart JJ, Pelegrí C, Vilaplana J. Exploring the Elusive Composition of Corpora Amylacea of Human Brain. Sci Rep (2018) 8:13525. doi: 10.1038/s41598-018-31766-y
22. Wander CM, Tseng J, Song S, Al Housseiny HA, Tart DS, Ajit A, et al. The Accumulation of Tau-Immunoreactive Hippocampal Granules and Corpora Amylacea Implicates Reactive Glia in Tau Pathogenesis During Aging. iScience (2020) 23:101255. doi: 10.1016/j.isci.2020.101255
23. Navarro PP, Genoud C, Castaño-Díez D, Graff-Meyer A, Lewis AJ, de Gier Y, et al. Cerebral Corpora Amylacea Are Dense Membranous Labyrinths Containing Structurally Preserved Cell Organelles. Sci Rep (2018) 8:18046. doi: 10.1038/s41598-018-36223-4
24. Riba M, Augé E, Campo-Sabariz J, Moral-Anter D, Molina-Porcel L, Ximelis T, et al. Corpora Amylacea Act as Containers That Remove Waste Products From the Brain. Proc Natl Acad Sci USA (2019) 116:26038–48. doi: 10.1073/pnas.1913741116
25. Jucker M, Walker LC, Schwarb P, Hengemihle J, Kuo H, Snow AD, et al. Age-Related Deposition of Glia-Associated Fibrillar Material in Brains of C57BL/6 Mice. Neuroscience (1994) 60:875–89. doi: 10.1016/0306-4522(94)90269-0
26. Lamar CH, Hinsman EJ, Henrikson CK. Alterations in the Hippocampus of Aged Mice. Acta Neuropathol (1976) 36:387–91. doi: 10.1007/BF00699644
27. Manich G, Cabezón I, Augé E, Pelegrí C, Vilaplana J. Periodic acid-Schiff Granules in the Brain of Aged Mice: From Amyloid Aggregates to Degenerative Structures Containing Neo-Epitopes. Ageing Res Rev (2016) 27:42–55. doi: 10.1016/j.arr.2016.03.001
28. Manich G, Cabezón I, Camins A, Pallàs M, Liberski PP, Vilaplana J, et al. Clustered Granules Present in the Hippocampus of Aged Mice Result From a Degenerative Process Affecting Astrocytes and Their Surrounding Neuropil. Age (2014) 36:9690. doi: 10.1007/s11357-014-9690-8
29. Augé A, Pelegrí C, Manich G, Cabezón I, Guinovart JJ, Duran J, et al. Astrocytes and Neurons Produce Distinct Types of Polyglucosan Bodies in Lafora Disease. Glia (2018) 66:2094–107. doi: 10.1002/glia.23463
30. Manich G, del Valle J, Cabezón I, Camins A, Pallàs M, Pelegrí C, et al. Presence of a Neo-Epitope and Absence of Amyloid Beta and Tau Protein in Degenerative Hippocampal Granules of Aged Mice. Age (2014) 36:151–65. doi: 10.1007/s11357-013-9560-9
31. Chou MY, Fogelstrand L, Hartvigsen K, Hansen LF, Woelkers D, Shaw PX, et al. Oxidation-Specific Epitopes Are Dominant Targets of Innate Natural Antibodies in Mice and Humans. J Clin Invest (2009) 119:1335–49. doi: 10.1172/JCI36800
32. Kay M. Physiologic Autoantibody and Immunoglobulin Interventions During Aging. Curr Aging Sci (2013) 6:56–62. doi: 10.2174/1874609811306010008
33. Pawelec G. Immunosenescence and Cancer. Biogerontology (2017) 18:717–21. doi: 10.1007/s10522-017-9682-z
34. Singh R, Barden A, Mori T, Beilin L. Advanced Glycation End-Products: A Review. Diabetologia (2001) 44:129–46. doi: 10.1007/s001250051591
35. Vollmers HP, Brändlein S. Natural Antibodies and Cancer. N Biotechnol (2009) 25:294–8. doi: 10.1016/j.nbt.2009.03.016
36. Ehrenstein MR, Notley CA. The Importance of Natural IgM: Scavenger, Protector and Regulator. Nat Rev Immunol (2010) 10:778–86. doi: 10.1038/nri2849
37. Grönwall C, Vas J, Silverman GJ. Protective Roles of Natural IgM Antibodies. Front Immunol (2012) 3:66. doi: 10.3389/fimmu.2012.00066
38. Holodick NE, Rodríguez-Zhurbenko N, Hernández AM. Defining Natural Antibodies. Front Immunol (2017) 8:872. doi: 10.3389/fimmu.2017.00872
39. Mannoor K, Xu Y, Chen C. Natural Autoantibodies and Associated B Cells in Immunity and Autoimmunity. Autoimmunity (2013) 46:138–47. doi: 10.3109/08916934.2012.748753
40. Avrameas S. Natural Autoantibodies: From “Horror Autotoxicus” to “Gnothi Seauton”. Immunol Today (1991) 12:154–9. doi: 10.1016/0167-5699(91)90080-D
41. Baumgarth N, Tung JW, Herzenberg LA. Inherent Specificities in Natural Antibodies: A Key to Immune Defense Against Pathogen Invasion. Springer Semin Immunopathol (2005) 26:347–62. doi: 10.1007/s00281-004-0182-2
42. Reyneveld GI, Savelkoul HFJ, Parmentier HK. Current Understanding of Natural Antibodies and Exploring the Possibilities of Modulation Using Veterinary Models. A Review. Front Immunol (2020) 11:2139. doi: 10.3389/fimmu.2020.02139
43. Chen Y, Park YB, Patel E, Silverman GJ. Igm Antibodies to Apoptosis-Associated Determinants Recruit C1q and Enhance Dendritic Cell Phagocytosis of Apoptotic Cells. J Immunol (2009) 9 182:6031–43. doi: 10.4049/jimmunol.0804191
44. Lutz HU, Binder CJ, Kaveri S. Naturally Occurring Auto-Antibodies in Homeostasis and Disease. Trends Immunol (2009) 30:43–51. doi: 10.1016/j.it.2008.10.002
45. Maddur MS, Lacroix-Desmazes S, Dimitrov JD, Kazatchkine MD, Bayry J, Kaveri SV. Natural Antibodies: From First-Line Defense Against Pathogens to Perpetual Immune Homeostasis. Clin Rev Allergy Immunol (2020) 58:213–28. doi: 10.1007/s12016-019-08746-9
46. Bovin NV. Natural Antibodies to Glycans. Biochemistry (2013) 78:786–97. doi: 10.1134/S0006297913070109
47. Haji-Ghassemi O, Blackler RJ, Young NM, Evans SV. Antibody Recognition of Carbohydrate Epitopes. Glycobiology (2015) 25:920–52. doi: 10.1093/glycob/cwv037
48. Goldin A, Beckman JA, Schmidt AM, Creager MA. Advanced Glycation End Products: Sparking the Development of Diabetic Vascular Injury. Circulation (2006) 114:597–605. doi: 10.1161/CIRCULATIONAHA.106.621854
49. Xia L, Gildersleeve JC. Anti-Glycan IgM Repertoires in Newborn Human Cord Blood. PloS One (2019) 1:e0218575. doi: 10.1371/journal.pone.0218575
51. Liu HM, Anderson K, Caterson B. Demonstration of a Keratan Sulfate Proteoglycan and a Mannose-Rich Glycoconjugate in Corpora Amylacea of the Brain by Immunocytochemical and Lectin-Binding Methods. J Neuroimmunol (1987) 14:49–60. doi: 10.1016/0165-5728(87)90100-7
52. Coulibaly FS, Youan BB. Concanavalin A–Polysaccharides Binding Affinity Analysis Using a Quartz Crystal Microbalance. Biosens Bioelectron (2014) 59:404–11. doi: 10.1016/j.bios.2014.03.040
53. Goldstein IJ, Hayes CE. The Lectins: Carbohydrate-Binding Proteins of Plants and Animals. Adv Carbohydr Chem Biochem (1978) 35:127–340. doi: 10.1016/S0065-2318(08)60220-6
54. Goldstein IJ, Reichert CM, Misaki A. Interaction of Concanavallin A With Model Substrates. Ann N Y Acad Sci (1974) 234:283–96. doi: 10.1111/j.1749-6632.1974.tb53040.x
55. Nature Editorial. It’s Time to Talk About Ditching Statistical Significance. Nature (2019) 567:283. doi: 10.1038/d41586-019-00874-8
56. Franz S, Herrmann K, Führnrohr B, Sheriff A, Frey B, Gaipl US, et al. After Shrinkage Apoptotic Cells Expose Internal Membrane-Derived Epitopes on Their Plasma Membranes. Cell Death Differ (2007) 14:733–42. doi: 10.1038/sj.cdd.4402066
57. Gonzalez-Quintela A, Alende R, Gude F, Campos J, Rey J, Meijide LM, et al. Serum Levels of Immunoglobulins (Igg, IgA, IgM) in a General Adult Population and Their Relationship With Alcohol Consumption, Smoking and Common Metabolic Abnormalities. Clin Exp Immunol (2008) 151:42–50. doi: 10.1111/j.1365-2249.2007.03545.x
58. American Diabetes Association. 2. Classification and Diagnosis of Diabetes: Standards of Medical Care in Diabetes-2020. Diabetes Care (2020) 43(Suppl. 1):S14–31. doi: 10.2337/dc20-S002
59. Jafar N, Edriss H, Nugent K. The Effect of Short-Term Hyperglycemia on the Innate Immune System. Am J Med Sci (2016) 351:201–11. doi: 10.1016/j.amjms.2015.11.011
60. Dana TG, Rayyan AK. Diabetic Complications and Dysregulated Innate Immunity. Front Biosci (2008) 13:1227–39. doi: 10.2741/2757
Keywords: neoantigen, neoepitope, immunoglobulin M, natural antibodies, corpora amylacea, brain aging, hyperglycemia, diabetes
Citation: Riba M, Augé E, Tena I, del Valle J, Molina-Porcel L, Ximelis T, Vilaplana J and Pelegrí C (2021) Corpora Amylacea in the Human Brain Exhibit Neoepitopes of a Carbohydrate Nature. Front. Immunol. 12:618193. doi: 10.3389/fimmu.2021.618193
Received: 11 November 2020; Accepted: 10 June 2021;
Published: 28 June 2021.
Edited by:
Hans-Peter Hartung, Heinrich Heine University of Düsseldorf, GermanyReviewed by:
Todd Cohen, University of North Carolina at Chapel Hill, United StatesOr Kakhlon, Hadassah Medical Center, Israel
Copyright © 2021 Riba, Augé, Tena, del Valle, Molina-Porcel, Ximelis, Vilaplana and Pelegrí. This is an open-access article distributed under the terms of the Creative Commons Attribution License (CC BY). The use, distribution or reproduction in other forums is permitted, provided the original author(s) and the copyright owner(s) are credited and that the original publication in this journal is cited, in accordance with accepted academic practice. No use, distribution or reproduction is permitted which does not comply with these terms.
*Correspondence: Jordi Vilaplana, dmlsYXBsYW5hQHViLmVkdQ==
†These authors have contributed equally to this work
‡These authors have contributed equally to this work