 Mohamed Tarek Badr
 Mohamed Omar
 Georg Häcker1,4
- 1Faculty of Medicine, Institute of Medical Microbiology and Hygiene, Medical Center—University of Freiburg, Freiburg, Germany
- 2IMM-PACT-Program, Faculty of Medicine, University of Freiburg, Freiburg, Germany
- 3Department of Pathology and Laboratory Medicine, Weill Cornell Medicine, New York, NY, United States
- 4BIOSS Centre for Biological Signalling Studies, University of Freiburg, Freiburg, Germany
Helicobacter pylori is a gram-negative bacterium that colonizes the human gastric mucosa and can lead to gastric inflammation, ulcers, and stomach cancer. Due to the increase in H. pylori antimicrobial resistance new methods to identify the molecular mechanisms of H. pylori-induced pathology are urgently needed. Here we utilized a computational biology approach, harnessing genome-wide association and gene expression studies to identify genes and pathways determining disease development. We mined gene expression data related to H. pylori-infection and its complications from publicly available databases to identify four human datasets as discovery datasets and used two different multi-cohort analysis pipelines to define a H. pylori-induced gene signature. An initial Helicobacter-signature was curated using the MetaIntegrator pipeline and validated in cell line model datasets. With this approach we identified cell line models that best match gene regulation in human pathology. A second analysis pipeline through NetworkAnalyst was used to refine our initial signature. This approach defined a 55-gene signature that is stably deregulated in disease conditions. The 55-gene signature was validated in datasets from human gastric adenocarcinomas and could separate tumor from normal tissue. As only a small number of H. pylori patients develop cancer, this gene-signature must interact with other host and environmental factors to initiate tumorigenesis. We tested for possible interactions between our curated gene signature and host genomic background mutations and polymorphisms by integrating genome-wide association studies (GWAS) and known oncogenes. We analyzed public databases to identify genes harboring single nucleotide polymorphisms (SNPs) associated with gastric pathologies and driver genes in gastric cancers. Using this approach, we identified 37 genes from GWA studies and 61 oncogenes, which were used with our 55-gene signature to map gene-gene interaction networks. In conclusion, our analysis defines a unique gene signature driven by H. pylori-infection at early phases and that remains relevant through different stages of pathology up to gastric cancer, a stage where H. pylori itself is rarely detectable. Furthermore, this signature elucidates many factors of host gene and pathway regulation in infection and can be used as a target for drug repurposing and testing of infection models suitability to investigate human infection.
Introduction
Helicobacter pylori colonizes the stomach of approximately half of the world’s human population. This colonization is mostly asymptomatic, but in some cases an immune response is initiated that may cause chronic inflammation of the gastric mucosa and can lead to various severe conditions such as peptic ulcer disease and gastric cancer (1, 2). H. pylori antibiotic resistance, a major cause of failure of eradication therapy, is increasing, and the World Health Organization (WHO) has listed H. pylori accordingly among bacteria that urgently need new therapies. This highlights the need for new efforts to understand the mechanisms underlying H. pylori transmission, colonization, pathogenesis, and treatment failure. The development of gastritis and subsequently gastroduodenal ulcer diseases and cancer is a multifactorial process, and both the environmental and genetic background of the patient contribute (3). Previous Genome-wide association studies (GWAS) have been able to identify genetic polymorphisms in the toll-like receptor (TLR) locus that correlate to patients’ H. pylori seropositivity. Furthermore, these patients showed high expression levels of TLR1 (4). Other studies have identified an association of polymorphisms in the TLR5 gene with atrophic gastritis (5) as well as other autoimmune reactions (6). These studies hint at a complex regulatory network for disease progression during H. pylori-infection. This network may be mostly controlled through environmental factors, bacterial pathogenic antigens such as CagA or VacA, and also the patients’ genetic background and immune response to the infection. Further gene expression studies from human patients and experimental models have elucidated many of the molecular mechanisms relevant to H. pylori pathogenicity and the pathways related to the various disease stages. However, their results remain indecisive as they show a variable picture, most likely due to low sample numbers in individual studies or variations in disease stage and severity in analyzed samples (7, 8). A powerful model to study a tissue and cell specific reaction to H. pylori especially at the different stages of the pathology is the use of cell lines or animal models. Such studies have elucidated many factors that contribute to disease pathogenesis. The problem of limited reproducibility for some of the identified gene signatures in human patients however remains (9), and contradictory results depending on the cell line and infection conditions have been reported (10). The use of adenocarcinoma cell lines is also limiting because many of the primary cell transitions would be hard to detect, and the suitability of cellular systems to imitate the host’s reaction to the infection is difficult to predict purely on the basis of such biological studies.
Recently developed tools and databases of GWA studies have enabled the collective analysis of diseases’ genetic variants across many samples, which facilitates the discovery of the molecular bases of this association between various diseases and genetic polymorphisms (11–13). This is particularly relevant for reconstructing upstream signals that lead to disease specific gene signatures. A practical approach towards heterogenic disease gene signatures that may develop due to technological bias or experimental factors is to reanalyze these studies with different computational and statistical methods that compensate for these differences. This approach has been very successful in harmonizing the analysis of different studies, by allowing the use of large sample numbers and thereby permitting the identification of novel markers for various diseases (14–16). New associations between different pathologies such as infection and autoimmunity have also been found through such approaches (17–19). Combining genomic and transcriptomic analyses can help better understand the molecular pathways and processes associated with H. pylori infection and define disease signatures associated with different stages of disease development. Such a tool could improve patient diagnosis and treatment efforts. Furthermore, comparing gene signatures of human patients with signatures obtained from different cell lines might close the gaps between both signatures and permit assessment of the suitability of cell lines for investigating phases and pathways in infection and disease.
Methods
Collection of Gene Expression Data
Collection of the meta-analysis data was carried out by searching public expression databases (NCBI GEO and Array Express) (accessed August 2020). For the GEO query we used the following search terms: “Helicobacter pylori” and the filters [organism (Homo sapiens)], study type (expression profiling by array), entry type (Dataset/Series). The Array Express query was executed using the following search terms: “Helicobacter pylori” and the filters [organism (Homo sapiens)], experiment type (array assay). Initially 55 entries from GEO and 34 entries from Array Express were retrieved. Duplicates and irrelevant studies were excluded, and 32 studies remained. These studies were further refined using the following inclusion criteria to arrive at the four final studies as discovery and six other studies that were assigned for validation. We included only studies that had analyzed gene expression in gastric biopsies or relevant human cell lines. Only datasets with available raw data were included. For the human samples, uninfected healthy controls had to be available in each dataset. The patients’ H. pylori infection status had to be known, and we accepted studies where at least one of the following diagnostic tests for H. pylori had been performed: rapid urease test, culture, serologic analysis, histopathological analysis. For cell line studies, we only included experiments from wildtype cell lines infected with wildtype H. pylori (host cell or bacterial mutants and other Helicobacter species were excluded). Studies including gastric organoids were not included due to different culture conditions in comparison to standard cell lines. Experiments using infection times between 16 and 24 h were included; studies using longer or shorter infection periods were excluded to ensure reasonable comparison. For adenocarcinoma, normal and tumor tissue had to be available in the same study to be considered. The database-search followed the Preferred Reporting Items of Systematic reviews and Meta-Analyses (PRISMA) statement and is documented in the PRISMA Flow Diagram (20) (Supplementary File 1). Only datasets with available raw data were included. After a thorough search and excluding datasets as specified above, four datasets for Human samples (GSE27411, GSE60427, GSE60662, and GSE5081) and four cell line infection datasets (GSE60661, GSE70394, GSE74577, and GSE74492) (7, 21–27) were selected for further analysis. A total of 98 human samples were considered for downstream analysis of the discovery steps, containing data from 72 helicobacter-infected/gastritis/atrophy/metaplasia patients, and 26 healthy controls. Two datasets detected through the search process with gastric adenocarcinoma (E-MTAB-1440 and GSE65801) were collected for the validation process (28, 29). A second search was performed to detect further gastric cancer datasets for the validation process. GEO was mined using the following search terms: “gastric cancer” and the filters [organism (Homo sapiens)], study type (expression profiling by array). This search yielded 280 entries, which were vetted to detect datasets having cancer and normal tissue, a sufficient number of samples, and raw expression data. Ten datasets matching our criteria were chosen to further validate our gene-signature (30–37).
Determination of Helicobacter pylori-Induced Pathologies Score and Validation in Cell Line Model
We used R programming language (version 4.0.2) (38) and the “MetaIntegrator” package (39), which utilizes a gene expression meta-analysis workflow described by Haynes et al. (40). In summary, the MetaIntegrator approach computes a Hedges effect size for each gene in each dataset. These effect sizes are then pooled across all datasets using a random-effect model by assuming that results from each study are drawn from a single distribution and that each inter-study difference is a random effect. The approach computes the log sum of p-values that each gene is up/down-regulated, then combines the p-values using Fisher’s method and finally performs Benjamini-Hochberg false discovery rate (FDR) correction across all genes (41). In our analysis, a gene is considered to be differentially expressed if the absolute value of its effect size is greater than zero, the FDR is less than 5% across all training datasets and it is significantly up/down-regulated in all of the four training datasets with a heterogeneity P-value cutoff of 0.05 (42). To optimize the initial gene signature, we performed a Forward Search process by taking the initial gene set, adding one gene at a time and calculating the weighted Area Under the ROC curve (AUC) resulting from the addition of this gene. Weighted AUC is calculated as: W.auc=S.auc×n, where W.auc is the weighted AUC, S.auc is the sum of AUC of each dataset and n is the number of samples in this dataset. This process is repeated for each gene until the stopping threshold (0 in our case) is reached and the final set of genes will be those that contributed the most to the weighted AUC. We tested performance and consistency of the original gene signature in four independent cell line datasets (GSE39919, GSE70394, GSE74577, and GSE74492). All discovery steps were conducted on the training datasets only.
Integrative Pathway Analysis
Functional Enrichment analysis for the original MetaIntegrator signature was performed using the Enrich R package against the following databases: GO Biological Processes (GO BPs), GO Molecular Functions (GO MFs), GO Cellular Components (GO CCs), and KEGG. Upstream signaling pathways were extracted using the Signaling Pathway Enrichment using Experimental Datasets (SPEED) web-tool (43). Enrichment for upstream pathways using a list of either upregulated or downregulated genes was tested using the Bates distribution test. In comparison with pathway membership based methods such as Reactome (44) and gene ontology, SPEED offers some advantage due to its ability to infer causative upstream signals. Its overall performance is compatible with GSEA when using the Bates test (43).
Identification of Differentially Expressed Genes in Individual and Collective Datasets Using Limma and NetworkAnalyst
The datasets were retrieved from the NCBI GEO database using the GEOquery R package (45). Processing of individual datasets was carried out using the limma R package (46). Human gastric biopsies datasets were normalized using log2 transformation and genes with an adjusted p-value of < 0.05 using the Benjamini–Hochberg method were considered for downstream analysis. Different gene IDs were converted to the official gene symbols or Entrez IDs either through the AnnotationDbi R package (47) or DAVID (Database for Annotation, Visualization, and Integrated Discovery) (48). Meta-analysis of human samples was conducted with the web-based tool NetworkAnalyst (49, 50). For each individual dataset we carried out Log2 transformation with autoscaling and inspected possible outliers using principle component analysis (PCA). The individual analysis of each dataset was carried out using the Benjamini–Hochberg’s False Discovery Rate (FDR) with cut-off p-values of <0.05. The microarray chip identifiers were annotated to other suitable Gene IDs including Entrez Gene identifiers, and datasets were merged after annotation. A suitable identification condition for each sample was assigned where only healthy uninfected samples were assigned to the control group and all other conditions (H. pylori-infected, gastritis, erosions, atrophy, metaplasia) were assigned to the case group. To ensure unbiased comparative analysis of the different datasets, the batch effect was adjusted through the ComBat batch effect method integrated in NetworkAnalyst and was investigated before and after adjustment through principle component analysis. The size effect method was used to identify DEGs between the cases and controls. Cochran’s Q test was used to estimate the statistical heterogeneity to identify the most suitable effect size model between the fixed and random effects models (FEM and REM). Depending on the Cochran’s Q test results REM was used to identify DEGs, which usually gives more conservative but reliable results. A discovery significant value of <0.05 was used to identify DEGs. NetworkAnalyst integrated visualization tools were used to create heatmap of DEGs. Genes were clustered using single linkage method.
Identification and Validation of the Refined Gene Signature
Intersection between the MetaIntegrator and NetworkAnalyst gene signatures was carried out through InteractiVenn (51). The refined 55-gene signature was tested in 12 independent gastric cancer datasets. We used both the Area Under the Receiver Operating Characteristic Curve (AUC), and the Area Under the Precision-Recall Curve (AUPRC) as evaluation metrics.
Genome-Wide Association Studies Data Collection and Analysis
Collection of GWAS data was carried out by searching the NHGRI GWAS catalog database using the keyword “Helicobacter pylori”, “Gastritis”, or “Gastric cancer” (52). In total 64 SNPs were considered for further analysis. The corresponding genes were identified, and the nearest upstream and downstream genes were selected for intergenic variants. Genetic variants were annotated using the HaploReg v4.1 tool (53). Further gastric cancer driver genes were gathered from the IntOGen database (54). In total 61 genes were discovered through the database research.
Hub Genes Network Analysis
Protein-protein interaction (PPI) networks were generated using the IMEx Interactome innateDB database (55). A gene list with the 55-gene signature, the 37 GWAS genes, and the 61 gastric cancer driver genes was used for the analysis. A first-order PPI network was generated consisting of 2973 nodes (Proteins) and 5297 edges illustrating the interaction between these genes. To focus on key regulators of this network we curated a zero-order PPI network with 49 nodes and 81 edges including only direct interaction between the seed proteins. Nodes were ranked based on the number of connections they have to other nodes (degree) and the number of shortest paths going through them (betweenness centrality) (56).
cMAP Analysis
To find potential compounds that induce a similar or opposing gene expression pattern as our H. pylori-gene signature we used the Connectivity Map analysis (CMAP, https://www.broadinstitute.org/cmap/) (57, 58) as described before (59). The query yields a ranked list of various perturbagen’s signatures based on a connectivity score between − 100 to 100 where the positive scores indicate expression signature similarity between the perturbagen’s and the query signature and the negative score implies an opposing impact. The 55-gene signature (up- and down-regulated) was used to query the CMap database resulting in a connectivity score matrix of 8559 perturbations.
Data Accessibility
All datasets used in this study are publicly available on the Gene Expression Omnibus (GEO) and ArrayExpress under the corresponding accession number. The code for this analysis is available on GitHub and can be accessed using the following link: https://github.com/Tarek-Badr/Comprehensive-Integration-of-GWAS-and-Gene-Expression-studies-in-H.pylori-induced-Gastric-Disease
Results
Data Acquisition
From the initial datasets acquired by searching public databases, eight matched our predetermined inclusion criteria (see Methods), four for human gastric biopsies – of non-cancerous origin- and four for three different cell lines. The four human gastric biopsies datasets included in the downstream analysis were used for the discovery of gene-signature and contained samples from 98 human samples, including data from 72 H. pylori-infected/gastritis/metaplasia patients, and 26 healthy controls. Twelve gastric cancer datasets were included for the validation process. The data summary of the included datasets is shown in Table 1.
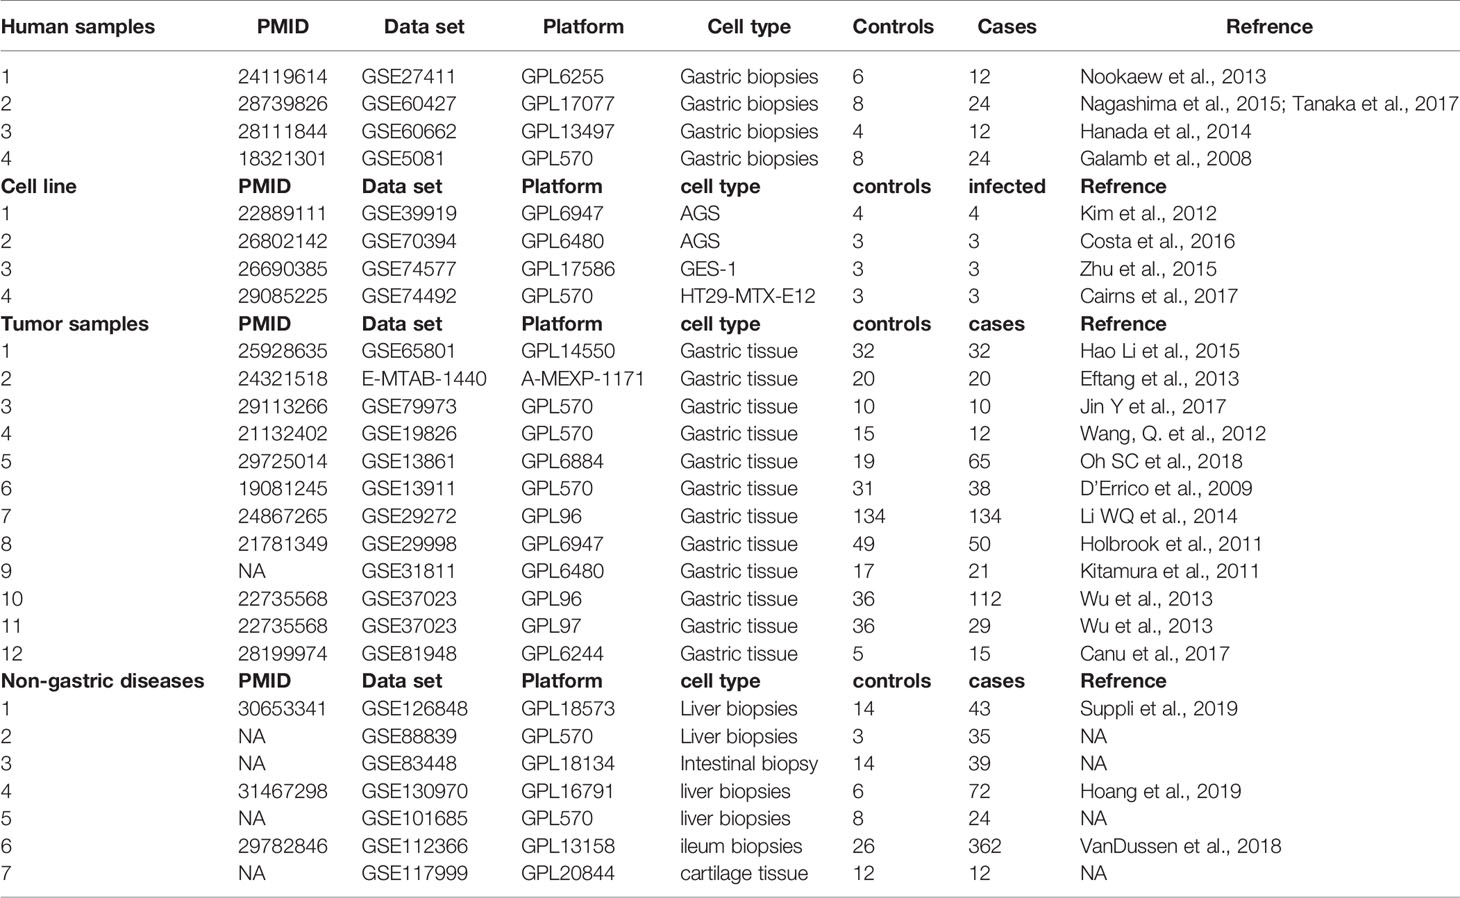
Table 1 Summary of the datasets integrated in the meta-analysis pipeline and prediction and validation of the gene signature.
Discovery and Validation of Gene Set Predictive Score Matching Cell Line Infection Models to Human Pathology
To detect stably host-deregulated genes across various stages in H. pylori-induced gastritis, we compared healthy controls (controls) to samples from gastritis, atrophy, erosions, and metaplasia (cases). The initial meta-analysis resulted in the identification of 881 DEGs (294 up-regulated and 587 down-regulated genes). We refined this initial signature by using a forward search process, which resulted in the identification of 427 DEGs (225 up-regulated and 202 down-regulated genes (Supplementary Table 1). Our gene signature distinguished healthy controls from patients with a pooled area under the curve (AUC) = 0.948 [95% confidence interval (CI) 0.858−1] in the discovery datasets (Figure 1A). Violin plots of the performance of the signature in each discovery datasets shows the significant score difference between cases and controls (Figures 1B–E)
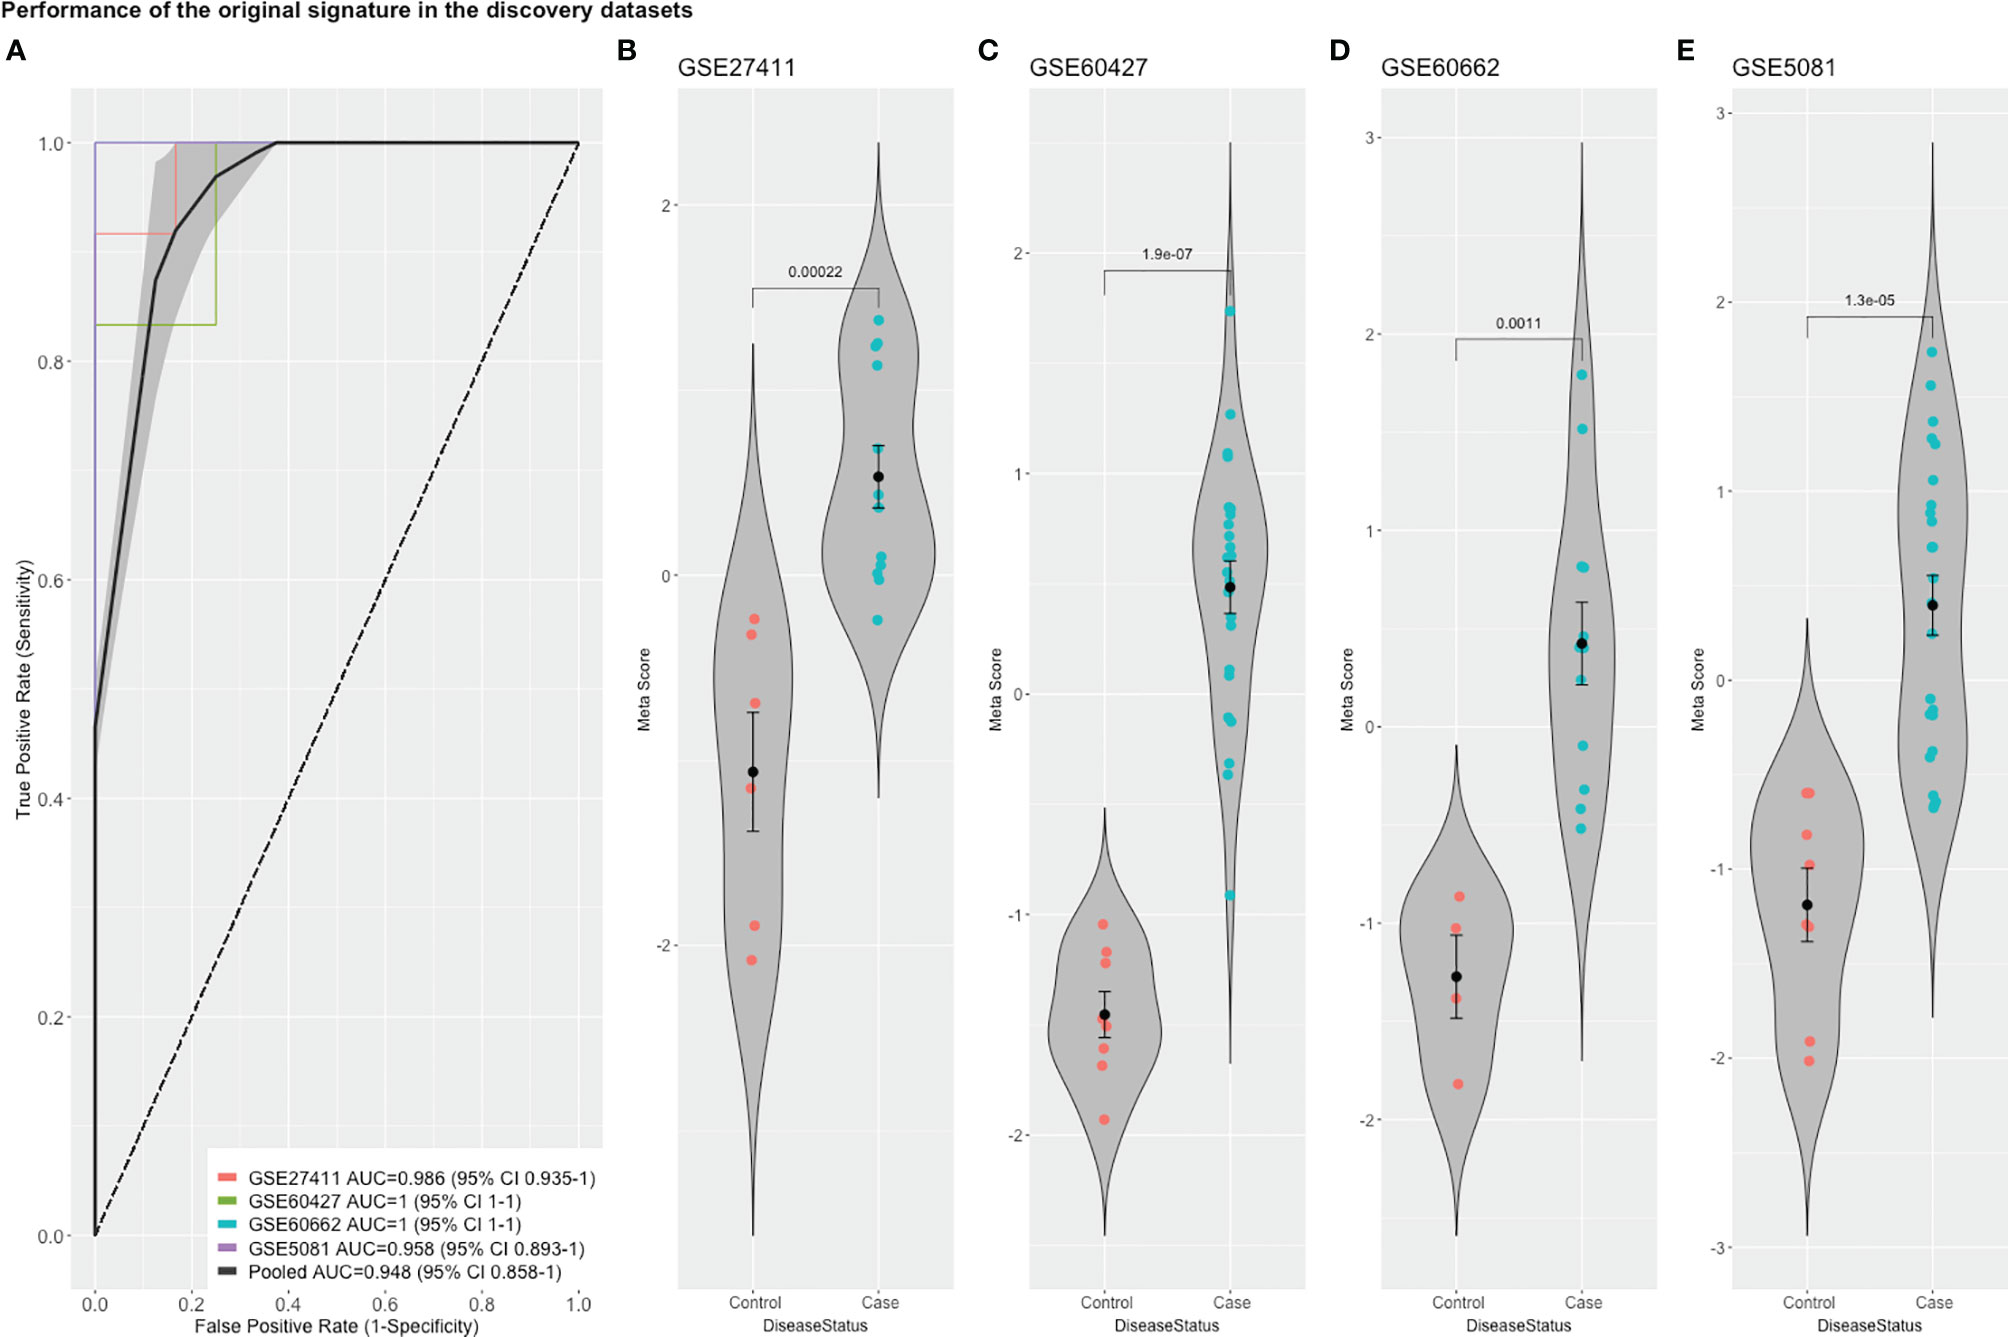
Figure 1 The performance of the original signature in discovery datasets. (A) ROC curves of the comparison between cases and controls with the pooled AUC (area under the curve) in the four training datasets. (B–E) violin plots of the difference in the signature meta-scores in each training dataset between cases (gastric disease) and healthy controls with each point representing a sample. Shown are p-values from Wilcoxon test.
To match this gene signature curated from human samples to gene expression in different model cell lines, we tested the capability of the gene signature to distinguish infected from uninfected samples. The Human gene signature was able to distinguish infected samples in AGS and HT29 cell lines sufficiently with AUC = 1 in GSE39919 (AGS) and GSE74492 (E12), and AUC = 0.889 in GSE70394 (AGS) suggesting similarity of their gene signature to human gastric signature and their suitability to hypothesis testing and experimentation in comparison with human pathology (Supplementary Figures 1A, B, D). Interestingly our signature underperformed in distinguishing infected samples in the tested GES-1 dataset (GSE74577) (Supplementary Figure 1C). This was surprising: the GES-1 cells are derived from SV40 transformed human fetal gastric epithelial cells, which intuitively may be considered relatively close to primary cells (60). The gene expression analysis however suggests substantial differences to human gastric tissue. Further cell line experiments with larger sample numbers will be required to elucidate definitive similarities and differences between these in vitro models and the human gastric disease.
Identification of Enriched Pathways and Upstream Signaling Activity
To understand the molecular basis and biological effect of the curated gene signature we searched for enriched pathways and gene ontologies using the KEGG and GO databases.
Unsurprisingly, immune defense related pathways and cytokine response related pathways were among the most highly enriched pathways as previously described (61). Among the most downregulated pathways were mitochondrion and mitophagy related terms, as well as various cell metabolism pathways as ATPase activator activity, mineral absorption, and folate biosynthesis.
Searching for upstream signaling impact through our gene-signature through the SPEED analysis showed upregulation of IL-1, TNF, and H2O2 regulated genes (Figure 2A) which has been shown to induce epithelial mutagenesis (62). At the same time, this analysis permitted identification of genes known to be down-regulated by IL-1, TNF, and TLR-signals (Figure 2B). This is strong evidence that these pathways are up-regulated during H. pylori-infection. On the other hand, p53 and PPAR signaling seem to be downregulated. A list of top 10 over/underrepresented pathways in each category as well as results of SPEED analysis are shown in Supplementary Table 2.
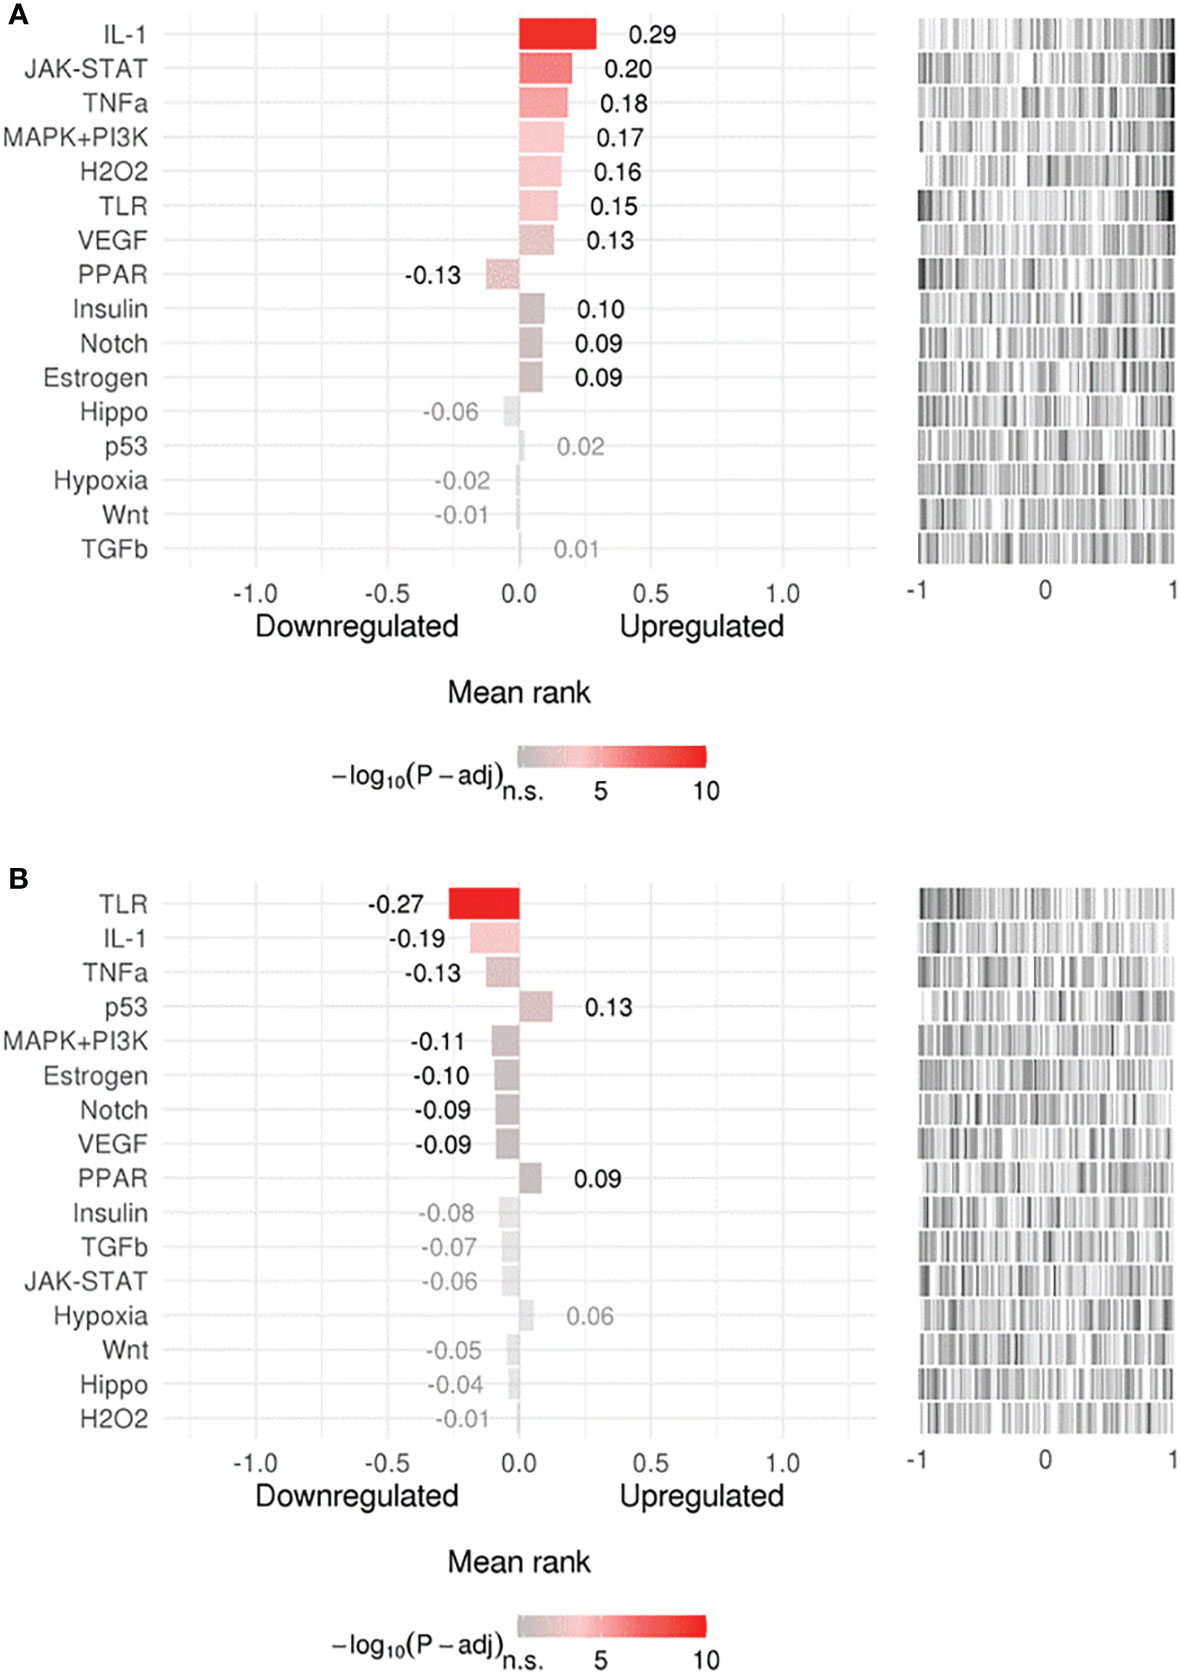
Figure 2 Upstream signaling pathways enrichment. Enriched upstream signals were tested in (A) upregulated or (B) downregulated genes using the (SPEED) web-tool. The x axis represents z-scores between –1 and 1 representing the rank of up- and down-regulated genes per pathway experiment. Bar graph values represent mean rank of our query gene-list for each pathway and bar colors represent adjusted p-values. Distribution of the used gene list is shown as a barcode plot on the right side of each pathway where each black bar represents a query-gene. The mean rank shift of each pathway was tested using the Bates test.
Identification of a Common Gene Expression Signature in Helicobacter pylori-Related Pathologies Using Random Effect Models
To further stratify and refine our gene signature, we used another pipeline to determine DEGs in the discovery datasets. The individual dataset gene expression normalization was carried out using the NetworkAnalyst log2 transformation function, followed by autoscaling. The individual datasets were inspected with PCA plots before and after ComBat method normalization, and PCA plots of gene expression data of the four datasets before and after normalization and after gene expression analysis are shown in Supplementary Figures 2 and 3 respectively. No major differences were seen that could be attributed to differences in dataset platforms or conditions and that could have introduced a bias. Based on the Cochran’s Q test analysis (Supplementary Figure 4) we used the REM to identify 263 genes significantly deregulated among the different human cohorts between patients and healthy controls (p<0.05 in the REM) (Supplementary Table 3). A heatmap of the most highly differentially regulated genes is shown in (Figure 3). Using this method, we see many genes identified as deregulated that were not detectable in their respective individual datasets (Supplementary Figure 5).
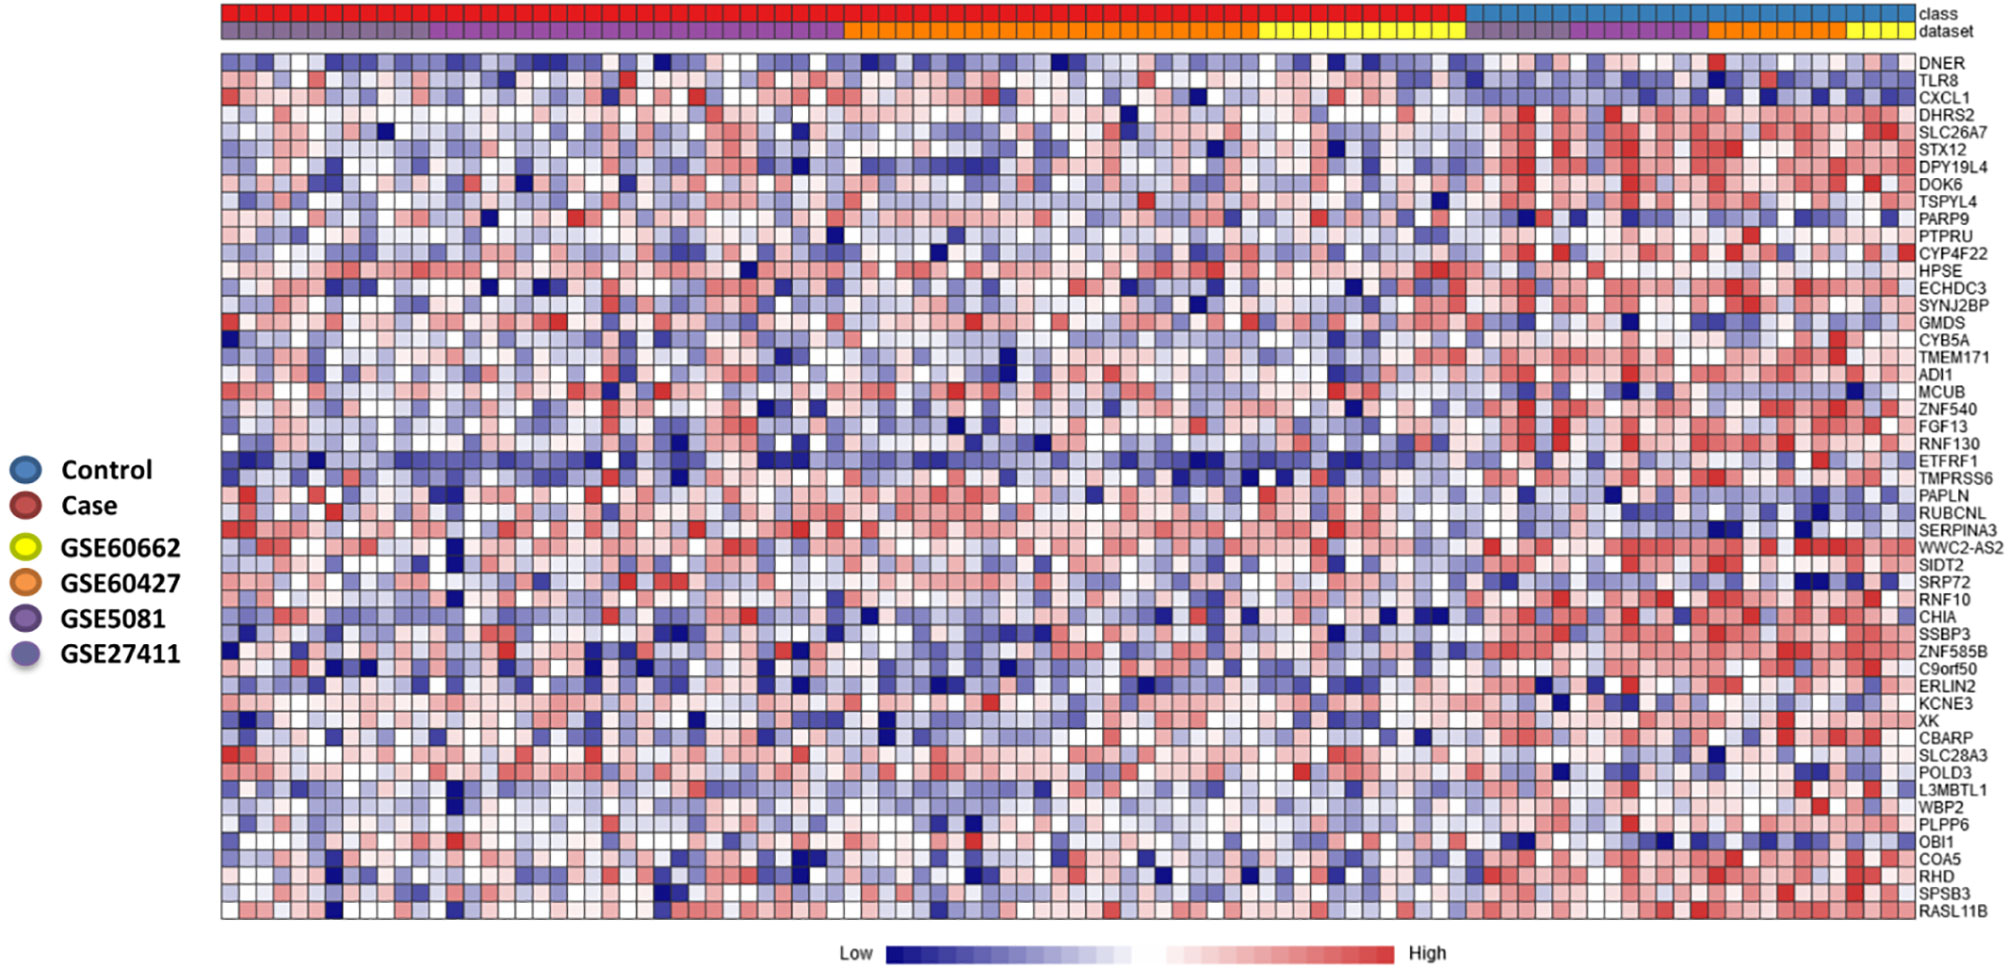
Figure 3 Heatmap of most significantly differentially expressed genes. Heatmap showing the relative expression of the 50 most significantly differentially expressed genes (DEGs) of the 263 significant DEGs identified through the meta-analysis, where 182 genes were co-up-regulated, and 81 genes were co-down-regulated (case versus control). The heatmap indicates the normalized expression value of each DEG in the individual samples, and genes were clustered based on their condition (cases vs controls) and their original datasets. The heatmap was created by the visualization module in NetworkAnalyst, where genes with p-value < 0.05 in the Random Effect Model analysis were considered significant.
Intersection of Gene Sets Curated Through Two Meta-Analysis Pipelines
Comparing this newly curated gene set with our original signature, we identified 55 genes in common between the two independent training methods; of these, 31 genes were up-regulated and 24 genes were down-regulated (Supplementary Figure 6). Representative forest plots of the five most up- and down-regulated genes from the 55-gene intersection signature can be seen in (Figure 4) and a list of the 55-gene signature can be found in Table 2. This refined gene signature was used for further analysis and validation. We validated this 55-gene signature in the four original discovery datasets to see if it is sufficient in distinguishing patients from healthy controls. Despite the lower gene number in comparison with the original signature and the sample heterogeneity due to dataset origin and inclusion criteria, this gene signature was able to identify patients in the four discovery datasets (Pooled AUC = 0.934 [95% CI 0.825−1]) (Figure 5A).
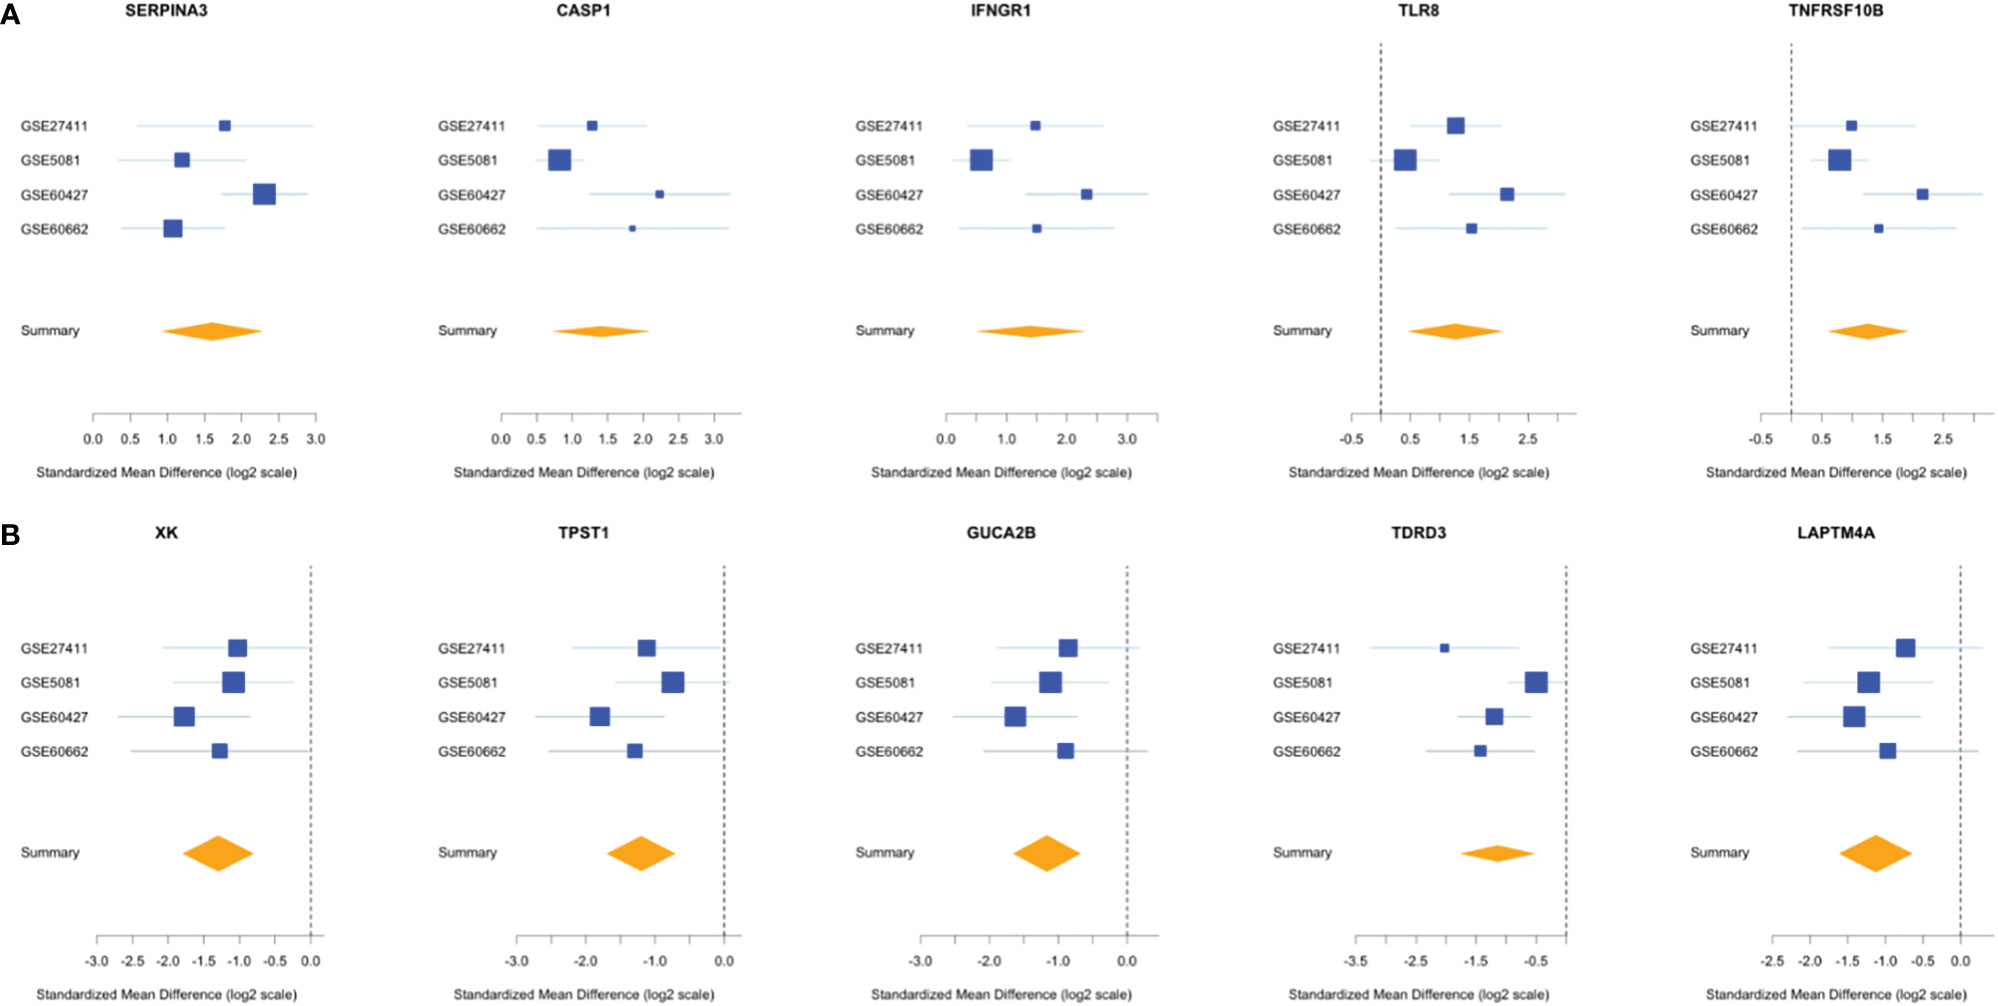
Figure 4 Forest plots of the 5 most up- and down-regulated genes in the intersection gene-signature. The x axis represents standardized mean difference between cases and controls for each gene. The blue rectangles’ size is oppositely proportional to the standard error of the mean in this study and their whiskers represent the 95% CI. Orange diamond represents combined mean difference of the represented gene across all studies where its width gives the 95% CI of the overall combined mean difference. (A) Five most upregulated genes; (B) five most downregulated genes.
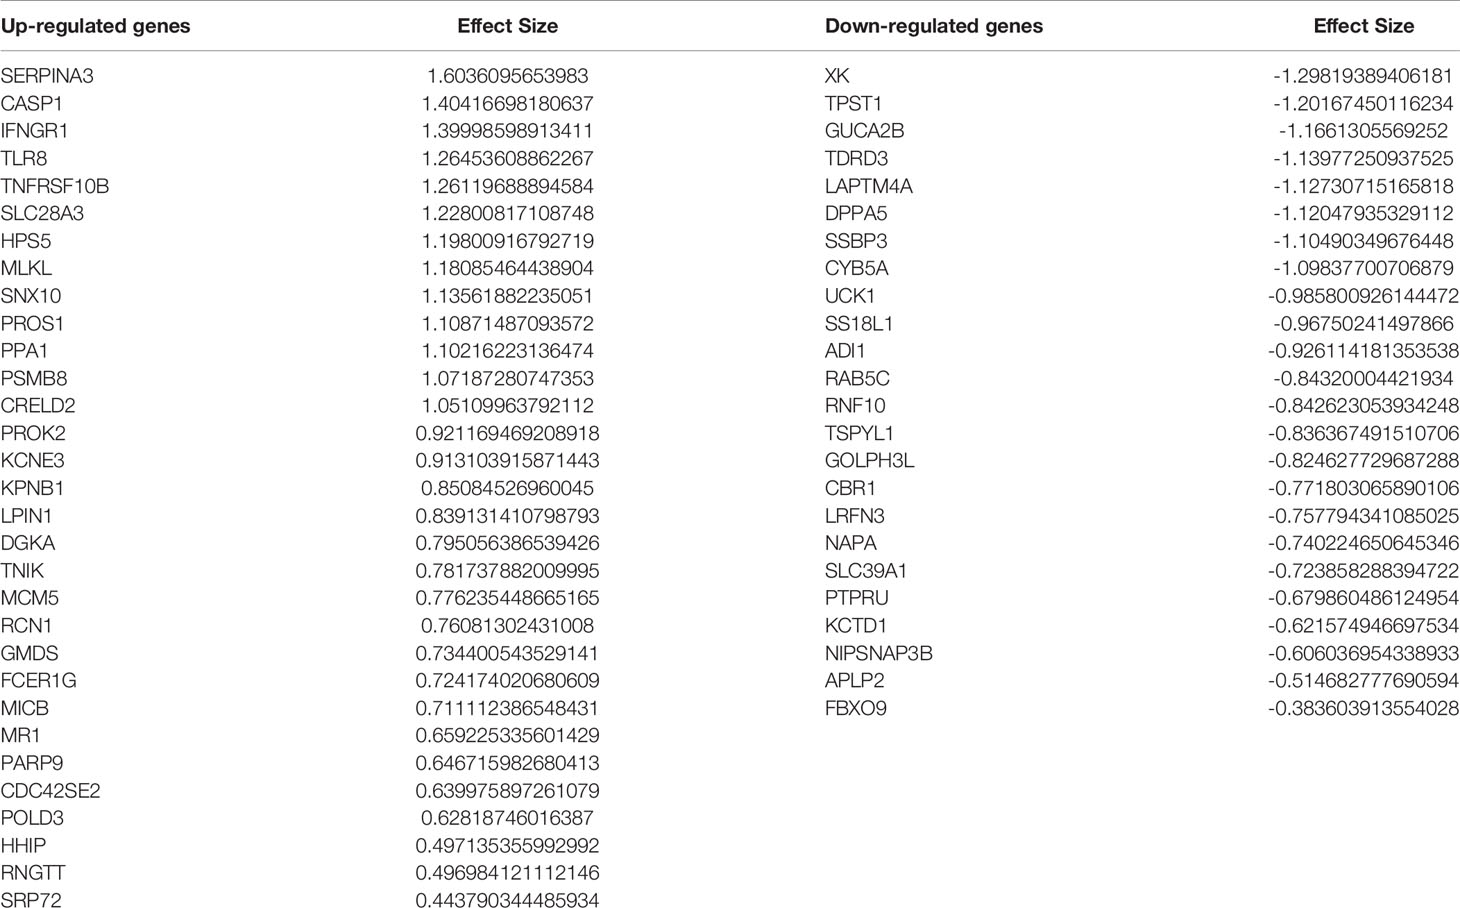
Table 2 Fifty-five–gene signature identified through intersection of the two meta-analysis pipelines.
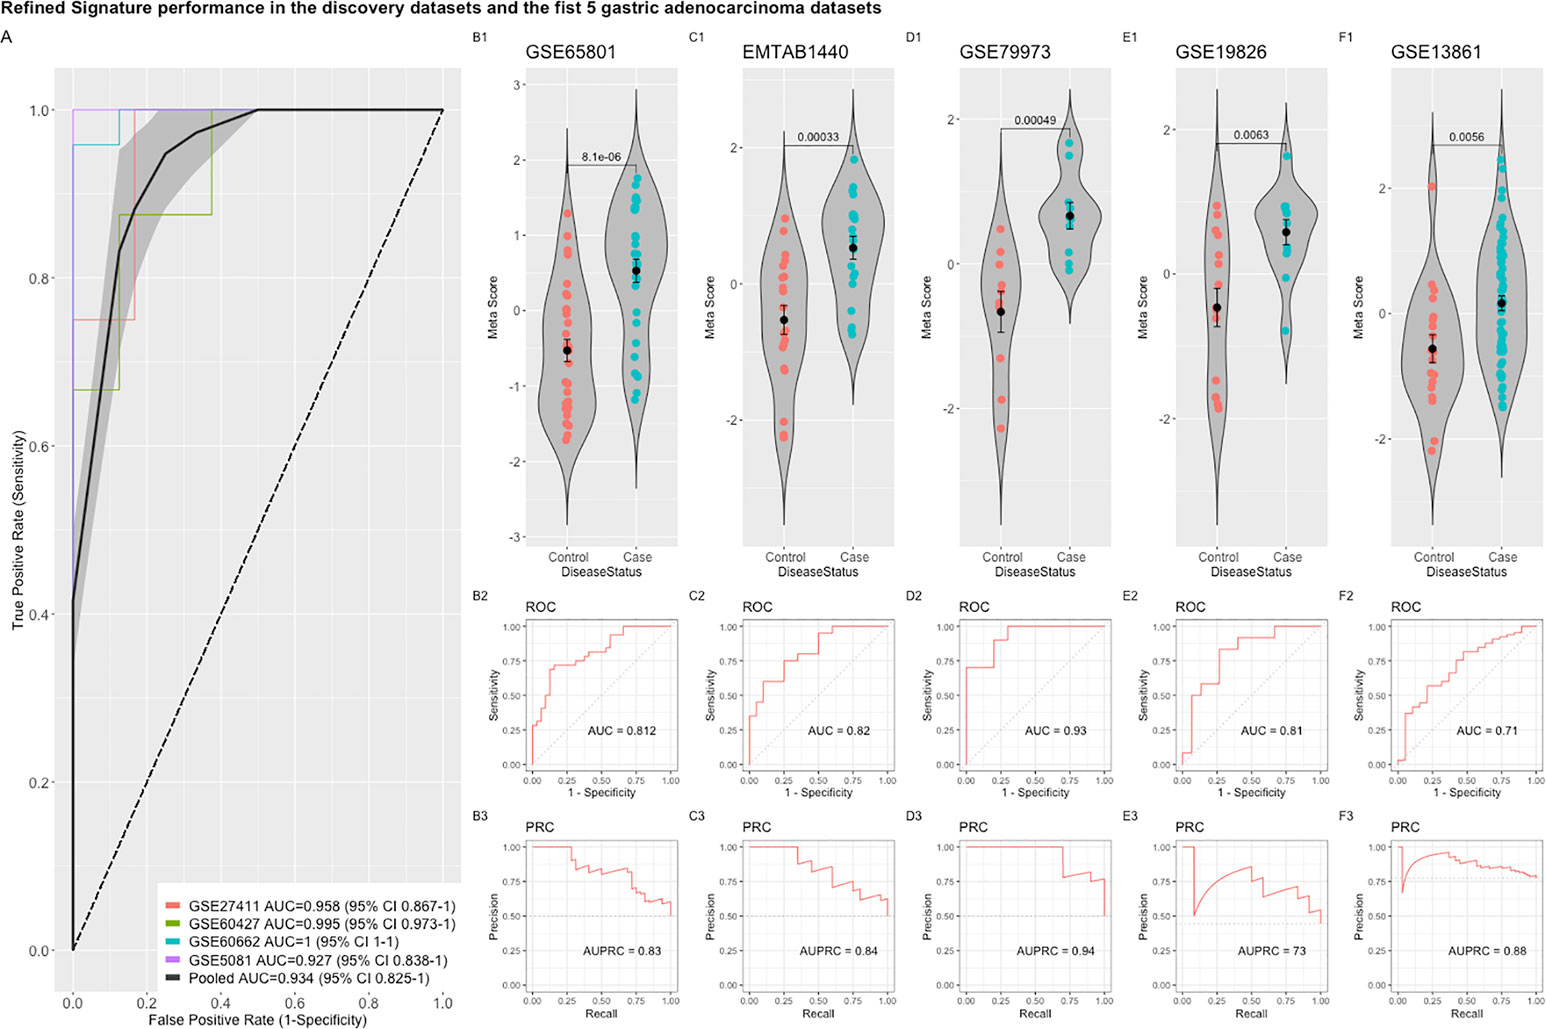
Figure 5 Performance of the refined 55-gene signature in the five independent gastric adenocarcinoma datasets. (A) The pooled AUC in the four training datasets. (B–F) The performance of the refined signature in the five independent gastric cancer datasets. The upper panel shows a violin plot of the difference in the refined signature meta-score between cases (gastric adenocarcinoma) and controls with each point representing a sample. The middle and lower panels show the Area under the ROC Curve (AUC) and the Area under the Precision Recall Curve (AUPRC), respectively.
The refined 55-gene signature scored very well in distinguishing gastric cancer samples from normal tissue in all tested datasets with AUC values between (0.71–0.93). Moreover, the newly calculated meta-score of the refined signature was significantly higher in cancer samples against controls in all datasets, proving its capability in distinguishing gastric cancer tumor from controls, even when the signature comes from precancerous lesions (Figures 5B–F; 6A–G). To explore the potential role of our 55-gene signature in other inflammatory diseases we tested its performance in both epithelial and non-epithelial diseases (Supplementary Figure 7). The gene signature underperformed in inflammatory diseases of hepatocellular origin such as fatty liver disease, liver adenoma or hepatocellular carcinoma with AUC values between 0.14 and 0.36. In other bowel inflammatory diseases such as Crohn’s disease, the signature showed a decent performance with AUC values (0.63-0.665).
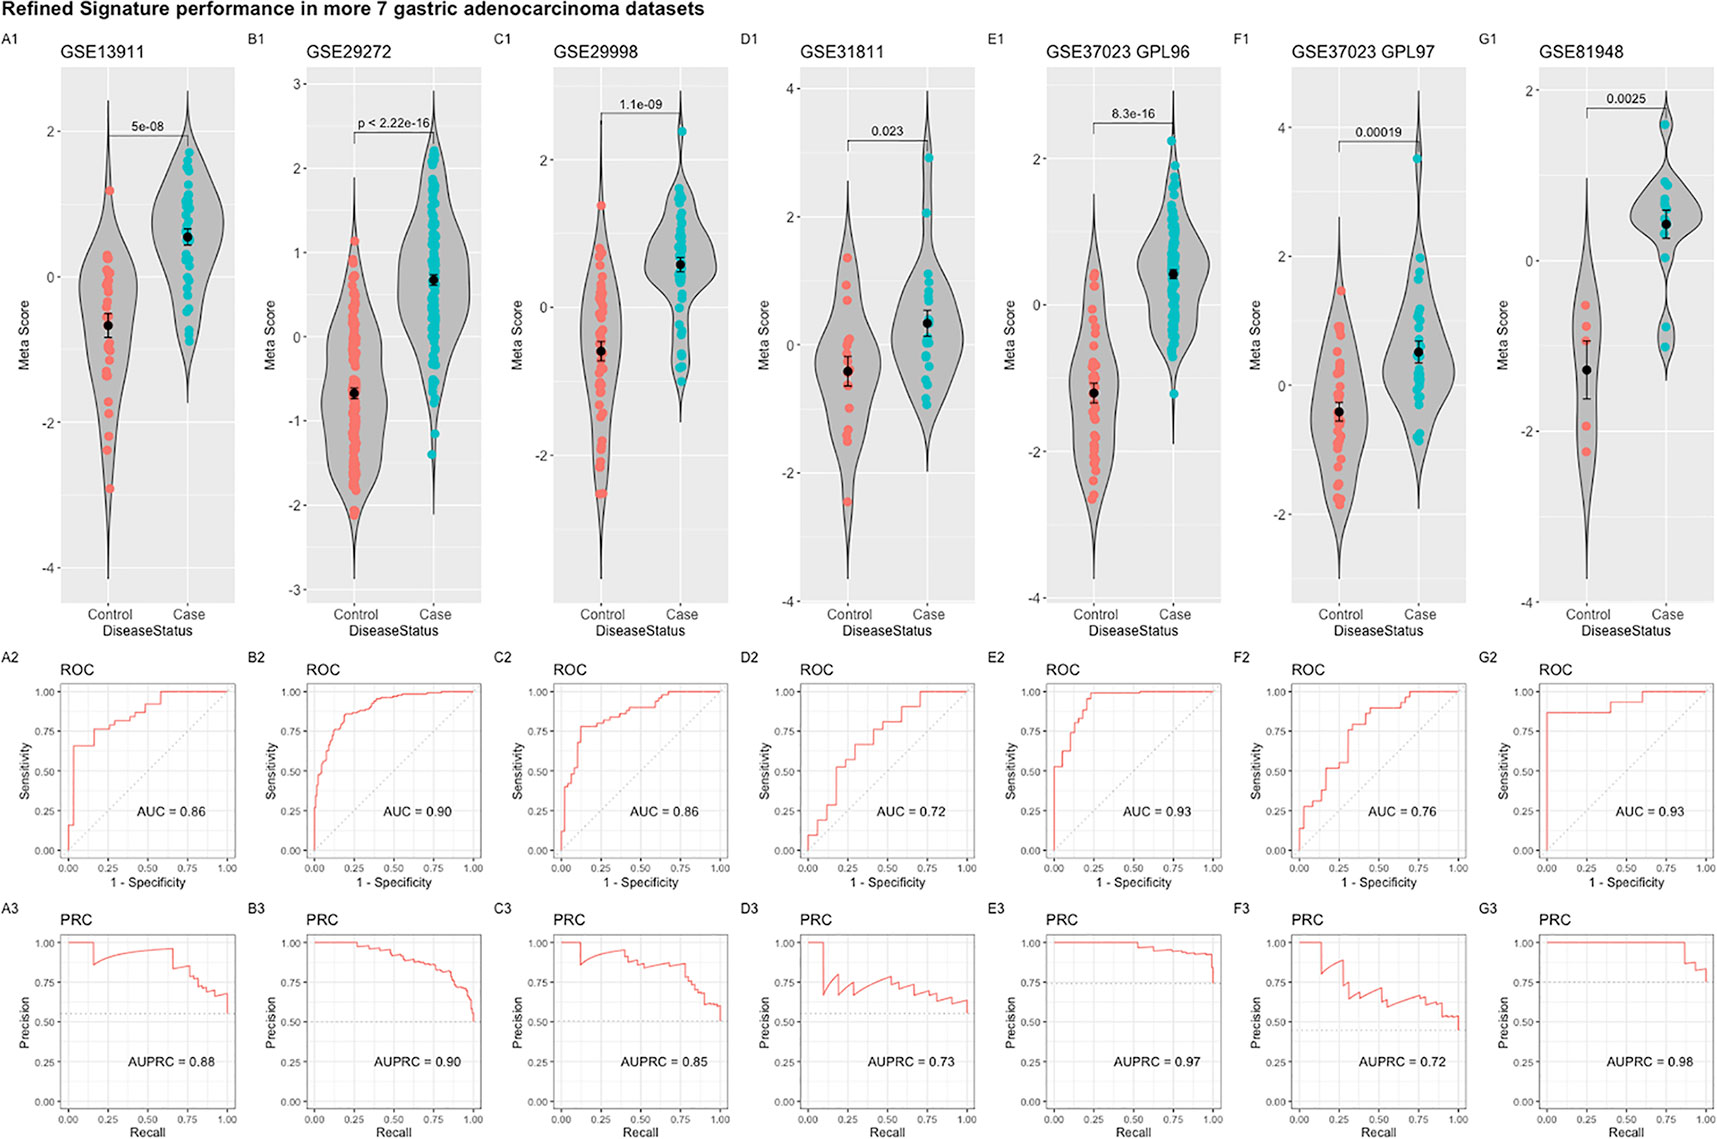
Figure 6 Performance of the refined 55-gene signature in the seven independent gastric adenocarcinoma datasets (A–G). The upper panel shows a violin plot of the difference in the refined signature meta-score between cases (gastric adenocarcinoma) and controls with each point representing a sample. The middle and lower panels show the Area under the ROC Curve (AUC) and the Area under the Precision Recall Curve (AUPRC), respectively.
Genome-Wide Association Studies Catalog Single Nucleotide Polymorphisms Identification and Functional Annotation
Mining the NHGRI GWAS catalog database yielded 64 SNP entries associated with Helicobacter pylori status or gastric related pathologies. All variant related information can be found in Supplementary Table 4. All identified variants could be successfully annotated through the HaploReg tool resulting in 45 unique SNPs in 37 unique genes that were used for downstream analysis. From the coding variants, five were missense mutations in the genes PLCE1, CHD6, SEBOX, HABP2, and MTX1. Detailed functional analysis can be found in Supplementary Table 5.
Cross-Linking Genome-Wide Association Studies With Helicobacter pylori-Gene Signature Through Hub Genes Network Analysis
Our curated 55-gene signature represents the downstream effect of the Helicobacter-induced pathology. Linking it with upstream causal and cancer driver genes will be of great benefit to understand the regulation network of this signature and the interactions between its players. We performed a network-based analysis to investigate the interaction between the 55-gene signature, genes harboring polymorphisms associated with Helicobacter and gastric pathologies, and known gastric cancer driver genes. This analysis identified key hub genes among the most highly deregulated genes (Figure 7). The tumor suppressor gene tumor protein p53 (TP53) has the largest interaction with other cancer driver and downstream deregulated genes. Many of the deregulated genes seem to be directly connected to GWAS or cancer driver genes such as TLR8, CASP1, and TNFRSF10B. The data suggest that the genes that are deregulated in H. pylori-infection are linked to the activation of oncogenes.
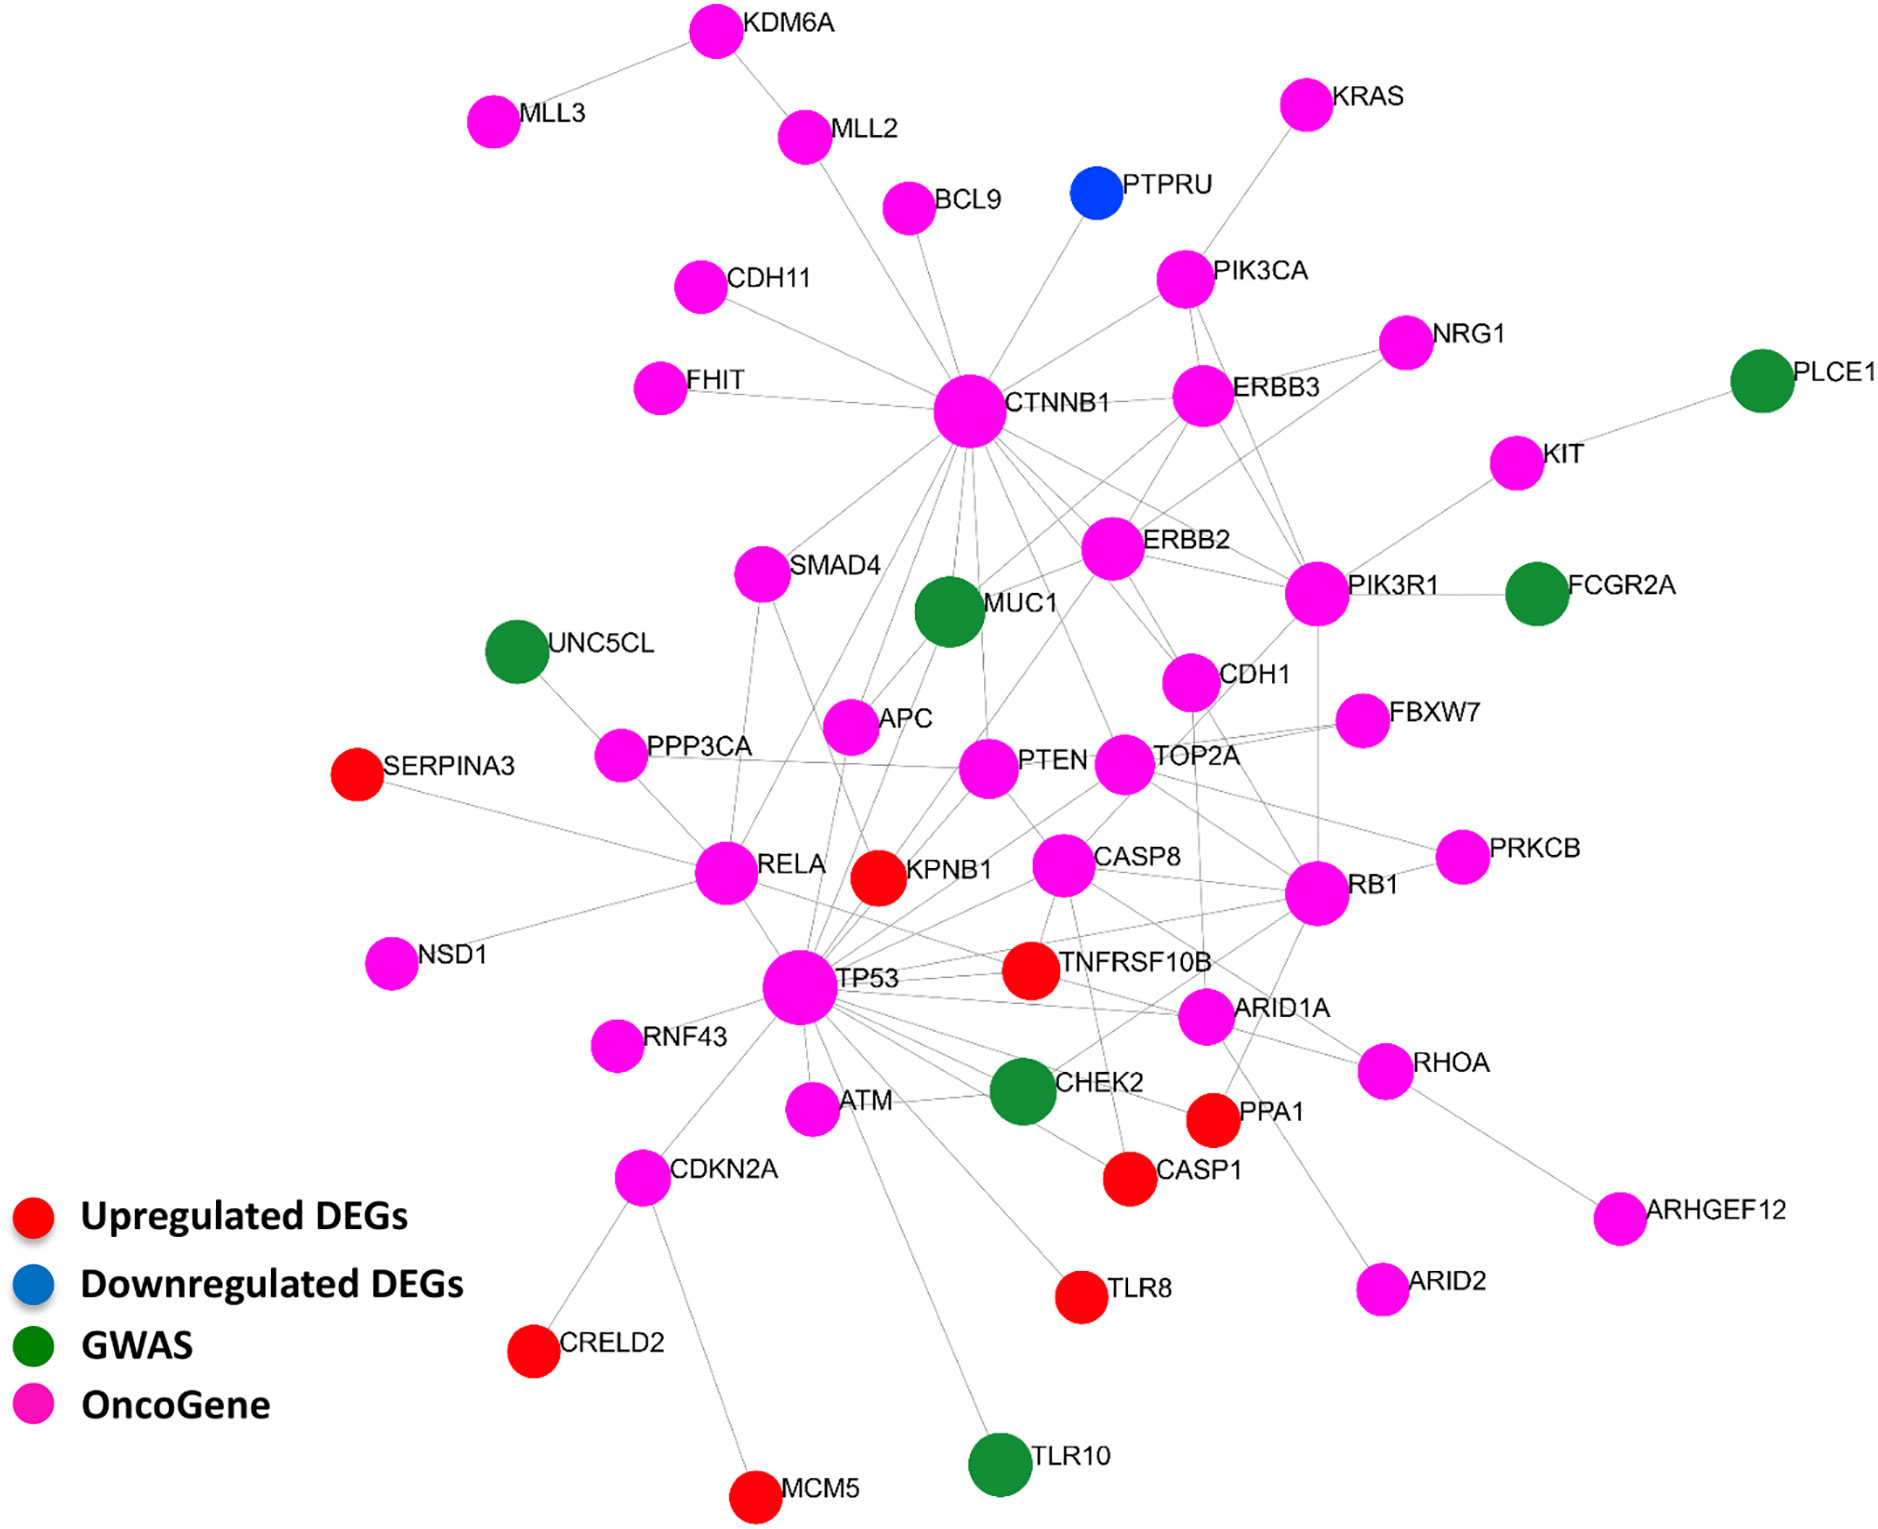
Figure 7 Interactions between signature derived genes and genome-wide-associated and cancer driver genes. The genes of the 55-gene signature were integrated with 37 GWAS and 61 cancer driver genes in NetworkAnalyst tools to visualize gene interactions. A “zero order” interaction network with 49 nodes and 81 edges was used. The most highly ranked nodes across the dataset based on network topology measures were TP53 (betweenness centrality = 468.99), and CTNNB1 (betweenness centrality = 450.38). TNFRSF10B (betweenness centrality = 32.53) ranked the highest among the gene signature and MUC1 (betweenness centrality = 43.66) among GWAS genes. (Red = up-regulated DEGs; Blue = down-regulated DEGs; Green = GWAS; Purple = OncoGene).
Drug Targeting of the 55-Gene Signature
As the 55-gene signature remains relevant during different stages of the disease, it was interesting to test its potentiality as a target for therapeutics development and drug repurposing. We used the signature to feed the connectivity map tool to search for compounds that are negatively correlated with this gene signature, implying their capability of inducing a reverse gene signature. Two compound classes were especially negatively enriched with scores lower than -90 hinting to their potential in opposing the H. pylori gene signature, which are Bromodomain Inhibitors and Leucine rich repeat kinase inhibitors. Apart from these two classes, dihomo-gamma-linolenic acid (DGLA) was one of agents inducing the highest reverse signature with a score of -92.93. Results of the highest opposing compounds and classes can be found in Supplementary Table 6.
Discussion
H. pylori is the main cause of gastric cancer worldwide (63) and remains the only bacterium that is classified as a definite group 1 carcinogen by the World Health Organization’s (WHO) International Agency for Research on Cancer (IARC) (64). Eradication of H. pylori in patients and high risk carriers remains the most successful method in preventing development of gastric cancer (65). As the rates of H. pylori antibiotic resistance increase, the WHO has published its first ever list of antibiotic-resistant “priority pathogens”, a catalogue of 12 families of bacteria including H. pylori that pose the greatest threat to human health. The list was drawn up in a bid to guide and promote research and development (R&D) of new antibiotics.
An approach that has become possible through the availability of large datasets and modern computational methods is the analysis of gene regulation networks that drive disease progression and that therefore may be targets of prevention and therapy. In other infections, this approach has proved successful: using machine learning models and multi-cohort analysis it has been possible to identify global host gene expression signatures that can be used as a diagnostic framework in different diseases such as tuberculosis and Severe Dengue (66, 67).
Through our multi-cohort analysis approach, we identified a robust 55-gene signature that defines H. pylori-induced pathologies and that, intriguingly, remains relevant throughout disease progression to cancer. Our results show the importance of such in silico approaches to refine and polish results from heterogenic backgrounds with regard to technology and sample cohorts. Our approach could detect many genes that were underperforming in their individual datasets as TLR8. This 55-gene signature can be the basis for future pathophysiological and molecular studies for H. pylori induced gastritis and gastric carcinoma.
Through this signature, we were further able to compare gene expression patterns of H. pylori cell line infection models with the human signature. This comparison showed the expected suitability of the gastric AGS cell lines to H. pylori research. Gene expression profiles in the colon HT29-MTX-E12 cell line suggest that this cell is also a good model for this infection. The underperforming of the GES-1 cell line indicates the need for further validation of its response to infection and a robust control of batch effects between different labs. Such heterogeneities between different laboratories cell line batches have been recently demonstrated in the Hela cell line (68).
Detection of pathogen-associated molecular patterns’ (PAMPs) through TLRs or other receptors is a particularly important step in alerting the immune system, and this is also highlighted in our upstream-signaling SPEED analysis. H. pylori belongs to the Gram-negative bacteria and has LPS, which is typically recognized with TLR4, yet it manages to evade this detection through its evolved structure (69). Other TLR receptors such as TLR2 or TLR5 play a bigger role in H. pylori alert system (70). Our curated original and refined gene signatures emphasize a rather intriguing high upregulation of the endosomal receptor TLR8 across different samples and stages of the pathology. H. pylori RNA recognition and MyD88-dependent cytokine induction through TLR8 was before described (71, 72) which makes it a candidate for more extensive studies.
Caspase-1 (CASP1) can be activated through Nod-like receptors to induce cytokine production and inflammasome activation during H. pylori infection mainly through control of IL-1β and IL-18 levels (73). CASP1 was consistently upregulated in our two meta-analysis pipelines and appeared to influence the gene-gene interaction network through interaction with the tumor suppressor gene TP53. It has been previously shown that CASP1 transcription can be targeted through TP53 (74). This suggests an interesting basis of host background interaction with H. pylori pathogenesis, where TP53 modulates expression levels of CASP1, which in return can modulate H. pylori immune response.
The positive enrichment of cytokine-mediated signaling and response to interferon-gamma and tumor necrosis factor pathways –pathways that are commonly activated in H. pylori infection- in our predicted gene signature supports its biological relevance in disease pathogenesis. Interestingly, the SPEED analysis indicated an upregulation of JAK and STAT upstream signaling which was recently shown to be a coping mechanism of H. pylori to block IFNG signaling through reduction of cholesterol levels in infected cells to allow it to evade the host’s immune response (75). The upregulation of various genes related to C-type lectin receptor signaling pathway as FCER1G, PSMB8, and MALT1 also hints to its importance in H. pylori detection. The C-type lectin innate immune receptors (CLRs) can recognize various pathogen-related carbohydrate structures (76) but the spectrum of their role in H. pylori recognition and the extent of their involvement in gastritis development is not fully understood. CLRs have been very recently shown to be able to detect host metabolites modified by H. pylori and induce gastritis (77).
H. pylori can induce various complications but its effect on nutrition through decreasing absorption of various nutrients is especially important in children (78, 79). The downregulation of pathways related to the cellular response to zinc and copper ions as well as to mineral absorption and folate biosynthesis in our analysis paint the picture of a bacterium that can actively affect the host’s nutrition status. This validates previous recommendations of screening of H. pylori in diseases other than gastritis such as metabolic syndrome (80).
Dihomo-gamma-linolenic acid (DGLA) was one of agents inducing the highest reverse signatures in our connectivity map analysis. High serum values of γ-linolenic acid were associated with reduced risk for atrophic gastritis (81), and this metabolite has been considered as an anti-inflammatory and anti-proliferative agent (82). H. pylori converts host’s cholesterol into cholesteryl glucosides that has been recently shown to modulate host’s immunity and gastritis (77).
Some sterols such as vitamin D may be capable of competing with cholesterol to attenuate this effect (83) and fatty acids such as DGLA can be hypothesized to induce its reverse signature through a similar mechanism. The capability of DGLA to attenuate LDL uptake and to improve mitochondrial biogenesis can be hypothesized to contribute to its activity against H. pylori-induced gastritis as various mitochondrial viability genes vital for mitophagy regulation (e.g., TOMM7) were downregulated in our analysis (84, 85). Further validation of DGLA derivatives potential in reducing gastritis can be of great value as they can be suitable candidates for supplementary treatment in gastritis.
Various inflammatory and immune signals can be shared between tissues especially those of similar origins and in response to similar stimuli. To better understand the applicability of our 55-gene signature to other disease settings we tested its performance in other representative inflammatory diseases of epithelial origin such as Crohn’s disease, and other inflammatory diseases of non-epithelial origins such as osteoarthritis and fatty liver disease. Although the gene signature performed poorly in inflammatory and cancer diseases of the liver -which indicates major differences in the host response in these situations- it performed moderately well in other inflammatory bowel diseases indicating some shared mechanisms between the cell responses in these conditions in comparison to its response to H. pylori infection. Nevertheless, the cross activation of some of the components of our curated signature in other inflammatory diseases due to conserved mechanisms in epithelial cell signaling in inflammation does not undermine the relevance of the whole signature for H. pylori-induced pathologies, and its capability when searching for compounds inducing reverse gene signatures. In addition, the 55-gene signature remained highly sensitive in inferring disease status when tested in the context of H. pylori infected tissue and gastric cancer.
In this study, we identify a set of genes that remain robustly relevant for H. pylori-induced pathologies across different stages of the disease up to the development of gastric cancer. While only a minority of H. pylori-infected patients will develop cancer, the validation of our signature in cancer patients is strong support for the pathological contribution of the infection to the transformation process, while other factors such as host genetic background would complement this pathogenic effect of the disease to develop cancer. Therefore, further dissecting this signature and investigating its related pathways will illustrate the mechanisms of H. pylori-induced mutagenesis, and the results can be used to develop new therapeutics that counter this effect in patients with higher risk or failed eradication trials for H. pylori.
It is clear that this gene signature has to be further validated experimentally in larger cohorts of patients’ samples and cell lines infection models. We believe however that it can serve as a basis for further investigation of new molecular pathways and mechanisms involved in H. pylori pathogenesis and can help refine the results curated in them.
Conclusion
Our study shows that the approach of a multi-cohort analysis increases sensitivity and permits the identification of candidate genes and mechanisms that may play a role in the pathogenesis of H. pylori associated disease including tumorigenesis. The identification of genes and pathways previously implicated by experimental studies in gastric disease in the past provides validation of the approach. Novel targets and therapeutic candidates were identified that may provide a basis for future functional and epidemiological studies. Our observations provide robust data about the underlying biology of the host response to H. pylori and emphasize the importance of early screening in various other diseases such as metabolic syndrome. This work could guide efforts to find new agents for prevention and therapy of gastric ulcer and cancer, especially at a time when H. pylori antibiotic resistance is on the rise.
Data Availability Statement
The datasets presented in this study can be found in online repositories. The names of the repository/repositories and accession number(s) can be found in the article/Supplementary Material.
Author Contributions
MTB conceived the study and the experiments. MTB and MO conducted the analyses. MTB, MO, and GH interpreted the results and wrote the paper. All authors contributed to the article and approved the submitted version.
Funding
MTB is supported by the IMM-PACT-Program for Clinician Scientists of the Deutsche Forschungsgemeinschaft (DFG, German Research Foundation) – 413517907.
Conflict of Interest
The authors declare that the research was conducted in the absence of any commercial or financial relationships that could be construed as a potential conflict of interest.
Acknowledgments
We thank Dr. Benjamin Blümel (Institute of Medical Microbiology and Hygiene, Medical Center—University of Freiburg, Freiburg, Germany) for critical discussion and assistance in preparation of the manuscript.
Supplementary Material
The Supplementary Material for this article can be found online at: https://www.frontiersin.org/articles/10.3389/fimmu.2021.624117/full#supplementary-material
Supplementary Table 1 | Summary of 427 DEGs identified by MetaIntegrator pipeline analysis.
Supplementary Table 2 | List of top 10 over/underrepresented pathways and gene ontologies as well as SPEED analysis.
Supplementary Table 3 | Summary of DEGs identified in individual datasets through limma and combined meta-analysis through NetworkAnalyst pipeline.
Supplementary Table 4 | Helicobacter-associated pathologies risk variants identified by GWAS analysis.
Supplementary Table 5 | Function analysis of identified SNPs.
Supplementary Table 6 | List of top 50 compounds and compound classes inducing reverse signature to the H. pylori 55-gene signature in CMAP analysis.
References
1. Garza-González E, Perez-Perez GI, Maldonado-Garza HJ, Bosques-Padilla FJ. A review of Helicobacter pylori diagnosis, treatment, and methods to detect eradication. World J Gastroenterol (2014) 20(6):1438–49. doi: 10.3748/wjg.v20.i6.1438
2. Wroblewski LE, Peek RM, Wilson KT. Helicobacter pylori and gastric cancer: factors that modulate disease risk. Clin Microbiol Rev (2010) 23(4):713–39. doi: 10.1128/CMR.00011-10
3. Graham DY, Malaty HM, Evans DG, Evans DJ, Klein PD, Adam E. Epidemiology of Helicobacter pylori in an asymptomatic population in the United States. Effect of age, race, and socioeconomic status. Gastroenterology (1991) 100(6):1495–501. doi: 10.1016/0016-5085(91)90644-Z
4. Mayerle J, den Hoed CM, Schurmann C, Stolk L, Homuth G, Peters MJ, et al. Identification of genetic loci associated with Helicobacter pylori serologic status. JAMA (2013) 309(18):1912–20. doi: 10.1001/jama.2013.4350
5. De Re V, Repetto O, De Zorzi M, Casarotto M, Tedeschi M, Giuffrida P, et al. Polymorphism in Toll-Like Receptors and Helicobacter Pylori Motility in Autoimmune Atrophic Gastritis and Gastric Cancer. Cancers (Basel) (2019) 11(5):648. doi: 10.3390/cancers11050648
6. Kassem A, Henning P, Kindlund B, Lindholm C, Lerner UH. TLR5, a novel mediator of innate immunity-induced osteoclastogenesis and bone loss. FASEB J (2015) 29(11):4449–60. doi: 10.1096/fj.15-272559
7. Nookaew I, Thorell K, Worah K, Wang S, Hibberd ML, Sjövall H, et al. Transcriptome signatures in Helicobacter pylori-infected mucosa identifies acidic mammalian chitinase loss as a corpus atrophy marker. BMC Med Genomics (2013) 6:41. doi: 10.1186/1755-8794-6-41
8. Morales-Guerrero SE, Rivas-Ortiz CI, Ponce de León-Rosales S, Gamboa-Domínguez A, Rangel-Escareño C, Uscanga-Domínguez LF, et al. Translation of gastric disease progression at gene level expression. J Cancer (2020) 11(2):520–32. doi: 10.7150/jca.29038
9. Chiou C-C, Chan C-C, Sheu D-L, Chen K-T, Li Y-S, Chan E-C. Helicobacter pylori infection induced alteration of gene expression in human gastric cells. Gut (2001) 48(5):598–604. doi: 10.1136/gut.48.5.598
10. Bauer B, Moese S, Bartfeld S, Meyer TF, Selbach M. Analysis of cell type-specific responses mediated by the type IV secretion system of Helicobacter pylori. Infect Immun (2005) 73(8):4643–52. doi: 10.1128/IAI.73.8.4643-4652.2005
11. Jiang Q, Jin S, Jiang Y, Liao M, Feng R, Zhang L, et al. Alzheimer’s Disease Variants with the Genome-Wide Significance are Significantly Enriched in Immune Pathways and Active in Immune Cells. Mol Neurobiol (2017) 54(1):594–600. doi: 10.1007/s12035-015-9670-8
12. Gao F, Yao Y, Zhang Y, Tian J. Integrating Genome-Wide Association Studies With Pathway Analysis and Gene Expression Analysis Highlights Novel Osteoarthritis Risk Pathways and Genes. Front Genet (2019) 10:827. doi: 10.3389/fgene.2019.00827
13. Liu X, Zhang Y, Tian J, Gao F. Analyzing Genome-Wide Association Study Dataset Highlights Immune Pathways in Lip Bone Mineral Density. Front Genet (2020) 11:4. doi: 10.3389/fgene.2020.00004
14. Li H, Li Q, Sun S, Lei P, Cai X, Shen G. Integrated Bioinformatics Analysis Identifies ELAVL1 and APP as Candidate Crucial Genes for Crohn’s Disease. J Immunol Res (2020) 2020:3067273. doi: 10.1155/2020/3067273
15. Sezin T, Vorobyev A, Sadik CD, Zillikens D, Gupta Y, Ludwig RJ. Gene Expression Analysis Reveals Novel Shared Gene Signatures and Candidate Molecular Mechanisms between Pemphigus and Systemic Lupus Erythematosus in CD4+ T Cells. Front Immunol (2018) 8:1992. doi: 10.3389/fimmu.2017.01992
16. Toro-Domínguez D, Carmona-Sáez P, Alarcón-Riquelme ME. Shared signatures between rheumatoid arthritis, systemic lupus erythematosus and Sjögren’s syndrome uncovered through gene expression meta-analysis. Arthritis Res Ther (2014) 16(6):489. doi: 10.1186/s13075-014-0489-x
17. Santiago JA, Bottero V, Potashkin JA. Transcriptomic and Network Analysis Identifies Shared and Unique Pathways across Dementia Spectrum Disorders. Int J Mol Sci (2020) 21(6):2050. doi: 10.3390/ijms21062050
18. Badr MT, Häcker G. Gene expression profiling meta-analysis reveals novel gene signatures and pathways shared between tuberculosis and rheumatoid arthritis. PloS One (2019) 14(3):e0213470. doi: 10.1371/journal.pone.0213470
19. Baschal EE, Larson ED, Bootpetch Roberts TC, Pathak S, Frank G, Handley E, et al. Identification of Novel Genes and Biological Pathways That Overlap in Infectious and Nonallergic Diseases of the Upper and Lower Airways Using Network Analyses. Front Genet (2019) 10:1352. doi: 10.3389/fgene.2019.01352
20. Moher D, Liberati A, Tetzlaff J, Altman DG, Group TP. Preferred Reporting Items for Systematic Reviews and Meta-Analyses: The PRISMA Statement. PloS Med (2009) 6(7):e1000097. doi: 10.1371/journal.pmed.1000097
21. Nagashima H, Iwatani S, Cruz M, Jiménez Abreu JA, Uchida T, Mahachai V, et al. Toll-like Receptor 10 in Helicobacter pylori Infection. J Infect Dis (2015) 212(10):1666–76. doi: 10.1093/infdis/jiv270
22. Hanada K, Uchida T, Tsukamoto Y, Watada M, Yamaguchi N, Yamamoto K, et al. Helicobacter pylori infection introduces DNA double-strand breaks in host cells. Infect Immun (2014) 82(10):4182–9. doi: 10.1128/IAI.02368-14
23. Galamb O, Gyõrffy B, Sipos F, Dinya E, Krenács T, Berczi L, et al. Helicobacter pylori and antrum erosion-specific gene expression patterns: the discriminative role of CXCL13 and VCAM1 transcripts. Helicobacter (2008) 13(2):112–26. doi: 10.1111/j.1523-5378.2008.00584.x
24. Kim SH, Sierra RA, McGee DJ, Zabaleta J. Transcriptional profiling of gastric epithelial cells infected with wild type or arginase-deficient Helicobacter pylori. BMC Microbiol (2012) 12:175. doi: 10.1186/1471-2180-12-175
25. Costa AM, Ferreira RM, Pinto-Ribeiro I, Sougleri IS, Oliveira MJ, Carreto L, et al. Helicobacter pylori Activates Matrix Metalloproteinase 10 in Gastric Epithelial Cells via EGFR and ERK-mediated Pathways. J Infect Dis (2016) 213(11):1767–76. doi: 10.1093/infdis/jiw031
26. Zhu H, Wang Q, Yao Y, Fang J, Sun F, Ni Y, et al. Microarray analysis of Long non-coding RNA expression profiles in human gastric cells and tissues with Helicobacter pylori Infection. BMC Med Genomics (2015) 8:84. doi: 10.1186/s12920-015-0159-0
27. Cairns MT, Gupta A, Naughton JA, Kane M, Clyne M, Joshi L. Glycosylation-related gene expression in HT29-MTX-E12 cells upon infection by Helicobacter pylori. World J Gastroenterol (2017) 23(37):6817–32. doi: 10.3748/wjg.v23.i37.6817
28. Li H, Yu B, Li J, Su L, Yan M, Zhang J, et al. Characterization of Differentially Expressed Genes Involved in Pathways Associated with Gastric Cancer. PloS One (2015) 10(4):e0125013. doi: 10.1371/journal.pone.0125013
29. Eftang LL, Esbensen Y, Tannæs TM, Blom GP, Bukholm IR, Bukholm G. Up-regulation of CLDN1 in gastric cancer is correlated with reduced survival. BMC Cancer (2013) 13:586. doi: 10.1186/1471-2407-13-586
30. Canu V, Sacconi A, Lorenzon L, Biagioni F, Lo Sardo F, Grazia Diodoro M, et al. MiR-204 down-regulation elicited perturbation of a gene target signature common to human cholangiocarcinoma and gastric cancer. Oncotarget (2017) 8(18):29540–57. doi: 10.18632/oncotarget.15290
31. Wu Y, Grabsch H, Ivanova T, Tan IB, Murray J, Ooi CH, et al. Comprehensive genomic meta-analysis identifies intra-tumoural stroma as a predictor of survival in patients with gastric cancer. Gut (2013) 62(8):1100–11. doi: 10.1136/gutjnl-2011-301373
32. Holbrook JD, Parker JS, Gallagher KT, Halsey WS, Hughes AM, Weigman VJ, et al. Deep sequencing of gastric carcinoma reveals somatic mutations relevant to personalized medicine. J Transl Med (2011) 9:119. doi: 10.1186/1479-5876-9-119
33. Li W-Q, Hu N, Burton VH, Yang HH, Su H, Conway CM, et al. PLCE1 mRNA and protein expression and survival of patients with esophageal squamous cell carcinoma and gastric adenocarcinoma. Cancer Epidemiol Biomarkers Prev (2014) 23(8):1579–88. doi: 10.1158/1055-9965.EPI-13-1329
34. D’Errico M, de Rinaldis E, Blasi MF, Viti V, Falchetti M, Calcagnile A, et al. Genome-wide expression profile of sporadic gastric cancers with microsatellite instability. Eur J Cancer (2009) 45(3):461–9. doi: 10.1016/j.ejca.2008.10.032
35. Oh SC, Sohn BH, Cheong J-H, Kim S-B, Lee JE, Park KC, et al. Clinical and genomic landscape of gastric cancer with a mesenchymal phenotype. Nat Commun (2018) 9:1777. doi: 10.1038/s41467-018-04179-8
36. Wang Q, Wen Y-G, Li D-P, Xia J, Zhou C-Z, Yan D-W, et al. Upregulated INHBA expression is associated with poor survival in gastric cancer. Med Oncol (2012) 29(1):77–83. doi: 10.1007/s12032-010-9766-y
37. Jin Y, He J, Du J, Zhang R-X, Yao H-B, Shao Q-S. Overexpression of HS6ST2 is associated with poor prognosis in patients with gastric cancer. Oncol Lett (2017) 14(5):6191–7. doi: 10.3892/ol.2017.6944
38. Ihaka R, Gentleman R. R: A Language for Data Analysis and Graphics. J Comput Graph Stat (1996) 5(3):299–314. doi: 10.1080/10618600.1996.10474713
39. Khatri P, Roedder S, Kimura N, De Vusser K, Morgan AA, Gong Y, et al. A common rejection module (CRM) for acute rejection across multiple organs identifies novel therapeutics for organ transplantation. J Exp Med (2013) 210(11):2205–21. doi: 10.1084/jem.20122709
40. Haynes WA, Vallania F, Liu C, Bongen E, Tomczak A, Andres-Terrè M, et al. Empowering Multi-Cohort Gene Expression Analysis to Increase Reproducibility. Pac Symp Biocomput (2016) 22:144–53. doi: 10.1101/071514
41. Benjamini Y, Hochberg Y. Controlling the False Discovery Rate: A Practical and Powerful Approach to Multiple Testing. J R Stat Soc Ser B (Methodol) (1995) 57(1):289–300. doi: 10.1111/j.2517-6161.1995.tb02031.x
42. Hoaglin DC. Misunderstandings about Q and ‘Cochran’s Q test’’ in meta-analysis’. Stat Med (2016) 35(4):485–95. doi: 10.1002/sim.6632
43. Rydenfelt M, Klinger B, Klünemann M, Blüthgen N. SPEED2: inferring upstream pathway activity from differential gene expression. Nucleic Acids Res (2020) 48(W1):W307–12. doi: 10.1093/nar/gkaa236
44. Fabregat A, Jupe S, Matthews L, Sidiropoulos K, Gillespie M, Garapati P, et al. The Reactome Pathway Knowledgebase. Nucleic Acids Res (2018) 46(Database issue):D649–55. doi: 10.1093/nar/gkx1132
45. Davis S, Meltzer PS. GEOquery: a bridge between the Gene Expression Omnibus (GEO) and BioConductor. Bioinformatics (2007) 23(14):1846–7. doi: 10.1093/bioinformatics/btm254
46. Ritchie ME, Phipson B, Wu D, Hu Y, Law CW, Shi W, et al. limma powers differential expression analyses for RNA-sequencing and microarray studies. Nucleic Acids Res (2015) 43(7):e47. doi: 10.1093/nar/gkv007
47. Pagès H, Carlson M, Falcon S, Li N. AnnotationDbi: Manipulation of SQLite-based annotations in Bioconductor. R package version 1.52.0. Available at: https://bioconductor.org/packages/AnnotationDbi/.
48. Huang DW, Sherman BT, Lempicki RA. Systematic and integrative analysis of large gene lists using DAVID bioinformatics resources. Nat Protoc (2009) 4(1):44–57. doi: 10.1038/nprot.2008.211
49. Xia J, Gill EE, Hancock REW. NetworkAnalyst for statistical, visual and network-based meta-analysis of gene expression data. Nat Protoc (2015) 10(6):823–44. doi: 10.1038/nprot.2015.052
50. Zhou G, Soufan O, Ewald J, Hancock REW, Basu N, Xia J. NetworkAnalyst 3.0: a visual analytics platform for comprehensive gene expression profiling and meta-analysis. Nucleic Acids Res (2019) 47(W1):W234–41. doi: 10.1093/nar/gkz240
51. Heberle H, Meirelles GV, da Silva FR, Telles GP, Minghim R. InteractiVenn: a web-based tool for the analysis of sets through Venn diagrams. BMC Bioinf (2015) 16(1):169. doi: 10.1186/s12859-015-0611-3
52. Buniello A, MacArthur JAL, Cerezo M, Harris LW, Hayhurst J, Malangone C, et al. The NHGRI-EBI GWAS Catalog of published genome-wide association studies, targeted arrays and summary statistics 2019. Nucleic Acids Res (2019) 47(Database issue):D1005–12. doi: 10.1093/nar/gky1120
53. Ward LD, Kellis M. HaploReg: a resource for exploring chromatin states, conservation, and regulatory motif alterations within sets of genetically linked variants. Nucleic Acids Res (2012) 40(D1):D930–4. doi: 10.1093/nar/gkr917
54. Martínez-Jiménez F, Muiños F, Sentís I, Deu-Pons J, Reyes-Salazar I, Arnedo-Pac C, et al. A compendium of mutational cancer driver genes. Nat Rev Cancer (2020) 20:555–572. doi: 10.1038/s41568-020-0290-x
55. Breuer K, Foroushani AK, Laird MR, Chen C, Sribnaia A, Lo R, et al. InnateDB: systems biology of innate immunity and beyond—recent updates and continuing curation. Nucleic Acids Res (2013) 41(Database issue):D1228–33. doi: 10.1093/nar/gks1147
56. Xia J, Benner MJ, Hancock REW. NetworkAnalyst - integrative approaches for protein–protein interaction network analysis and visual exploration. Nucleic Acids Res (2014) 42(Web Server issue):W167–74. doi: 10.1093/nar/gku443
57. Lamb J, Crawford ED, Peck D, Modell JW, Blat IC, Wrobel MJ, et al. Connectivity Map: using gene-expression signatures to connect small molecules, genes, and disease. Science (2006) 313(5795):1929–35. doi: 10.1126/science.1132939
58. Subramanian A, Narayan R, Corsello SM, Peck DD, Natoli TE, Lu X, et al. A Next Generation Connectivity Map: L1000 Platform and the First 1,000,000 Profiles. Cell (2017) 171(6):1437–52.e17. doi: 10.1016/j.cell.2017.10.049
59. Santagata S, Mendillo ML, Tang Y, Subramanian A, Perley CC, Roche SP, et al. Tight Coordination of Protein Translation and HSF1 Activation Supports the Anabolic Malignant State. Science (2013) 341(6143):1238303.. doi: 10.1126/science.1238303
60. Ke Y, Ning T, Wang B. [Establishment and characterization of a SV40 transformed human fetal gastric epithelial cell line-GES-1]. Zhonghua Zhong Liu Za Zhi (1994) 16(1):7–10.
61. Moyat M, Velin D. Immune responses to Helicobacter pylori infection. World J Gastroenterol (2014) 20(19):5583–93. doi: 10.3748/wjg.v20.i19.5583
62. Canli Ö, Nicolas AM, Gupta J, Finkelmeier F, Goncharova O, Pesic M, et al. Myeloid Cell-Derived Reactive Oxygen Species Induce Epithelial Mutagenesis. Cancer Cell (2017) 32(6):869–883.e5. doi: 10.1016/j.ccell.2017.11.004
63. Moss SF. The Clinical Evidence Linking Helicobacter pylori to Gastric Cancer. Cell Mol Gastroenterol Hepatol (2016) 3(2):183–91. doi: 10.1016/j.jcmgh.2016.12.001
64. Schistosomes, liver flukes and Helicobacter pylori. IARC Working Group on the Evaluation of Carcinogenic Risks to Humans. Lyon, 7-14 June 1994. IARC Monogr Eval Carcinog Risks Hum (1994) 61:1–241. doi: 10.3389/fimmu.2020.01121
65. Choi IJ, Kim CG, Lee JY, Kim Y-I, Kook M-C, Park B, et al. Family History of Gastric Cancer and Helicobacter pylori Treatment. New Engl J Med (2020) 382:427–36. doi: 10.1056/NEJMoa1909666
66. Sweeney TE, Braviak L, Tato CM, Khatri P. Genome-wide expression for diagnosis of pulmonary tuberculosis: a multicohort analysis. Lancet Respir Med (2016) 4(3):213–24. doi: 10.1016/S2213-2600(16)00048-5
67. Robinson M, Sweeney TE, Barouch-Bentov R, Sahoo MK, Kalesinskas L, Vallania F, et al. A 20-Gene Set Predictive of Progression to Severe Dengue. Cell Rep (2019) 26(5):1104–1111.e4. doi: 10.1016/j.celrep.2019.01.033
68. Liu Y, Mi Y, Mueller T, Kreibich S, Williams EG, Van Drogen A, et al. Multi-omic measurements of heterogeneity in HeLa cells across laboratories. Nat Biotechnol (2019) 37(3):314–22. doi: 10.1038/s41587-019-0037-y
69. Roy CR, Mocarski ES. Pathogen subversion of cell-intrinsic innate immunity. Nat Immunol (2007) 8(11):1179–87. doi: 10.1038/ni1528
70. Smith MF, Mitchell A, Li G, Ding S, Fitzmaurice AM, Ryan K, et al. Toll-like Receptor (TLR) 2 and TLR5, but Not TLR4, Are Required for Helicobacter pylori-induced NF-κB Activation and Chemokine Expression by Epithelial Cells. J Biol Chem (2003) 278(35):32552–60. doi: 10.1074/jbc.M305536200
71. Rad R, Ballhorn W, Voland P, Eisenächer K, Mages J, Rad L, et al. Extracellular and Intracellular Pattern Recognition Receptors Cooperate in the Recognition of Helicobacter pylori. Gastroenterology (2009) 136(7):2247–57. doi: 10.1053/j.gastro.2009.02.066
72. Smith SM. Role of Toll-like receptors in Helicobacter pylori infection and immunity. World J Gastrointest Pathophysiol (2014) 5(3):133–46. doi: 10.4291/wjgp.v5.i3.133
73. Hitzler I, Sayi A, Kohler E, Engler DB, Koch KN, Hardt W-D, et al. Caspase-1 Has Both Proinflammatory and Regulatory Properties in Helicobacter Infections, Which Are Differentially Mediated by Its Substrates IL-1β and IL-18. J Immunol (2012) 188(8):3594–602. doi: 10.4049/jimmunol.1103212
74. Gupta S, Radha V, Furukawa Y, Swarup G. Direct Transcriptional Activation of Human Caspase-1 by Tumor Suppressor p53. J Biol Chem (2001) 276(14):10585–8. doi: 10.1074/jbc.C100025200
75. Morey P, Pfannkuch L, Pang E, Boccellato F, Sigal M, Imai-Matsushima A, et al. Helicobacter pylori Depletes Cholesterol in Gastric Glands to Prevent Interferon Gamma Signaling and Escape the Inflammatory Response. Gastroenterology (2018) Apr 1154(5):1391–404.e9. doi: 10.1053/j.gastro.2017.12.008
76. Geijtenbeek TBH, Gringhuis SI. C-type lectin receptors in the control of T helper cell differentiation. Nat Rev Immunol (2016) Jul16(7):433–48. doi: 10.1038/nri.2016.55
77. Nagata M, Toyonaga K, Ishikawa E, Haji S, Okahashi N, Takahashi M, et al. Helicobacter pylori metabolites exacerbate gastritis through C-type lectin receptors. J Exp Med (2021) 218(1):e20200815. doi: 10.1084/jem.20200815
78. Malfertheiner P, Chan FK, McColl KE. Peptic ulcer disease. Lancet (2009) 374(9699):1449–61. doi: 10.1016/S0140-6736(09)60938-7
79. Dzierzanowska-Fangrat K, Dzierzanowska D. Helicobacter pylori: microbiology and interactions with gastrointestinal microflora. J Physiol Pharmacol: Off J Polish Physiol Soc (2006) 57 Suppl 3:5–14.
80. Franceschi F, Annalisa T, Teresa DR, Giovanna D, Ianiro G, Franco S, et al. Role of Helicobacter pylori infection on nutrition and metabolism. World J Gastroenterol (2014) 20(36):12809–17. doi: 10.3748/wjg.v20.i36.12809
81. Ito Y, Suzuki K, Ichino N, Imai H, Sakaguchi H, Hokama M, et al. The Risk of Helicobacter Pylori Infection and Atrophic Gastritis from Food and Drink Intake: a Cross-sectional Study in Hokkaido, Japan. Asian Pac J Cancer Prevent: APJCP (2000) 1(2):147–56.
82. Wang X, Lin H, Gu Y. Multiple roles of dihomo-γ-linolenic acid against proliferation diseases. Lipids Health Dis (2012) 11:25. doi: 10.1186/1476-511X-11-25
83. Hosoda K, Shimomura H, Wanibuchi K, Masui H, Amgalanbaatar A, Hayashi S, et al. Identification and characterization of a vitamin D 3 decomposition product bactericidal against Helicobacter pylori. Sci Rep (2015) 5(1):1–9. doi: 10.1038/srep08860
84. Gallagher H, Williams JO, Ferekidis N, Ismail A, Chan Y-H, Michael DR, et al. Dihomo-γ-linolenic acid inhibits several key cellular processes associated with atherosclerosis. Biochim Biophys Acta (BBA) - Mol Basis Dis (2019) 1865(9):2538–50. doi: 10.1016/j.bbadis.2019.06.011
Keywords: Helicobacter pylori, gastritis, genome-wide association study, transcriptomics, gene-signature, immune response, multi-cohort analysis, gastric cancer
Citation: Badr MT, Omar M and Häcker G (2021) Comprehensive Integration of Genome-Wide Association and Gene Expression Studies Reveals Novel Gene Signatures and Potential Therapeutic Targets for Helicobacter pylori-Induced Gastric Disease. Front. Immunol. 12:624117. doi: 10.3389/fimmu.2021.624117
Received: 30 October 2020; Accepted: 04 January 2021;
Published: 24 February 2021.
Edited by:
Marina De Bernard, University of Padua, ItalyCopyright © 2021 Badr, Omar and Häcker. This is an open-access article distributed under the terms of the Creative Commons Attribution License (CC BY). The use, distribution or reproduction in other forums is permitted, provided the original author(s) and the copyright owner(s) are credited and that the original publication in this journal is cited, in accordance with accepted academic practice. No use, distribution or reproduction is permitted which does not comply with these terms.
*Correspondence: Mohamed Tarek Badr, bW9oYW1lZC50YXJlay5iYWRyQHVuaWtsaW5pay1mcmVpYnVyZy5kZQ==