 Guillaume Padern1
 Claire Duflos2
 Rosanna Ferreira1
 Said Assou1
 Philippe Guilpain1,3
 Alexandre Thibault Jacques Maria1,3
 Radjiv Goulabchand4Pascale Galea5Maja Jurtela2
 Christian Jorgensen1
 Yves-Marie Pers1*
- 1IRMB, University of Montpellier, INSERM, CHU Montpellier, Montpellier, France
- 2Clinical Research and Epidemiology Unit, CHU Montpellier, Montpellier University, Montpellier, France
- 3Internal Medicine and Multi-Organic Diseases Department, Hôpital Saint Éloi, CHU Montpellier, Montpellier, France
- 4Internal Medicine Department, Caremeau University Hospital, Nîmes, France
- 5BioRad Laboratory, Research and Development Department, Montpellier, France
Context: Primary Sjögren’s syndrome (pSS) is a complex heterogeneous autoimmune disease (AID) which can mimic rheumatoid arthritis (RA) or systemic lupus erythematosus (SLE). Our exploratory study investigated serum biomarkers that may discriminate pSS from RA and SLE.
Methods: Serum concentrations of 63 biomarkers involved in immune cell trafficking, inflammatory response, cellular movement, and cell-to-cell signaling were measured in AID patients, included prospectively into the study at the Montpellier University Hospital. A multivariate analysis by multiple logistic regression was performed, and discriminative power assessed using logistic regression adjusted on significant demographic factors.
Results: Among the 95 patients enrolled, 42 suffered from pSS, 28 from RA, and 25 from SLE. Statistical analysis showed that concentrations of BDNF (OR = 0.493 with 95% CI [0.273–0.891]; p = 0.0193) and I-TAC/CXCL11 (OR = 1.344 with 95% CI [1.027–1.76]; p = 0.0314) can significantly discriminate pSS from RA. Similarly, greater concentrations of sCD163 (OR = 0.803 with 95% CI [0.649–0.994]; p = 0.0436), Fractalkine/CX3CL1 (OR = 0.534 with 95% CI [0.287–0. 991]; p = 0.0466), MCP-1/CCL2 (OR = 0.839 with 95% CI [0.732–0.962]; p = 0.0121), and TNFa (OR = 0.479 with 95% CI [0.247–0.928]; p = 0.0292) were associated with SLE diagnosis compared to pSS. In addition, the combination of low concentrations of BDNF and Fractalkine/CX3CL1 was highly specific for pSS (specificity 96.2%; positive predictive value 80%) compared to RA and SLE, as well as the combination of high concentrations of I-TAC/CXCL11 and low concentrations of sCD163 (specificity 98.1%; positive predictive value 75%).
Conclusion: Our study highlights biomarkers potentially involved in pSS, RA, and SLE pathophysiology that could be useful for developing a pSS-specific diagnostic tool.
Introduction
Primary Sjögren’s syndrome (pSS) is a complex heterogeneous autoimmune disease (AID) characterized by salivary and/or ocular dryness (sicca syndrome) related to lymphoid infiltration of exocrine glands. pSS is distinguished from secondary Sjögren’s syndrome (sSS), which often coexists with systemic lupus erythematosus (SLE) and rheumatoid arthritis (RA) (1). While pSS, RA, and SLE have distinct clinical and pathophysiological features (2–4), patients may initially present with sicca symptoms, and over the course of the disease, the specific underlying condition will then manifest (5, 6). Accurate diagnosis is often challenging in patients with overlapping disease entities. In addition, the lack of specificity of lymphocytic sialadenitis and anti-SSa/b antibodies (7, 8) can complicate pSS diagnosis. Glandular epithelial cells play a central pathophysiological role in the development of autoimmune epithelitis, especially concerning antigen presentation of Ro/SSA- and La/SSB-protein complexes. Both the innate and the adaptive immune system are involved in the disease initiation and maintenance of the immune response. An “interferon signature” is observed in the salivary glands and T-cell derived cytokines (Th1/Th2 polarization, Th17, and regulatory T cells) play a central role in the pathophysiology of pSS. Moreover, through activation of various CD4+ T-helper cell subsets, B cells are involved in auto-antibody production and the formation of ectopic germinal center-like structures associated with malignant transformation to Non-Hodgkin lymphoma (9).
Identifying new biomarkers involved in these AIDs and developing pSS diagnosis or prognosis methods is urgently needed (10). Single biomarker approaches are overwhelmed by their limitations and the complexity of AID physiopathology. Proteomic techniques consider the multifactorial processes involved, and their more global approach may provide a more complete picture of the disease (11). Multiplex immunoassays are promising and have allowed for the identification of interesting biomarkers in AIDs (12–15). Such an approach may soon be available in clinical practice despite limitations such as interference by highly concentrated proteins and cross-reactivity (16).
Several recently launched research initiatives are attempting to identify clinical and immunological signatures in pSS patients (17). Furthermore, many potential biomarkers of pSS have emerged for several years (18–22), but none of them have been validated yet (23). In comparisons with RA and SLE, a better characterization of the pathophysiological mechanisms involved in pSS seems useful to better discriminate these AIDs. Therefore, we conducted a proteomic study investigating the concentration of several serum biomarkers in pSS, RA, and SLE patients.
Patients and Methods
Study Population
This transversal study was conducted in the Rheumatology and Internal Medicine departments of Montpellier University Hospital. Patients were recruited consecutively and prospectively during 5 months between October 2016 and February 2017. They all met the international classification criteria for pSS (2), RA (3), or SLE (24). RA and SLE patients with sSS were excluded. Written informed consent was obtained from all patients, after which a blood sample was collected. The local ethics committee approved all procedures in accordance with international Helsinki regulations (Comité de Protection des Personnes Sud Méditerranée IV: DC-2015-2584).
Data Collection
On the day of inclusion, the following data were obtained from each patient’s computerized medical record: age, gender, smoking status, date of diagnosis, articular and extra-articular autoimmune symptoms, disease severity, accessory salivary gland biopsy results (pSS only), autoantibody presence and specificity, cardiovascular risk factors (diabetes, hypertension, smoking, dyslipidemia, and chronic renal failure with a glomerular filtration rate below 30ml/min), bone erosions, C-reactive protein (CRP) levels, and ongoing specific AID therapy. At the time of inclusion, measurement of disease activity was performed using ESSDAI score (25) for pSS, DAS28-CRP score (26) for RA and SLEDAI score (27) for SLE. Low disease activity was defined by an ESSDAI score 5, a DAS28-CRP score 3.2, or a SLEDAI score ≤5. Moderate disease activity was defined by an ESSDAI score between 5 and 13 inclusive, a DAS28-CRP score 3.2 and 5.1, or a SLEDAI score between 6 and 10 inclusive. High disease activity was defined by an ESSDAI score 13, a DAS28-CRP score 5.1, or a SLEDAI score >10.
Determination of Biomarkers Serum Concentration
Blood samples were stored for 30 min at room temperature (RT) before being centrifuged (2,000g, 10min, RT), frozen at −80°C, and stored in the biological resource center of Montpellier University Hospital (Pr Sylvain LEHMANN, NFS 96-900 and ISO 9001 standards, BB-0033-00031) until their use in the biomarkers assay.
Serum protein concentrations of 63 biomarkers were measured using Bio-Plex Pro™ Human Chemokine 40-plex Panel (Bio-Rad) for CCL1, CCL2 (Monocyte Chemoattractant Protein 1 or MCP-1), CCL3, CXCL5, CCL7, CCL8, CCL11 (Eotaxin), CCL13, CCL15, CCL17 (Thymus- and Activation-Regulated Chemokine or TARC), CCL19, CCL20, CCL21, CCL22, CCL23, CCL24, CCL25 (Eotaxin-2), CCL26 (Eotaxin-3), CCL27, CXCL1, CXCL2, CXCL6, CXCL9, CXCL10, CXCL11 (Inducible T-cell Alpha Chemoattractant or I-TAC), CXCL12, CXCL13, CXCL16, CX3CL1, Granulocyte-macrophage colony-stimulating factor (GM-CSF), IL1-beta, IL-2, IL-4, IL-6, IL-8, IL-10, IL-16, Macrophage migration Inhibitory Factor (MIF), Tumor Necrosis Factor Alpha (TNFa), and Interferon gamma (IFNg). Quality control was validated for 34 biomarkers, and data for the six non-validated biomarkers were rejected (CCL-26, IL1-beta, IL-2, IL-6, IL-10, and IFNg). The Bio-Plex Pro™ Human Inflammation Panel 1, 37-Plex (Bio-Rad) was validated for the dosage of A Proliferation-Inducing Ligand (APRIL), B Cell Activating Factor (BAFF), sCD30, sCD163, Chitinase 3-like 1, soluble IL-6 Receptor alpha (sIL-6Ra), soluble IL-6 Receptor beta (sIL-6Rb or gp130), Matrix Metalloproteinase-2 (MMP-2), Matrix Metalloproteinase-3 (MMP-3), Osteocalcin, Osteopontin (SPP1), Pentraxin-3, soluble TNF Receptor 1 (sTNF-R1), soluble TNF Receptor 2 (sTNF-R2), and TNF-related Weak inducer of apoptosis (TWEAK). Enzyme-linked immunosorbent assay (ELISA) kits were used for the remaining biomarkers: galectin binding protein 3 (LGalS3P) form Abnova, Fatty Acid-Binding Protein 4 (FABP4) from Biovendor, Hydroxyproline (HDP) from Cusabio, pre-Haptoglobin 2 (preHp2), from Bio-Rad (28), Oxidized low-density lipoprotein (OxLDL) from Mercodia, Secreted Phosphoprotein 1 (SPP1), Thrombospondin 2 (TPS2), adiponectin, hyaluronic acid (HA), Cathepsin S (CTSS), Brain Derived Neurotrophic Factor (BDNF), Secreted Protein Acidic Rich Cysteine (SPARC), haptoglobin, sCD14, and Mannose Binding Lectin 2 (MBL2) from R&D Systems. The osteopontin assay (SPP1) was performed using two different kits: an ELISA kit (R&D systems) whose result is reported under “SPP1”, and the Bio-Plex kit Pro™ Human Inflammation Panel 1, 37-Plex (BioRad) whose result is reported under “osteopontin” (Table S1, Supplemental Data). Reproducibility and sensitivity of all ELISA kits were first validated before performing serum biomarker assays with patient samples. Biomarker assays were performed in duplicate for each sample according to the recommendations of manufacturers.
The top canonical pathways and the gene ontology analysis of the 63 biomarkers were functionally categorized using the ingenuity pathway analysis (IPA) software (QIAGEN Inc., https://www.qiagenbioinformatics.com/products/ingenuitypathway-analysis) (29). A large portion of this list is involved in hematological system development and function, immune cell trafficking, inflammatory response, cellular movement, and cell-to-cell signaling (Figure 1).
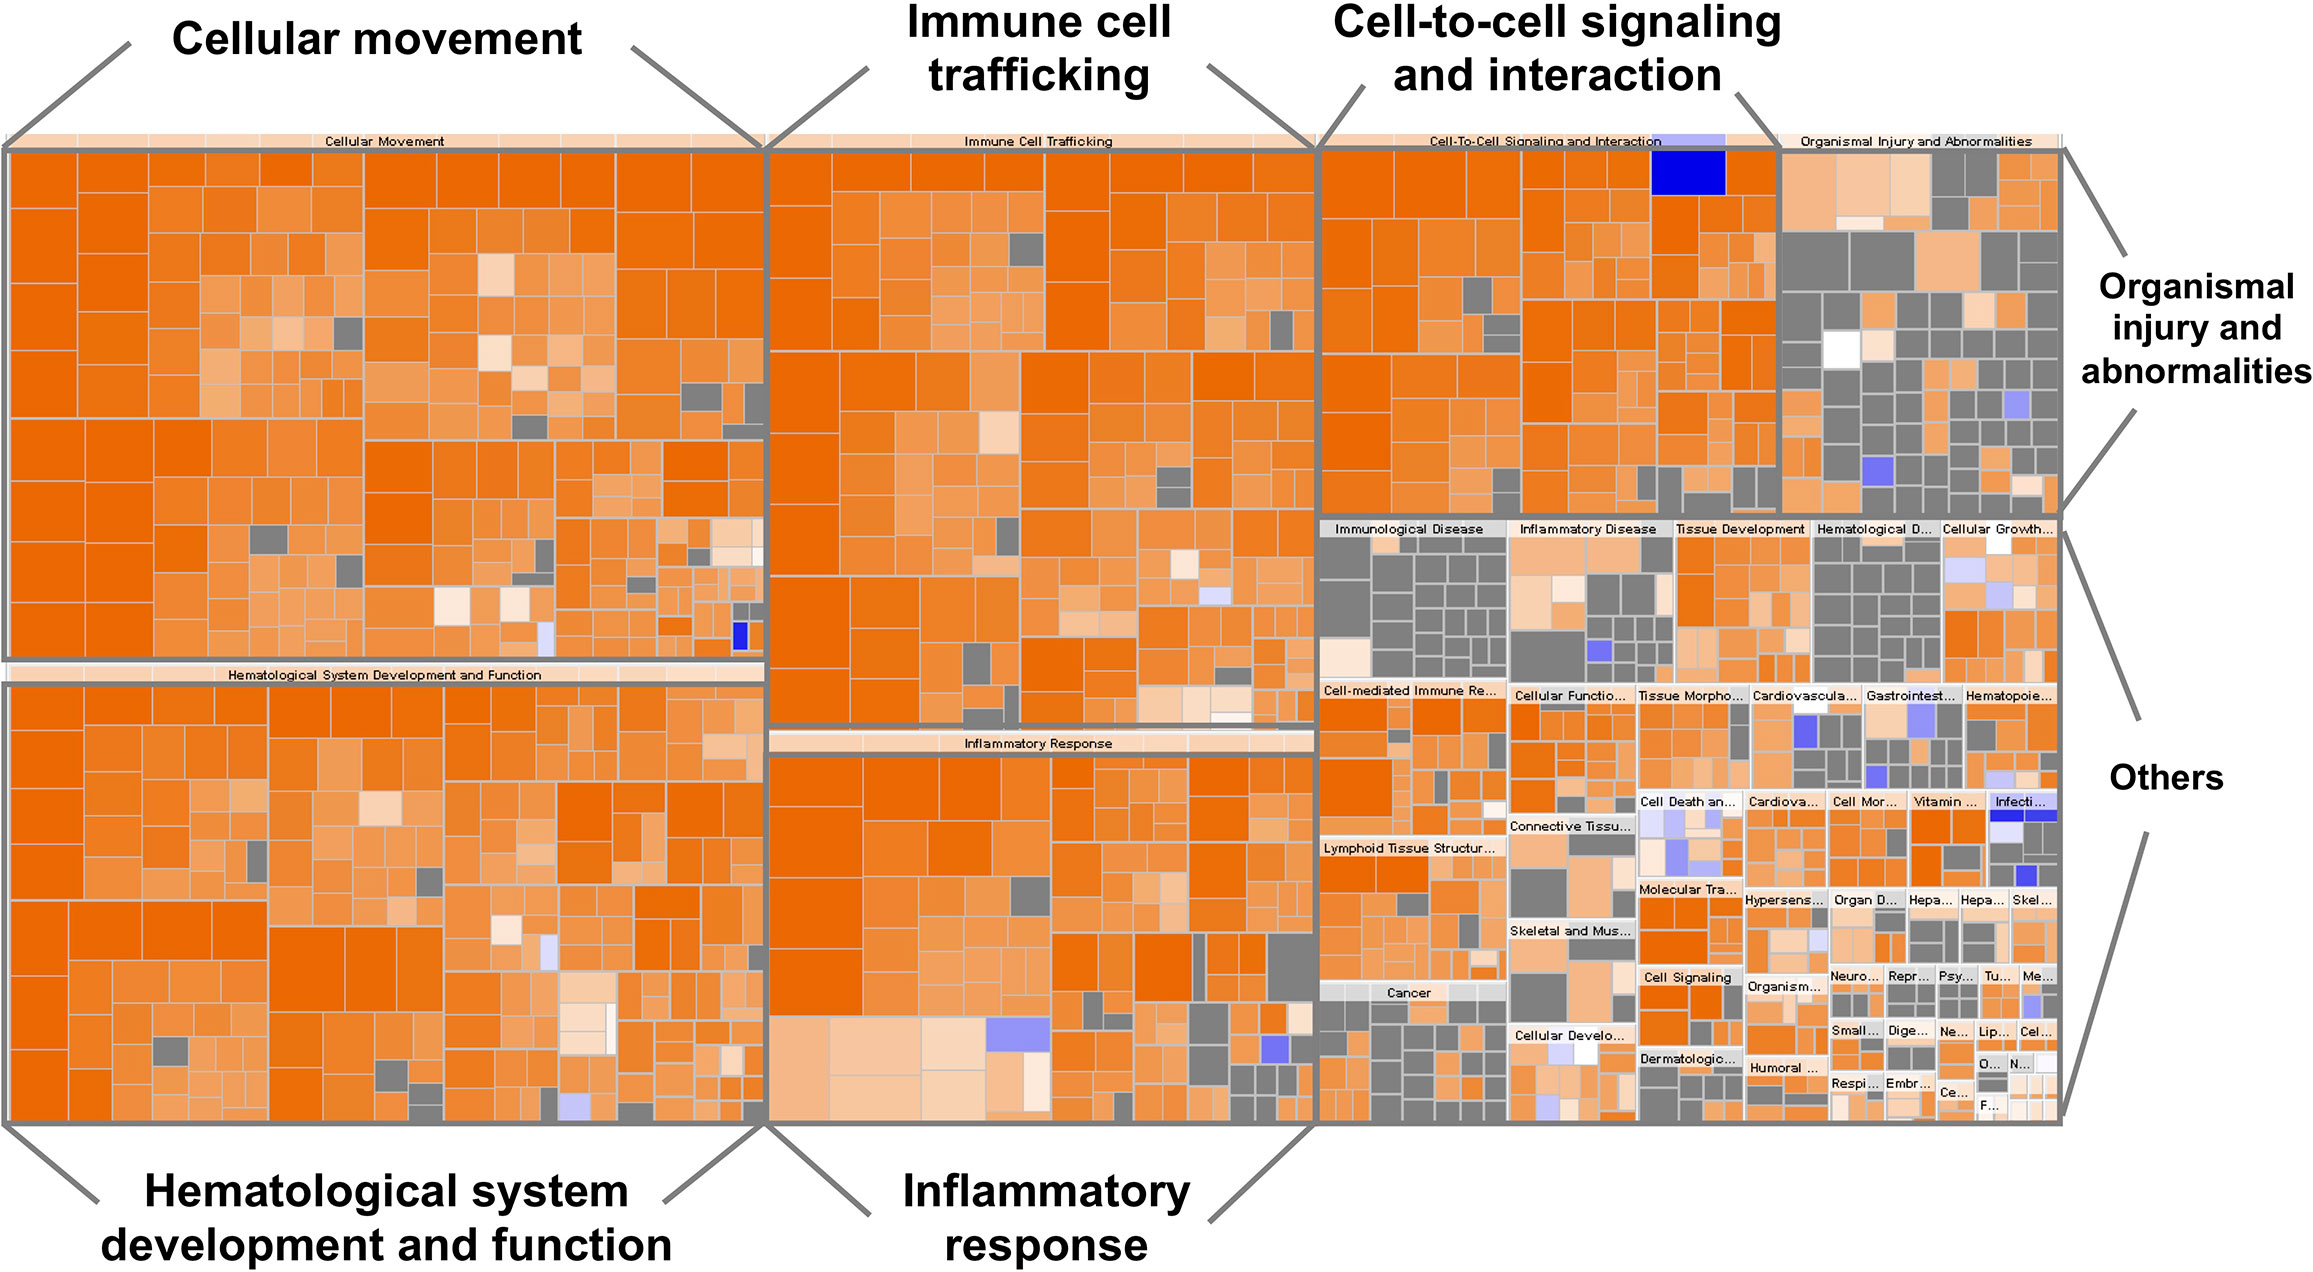
Figure 1 Heatmap representing the classification of diseases and functions by ingenuity pathway analysis (IPA). The visualization is a hierarchical heat map of functional categories generated by IPA software in which the major boxes represent a family (or category) of related functions. Within each box, each individual rectangle is a sub-function linked to the biological function of a group of proteins. The size of a rectangle is correlated with increasing overlap significance among the proteins members of the related function and the query proteins. The color scheme shown is based on z-scores, with activation in orange, inhibition in blue and undetermined functions in gray. Darker shades indicate higher absolute z-score heat map. For instance, most ‘Inflammatory response’, ‘Cellular movement’, ‘Immune cell trafficking’, ‘Cell-to-cell signaling and interaction’, ‘Hematological system development and function’ proteins were over-represented.
Statistical Analysis
A simple descriptive analysis was performed on the entire study population and then by group. Groups were initially compared using univariate tests. Age and sex were considered clinically pertinent confounding factors and were included in our principal analysis if they were statistically significant in the univariate analysis.
The association between biomarkers and the risk of presenting with pSS rather than RA was assessed using separate logistic regressions for each biomarker. When the log-linearity hypothesis was met, to provide readable odds ratios (OR), biomarkers were specified in the model using the most convenient unit of concentration, ranging from 10 to 10,000 original units, depending on the biomarker. When the log-linearity hypothesis was not met, biomarkers were specified in the model as categorical variables. Thresholds were the quantiles determining six balanced groups. Finally, classes with comparable OR were grouped together.
The association between biomarkers and the risk of presenting with pSS rather than SLE was assessed using the same method. In addition, since the SLE patients were clinically and statistically younger than pSS patients, the logistic regressions were adjusted on age.
Samples were removed from the analysis if the concentration of a biomarker varied by more than 20% between technical duplicates (coefficient of variation > 20%) or if the concentration was outside the test detection range (Table S2, Supplemental Data). All statistical tests were two-tailed with a Type I error of 0.05. Analyses were performed using SAS® Version 7.12 HF4 software.
Results
Study Population
Ninety-five patients were prospectively enrolled in the study between October 2016 and February 2017: 42 pSS patients, 28 RA patients, and 25 SLE patients. Population characteristics are summarized in Table 1, and biological diagnostic criteria in Supplemental Table S3. The median age of pSS patients (62.5 years) did not differ from those in the RA group (60.5 years), while both pSS and RA patients were significantly older than those in the SLE group (40 years, Q25: 31.5 – Q75: 50.5; p<0.001). Mean disease duration was significantly shorter in pSS patients (9.2 ± 8.6 years) compared to RA patients (15.8 ± 9.3 years; p<0.01) but did not differ in comparison with the SLE patients (12.1 ± 9.7 years; p = 0.53). Low disease activity was common in all three groups: 76.2% in pSS patients, 58.3% in RA patients, and 76% in SLE patients. As expected, more patients were treated by biologic drugs in the RA group compared to the pSS and SLE groups (p<0.001). Corticosteroid treatment did not differ among groups (p = 0.62). SLE patients were more often treated by synthetic Drug Modifying Anti-Rheumatic Diseases (DMARDs) than the others (p = 0.04). Likewise, SLE patients were treated by mycophenolate mofetil (MMF) or azathioprine (AZA) more than pSS and RA patients (for MMF p<0.001; for AZA p = 0.02). In contrast, the RA group included significantly more patients treated with methotrexate (p = 0.01) and fewer patients treated with hydroxychloroquine (p = 0.02) compared to the pSS and SLE groups.
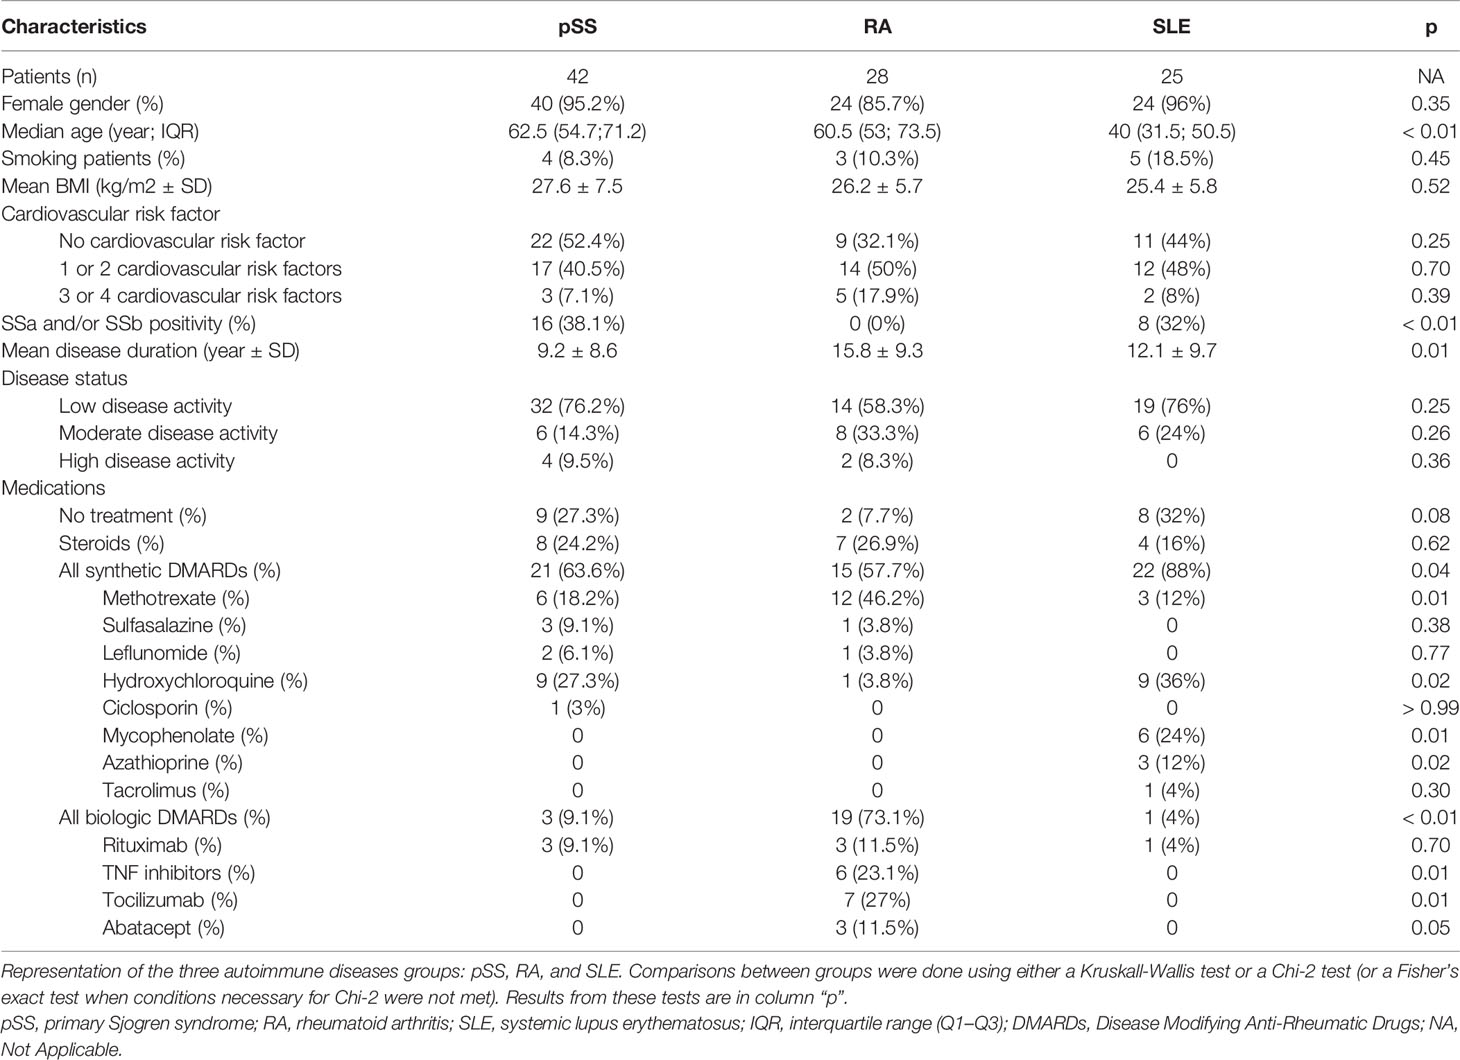
Table 1 Characteristics of patients included in the study.
Biomarkers Associated With pSS Versus RA
Identification of markers distinguishing pSS versus RA or SLE was determined by logistic regression analysis. The analysis was age-adjusted for the comparison with SLE patient samples. Results are presented as a function of the increase in each biomarker concentration. All results are available in Table 2.
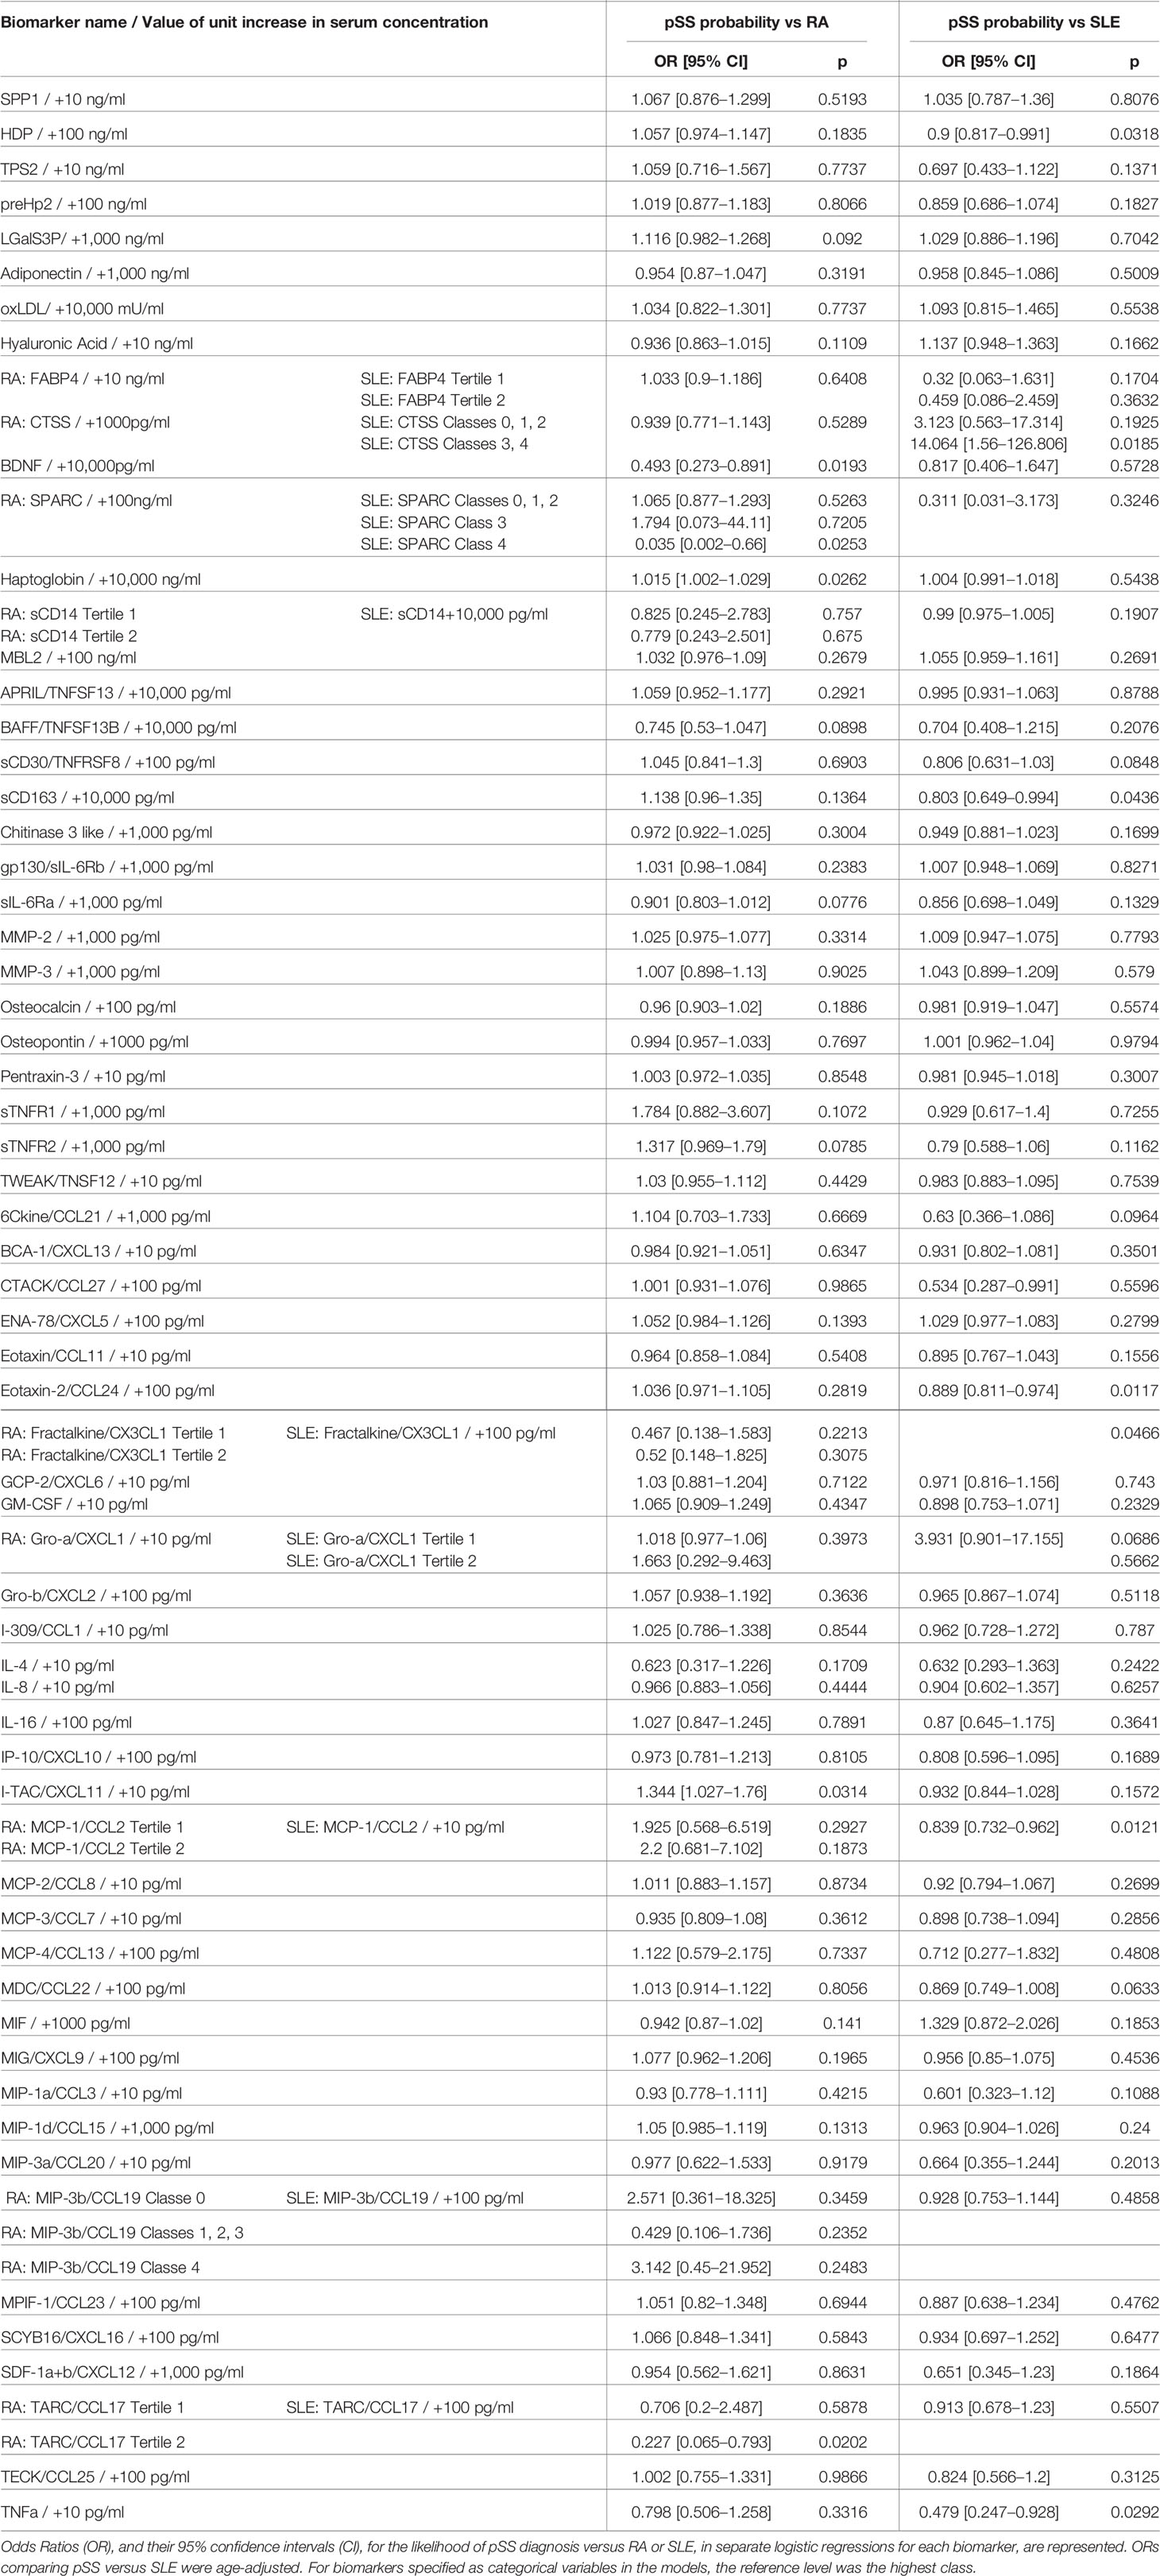
Table 2 Likelihood of primary Sjogren syndrome (pSS) diagnosis versus rheumatoid arthritis (RA) or Systemic Lupus Erythematosus (SLE) as a function of an increase in biomarker concentration.
The serum concentration of four of the 63 tested biomarkers could statistically discriminate pSS patients from RA patients. A 10,000 pg/ml greater concentration of BDNF was significantly associated with a decreased likelihood of pSS diagnosis compared to RA (OR = 0.493 and 95% CI [0.273–0.891]; p = 0.0193). While greater concentrations of haptoglobin (10,000 ng/ml) and I-TAC/CXCL11 (10 pg/ml) were significantly associated with moderate increases in the likelihood of pSS diagnosis over RA (haptoglobin: OR = 1.015 and 95% CI [1.002–1,029]; p = 0.0262; I-TAC/CXCL11: OR = 1.344 and 95% CI [1.027–1.76]; p = 0.0314). TARC/CCL17 concentration in the second tertile, compared to the third tertile, was associated with a decreased likelihood of pSS diagnosis compared to RA (OR = 0.227 and 95% CI [0.065–0.793]; p = 0.0202). However, a lower concentration of this biomarker (first tertile) did not significantly alter the likelihood of pSS diagnosis, suggesting a potentially spurious association.
Biomarkers Associated With pSS Versus SLE
Serum concentrations of eight biomarkers could statistically discriminate samples from pSS versus SLE patients (Table 2). A 100 ng/ml greater concentration of HDP was associated with a moderate decrease in the likelihood of pSS compared to SLE (OR = 0.9 and 95% CI [0.817–0.991]; p = 0.0318). CTSS concentration in classes 3 and 4, rather than in class 5, was strongly associated with an increased likelihood of pSS compared to SLE (OR = 14.064 and 95% CI [1.56–126.806]; p = 0.0185). However, lower concentrations of this marker (in classes 0, 1, or 2) could not significantly distinguish pSS from SLE. Similarly, SPARC concentration in class 4, rather than class 5, was associated with an increased likelihood of pSS compared to SLE (OR = 0.035 and 95% CI [0.002–0.66]; p = 0.0253), while at lower concentrations (in classes 0, 1, 2, or 3) there were no significant differences between the two AIDs. A 10,000 pg/ml greater concentration of sCD163 was significantly associated with a moderate decrease in the likelihood of pSS compared to SLE diagnosis (OR = 0.803 and 95% CI [0.649–0.994]; p = 0.0436). A 100 pg/ml greater concentration of Eotaxin-2/CCL24 was associated with a moderate decrease in the likelihood of pSS compared to SLE (OR = 0.889 and 95% CI [0.811–0.974]; p = 0.0117). A 100 pg/ml greater concentration of Fractalkine/CX3CL1 almost halved the likelihood of pSS compared to SLE (OR = 0.534 and 95% CI [0.287–0.991]; p = 0.0466). Lastly, a 10 pg/ml greater concentration of MCP-1/CCL2 was associated with a moderate decrease in the likelihood of pSS compared to SLE (OR = 0.839 and 95% CI [0.732–0.962]; p = 0.0121), while a 10 pg/ml greater concentration of TNFa was strongly associated with a decreased likelihood of pSS compared to SLE diagnosis (OR = 0.479 and 95% CI [0.247–0.928]; p = 0.0292).
Specific Proteomic Signature in pSS
None of the studied biomarkers could simultaneously discriminate pSS from RA and SLE. We therefore determined the positive predictive value (PPV), sensitivity, and specificity of different combinations of BDNF, I-TAC/CXCL11, sCD163 and Fractalkine/CX3CL1 concentrations. These biomarkers were chosen because they were those most strongly associated with distinguishing pSS from the other AIDs (OR < 0.8 or OR > 1.2, and p<0.05), thus constituting a specific proteomic signature of pSS compared to RA and SLE (Table 3). Concentrations of these biomarkers were considered low or high based on their median concentration in the whole cohort. We observed that a combination of low BDNF and high Fractalkine concentrations was very specific for pSS (96.2%) with a PPV of 80% but weakly sensitive (19%). Conversely, a combination of high I-TAC concentration and low sCD163 concentration was strongly specific for pSS (98.1%), with a PPV of 75%, but with very low sensitivity (7.1%). Other biomarkers associations had significantly lower statistical performance (Table 3).
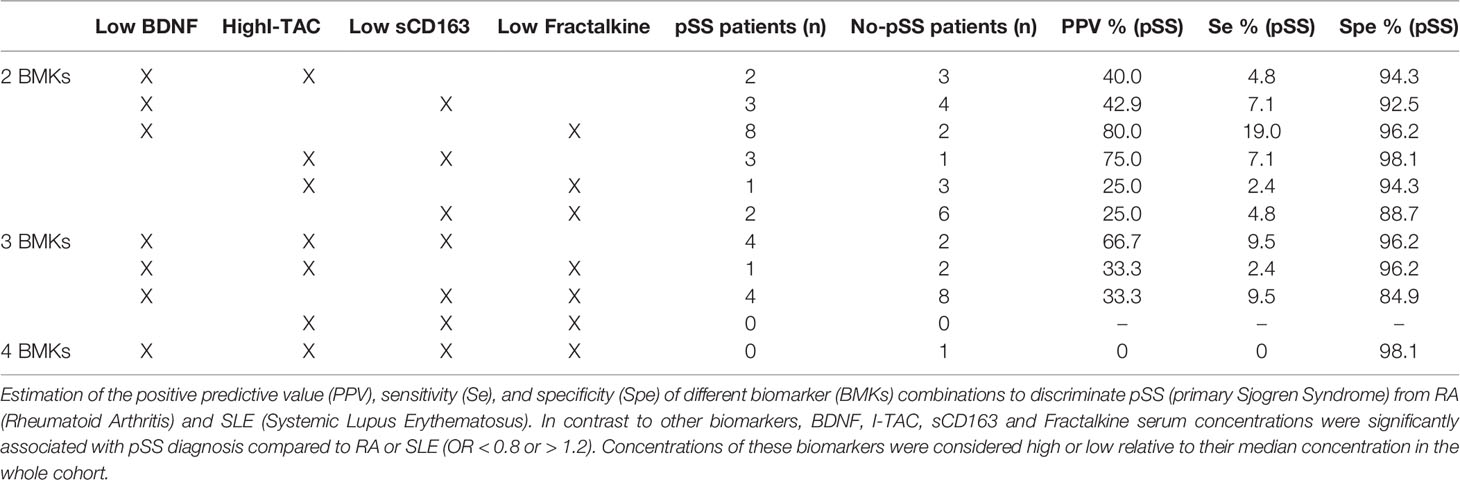
Table 3 Statistical performance of biomarker combinations to discriminate primary Sjögren’s syndrome (pSS) from rheumatoid arthritis (RA) and systemic lupus erythematosus (SLE).
In addition, we investigated the association between expression of the four main biomarkers (BDNF, I-TAC/CXCL11, sCD163 and Fractalkine/CX3CL1) and disease activity (Table S4, Supplemental Data). A significant negative correlation was observed between pSS activity according to the ESSDAI score and serum sCD163 concentrations (r = −0.33859; p = 0.0283). In the SLE group, SLEDAI disease activity was significantly and positively correlated with serum BDNF concentrations (r = 0.49541; p = 0.0138). For the other biomarkers, there was no statistically significant correlation between their serum concentration and pSS, RA or SLE disease activity.
Regulatory Roles of the Identified Biomarkers and Pathways Involved
Using IPA, we identified the top canonical pathways among the list of the 63 biomarkers that were enriched including BDNF, I-TAC/CXCL11, sCD163, and Fractalkine/CX3CL1. Figure 2 displays the top networks found to be enriched in this list. Each network shows interactions via major signaling pathway proteins, including Extracellular signal-Regulated Kinases 1/2 (ERK1/2), Nuclear Factor-kappa B (NF-kB), IL-17, and interferon. Functions associated with the top networks include cellular movement, cell interaction, and inflammatory response. The I-TAC/CXCL11-centered network displayed a functional interaction with several cytokines and forming a tightly connected network with ERK1/2 (Figure 2A). Fractalkine/CX3CL1 was also related to ERK1/2 and displayed direct interaction with this pathway. Moreover, the network (Figure 2B) shows interactions between sCD163 and the TNF family, suggesting an operative role of TNF signaling pathways. In addition, BDNF displayed a tightly connected network with functional interaction with immunoglobulins, histones, and 26s proteasomes (Figure 2C). Finally, the upstream regulator analysis in IPA identified NF-kB and IL17A as key regulators of I-TAC/CXCL11, Fractalkine/CX3CL1, BDNF, and multiple cytokines that are implicated in the attraction of cells and recruitment of leukocytes (Figures 2D, E).
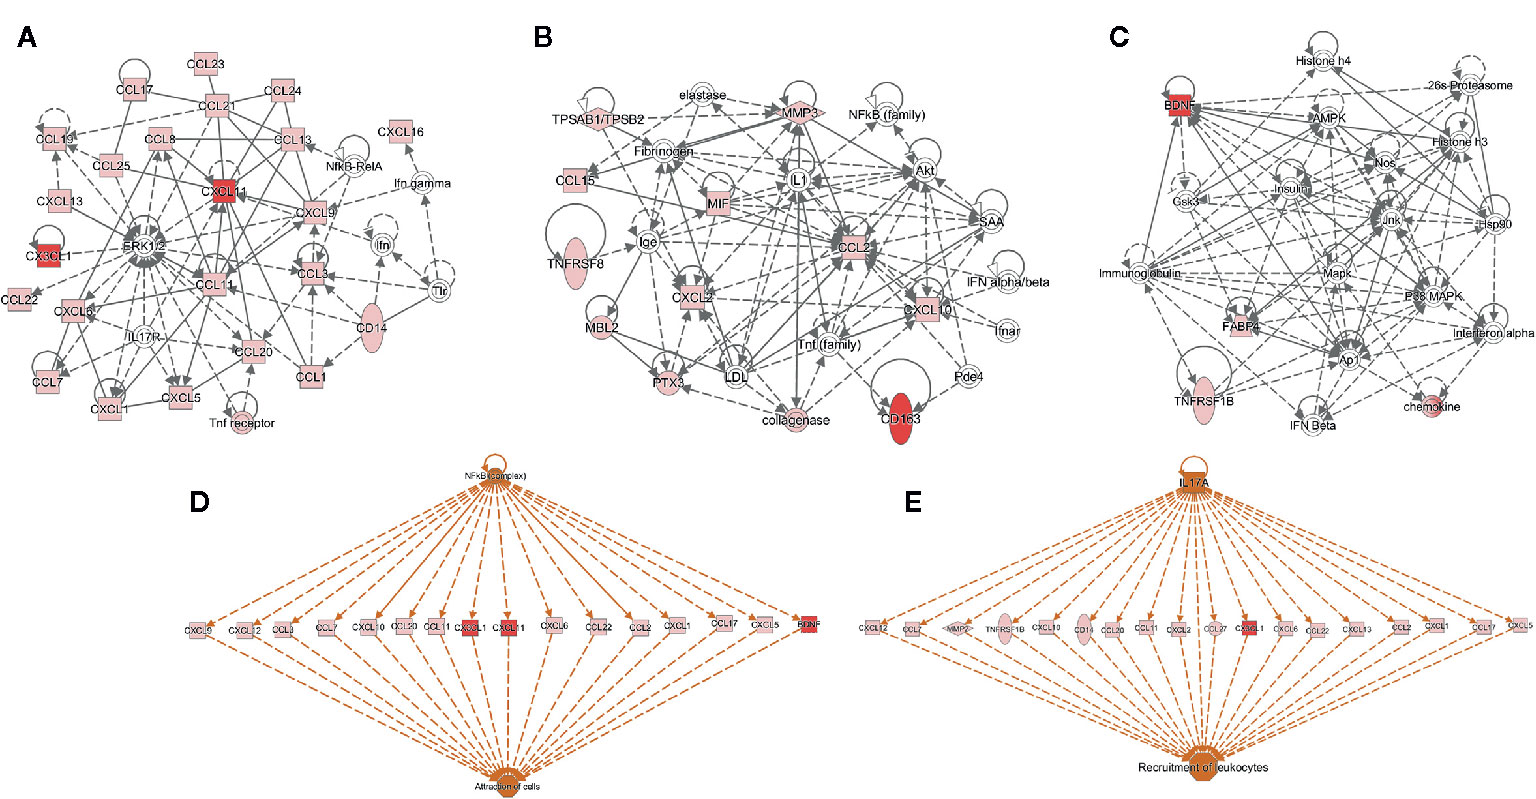
Figure 2 Functional and upstream regulatory networks. The most significant networks included proteins related to: (A) Cell-to-cell signaling and interaction, and cellular movement, (B) immune cell trafficking and inflammatory response, (C) organismal functions, hematological disease, and metabolic disease, (D, E) top-scoring network of regulator effects activated in the list of 63 biomarkers. Protein interaction networks were constructed using the ingenuity pathway analysis (IPA) software. Nodes shaded in pink represent proteins present in the list of 63 biomarkers; red nodes are proteins that are CXCL11 (I-TAC), CX3CL1 (Fractalkine), Brain Derived Neurotrophic Factor (BDNF), and sCD163; and proteins that are not found in the list of 63 biomarkers are in white. Dotted lines indicate indirect molecular interactions between proteins and continuous lines between nodes indicate direct functional interactions between connected proteins. Orange lines lead to activation.
Discussion
Our study compared the serum concentration of 63 biomarkers in patients with an established diagnosis of pSS to patients with established RA or SLE without secondary SS. We observed that differences in the concentration of BDNF, haptoglobin, and I-TAC/CXCL11 may allow discrimination of pSS from RA patients. Similarly, differences in the concentration of HDP, sCD163, Eotaxin-2/CCL24, Fractalkine/CX3CL1, MCP-1/CCL2, and TNFa may discriminate pSS from SLE. In addition, we observed that combinations of low BDNF and high Fractalkine/CX3CL1 concentrations, as well as high I-TAC and low sCD163 concentrations, were associated with high PPV and specificity for pSS. These four biomarkers may constitute a new and potentially useful specific signature for distinguishing pSS compared to RA and SLE. Indeed, our approach of screening a large number of biomarkers was also intended to highlight new lines of research, which could improve knowledge of pSS physiopathology, may differentiate pSS patients from patients with SLE or RA, and may provide future therapeutic targets.
Pathway analysis in which BDNF, Fractalkine/CX3CL1, and I-TAC/CXCL11 are linked strongly implies a potential functional role of NF-kB and IL-17 signaling pathways (Figure 2). Our results are consistent with previous reports of NF-kB pathway involvement in pSS pathophysiology. Indeed, its expression is increased in human salivary glands cells from pSS patients compared to controls (30). Polymorphisms of NF-kB target or regulatory genes are also associated with increased susceptibility to pSS (31) and pSS-related lymphoma (32–34). In addition, activation of the NF-kB pathway in Peripheral Mononuclear Blood Cells (PMBCs) from pSS patients may lead to IL-17 production through Toll-Like Receptor 2 (TLR2) activation (35), and NF-kB activation by TLR9 signaling appears to be facilitated in B lymphocytes of pSS patients (36). Therefore, the NF-kB pathway might be crucial in pSS pathophysiology through its activation in innate or acquired immunity cells, or even in epithelial cells, leading to an inflammatory response and activation of other inflammatory pathways such as IL-17, which is also involved in pSS development and progression (37).
To the best of our knowledge, our study is the first to compare serum BDNF levels in patients with pSS to those in patients with RA and SLE. Changes in BDNF concentration may depend on age or platelet levels (38). However, these two parameters were similar between the pSS and RA groups. Our study, therefore, suggests a different involvement of BDNF in pSS and RA physiopathology, either by its role in the nervous system (39), where BDNF is involved in proliferation and survival of nervous tissue (40) or by its action on the immune system (41) where BDNF affects the proliferation of T- and B-lymphocytes (42, 43).
I-TAC/CXCL11 is an IFNg-inducible chemokine, as are CXCL9 and CXCL10 (44), whose main function is to attract CXCR3-expressing cells (mainly activated T-lymphocytes, Natural Killer lymphocytes, and monocytes/macrophages) to the inflammatory site. Although CXCL11 seems to be involved in pSS salivary gland lesions (45–47), we did not find previous data regarding circulating CXCL11 in pSS patients. Furthermore, while serum concentrations of CXCL9 and CXCL10, two IFNg-induced chemokines able to bind CXCR3, were correlated with CXCL11 exclusively in the pSS group (p<0.0001), they could not discriminate pSS from RA or SLE (see Table 2). Therefore, it is possible that among the three ligands of CXCR3, only CXCL11 is differentially regulated in both RA and pSS, highlighting the role of IFNg in pSS.
sCD163 is derived from proteolytic cleavage of the extracellular portion of CD163 (48, 49), which is a membrane receptor found on anti-inflammatory M2 macrophages. Although sCD163 possesses anti-inflammatory activity (50), it is also considered a macrophage activation marker (51–54). Here, an increase in serum sCD163 concentration was significantly associated with a decreased likelihood of pSS compared to SLE. Corticosteroid could increase CD163+ cell counts and impact sCD163 circulating levels, although this has not yet been demonstrated (55). Here, the number of patients receiving corticosteroid was comparable between groups. However, the action of synthetic DMARDs or biologic drugs on sCD163 concentrations remains to be studied (55). Furthermore, sCD163 concentration may be associated with cardiovascular disease risk (56, 57). However, we did not find differences between SLE and pSS groups concerning the number of cardiovascular comorbidities. Thus, from a pathophysiological perspective, our results suggest either a different role of CD163+ macrophage lineage or a divergent regulation of sCD163 production in pSS and SLE.
Another molecule differentiating pSS from SLE is Fractalkine/CX3CL1, the latter being a membrane form chemokine released by proteolytic cleavage (58). In addition to Fractalkine’s chemotactic activity on monocytes and T-lymphocytes, it can facilitate the extravasation of leukocytes toward the inflammatory site (59). Fractalkine seems particularly involved in the pathophysiology of Sjogren sialadenitis (60–62) and lupus nephritis (63–65). Here, we observed an increase in serum Fractalkine concentration approximately halved the probability of pSS compared to SLE. We found only one study that analyzed serum Fractalkine concentration in SLE, RA, and pSS patients, with results consistent with ours (66). Fractalkine could therefore be involved in pSS and SLE pathophysiology, but with different regulation patterns and degrees of importance. As with I-TAC/CXCL11, Fractalkine is a chemokine induced by IFNg, which further emphasizes the primordial role of IFNg in pSS physiopathology. In addition, Lee et al. (61) found a significant correlation between serum concentrations of Fractalkine and TNFa in pSS patients. Here, serum concentrations of Fractalkine and TNFa were highly correlated in all groups (pSS: r = 0.689 and p<0.0001; RA: r = 0.608 and p = 0.0005; SLE: r = 0.563 and p = 0.003; data not shown), suggesting a strong pathophysiological relationship between these two biomarkers. TNFa is a pro-inflammatory cytokine involved in many autoimmune or auto-inflammatory diseases such as RA (67). While TNFa may be involved in the development of pSS in murine models (68), TNF inhibitors did not show efficacy in the treatment of pSS symptoms in humans (69–71). Thus, this cytokine may not be a key player in pSS pathophysiology. However, TNFa could be involved in SLE physiopathology, although its specific role remains to be specified (72, 73); our results are consistent with such a role of TNFa as we observed that greater serum concentrations of TNFa decreased the likelihood of pSS compared to SLE. Based on our data and those available in the literature, integration of serum TNFa concentration into a strategy to discriminate pSS from SLE appears premature.
Finally, we found that variation in serum concentrations of haptoglobin, HDP, MCP-1/CCL2, and Eotaxin-2/CCL24, were weakly associated with the likelihood of pSS compared to RA or SLE (0.8 < OR < 1.2). Despite statistically significant results, it is unlikely that these biomarkers could provide any clinical benefit. Similarly, we observed that at least one of the TARC/CCL17, CTSS, and SPARC concentration classes statistically discriminated pSS from one of the other AIDs. However, since pSS probability does not vary linearly across concentration classes, and given the small number of patients in SLE and RA groups, it is difficult to reach strong conclusions on these biomarkers’ discriminative abilities.
Our study has several limitations. First, heterogeneity in patient characteristics between each group could potentially influence the serum concentrations of the different biomarkers. For example, SLE patients were significantly younger than pSS and RA patients, disease duration was shorter in pSS group (and also in the chronic phase), and treatments differed among groups, particularly for biologic drugs. The potential confounding bias of age was corrected in logistic regression when necessary. Furthermore, the effect of immunomodulatory therapies on serum biomarker concentrations remains to be identified. We performed additional statistical analysis and the concomitant use of biologic drugs was not associated with significant changes in the expression of the four main biomarkers (BDNF, Fractalkine/CX3CL1, I-TAC/CXCL11 and sCD163). In addition, we did not find significant variations between patients with and without steroids except for the sCD163 biomarker where we observed lower levels in steroid-treated patients (Table S5, Supplemental Data). Another potential limitation is a lack of statistical power arising from the relatively small number of patients in RA and SLE groups, with sample sizes further reduced in some analyses by the exclusion of patients with no exploitable biological data (biomarker concentration outside the kit detection capabilities or variation of more than 20% between technical duplicates, Table S2 Supplemental Data). However, the number of patients does not seem so low when compared to previous studies recently published in the field (<100 patients) (21–23). Indeed, our results need to be reproduced and validated in a larger and independent cohort as suggested by Chau et al. (74), since only few of our candidate biomarkers may prove relevant, and we did not correct the alpha risk for multiple analyses. Finally, approximately 70% of our patients had a low disease activity, while a small minority of patients had a high disease activity (none in the SLE group). This restricted disease activity spectrum ensured a good comparison between groups. However, having a larger number of patients with a higher level of disease activity would probably improve biomarker identification and discriminatory ability.
In conclusion, serum concentrations of 63 immunological biomarkers in pSS, RA, and SLE patients showed that four biomarkers were relevant to discriminate pSS from RA (BDNF and I-TAC/CXCL11), and pSS from SLE (sCD163, Fractalkine/CX3CL1). The next steps are to validate the markers with a larger and more homogeneous population and then investigate how these four molecules contribute to the physiopathology of pSS. The NF-kB, IL-17, and interferon pathways seem to be implicated, consistent with the mechanisms already known in pSS.
Data Availability Statement
The data sets presented in this study can be found in online repositories. The names of the repository/repositories and accession number(s) can be found in the article/Supplementary Material.
Ethics Statement
The studies involving human participants were reviewed and approved by Comité de Protection des Personnes Sud Méditerranée IV: DC-2015-2584. The patients/participants provided their written informed consent to participate in this study.
Author Contributions
CJ, PGa, and Y-MP designed the experiments. RF, PGu, AM, RG, CJ, and Y-MP collected clinical data. Experimental works were performed by PGa and SA, and data were analyzed by GP, CD, MJ, SA, and Y-MP. GP and Y-MP prepared the manuscript. All authors have contributed to revising the manuscript and final approval. All authors contributed to the article and approved the submitted version.
Conflict of Interest
PGa was employed by company BioRad.
The remaining authors declare that the research was conducted in the absence of any commercial or financial relationships that could be construed as a potential conflict of interest.
Acknowledgments
We gratefully acknowledge the Bio-Rad laboratory for support of biological tests, the Biological Resource Center for collecting samples, the University of Montpellier, and University Hospital of Montpellier.
Supplementary Material
The Supplementary Material for this article can be found online at: https://www.frontiersin.org/articles/10.3389/fimmu.2021.631539/full#supplementary-material
References
1. Theander E, Jacobsson LTH. Relationship of Sjögren’s syndrome to other connective tissue and autoimmune disorders. Rheum Dis Clin North Am (2008) 34(4):935–47, viii–ix. doi: 10.1016/j.rdc.2008.08.009
2. Shiboski CH, Shiboski SC, Seror R, Criswell LA, Labetoulle M, Lietman TM, et al. American College of Rheumatology/European League Against Rheumatism Classification Criteria for Primary Sjögren’s Syndrome: A Consensus and Data-Driven Methodology Involving Three International Patient Cohorts. Arthritis Rheumatol (20162017) 69(1):35–45. doi: 10.1002/art.39859
3. Aletaha D, Neogi T, Silman AJ, Funovits J, Felson DT, Bingham CO, et al. Rheumatoid arthritis classification criteria: An American College of Rheumatology/European League Against Rheumatism collaborative initiative. Arthritis Rheumatol (20102010) 62(9):2569–81.
4. Aringer M, Costenbader K, Daikh D, Brinks R, Mosca M, Ramsey-Goldman R, et al. European League Against Rheumatism/American College of Rheumatology classification criteria for systemic lupus erythematosus. Ann Rheum Dis (20192019) 78(9):1151–9. doi: 10.1136/annrheumdis-2018-214819
5. McDonagh JE, Isenberg DA. Development of additional autoimmune diseases in a population of patients with systemic lupus erythematosus. Ann Rheum Dis (2000) 59(3):230–2. doi: 10.1136/ard.59.3.230
6. Lazarus MN, Isenberg DA. Development of additional autoimmune diseases in a population of patients with primary Sjögren’s syndrome. Ann Rheum Dis (2005) 64(7):1062–4. doi: 10.1136/ard.2004.029066
7. Carrozzo M, Scally K. Oral manifestations of hepatitis C virus infection. World J Gastroenterol WJG (2014) 20(24):7534–43. doi: 10.3748/wjg.v20.i24.7534
8. Franceschini F, Cavazzana I. Anti-Ro/SSA and La/SSB antibodies. Autoimmunity (2005) 38(1):55–63. doi: 10.1080/08916930400022954
9. Nocturne G, Mariette X. Advances in understanding the pathogenesis of primary Sjögren’s syndrome. Nat Rev Rheumatol (2013) 9(9):544–56. doi: 10.1038/nrrheum.2013.110
10. Bautista-Vargas M, Vivas AJ, Tobón GJ. Minor salivary gland biopsy: Its role in the classification and prognosis of Sjögren’s syndrome. Autoimmun Rev (2020) 19:102690. doi: 10.1016/j.autrev.2020.102690
11. Laborde CM, Castro-Santos P, Díaz-Peña R. Contribution of Multiplex Immunoassays to Rheumatoid Arthritis Management: From Biomarker Discovery to Personalized Medicine. J Pers Med (2020) 10(4):202. doi: 10.3390/jpm10040202
12. Ruiz-Romero C, Lam MPY, Nilsson P, Önnerfjord P, Utz PJ, Van Eyk JE, et al. Mining the Proteome Associated with Rheumatic and Autoimmune Diseases. J Proteome Res (2019) 18(12):4231–9. doi: 10.1021/acs.jproteome.9b00360
13. Moreno-Quispe LA, Serrano J, Virto L, Sanz M, Ramírez L, Fernández-Castro M, et al. Association of salivary inflammatory biomarkers with primary Sjögren’s syndrome. J Oral Pathol Med Off Publ Int Assoc Oral Pathol Am Acad Oral Pathol (2020) 49(9):940–7. doi: 10.1111/jop.13070
14. Eastman PS, Manning WC, Qureshi F, Haney D, Cavet G, Alexander C, et al. Characterization of a multiplex, 12-biomarker test for rheumatoid arthritis. J Pharm BioMed Anal (2012) 70:415–24. doi: 10.1016/j.jpba.2012.06.003
15. Casey KA, Smith MA, Sinibaldi D, Seto NL, Playford MP, Wang X, et al. Modulation of cardiometabolic disease markers by type I interferon inhibition in systemic lupus erythematosus. Arthritis Rheumatol Hoboken NJ (2020). doi: 10.1002/art.41518
16. Ward G, Simpson A, Boscato L, Hickman PE. The investigation of interferences in immunoassay. Clin Biochem (2017) 50(18):1306–11. doi: 10.1016/j.clinbiochem.2017.08.015
17. Tzioufas AG, Bootsma H, Pers J-O. EULAR Sjögren’s syndrome study group: an eSSential way to address the unmet needs of the disease. Clin Exp Rheumatol (2020) 38 Suppl 126(4):23–4.
18. Baldini C, Ferro F, Elefante E, Bombardieri S. Biomarkers for Sjögren’s syndrome. Biomark Med (2018) 12(3):275–86. doi: 10.2217/bmm-2017-0297
19. Martín-Nares E, Hernández-Molina G. Novel autoantibodies in Sjögren’s syndrome: A comprehensive review. Autoimmun Rev (2019) 18(2):192–8. doi: 10.1016/j.autrev.2018.09.003
20. Ramponi G, Folci M, Badalamenti S, Angelini C, Brunetta E. Biomarkers and Diagnostic Testing for Renal Disease in Sjogren’s Syndrome. Front Immunol (2020) 11:2226. doi: 10.3389/fimmu.2020.562101
21. Tasaki S, Suzuki K, Nishikawa A, Kassai Y, Takiguchi M, Kurisu R, et al. Multiomic disease signatures converge to cytotoxic CD8 T cells in primary Sjögren’s syndrome. Ann Rheum Dis (2017) 76(8):1458–66. doi: 10.1136/annrheumdis-2016-210788
22. Nishikawa A, Suzuki K, Kassai Y, Gotou Y, Takiguchi M, Miyazaki T, et al. Identification of definitive serum biomarkers associated with disease activity in primary Sjögren’s syndrome. Arthritis Res Ther (2016) 18(1):106. doi: 10.1186/s13075-016-1006-1
23. Jonsson R, Brokstad KA, Jonsson MV, Delaleu N, Skarstein K. Current concepts on Sjögren’s syndrome – classification criteria and biomarkers. Eur J Oral Sci (2018) 126(Suppl Suppl 1):37–48. doi: 10.1111/eos.12536
24. Petri M, Orbai A-M, Alarcón GS, Gordon C, Merrill JT, Fortin PR, et al. Derivation and Validation of Systemic Lupus International Collaborating Clinics Classification Criteria for Systemic Lupus Erythematosus. Arthritis Rheumatol (2012) 64(8):2677–86. doi: 10.1002/acr.21649
25. Seror R, Bootsma H, Saraux A, Bowman SJ, Theander E, Brun JG, et al. Defining disease activity states and clinically meaningful improvement in primary Sjögren’s syndrome with EULAR primary Sjögren’s syndrome disease activity (ESSDAI) and patient-reported indexes (ESSPRI). Ann Rheum Dis (2016) 75(2):382–9. doi: 10.1002/art.1780350606
26. Anderson J, Caplan L, Yazdany J, Robbins ML, Neogi T, Michaud K, et al. Rheumatoid arthritis disease activity measures: American College of Rheumatology recommendations for use in clinical practice. Arthritis Care Res (2012) 64(5):640–7. doi: 10.1002/acr.21649
27. Bombardier C, Gladman DD, Urowitz MB, Caron D, Chang CH. Derivation of the SLEDAI. A disease activity index for lupus patients. The Committee on Prognosis Studies in SLE. Arthritis Rheumatol (1992) 35(6):630–40. doi: 10.1002/art.1780350606
28. Flanagan JJ, Arjomandi A, Delanoy ML, Du Paty E, Galea P, Laune D, et al. Development of monoclonal antibodies to pre-haptoglobin 2 and their use in an enzyme-linked immunosorbent assay (ELISA). J Immunol Methods (2014) 406:34–42. doi: 10.1016/j.jim.2014.02.009
29. Krämer A, Green J, Pollard J, Tugendreich S. Causal analysis approaches in Ingenuity Pathway Analysis. Bioinforma Oxf Engl (2014) 30(4):523–30. doi: 10.1093/bioinformatics/btt703
30. Vakrakou AG, Polyzos A, Kapsogeorgou EK, Thanos D, Manoussakis MN. Impaired anti-inflammatory activity of PPARγ in the salivary epithelia of Sjögren’s syndrome patients imposed by intrinsic NF-κB activation. J Autoimmun (2018) 86:62–74. doi: 10.1016/j.jaut.2017.09.007
31. Reksten TR, Lessard CJ, Sivils KL. Genetics in Sjögren Syndrome. Rheum Dis Clin North Am (2016) 42(3):435–47. doi: 10.1016/j.rdc.2016.03.003
32. Papageorgiou A, Mavragani CP, Nezos A, Zintzaras E, Quartuccio L, De Vita S, et al. A BAFF receptor His159Tyr mutation in Sjögren’s syndrome-related lymphoproliferation. Arthritis Rheumatol Hoboken NJ (2015) 67(10):2732–41. doi: 10.1002/art.39231
33. Nocturne G, Tarn J, Boudaoud S, Locke J, Miceli-Richard C, Hachulla E, et al. Germline variation of TNFAIP3 in primary Sjögren’s syndrome-associated lymphoma. Ann Rheum Dis (2016) 75(4):780–3. doi: 10.1136/annrheumdis-2015-207731
34. Nezos A, Gkioka E, Koutsilieris M, Voulgarelis M, Tzioufas AG, Mavragani CP. TNFAIP3 F127C Coding Variation in Greek Primary Sjogren’s Syndrome Patients. J Immunol Res (2018) 2018:6923213. doi: 10.1155/2018/6923213
35. Kwok S-K, Cho M-L, Her Y-M, Oh H-J, Park M-K, Lee S-Y, et al. TLR2 ligation induces the production of IL-23/IL-17 via IL-6, STAT3 and NF-kB pathway in patients with primary Sjogren’s syndrome. Arthritis Res Ther (2012) 14(2):R64. doi: 10.1186/ar3780
36. Sun J-L, Zhang H-Z, Liu S-Y, Lian C-F, Chen Z-L, Shao T-H, et al. Elevated EPSTI1 promote B cell hyperactivation through NF-κB signalling in patients with primary Sjögren’s syndrome. Ann Rheum Dis (2020) 79(4):518–24. doi: 10.1136/annrheumdis-2019-216428
37. Verstappen GM, Corneth OBJ, Bootsma H, Kroese FGM. Th17 cells in primary Sjögren’s syndrome: Pathogenicity and plasticity. J Autoimmun (2018) 87:16–25. doi: 10.1016/j.jaut.2017.11.003
38. Naegelin Y, Dingsdale H, Säuberli K, Schädelin S, Kappos L, Barde Y-A. Measuring and Validating the Levels of Brain-Derived Neurotrophic Factor in Human Serum. eNeuro (2018) 5(2):R262–264. doi: 10.1523/ENEURO.0419-17.2018
39. Bathina S, Das UN. Brain-derived neurotrophic factor and its clinical implications. Arch Med Sci AMS (2015) 11(6):1164–78. doi: 10.5114/aoms.2015.56342
40. Thomas K, Davies A. Neurotrophins: a ticket to ride for BDNF. Curr Biol CB (2005) 15(7):R262–264. doi: 10.1016/j.cub.2005.03.023
41. Vega JA, García-Suárez O, Hannestad J, Pérez-Pérez M, Germanà A. Neurotrophins and the immune system. J Anat (2003) 203(1):1–19. doi: 10.1046/j.1469-7580.2003.00203.x
42. De Santi L, Cantalupo L, Tassi M, Raspadori D, Cioni C, Annunziata P. Higher expression of BDNF receptor gp145trkB is associated with lower apoptosis intensity in T cell lines in multiple sclerosis. J Neurol Sci (2009) 277(1–2):65–70. doi: 10.1016/j.jns.2008.10.006
43. Dubanet L, Bentayeb H, Petit B, Olivrie A, Saada S, de la Cruz-Morcillo MA, et al. Anti-apoptotic role and clinical relevance of neurotrophins in diffuse large B-cell lymphomas. Br J Cancer (2015) 113(6):934–44. doi: 10.1038/bjc.2015.274
44. Groom JR, Luster AD. CXCR3 ligands: redundant, collaborative and antagonistic functions. Immunol Cell Biol (2011) 89(2):207–15. doi: 10.1038/icb.2010.158
45. Ogawa N, Ping L, Zhenjun L, Takada Y, Sugai S. Involvement of the interferon-gamma-induced T cell-attracting chemokines, interferon-gamma-inducible 10-kd protein (CXCL10) and monokine induced by interferon-gamma (CXCL9), in the salivary gland lesions of patients with Sjögren’s syndrome. Arthritis Rheumatol (2002) 46(10):2730–41. doi: 10.1002/art.10577
46. Ogawa N, Kawanami T, Shimoyama K, Ping L, Sugai S. Expression of interferon-inducible T cell alpha chemoattractant (CXCL11) in the salivary glands of patients with Sjögren’s syndrome. Clin Immunol Orlando Fla (2004) 112(3):235–8. doi: 10.1016/j.clim.2004.03.008
47. Aota K, Yamanoi T, Kani K, Nakashiro K, Ishimaru N, Azuma M. Inverse correlation between the number of CXCR3+ macrophages and the severity of inflammatory lesions in Sjögren’s syndrome salivary glands: A pilot study. J Oral Pathol Med (2018) 47(7):710–8. doi: 10.1111/jop.12756
48. Timmermann M, Högger P. Oxidative stress and 8-iso-prostaglandin F(2alpha) induce ectodomain shedding of CD163 and release of tumor necrosis factor-alpha from human monocytes. Free Radic Biol Med (2005) 39(1):98–107. doi: 10.1016/j.freeradbiomed.2005.02.031
49. Zhi Y, Gao P, Xin X, Li W, Ji L, Zhang L, et al. Clinical significance of sCD163 and its possible role in asthma. Mol Med Rep (2017) 15(5):2931–9. doi: 10.3892/mmr.2017.6393
50. Frings W, Dreier J, Sorg C. Only the soluble form of the scavenger receptor CD163 acts inhibitory on phorbol ester-activated T-lymphocytes, whereas membrane-bound protein has no effect. FEBS Lett (2002) 526(1–3):93–6. doi: 10.1016/S0014-5793(02)03142-3
51. Cui Y, Zhang Y, Rong Q, Zhu Y. [Changes and significance of soluble CD 163 in sepsis and severe sepsis in children]. Zhonghua Er Ke Za Zhi Chin J Pediatr (2012) 50(9):653–6. doi: 10.1111/j.1365-2036.2012.05134.x
52. Zanni MV, Burdo TH, Makimura H, Williams KC, Grinspoon SK. Relationship between monocyte/macrophage activation marker soluble CD163 and insulin resistance in obese and normal-weight subjects. Clin Endocrinol (Oxf) (2012) 77(3):385–90. doi: 10.1111/j.1365-2265.2011.04284.x
53. Grønbaek H, Sandahl TD, Mortensen C, Vilstrup H, Møller HJ, Møller S. Soluble CD163, a marker of Kupffer cell activation, is related to portal hypertension in patients with liver cirrhosis. Aliment Pharmacol Ther (2012) 36(2):173–80. doi: 10.1111/j.1365-2036.2012.05134.x
54. Shaked I, Hanna DB, Gleißner C, Marsh B, Plants J, Tracy D, et al. Macrophage inflammatory markers are associated with subclinical carotid artery disease in women with human immunodeficiency virus or hepatitis C virus infection. Arterioscler Thromb Vasc Biol (2014) 34(5):1085–92. doi: 10.1161/ATVBAHA.113.303153
55. Jude C, Dejica D, Samasca G, Balacescu L, Balacescu O. Soluble CD163 serum levels are elevated and correlated with IL-12 and CXCL10 in patients with long-standing rheumatoid arthritis. Rheumatol Int (2013) 33(4):1031–7. doi: 10.1007/s00296-012-2459-4
56. Aristoteli LP, Møller HJ, Bailey B, Moestrup SK, Kritharides L. The monocytic lineage specific soluble CD163 is a plasma marker of coronary atherosclerosis. Atherosclerosis (2006) 184(2):342–7. doi: 10.1016/j.atherosclerosis.2005.05.004
57. David C, Divard G, Abbas R, Escoubet B, Chezel J, Chauveheid MP, et al. Soluble CD163 is a biomarker for accelerated atherosclerosis in systemic lupus erythematosus patients at apparent low risk for cardiovascular disease. Scand J Rheumatol (2019) 2:1–5. doi: 10.1080/03009742.2019.1614213
58. Clark AK, Staniland AA, Malcangio M. Fractalkine/CX3CR1 signalling in chronic pain and inflammation. Curr Pharm Biotechnol (2011) 12(10):1707–14. doi: 10.2174/138920111798357465
59. Jones B, Koch AE, Ahmed S. Pathological role of fractalkine/CX3CL1 in rheumatic diseases: a unique chemokine with multiple functions. Front Immunol (2011) 2:82. doi: 10.3389/fimmu.2011.00082
60. Astorri E, Scrivo R, Bombardieri M, Picarelli G, Pecorella I, Porzia A, et al. CX3CL1 and CX3CR1 expression in tertiary lymphoid structures in salivary gland infiltrates: fractalkine contribution to lymphoid neogenesis in Sjogren’s syndrome. Rheumatol Oxf Engl (2014) 53(4):611–20. doi: 10.1093/rheumatology/ket401
61. Lee JH, Kwok S-K, Jung SM, Lee J, Lee J-S, Baek SY, et al. Role of fractalkine in the pathogenesis of primary Sjögren syndrome: increased serum levels of fractalkine, its expression in labial salivary glands, and the association with clinical manifestations. J Rheumatol (2014) 41(12):2425–38. doi: 10.3899/jrheum.130892
62. Zhao L, Xu W, Chen Z, Zhang H, Zhang S, Lian C, et al. Aberrant distribution of CD3+CD56+ NKT-like cells in patients with primary Sjögren’s syndrome. Clin Exp Rheumatol (2020) 33:520–23.
63. Yoshimoto S, Nakatani K, Iwano M, Asai O, Samejima K, Sakan H, et al. Elevated levels of fractalkine expression and accumulation of CD16+ monocytes in glomeruli of active lupus nephritis. Am J Kidney Dis Off J Natl Kidney Found. (2007) 50(1):47–58. doi: 10.1053/j.ajkd.2007.04.012
64. You Y, Liao P, Qin Y, Lin X, Li J. [Blood and renal fractalkine expression in patients with lupus nephritis and its significance]. Nan Fang Yi Ke Da Xue Xue Bao (2013) 33(4):520–3. doi: 10.1136/ard.2005.051276s
65. Olaru F, Döbel T, Lonsdorf AS, Oehrl S, Maas M, Enk AH, et al. Intracapillary immune complexes recruit and activate slan-expressing CD16+ monocytes in human lupus nephritis. JCI Insight (2018) 3(11):907–16. doi: 10.1172/jci.insight.96492
66. Sato E, Iikuni N, Yoshio T, Minota S, Kamatani N, Okamoto H. Soluble fractalkine in the cerebrospinal fluid of patients with neuropsychiatric lupus. Ann Rheum Dis (2006) 65(9):1257–9. doi: 10.1136/ard.2005.051276
67. Choy EH, Panayi GS. Cytokine pathways and joint inflammation in rheumatoid arthritis. N Engl J Med (2001) 344(12):907–16. doi: 10.1056/NEJM200103223441207
68. Zhou J, Kawai T, Yu Q. Pathogenic role of endogenous TNF-α in the development of Sjögren’s-like sialadenitis and secretory dysfunction in non-obese diabetic mice. Lab Investig J Tech Methods Pathol (2017) 97(4):458–67. doi: 10.1038/labinvest.2016.141
69. Sankar V, Brennan MT, Kok MR, Leakan RA, Smith JA, Manny J, et al. Etanercept in Sjögren’s syndrome: a twelve-week randomized, double-blind, placebo-controlled pilot clinical trial. Arthritis Rheumatol (2004) 50(7):2240–5. doi: 10.1002/art.20299
70. Mariette X, Ravaud P, Steinfeld S, Baron G, Goetz J, Hachulla E, et al. Inefficacy of infliximab in primary Sjögren’s syndrome: results of the randomized, controlled Trial of Remicade in Primary Sjögren’s Syndrome (TRIPSS). Arthritis Rheumatol (2004) 50(4):1270–6. doi: 10.1002/art.20146
71. Moutsopoulos NM, Katsifis GE, Angelov N, Leakan RA, Sankar V, Pillemer S, et al. Lack of efficacy of etanercept in Sjögren syndrome correlates with failed suppression of tumour necrosis factor alpha and systemic immune activation. Ann Rheum Dis (2008) 67(10):1437–43. doi: 10.1136/ard.2007.077891
72. Aringer M, Smolen JS. The role of tumor necrosis factor-alpha in systemic lupus erythematosus. Arthritis Res Ther (2008) 10(1):202. doi: 10.1186/ar2341
73. Postal M, Appenzeller S. The role of Tumor Necrosis Factor-alpha (TNF-α) in the pathogenesis of systemic lupus erythematosus. Cytokine (2011) 56(3):537–43. doi: 10.1016/j.cyto.2011.08.026
Keywords: primary Sjögren syndrome, systemic lupus erythematosus, rheumatoid arthritis, biomarkers, proteomics
Citation: Padern G, Duflos C, Ferreira R, Assou S, Guilpain P, Maria ATJ, Goulabchand R, Galea P, Jurtela M, Jorgensen C and Pers Y-M (2021) Identification of a Novel Serum Proteomic Signature for Primary Sjögren’s Syndrome. Front. Immunol. 12:631539. doi: 10.3389/fimmu.2021.631539
Received: 20 November 2020; Accepted: 04 January 2021;
Published: 23 February 2021.
Edited by:
Katarzyna Bogunia-Kubik, Polish Academy of Sciences, PolandCopyright © 2021 Padern, Duflos, Ferreira, Assou, Guilpain, Maria, Goulabchand, Galea, Jurtela, Jorgensen and Pers. This is an open-access article distributed under the terms of the Creative Commons Attribution License (CC BY). The use, distribution or reproduction in other forums is permitted, provided the original author(s) and the copyright owner(s) are credited and that the original publication in this journal is cited, in accordance with accepted academic practice. No use, distribution or reproduction is permitted which does not comply with these terms.
*Correspondence: Yves-Marie Pers, eW0tcGVyc0BjaHUtbW9udHBlbGxpZXIuZnI=