 Kate M. Sutton1*
 Katrina M. Morris1
 Dominika Borowska1
 Helen Sang2
 Pete Kaiser1
 Adam Balic2
 Lonneke Vervelde1
- 1Division of Infection and Immunity, The Roslin Institute, University of Edinburgh, Edinburgh, United Kingdom
- 2Division of Functional Genetics and Development, The Roslin Institute, University of Edinburgh, Edinburgh, United Kingdom
The spleen is a major site for the immunological responses to blood-borne antigens that is coordinated by cells of the mononuclear phagocyte system (MPS). The chicken spleen is populated with a number of different macrophages while the presence of conventional dendritic cells (cDC) has been described. However, a detailed characterization of the phenotype and function of different macrophage subsets and cDC in the chicken spleen is limited. Using the CSF1R-reporter transgenic chickens (CSF1R-tg), in which cells of the MPS express a transgene under the control elements of the chicken CSF1R, we carried out an in-depth characterization of these cells in the spleen. Immunohistological analysis demonstrated differential expression of MRC1L-B by periarteriolar lymphoid sheaths (PALS)-associated CSF1R-tg+ cells. In the chicken's equivalent of the mammalian marginal zone, the peri-ellipsoid white-pulp (PWP), we identified high expression of putative CD11c by ellipsoid-associated cells compared to ellipsoid-associated macrophages. In addition, we identified a novel ellipsoid macrophage subset that expressed MHCII, CD11c, MRC1L-B, and CSF1R but not the CSF1R-tg. In flow cytometric analysis, diverse expression of the CSF1R-tg and MHCII was observed leading to the categorization of CSF1R-tg cells into CSF1R-tgdim MHCIIinter−hi, CSF1R-tghi MHCIIhi, and CSF1R-tghi MHCIIinter subpopulations. Low levels of CD80, CD40, MHCI, CD44, and Ch74.2 were expressed by the CSF1R-tghi MHCIIinter cells. Functionally, in vivo fluorescent bead uptake was significantly higher in the CSF1R-tghi MHCIIhi MRC1L-B+ cells compared to the CSF1R-tgdim and CSF1R-tghi MHCIIinter MRC1L-B+ subpopulations while LPS enhanced phagocytosis by the CSF1R-tghi MHCIIinter subpopulation. The analysis of bead localization in the spleen suggests the presence of ellipsoid-associated macrophage subsets. In addition, we demonstrated the functionality of ex vivo derived CSF1R-tg+ MRC1L-Bneg cDC. Finally, RNA-seq analysis of the CSF1R-tg subpopulations demonstrated that separating the CSF1R-tghi subpopulation into CD11chi and CD11cdim cells enriched for cDC and macrophage lineages, respectively, while the CSF1R-tghi MHCIIinter subpopulation was enriched for red pulp macrophages. However, our analysis could not define the cell lineage of the heterogeneous CSF1R-tgdim subpopulation. This detailed overview of the MPS in the chicken spleen will contribute to future research on their role in antigen uptake and presentation.
Introduction
The vertebrate spleen is a secondary lymphoid organ and despite differences in the immune system among vertebrates, the spleens basic histological architecture and its role in filtering the blood for antigens and damaged, aged cells has been conserved during evolution from fish, amphibians, birds, and mammals. In the mammalian spleen, the afferent splenic artery branches into the central artery which is sheathed by the white pulp areas that include the T cell zones known as the periarteriolar lymphoid sheath (PALS), arterioles, and B cell follicles. The white pulp and red pulp are extensively populated with macrophages and dendritic cells (DC) with distinct origins and functions that contribute to the control of blood-borne pathogens and homeostatic processes (1). The venous system of the red pulp gives it the capacity to filter the blood and remove old erythrocytes by red pulp macrophages. Red pulp macrophages are defined by ADGRE1hi (ERM1, F4/80) CD11blo/CD18 or ADGRE1+ CD11b/CD18hi expression (2, 3). The murine splenic red pulp also contains reservoirs of monocytes that are transcriptionally similar to their blood counterparts, Ly-6C+ and Ly-6C++ cells (ADGRE1−/lo CD11b+ CD11c−) that egress to sites of tissue damage (4, 5).
The main difference between rodents and primates spleen is the structure of the marginal zone (MZ) that surrounds the white pulp. In contrast to mice, the human MZ has an inner and outer region that is surrounded by a large perifollicular zone [reviewed by (6, 7)]. The MZ consists of two resident macrophages subsets, metallophilic macrophages (MMM) located at the outer margins of the MZ and MZ macrophages (MZM) located in the inner regions of the MZ. Both MZ-resident macrophages express the scavenger receptor, MARCO while MZM also express SIGN-R1 (CD209b) (8). The MMM can uptake particular blood-borne antigens and present them to DC for cross-presentation to CD8+ cytotoxic T cells but they are not necessary for direct T cell activation (9).
Mammalian DC are composed of two major populations: conventional DC and plasmacytoid DC (pDC). Mammalian conventional DC are further subdivided into two major populations, cDC1 and cDC2. cDC1 develop in a BATF3 and IRF8 dependent manner and are identified by their surface expression of XCR1 and CD103, respectively (10–12). In the mammalian spleen, cDC1 are located within the T cell zones of the PALS and the outer regions of the MZ (13). The IRF4-dependent cDC2 population express CD11b, SIRPα, and DEC-205 (CD205). cDC2 are a heterogeneous cell population, the definition of these is yet to be fully resolved but they have been implicated in driving Th1, Th2, and Th17 polarization (14). The third group of DC are the IRF8-, E2-2-, and SpiB-dependent CD123+ pDC which are the primary source of type I IFN production following viral infection (15, 16). In humans, CD141+ (BDCA3) and CD1c+ (BDCA1), and the CD303+ (BDCA2) cells are the equivalent of murine cDC1, cDC2, and pDC subsets, respectively (17). In veterinary species where reagents are limited for the study of cDC and macrophage subsets, the identification of MPS cell ontogeny and cell type identity has been determined by specific gene expression patterns. For example, comparative genome analysis has identify homologous of cDC1 and cDC2 in sheep and pigs (18, 19), and cattle (20, 21). In the chicken, gene expression patterns have identified subsets of monocytes in the blood, resident tissue macrophages and cDC in the liver and spleen (22, 23).
The basic structure of the chicken spleen resembles it mammalian counterpart, with morphologically defined white pulp and red pulp regions. The white pulp contains the PALS and peri-ellipsoid white-pulp (PWP) which surround the penicillar capillaries. The PWP is analogous to the mammalian marginal zone. The ellipsoid, more commonly known as the capsule of Schweigger-Seidel (CSS) in mammals, is embedded within the PWP. The PWP contains three distinct cell populations, the ellipsoid-associated cells (EAC) and B cells intermingled with ellipsoid-associated macrophages (EAM). Studies have demonstrated the ability of EAC to retain antigen at their cell surface to either provide the antigen to the EAM or for transport to the PALS where they develop into FDC (24–28). Mannose receptor C1-like B (MRC1L-B, recognized by KUL01) is one of five orthologs of mammalian MRC1 (206) and a key mononuclear phagocytic cell marker in lymphoid and non-lymphoid tissues in chickens (29, 30). A previous comparative genomic analysis showed that splenic cDC lack MRC1L-B expression (23). However, there is limited research on the function and location of cDC, and the phenotype, function, and transcriptome of PALS-, PWP-, and red pulp-associated cells of the MPS in the chicken spleen.
The development, maintenance, and proliferation of cells of the MPS are dependent upon signals from CSF1 through its receptor, CSF1R (31) while DC require signals from FLT3L and its receptor, FLT3 (32). The tools to study the chicken MPS have been improved by the generation of the CSF1R-reporter transgenic chickens, in which a transgene is expressed under the control of the CSF1R-promoter and Fms-intronic regulatory element (FIRE) (33). These reporter chickens have contributed to the characterization of yolk-sac-derived macrophages, monocytes, and resident tissue mononuclear phagocytic cells (33–36). In this study, we utilize the CSF1R-reporter transgenic chickens to demonstrate the heterogeneity of the MPS in the spleen. We show that the spleen contains at least three CSF1R-tg+ subpopulations that diversely express CSF1R-tg, MHCII, MRC1L-B, and CD11c along with other macrophage markers. We also identified a CSF1R-tgneg macrophage population that express CSF1R protein in the PWP and demonstrate their ability to uptake beads in vivo. Furthermore, in vivo antigen uptake lead to the discovery of the diverse expression of the CSF1R-tg in EAM in the PWP. In addition, we demonstrate the phagocytic ability of cDC ex vivo. Finally, using RNA-seq we demonstrate that separation of the CSF1R-tghi MHCIIhi subpopulation into CD11chi and CD11cdim subsets, enriches for genes associated with cDC and macrophage lineages while the gene signatures characteristic of red pulp macrophages are enriched in CSF1R-tghi MHCIIinter subpopulation. Future experiments will address the cDC-T cell interactions and the role of various cells of the splenic MPS in antigen-uptake and presentation.
Materials and Methods
Chickens
CSF1R-reporter transgenic (33) and non-transgenic Hy-Line birds (Hy-Line Brown) between the ages of 4–8 weeks of age were provided by the National Avian Research Facility (NARF), Edinburgh, U.K. Unvaccinated chickens were reared in floor pens with access to water and food ad-libitum.
Isolation of Splenocytes
Spleens were aseptically removed and stored in PBS on ice. Spleens were homogenized using PYREX® Potter-Elvehjem glass tissue grinder and passed through 70 μm cell strainer (Corning®). Cells were overlaid on Histopaque (1.077 g, Sigma-Aldrich) and the interface and cell layer above were retrieved and washed twice with calcium and magnesium free PBS (pH 7.4). Cells were counted and stained at 1 × 10⁶ cells for flow cytometric analysis.
In vitro Cell Cultures
Splenocytes were cultured at 20 × 106 cells/mL in complete media [RPMI supplemented with 10% heat-inactivated fetal bovine serum (FBS), 100 IU of penicillin, 100 μg of streptomycin (Gibco), 2 mM/mL L-glutamine (Life Technologies), and 200 ng/mL of recombinant chicken CSF1-Fc (35)]. After 24 h, non-adherent cells were removed and adherent cells were treated with TrypLE express (ThermoFisher) and reseeded at 5 × 10⁵ cells in 24-well plates (Corning) in complete media. Cells were incubated at 41°C, 5% CO2. Twenty-four hours later, cells were stimulated with pHrodoTM Red labeled Zymosan or E. coli bioparticlesTM, unlabeled or LPS labeled 1 μm FluoSpheres® beads (ThermoFisher) (10:1 ratio of particles/beads to cells) at 41 or 4°C. To inhibit actin polymerization, cells were treated with Cytochalasin D (Cayman Chemical) for 10 min prior to addition of the model antigens. Three hours post-treatment, ice-cold PBS was added to each well and cells were collected using TrypLE express (Gibco) for flow cytometric analysis. For immunostaining of in vitro cultured cells, 13 mm circular cover slips (ThermoFisher) were placed in 24-well plates and cultured as described above.
Immunostaining of Tissue Sections
For histological analysis, spleens were immediately flash frozen over liquid nitrogen or fixed in 4% paraformaldehyde (PFA/PBS) for 3 h and infused overnight with 30% sucrose (Sigma-Aldrich) at 4°C. All samples were stored at −80°C until use. Tissue sections were cut at 7 μm (Leica CM1900) and mounted on SuperFrost PlusTM slides (ThermoFisher) and air-dried overnight at RT after which samples were stained immediately or stored at 4°C until use. Sections were blocked with goat serum (Chrondex) or heat inactivated horse serum (Sigma-Aldrich) for 30 min diluted in PBS supplemented with 0.01% Triton-X and 0.5% BSA (Sigma-Aldrich). Tissue samples were stained with antibodies outlined in Table 1 for 2 h at RT followed by secondary antibodies, rabbit poly anti-GFP-Alexa Fluor 488®, goat anti-mouse Alexa Fluor 568® IgG1, goat anti-mouse Alexa Fluor 647®IgG1/IgG2a, goat anti-mouse Alexa Fluor 568® IgG1 (ThermoFisher) and counterstained with 4′,6-diamidino-2-phenylindole (DAPI) or Hoechst 33258 (Sigma-Aldrich) for 1 h at RT. Slides were mounted using ProLongTM Diamond Antifade mountant (ThermoFisher) and analyzed using an inverted LSM710 or 880 Zeiss confocal microscope using 405, 488, 594, and 614 nm lasers, 40X or 63X Nikon oil lenses and captured using ZEN 2012 (Black Edition) software and analyzed using ZEN 2012 (Blue Edition).
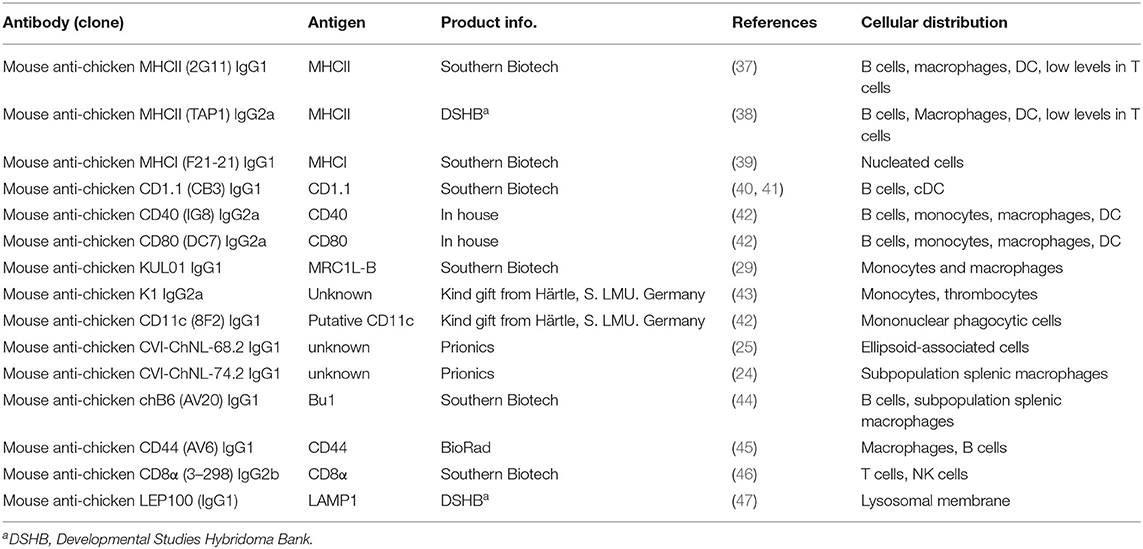
Table 1. Antibodies used for confocal microscopy and flow cytometry analysis.
Flow Cytometry and Flow Activated Cell Sorting
Splenocytes were stained using antibodies described in Table 1. Briefly, cells were incubated for 20 min on ice with primary antibodies diluted in Flow Buffer (PBS supplemented with 0.5% BSA and 0.01% sodium azide Sigma-Aldrich). Cells were then incubated with secondary antibodies for 20 min on ice. For multi-color flow cytometry, antibodies were conjugated using Lightning-LinkTM (Novus Biologicals) with Alexa Fluor®647, APC-CyTM7, PerCp-CyTM5.5, and PE-CyTM7 according to the manufacturer's instructions. All conjugated antibodies were titrated and tested for similar staining patterns observed using the unconjugated antibodies. For each experiment, live/dead cells were discriminated by the addition of SYTOX® Blue Dead Cell Stain (ThermoFisher) before cell analysis. Immuno-phenotyping of cells was carried out using BD LSRFortessaTM (BD Biosciences, UK) configured with 405, 488, 561, and 640 nm laser with 16 filters. Cells were sorted using BD FACS ARIA IIIu (BD Biosciences). All data was captured via BD FACSDivaTM Software v8.0.1 (BD Biosciences) and analyzed post-flow using FlowJo (Tree Star v10.0.2). Compensation was achieved using BD anti-mouse IgGκ compensation beads (BD Biosciences) for each flurochrome. Cell gating was carried out using cells from non-transgenic Hy-Line chickens and fluorescence minus one (FMO) controls. At least 50.000–100.000 live, single cell events were captured for analysis.
Intravenous Bead and Liposome Administration
One μm FluoSpheres® beads (ThermoFisher) were labeled with E. coli LPS 055:B5 (Sigma-Aldrich) as previously described (48). Chickens between the ages of 5–8 weeks were intravenously administered with 100 μl of beads in PBS containing 3.6 × 10⁹ 0.5 μm or unlabeled or LPS labeled 1 μm carboxylate FluoSpheres® beads (ThermoFisher) or 100 μl of PBS- or clondronate-encapsulated liposomes (5 mg Liposoma, Europe) via the wing vein. Chickens were culled 3 h (beads) or 3 days (liposome) post-administration by cervical dislocation. Half of the spleen was prepared for immunohistology and the other half prepared for flow cytometric analysis. Ten thousand live, single cell events in the bead+ gate were captured for analysis.
RNA-Seq Sample Preparation
Splenocytes were prepared as described above and sorted from five CSF1R-eGFP chickens at 7 weeks of age. Cells were sorted under low speed using an 80 μm diameter nozzle into 1.5 mL Eppendorf tubes at 4°C. Following cell sort, samples were pelleted at 400 g for 3 min and lysed using RLT buffer (Qiagen) supplemented with β-mercaptoethanol and stored at −20°C until use. RNA was purified using RNA Micro extraction kit according to the manufacturer's instructions (Qiagen). RNA concentration and quality was measured using High Sensitivity RNA Screen Tape System (Agilent). All samples were used with a RIN ≥7. cDNA was transcribed using Ovation® RNA-Seq System V2 (NuGen) according to the manufacturer's instructions. cDNA quality and quantity was analyzed using D1000 Screen Tape System (Agilent). RNA-seq was carried using TruSeq DNA Nano (350 bp insert) library preparation, sequencing using Illumina HiSeq4000 and data generation and preliminary analysis was carried out by Edinburgh Genomics, The University of Edinburgh, U.K.
RNA-Seq Analysis
Reads were trimmed using Cutadapt (version 1.9.dev2) (49) for quality at the 3' end using a quality threshold of 30 and for adapter sequences of the TruSeq DNA Nano kit. Reads after trimming were required to have a minimum length of 50 bp. Reads were aligned against the Gallus gallus 5.0 genome from Ensembl using STAR (50). Raw counts for each annotated gene were obtained using the feature counts software [version 1.5.2; (51)]. Reads were normalized using the weighted trimmed mean of M-values method (52). Differential gene expression analysis was performed within the Bioconductor edgeR package [version 3.16.5; (52)]. For differential analysis the raw counts table was filtered to remove genes consisting predominantly of near-zero counts, filtering on counts per million (CPM) to avoid artifacts due to library depth. Statistical assessment of differential expression was carried out with the likelihood-ratio test. Contrasts specified were each pair of sorted cell populations. Differentially expressed genes were defined as those with a false-discovery rate (FDR) <0.05 and log2 fold-change (FC) >2. Heatmaps were constructed using normalized gene counts in R using the pheatmap package (v. 1.0.10; https://CRAN.R-project.org/package=pheatmap). To statistically test whether mammalian immune cell transcriptional signatures were enriched in each chicken cell population we used a pairwise gene set enrichment analysis (GSEA) approach using the BubbleGum software for statistical calculations and graphical output (53). The chicken data was compared to mouse data as more spleen specific gene sets were available than for other species. We used mouse immune cell-specific gene sets developed previously (23, 54), which are comprised of genes that show at least 1.5-fold higher expression in the cell population of interest compared to other immune cells. The gene sets used were for splenic T cells, B cells, cDC1, pDC, cDC vs. monocytes/macrophages (Mo/Mp), Mo/Mp vs. cDC. In addition, we used blood derived mouse cMo, ncMo, and MoDC data sets. Sequences have been submitted to European Nucleotide Archive (ENA) under the accession number PRJEB40127.
Statistical Analysis
All data was analyzed for normality using Shapiro-Wilk test and non-parametric analysis was performed using GraphPad Prism 8 (GraphPad, USA). Differences between the groups were statistically evaluated by the non-parametric Mann-Whitney or Kruskal-Wallis test adjusted for post-hoc analysis. For all statistical analysis, P < 0.05 were considered significant.
Results
Splenic PALS-Associated CSF1R-tg+ Cells Do Not Uniformly Express MRC1L-B
Whole mount microscopic analysis of the CSF1R-tg chicken spleen demonstrates the high density of CSF1R-tg+ cell sheaths within the splenic PALS and the PWP (Figure 1A). A microscopic overview of CSF1R-tg and CD11c expression, using the putative anti-chicken CD11c monoclonal, 8F2, demonstrates low expression levels of CD11c in the PALS and PWP regions and high levels of expression in cells of the red pulp (Figure 1B and Supplementary Figure 1). At the origin of the PALS, CSF1R-tg+ cells that surround the central artery express the chicken monocyte/macrophage markers, Ch74.2, which binds to an unknown epitope, MHCII and mannose receptor C1-like B [MRC1L-B formally known as KUL01, Figures 1C,D; (30)]. CSF1R-tg+ interdigitating cells are scattered throughout the PALS and express Ch74.2 and MHCII, while they differentially express MRC1L-B (Figures 1C,D). A lack of MRC1L-B expression is a hallmark for cDC in the chicken spleen (21). At the bifurcation of the central artery resides the GCs that contain CSF1R-tg+ follicular dendritic cells (FDC) that lack Ch74.2, MHCII, and MRC1L-B expression (Figures 1C,D) and bind IgY (Figure 1E). ChB6+ B cells are located within the GC and in the PWP where they form a ring around the ellipsoid (Figure 1F). PWP-associated chB6+ B cells are intermingled with ellipsoid-associated macrophages (EAM) that express the CSF1R-tg, Ch74.2, MHCII, and MRC1L-B (Figures 1G,H). Closer analysis of the red pulp demonstrated that not all red pulp-associated CSF1R-tg+ cells express Ch74.2 (Figure 1G image insert) but they strongly express MRC1L-B (Figure 1H). Within the inner regions of the PWP are EAC that express the CSF1R-tg (33) and can also be identified using the monoclonal Ch68.2 which binds to an unknown epitope [Figure 1I; (25)]. The CSF1R-tg+ expression demonstrates that cells of the splenic MPS differentially express MRC1L-B and help to distinguish cDC in the chicken spleen.
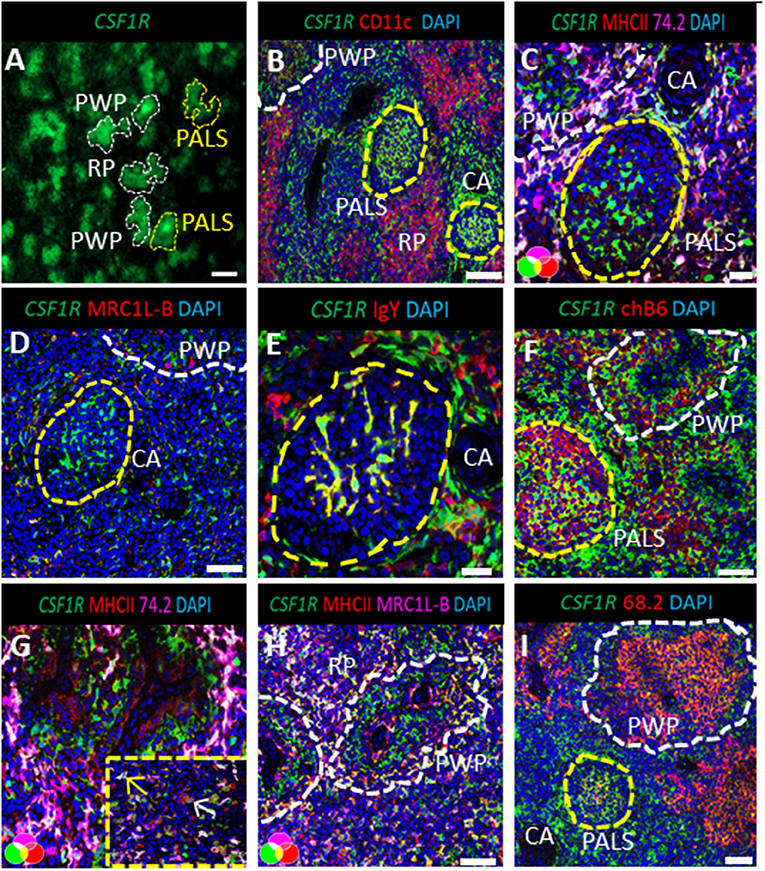
Figure 1. CSF1R-tg+ mononuclear phagocytes differentially express MRC1L-B and CD11c in the spleen. The white pulp of the chicken spleen consists of two morphologically distinct areas, the peri-arteriolar lymphoid sheaths (PALS) that surround the central artery (CA) and the peri-ellipsoid white pulp (PWP) surrounding the penicillary capillaries. (A) Whole mount microscopic analysis of the spleen demonstrates the abundance of CSF1R-tg+ cells in the PALS and PWP; (B) CD11c is differentially expressed across the PALS and PWP and high concentrations of CD11chi cell sheaths were observed in the red pulp (RP); (C) the chicken macrophage marker, Ch74.2, is expressed by a majority of the CSF1R-tg+ MHCII+ PALS-associated mononuclear phagocytic cells in contrast to the FDC and the EAC in the PWP; (D) CSF1R-tg+ cells surrounding the CA express MRC1L-B while some scattered CSF1R-tg+ PALS-associated mononuclear phagocytic cells lack MRC1L-B expression which is also observed in FDC; (E) FDC and plasma cells express IgY; (F) GC are packed with chB6+ B cells and chB6+ B cells surround the ellipsoid in the PWP; (G) in the PWP, Ch74.2+ EAM reside in the outer regions of the PWP and in the red pulp, not all CSF1R-tg+ cells express this chicken macrophage marker [insert image of Ch74.2+ (yellow arrow) and Ch74.2neg (white arrow) staining in red pulp macrophages]; (H) EAM express MHCII and MRC1L-B in contrast to the EAC; (I) CSF1R-tg is expressed by the Ch68.2+ EAC. Yellow dashed circles indicate GC, white dashed lines indicates the PWP. Data is representative of five CSF1R-eGFP transgenic chickens at 5–6 weeks of age. Images (B-D-F-G-I) are 2X2 tiled images with 100 μm scale bars and 50 μm scale bars for images (C,E).
A CSF1R-tgneg Subpopulation Is Located in the Ellipsoid and Express CSF1R Protein
The PWP is structurally defined as the region from the discontinuous basement membrane of the penicilliform capillary that harbors supportive cells surrounded by the capsule of the Schweigger-Seidel sheath [Figure 2A; (28)]. The ellipsoid, embedded within the PWP, is the filtering apparatus of the spleen and represents a key component of chicken splenic lymphoid system. Using high-resolution confocal analysis, the CSF1R-tg+ EAC were observed anchored to the ellipsoid, positioned to be the primary cells to encounter blood-borne antigens (Figure 2B). Double staining of spleen sections with Ch68.2 and MHCII, lead to the identification of a ring of Ch68.2neg MHCII+ cells within the ellipsoid that were found to be CSF1R-tgneg (Figure 2C). Although these cells lack transgene expression, they were found to express the CSF1R protein (Figure 2D) and also expressed MRC1L-B and CD11c (Figures 2E,F). To distinguish these cells from EAM we denominate them as ellipsoid macrophages (EM). The expression of MHCII by the EAC was not easily identifiable. In some instances, intracellular MHCII staining was observed in the EAC whereas surface expression was difficult to demonstrate which may suggest a lack of MHCII surface expression or expression levels being undetectable via confocal microscopy (Figures 2C–E and Supplementary Figure 2). We also observed lower levels of CD11c expression by the EAM compared to the EAC (Figure 2D). LAMP1 expression was observed throughout the PWP and its expression was found within the EAM, EAC, and the EM cell populations (Figure 2G). Overall, our analysis show that a network of EM reside within the inner margins of the ellipsoid that express a number of chicken macrophage markers and the CSF1R protein but not the CSF1R-tg.
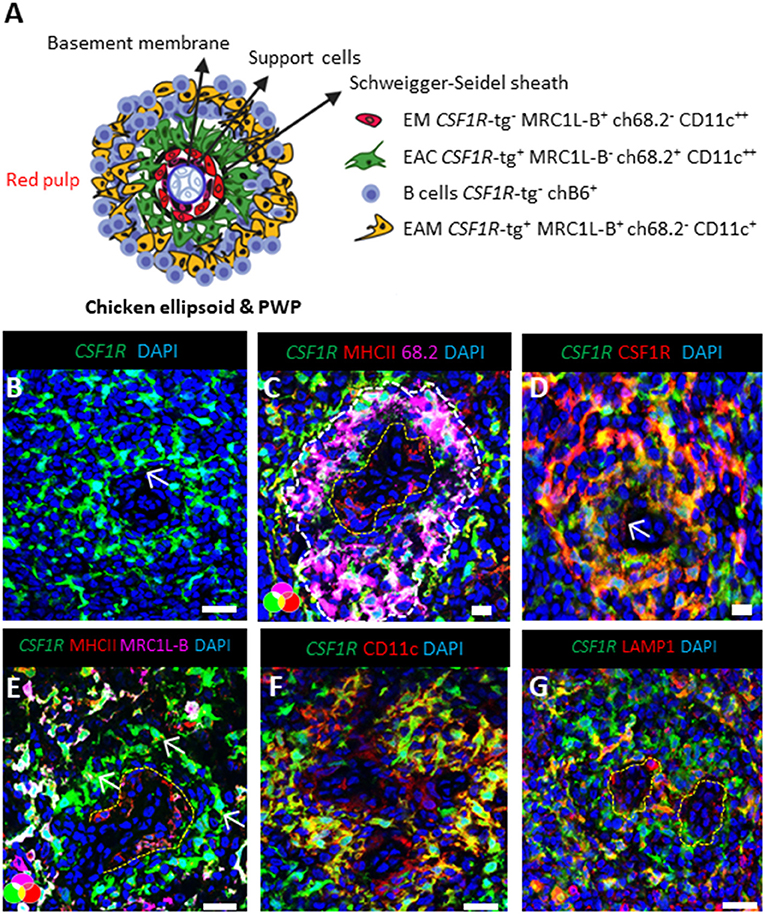
Figure 2. The ellipsoid contains CSF1R-tg negative cells that co-express chicken macrophage related markers. (A) Schematic overview of the chicken PWP, ellipsoid and associated cells, EC; ellipsoid macrophages, EAC; ellipsoid-associated cells, EAM: ellipsoid-associated macrophages; (B) confocal analysis of the PWP demonstrates the dendrites of the CSF1R-tg+ EAC cells protruding into the ellipsoid (white arrow); (C) MHCII and Ch68.2 staining demonstrates the presence of CSF1R-tgneg MHCII+ Ch68.2neg cell population named ellipsoid macrophages (EM) that are located within the ellipsoid; (D) CSF1R is expressed by the CSF1R-tgneg EM; (E) in contrast to EM and EAM, EAC lack MRC1L-B expression; (F) EAC and EM express high levels of CD11c in contrast to the EAM; (G) LAMP1 is expressed by all CSF1R-tg+ and CSF1R-tgneg cells in the PWP. Yellow lines outline the location of the EM. Data is representative of five CSF1R-eGFP transgenic chickens at 5–6 weeks of age. Scale bars for images (B,E–G) are 100 μm and images (C,D) are 50 μm.
The Chicken Spleen Contains Cells of the MPS That Diversely Express the CSF1R-tg, MHCII MRC1L-B, and CD11c
We next analyzed the phenotype of splenic cells of MPS from the CSF1R-tg chickens using flow cytometry. After gating the cells based on size/granularity and the removal of cell debris, doublets, and dead cells (Supplementary Figure 3), typically five subpopulations were observed based on their CSF1R-tg and MHCII expression patterns (Figure 3A). Firstly, the CSF1R-tgneg population was gated into MHCIIdim (Gate 1) and MHCIIhi subpopulations (Gate 2). The CSF1R-tg+ subpopulation made up ~5% of the total live cell population in which three distinct subpopulations were observed based on their CSF1R-tg+ and MHCII expression levels (Gates 4-6). Histogram overlays of the CSF1R-tg+ subpopulations demonstrated diversity of CSF1R-tg and MHCII expression (Figure 3B). The median fluorescent intensity (MFI) of CSF1R-tg and MHCII expression levels indicated that cells within Gate 4 had significantly lower levels of CSF1R-tg expression compared to cells in Gates 5 and 6. This subpopulation expressed intermediate to high levels of MHCII (Figure 3C) and were named CSF1R-tgdim MHCIIinter−hi subpopulation. Cells within Gates 5–6 expressed high levels of the CSF1R-tg and differ in their MHCII expression levels. Cells in Gate 5 expressed significantly higher levels of MHCII compared to cells in Gate 6 and hence named the CSF1R-tghi MHCIIhi (Gate 5) and CSF1R-tghi MHCIIinter (Gate 6) subpopulations, respectively. In terms of size and granularity, the CSF1R-tghi MHCIIinter subpopulation was more homogenous than the CSF1R-tgdim MHCIIinter−hi and CSF1R-tghi MHCIIhi subpopulations (Figure 3D).
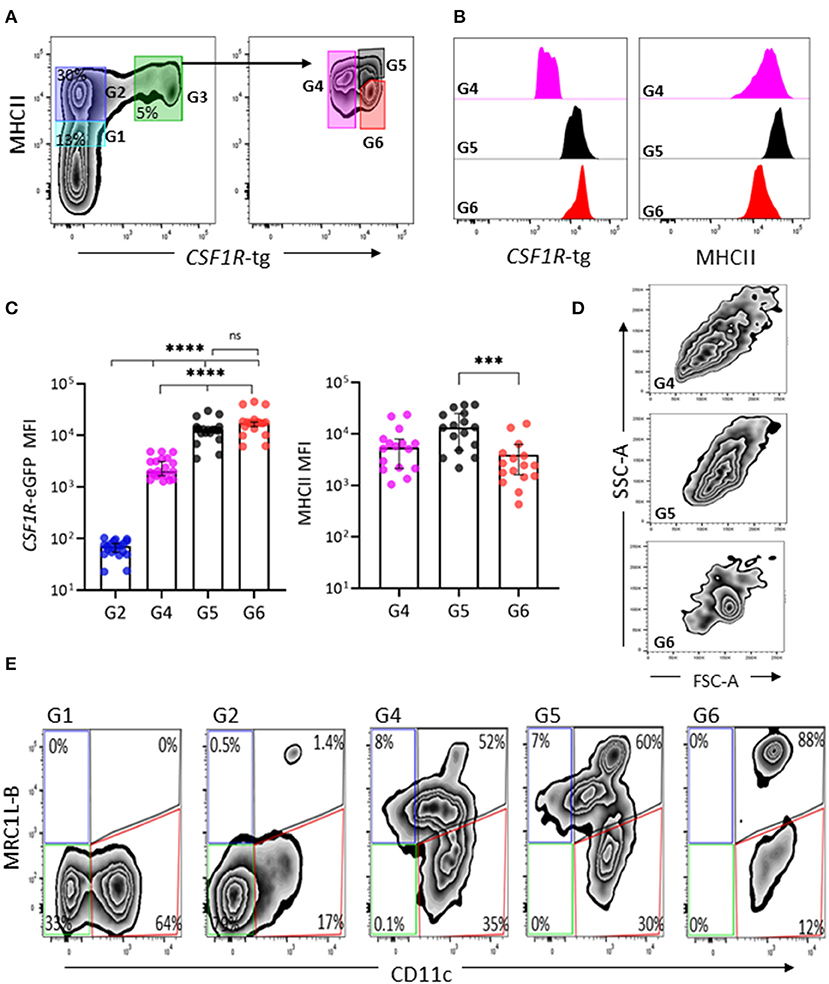
Figure 3. CSF1R-tg and MHCII are diversely expressed by CSF1R-tg+ cells. Splenic live, single cells could be separated based on their diverse CSF1R-tg and MHCII expression by flow cytometry. (A) The CSF1R-tg negative populations were gated into MHCIIdim [Gate (G1)] and MHCIIhi (G2) subpopulations. By applying a gate to the CSF1R-tg+ population (G3), the differential expression of the transgene and MHCII could be observed. Three CSF1R-tg+ subpopulations were separated into CSF1R-tgdim MHCIIinter−hi (G4) and two CSF1R-tghi cell subpopulations; CSF1R-tghi MHCIIhi (G5) and CSF1R-tghi MHCIIinter (G6) subpopulations; (B) Representative histograms of CSF1R-tg and MHCII expression levels in the CSF1R-tg+ subpopulations (G4-6); (C) The median fluorescent intensity (MFI) analysis across 20 CSF1R-eGFP chickens shows the consistent difference of CSF1R-tg and MHCII expression. Error bars indicate 95% confidence intervals, Asterisks indicate statistical significance (P < 0.05); (D) The CSF1R-tghi MHCIIinter subpopulation has more uniformed cell size and granularity pattern compared to the CSF1R-tgdim MHCIIinter−hi (G4) and CSF1R-tghi MHCIIhi (G5) subpopulations; (E) CSF1R-tghi MHCIIinter (G6) subpopulation has more uniformed expression of MRC1L-B and CD11c compared to the CSF1R-tgdim MHCIIinter−hi (G4) and CSF1R-tghi MHCIIhi (G5) subpopulations. Analysis were applied to cells gated based on size/granularity, live, single cells, CSF1R-tg+ MHCII+ gates using FMO-1 controls. Data is representative of 5 or more independent experiments from 4-8 week old CSF1R-eGFP transgenic chickens.
Using the gating strategy outlined in Figure 3A, we next analyzed the expression of MRC1L-B and CD11c across each subpopulation (Gates 1–6, Figure 3E). We found no MRC1L-B+ cells within the CSF1R-tgneg MHCIIdim subpopulation and they were largely CD11c+ (Figure 3E). Within the CSF1R-tgneg MHCIIhi subpopulation a small percentage of MRC1L-Bhi CD11chi cells were observed (Figure 3E), which may represent the CSF1R-tgneg EM observed in the ellipsoid via immunohistology. The CSF1R-tgdim MHCIIinter−hi and CSF1R-tghi MHCIIhi subpopulations were very heterogeneous, consisting of MRC1L-Bhi CD11chi, MRC1L-Binter CD11cinter−hi cells while a third subset expressed low level or no MRC1L-B and high levels of CD11c, making up around 30–35% of the cell population in each of these subpopulations, respectively (Figure 3E and Supplementary Figure 4). The CSF1R-tghi MHCIIinter subpopulation were homogenous in their MRC1L-B and CD11c (88%) expression and lacked the MRC1L-Binter cells observed in the CSF1R-tgdim MHCIIinter−hi and CSF1R-tghi MHCIIhi subpopulations (Figure 3E). Histogram overlays of MRC1L-B and CD11c expression in each CSF1R-tg subpopulations shows the uniform level of expression of these markers in the CSF1R-tghi MHCIIinter subpopulation compared to the CSFR-tgdim MHCIIinter−hi and CSF1R-tghi MHCIIhi subpopulations (Supplementary Figure 4). Although numerous extraction approaches were carried out, we did not observed a CSF1R-tg+ MHCIIneg/low MRC1L-Bneg CD11c+ phenotype that would represent the EAC and FDC subpopulations in the chicken spleen. This may reflect the low survival rates of these cells post-extraction or they may express low levels of MHCII and are represented in the CSF1R-tg+ subpopulations. Even with these limitations, our complex multicolor flow cytometric analysis demonstrates the existence of at least three CSF1R-tg+ subpopulations in the chicken spleen that diversely express the CSF1R-tg, MHCII, MRC1L-B, and CD11c.
The CSF1R-tghi MHCIIinter Subpopulation Expresses Low Levels of CD80, CD40 and MHCI, CD44, and Ch74.2
We next analyzed the expression of co-stimulatory molecules, CD80, CD40, and MHCI and CD44, across the three CSF1R-tg+ MHCII+ subpopulations by flow cytometry (Figure 4A). Histogram overlays indicated that the CSF1R-tghi MHCIIinter subpopulation has lower levels of co-stimulatory molecule, CD80 and CD40, and MHCI and CD44 expression, although these differences were only significant for CD40 (Figure 4A). We next analyzed the expression of non-classical MHC molecule, CD1.1, the chicken monocyte/thrombocyte marker, K1, and Ch74.2 across each CSF1R-tg+ subpopulation (Figure 4B). A subpopulation of CD1.1hi cells were present in the CSF1R-tgdim and CSF1R-tghi MHCIIhi subpopulations whereas CSF1R-tghi MHCIIinter cells were negative for CD1.1 expression (Figure 4B). The K1 marker (43) was expressed at low levels across all CSF1R-tg+ subpopulations with a small population of K1hi cells within CSF1R-tgdim MHCIIinter−hi subpopulation. The CSF1R-tghi MHCIIinter cells contained Ch74.2hi and Ch74.2neg cell populations whereas the CSF1R-tgdim MHCIIinter−hi and CSF1R-tghi MHCIIinter cells had a more uniformed expression pattern of Ch74.2 (Figure 4B). The chicken B cell marker, chB6, binds to a subset of splenic macrophages (55). We therefore analyzed the expression of chicken T/NK cells and B cell markers within the subpopulations and found that ChB6 label cells within the CSF1R-tgdim subpopulation while a small population expressed CD3 and CD8α, possibly indicating the presence of T cells and NK cells along with macrophages (Figure 4C) The CSF1R-tgneg MHCIIhi MRC1L-B+ subpopulation expressed high levels of CD80, CD40, and K1 (Supplementary Figure 5A). We also verified the lack of CD41/61 expression in CSF1R-tg+ cells indicating that thrombocyte contamination was not altering the expression levels of the cell markers (Supplementary Figure 5B). Overall, our multicolor flow cytometry analysis indicates that the CSF1R-tghi MHCIIinter subpopulation expressed lower levels of CD80, CD40, MHCI, CD44, CD1.1, and Ch74.2 compared to the CSF1R-tgdim MHCIIinter−hi and CSF1R-tghi MHCIIhi subpopulations.
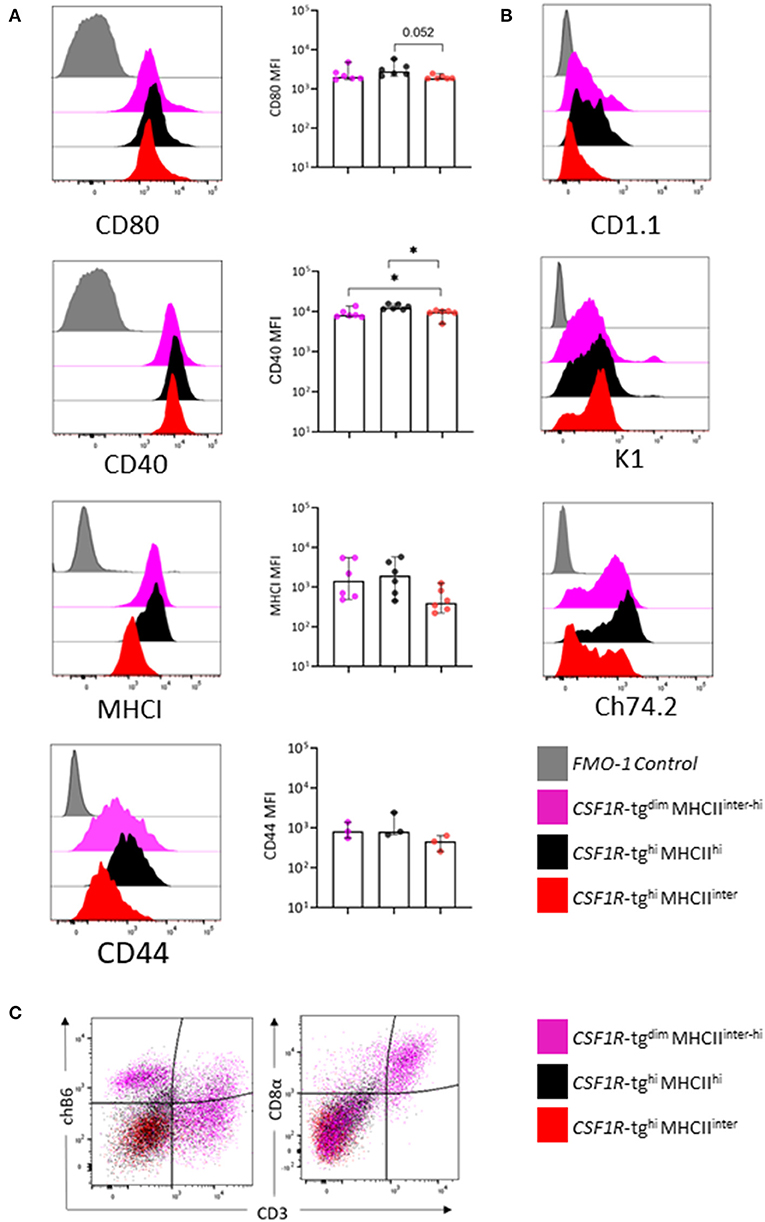
Figure 4. The CSF1R-tghi MHCIIinter subpopulation express low levels of CD80, CD40, MHCI, CD44, and Ch74.2. The three CSF1R-tg+ subpopulations were gated as outlined in Figure 3A and analyzed for a number of chicken mononuclear phagocytic cell markers by flow cytometry. (A) Representative histograms and MFI expression levels of CD80, CD40, MHCI, and CD44, across the three CSF1R-tg+ subpopulations; (B) representative histograms of CD1.1, K1, and Ch74.2 expression across the three CSF1R-tg+ subpopulations; (C) representative flow plots of chB6, CD3, and CD8α expression across the CSF1R-tg+ subpopulations indicates that the CSF1R-tgdim MHCIIinter−hi subpopulation express B cell and T cell markers along with macrophage markers. Gates were applied to size/granularity, live, single cells, CSF1R-tg+ MHCII+ gates using FMO controls. Data is representative of 3–6 independent experiments from 4 to 6 week old chickens. Error bars indicate 95% confidence intervals. Asterisks indicate statistical significance (P < 0.05).
The Phagocytosis Abilities of the CSF1R-tghi MHCIIinter Cells Are Enhanced by LPS
To determine the function of the CSF1R-tg+ subpopulations, 5–6 week old CSF1R-eGFP transgenic chickens were intravenously administered 0.5 μm or unlabeled and LPS labeled 1 μm fluorescent beads. Three hours post-IV administration, the phenotype of the splenic phagocytic cells was analyzed by applying the gating strategy outlined in Figure 3A on the beadneg cell population which was subsequently applied to the bead+ cell population (Figure 5A). Due to low number of bead+ events in the CSF1R-tgneg MHCIIinter subpopulation, these cells were analyzed with the CSF1R-tgneg MHCIIhi subpopulation. In the 0.5 μm bead+ gate, the cell percentages of the CSF1R-tgneg, CSF1R-tgdim MHCIIinter−hi, and CSF1R-tghi MHCIIhi subpopulations were significantly higher compared to the CSF1R-tghi MHCIIinter subpopulation. When the MFI of the 0.5 μm beads was analyzed in each subpopulation, all CSF1R-tg subpopulations had statistically significant higher bead uptake compared to the CSF1R-tgneg subpopulation (Figure 5B).
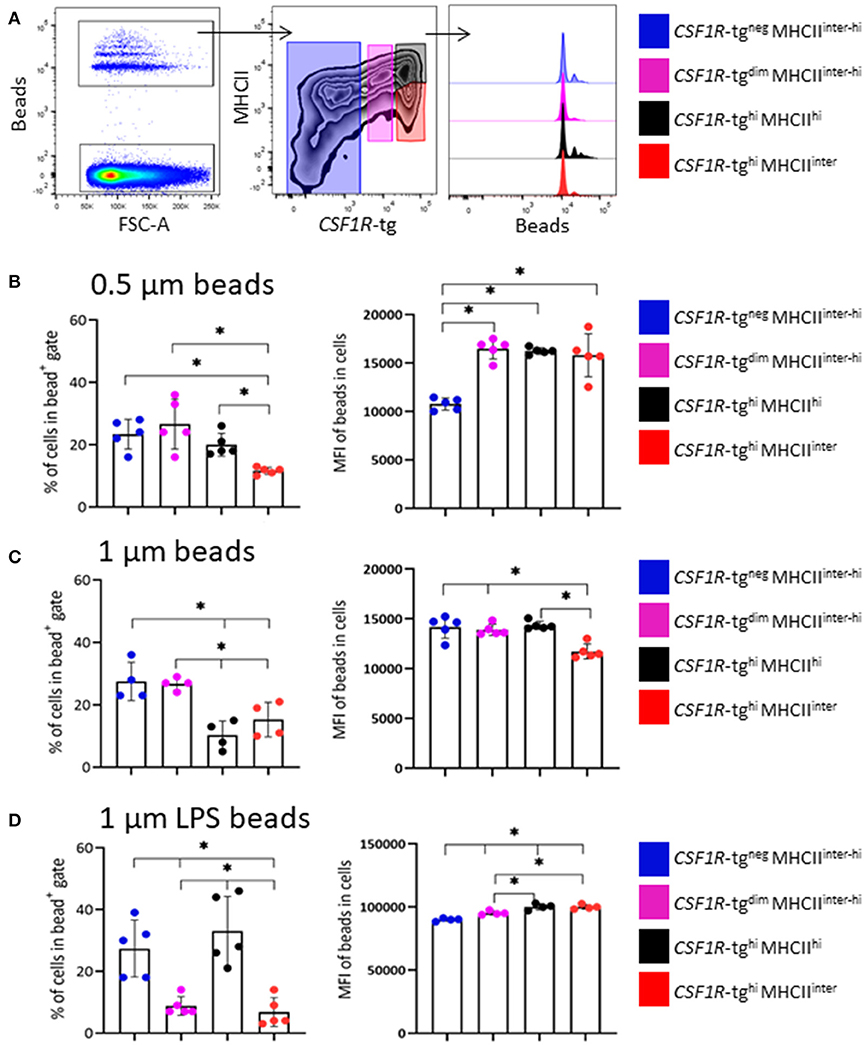
Figure 5. The phagocytosis abilities of the CSF1R-tghi MHCIIinter cells is enhanced by LPS. (A) Representative flow plots and histograms of the gating strategy for the analysis of the cell phenotype based on CSF1R-tg and MHCII expression levels and phagocytosis of beads 3 h post-IV bead administration by flow cytometry. The percentage of cells in each subpopulations within the bead+ gate and MFI of the beads within each subpopulation; (B) 0.5 μm; (C) 1 μm and; (D) LPS labeled 1 μm carboxylate fluorescent beads. Data is shown as the median of 5 or 4 individual chickens and error bars indicate 95% confidence intervals. Asterisks indicate statistical significance (P < 0.05).
Next, the ability of the CSF1R-tg cells to phagocytose 1 μm beads was analyzed. After 3 h, the percentage of CSF1R-tgneg cells within the 1 μm bead+ gate was significantly higher compared to the CSF1R-tgdim MHCIIinter−hi and CSF1R-tghi subpopulations (Figure 5C). Between the CSF1R-tg+ subpopulations, the percentage of the CSF1R-tghi MHCIIhi subpopulation was significantly higher compared to the CSF1R-tgdim and CSF1R-tghi MHCIIinter subpopulations. The MFI analysis of the 1 μm beads show that although the CSF1R-tgdim subpopulation was significantly underrepresented in the bead+ gate, they had significantly higher bead uptake compared to the CSF1R-tghi MHCIIinter subpopulation. In addition, the CSF1R-tgneg and CSF1R-tghi MHCIIhi subpopulations phagocytosed significantly higher number of beads compared to the CSF1R-tghi MHCIIinter subpopulation (Figure 5C).
To determine the phagocytosis abilities of cells exposed to bacterial antigens, 1 μm beads were labeled with LPS and phagocytosis was analyzed 3 h post-IV administration. The percentages of both CSF1R-tgneg and CSF1R-tgdim MHCIIinter−hi subpopulations in the bead+ gate were significantly higher compared to the CSF1R-tghi MHCIIhi and CSF1R-tghi MHCIIinter subpopulations (Figure 5D). The MFI levels of the LPS labeled 1 μm beads were significantly higher in the CSF1R-tghi MHCIIhi and CSF1R-tghi MHCIIinter subpopulations compared to the CSF1R-tgdim MHCIIinter−hi subpopulation. All CSF1R-tg+ subpopulations had significantly higher bead uptake compared to the CSF1R-tgneg subpopulation (Figure 5D). In vivo functional analysis indicates that exposure to LPS enhances the phagocytosis of 1 μm beads by the CSF1R-tghi MHCIIinter subpopulation.
In vivo Antigen Uptake Demonstrates Diversity in the EAM in the PWP
Flow cytometric analysis demonstrated the differential expression of MRC1L-B across each of the CSF1R-tg+ subpopulations and the existence of the CSF1R-tgneg MRC1L-B+ subpopulation (Figure 3D). We analyzed the percentage of MRC1L-B expressing cells in the bead+ CSF1R-tg+ and CSF1R-tgneg subpopulations and used immunohistochemistry to analyze the location of the beads in the spleen 3 h post-administration (Figure 6). Firstly, we found a majority of 0.5 μm bead+ CSF1R-tg+ cells consisted of MRC1L-B expressing cells (~95%) which was significantly higher compared to the percentage of MRC1L-B+ in both the 0.5 μm bead+ CSF1R-tgdim MHCIIinter−hi and CSF1R-tghi MHCIIinter subpopulations (~75–70%). In the 0.5 μm bead+ CSF1R-tgneg subpopulation, we found that ~10% of cells expressed MRC1L-B. In the unlabeled 1 μm bead+ CSF1R-tghi MHCIIhi subpopulation (~98%), the percentage of MRC1L-B expressing cells was significantly higher compared to the CSF1R-tgdim MHCIIinter−hi and CSF1R-tghi MHCIIinter MRC1L-B subpopulations (~90–85%) while no significance difference between the CSF1R-tg+ cells was observed after phagocytosis of LPS labeled 1 μm beads. In the CSF1R-tgneg unlabeled and LPS labeled 1 μm bead+ subpopulation, MRC1L-B expressing cells made up ~50% of the cell population demonstrating the phagocytosis abilities of the EM (Figure 6A).
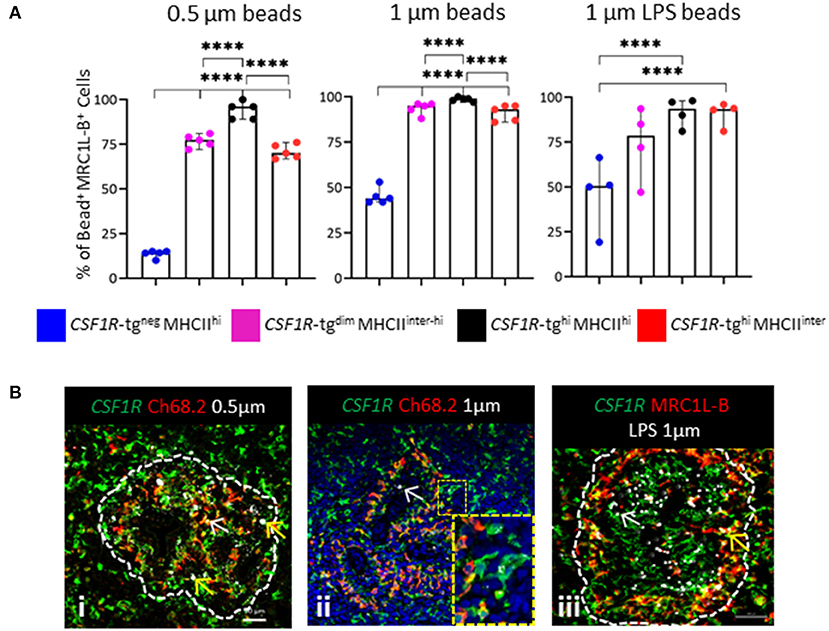
Figure 6. In vivo functional analysis indicates diversity in the EAM. (A) The percentage of MRC1L-B+ cells in the 0.5 μm+, unlabeled and LPS labeled 1 μm bead+ CSF1R-tg+ and CSF1R-tgneg subpopulations 3 h post-IV bead administration analyzed by flow cytometry. Data is shown as the median of 5 or 4 individual animals and error bars indicate 95% confidence intervals. Asterisks indicate statistical significance (P < 0.05); (B) histological analysis of the location of the beads in the PWP; (i) few 0.5 μm beads were located in CSF1R-tg+ Ch68.2+ EAC cells (yellow arrow) whereas CSF1R-tg+ Ch68.2neg EAM contain numerous beads (yellow arrow); (ii) the 1 μm beads co-localize with the CSF1R-tg+ Ch68.2+ EAC (white arrow) but numerous beads were found in the CSF1R-tg+ Ch68.2neg EAM (insert image); (iii) LPS labeled 1 μm beads were located throughout the PWP in CSF1R-tg+ MRC1L-Bneg EAC (white arrow) while high concentrations of beads were located in the CSF1R-tg+ MRC1L-B+ EAM (yellow arrows). Data is representative of analysis of three individual chickens.
We next analyzed the location of the bead+ cells in the spleen 3 h post-administration. Whole mount microscopic analysis shows that irrespective of bead size or LPS coating, beads were localized to the PWP (Supplementary Figure 6). Additional in depth analysis found that the 0.5 μm beads were located within the CSF1R-tg+ Ch68.2+ cells but high concentrations of beads were observed in the CSF1R-tg+ Ch68.2neg cells, which represent the EAM (Figure 6Bi). Uptake of 1 μm beads was observed in the CSF1R-tg+ Ch68.2+ EAC but a majority of beads were associated with the CSF1R-tg+ Ch68.2neg EAM (Figure 6Bii). Beads were also found closely associated with chB6+ cells in the ellipsoid representing the CSF1R-tgneg MRCL1-Bneg bead+ cell phenotype observed in flow cytometry (Supplementary Figure 6). Large deposits of LPS labeled 1 μm beads were also located in the CSF1R-tg+ MRC1L-B+ EAM compared to the CSF1R-tg+ MRC1L-Bneg EAC (Figure 6Biii). Due to their location in the PWP the uptake of beads by the different MRC1L-B+ CSF1R-tg+ subpopulations indicates the variable expression of the CSF1R-tg by EAM. Thus, in vivo antigen uptake demonstrates the existence of EAM subsets that differ in their CSF1R-tg expression and antigen uptake but not in their MRC1L-B expression.
The CSF1R-tg+ MRC1L-Bneg cDC Can Phagocytose Model Antigens
We observed a vast majority of CSF1R-tg+ MRC1L-Bneg cells in the splenic PALS and very little in the PWP. These cells were found to be a minor population in CSF1R-tg+ bead+ cells in the in vivo uptake analysis by flow cytometry while immunohistological analysis demonstrated the lack of beads in the PALS 3 h post-administration (Supplementary Figure 6B). As previously mentioned, cells with the MHCII, MRC1L-Bneg CD11c+ phenotype consist of cDC while MRC1L-B expression is associated with cells of the macrophage lineage (23). Therefore, we used in vitro splenic cultures to determine if the low levels of phagocytosis observed in the CSF1R-tg+ MRC1L-Bneg cells was due to their location in the spleen rather than a functional aspect of these cells. Firstly, we analyzed the MRC1L-B phenotype of splenocytes grown in the presence of CSF1 by flow cytometry (Figure 7A). After 48 h, CSF1R-tg+ MRC1L-B+ cells made up around 75% of the total cell population while the CSF1R-tg+ MRC1L-Bneg subpopulation made up ~4% (Figure 7A and gating strategy Supplementary Figure 7A). We did observe the presence of the CSF1R-tgdim MRC1L-B+ subpopulation but not the CSF1R-tg− MRC1L-B+ subpopulation in the cultures. As we were interested in analyzing the difference between the MRC1L-B+/neg subpopulations, we focused our analysis on the CSF1R-tg+ MRC1L-B+ and MRC1L-Bneg subpopulations. Firstly, cells were treated with unlabeled and LPS-labeled 1 μm beads at 41 or 4°C for 3 h and the phenotype of the bead+ cells followed by the MFI of beads within the subpopulations were analyzed (Supplementary Figure 7B). After 3 h, the CSF1R-tg+ MRC1L-B+ subpopulation phagocytosed significantly more beads than the CSF1R-tg+ MRC1L-Bneg subpopulation, a similar pattern observed in vivo (Figure 7A). Confocal analysis demonstrated the adherence of both MRC1L-B+ and MRC1L-Bneg subpopulations in the cell cultures (Figure 7Bi) and the high phagocytic abilities of the MRC1L-B+ cells (Figure 7Bii). We also observed the co-localization of MRC1L-B expression with internalized beads indicting its internalization with beads from the cell surface to intracellular vesicles. In addition we observed the co-localization of LAMP1 expression with the phagocytosed beads (Figure 7Bii,iii).
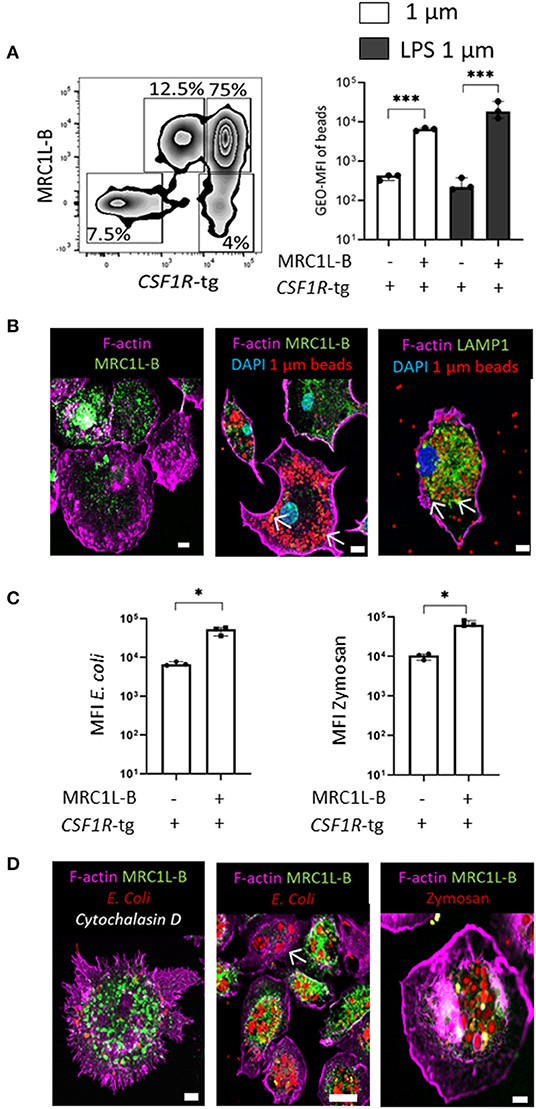
Figure 7. In vitro functional analysis demonstrates the ability of the CSF1R-tg+ MRC1L-Bneg cDC to phagocytose model antigens. Splenocytes were culture for 48 h in the presences of CSF1 and phagocytosis was analyzed 3 h post-treatment via flow cytometry. (A) After 48 h in culture, CSF1R-tghi MRC1L-Bhi are the dominant subpopulation (75%) compared to the CSF1R-tgdim MRC1L-Bhi (12%), CSF1R-tghi MRC1L-Bneg (4%), and CSF1R-tgneg MRC1L-Bneg subpopulations (7.5%). MFI of unlabeled and LPS labeled 1 μm beads was significantly higher in the CSF1R-tg+ MRC1L-B+ subpopulation compared to the CSF1R-tghi MRC1L-Bneg cell population 3 h post-bead treatment; (B) confocal analysis demonstrates the (i) adherence of the MRC1L-Bhi and MRC1L-Bneg cells after 48 h in culture; (ii) MRC1L-B+ cells phagocytose numerous beads and it expression is localized with internalized beads (white arrows); (iii) intracellular LAMP1 expression co-localizes with the phagocytosed beads (white arrows); (C) MFI of pHrodo red labeled E. coli and Zymosan particles demonstrates the ability of the CSF1R-tghi MRC1L-Bneg cDC subpopulation to phagocytose model antigen better than beads suggesting their uptake is more antigen-dependent; (D) confocal analysis demonstrates the (i) inhibition of actin polymerization reduces particle uptake but does not affect MRC1L-B expression; (ii, iii) E. coli and Zymosan bioparticles are phagocytosed and transported to intracellular vesicles with a high pH environment. Data is shown as the median of 3 individual chickens and error bars indicate 95% confidence intervals. Asterisks indicate statistical significance (P < 0.05).
We next analyzed whether there was a difference in the ability of the subpopulations to uptake model antigen for transport to intracellular vesicles, such as lysosomes and phagosomes, using E. coli and Zymosan bioparticles labeled with the pH-sensitive pHrodo red. As a control, cells were treated with the actin-polymerization inhibitor, Cytochalasin D, 10 min prior to exposure to the bioparticles and the data was normalize by subtracting background fluorescence (Supplementary Figure 7). After 3 h, the CSF1R-tg+ MRC1L-B+ subpopulation engulfed and transported significantly more bioparticles compared to the CSF1R-tg+ MRC1L-Bneg subpopulation. However, the data demonstrates the ability of the CSF1R-tg+ MRC1L-Bneg to phagocytose models antigens better than latex beads and even with their low numbers in the cell culture these cells were highly phagocytic (Figure 7C). Microcopy analysis demonstrated the inhibition of actin polymerization prevented the uptake of the bioparticles but it did not affect MRC1L-B expression (Figure 7Di–iii). In vitro functional analysis demonstrates the ability of the CSF1R-tg+ MRC1L-Bneg subpopulation to phagocytose model antigen at higher levels than latex beads indicating a more specific pattern of antigen-uptake compared to splenic macrophages.
The CSF1R-tghi MHCIIhi CD11chi and CD11cdim Subpopulations Are Enriched With Cells of the cDC and Macrophage Lineages
We carried out RNA-seq analysis on FACS sorted splenic subpopulations as shown in Figure 8A. To determine if the level of putative CD11c expression was specific to a cell subset within the CSF1R-tg+ subpopulation, we further split the CSF1R-tghi MHCIIhi subpopulation into CD11chi and CD11cdim subpopulations due its lower phenotypical levels of heterogeneity compared to the CSF1R-tgdim MHCIIinter−hi subpopulation (Figure 8A). The separation of the CSF1R-tgneg MRC1L-B+ subpopulation from the CSF1R-tgneg MRC1L-Bneg cells lead to insufficient cell numbers for their analysis via RNA-seq and therefore these cells were collected with the CSF1R-tgneg MHCIIhi subpopulation. Pairwise comparisons of all subpopulations are shown in Supplementary Table 1. Using pairwise GSEA, we analyzed whether the transcriptome signatures of murine immune cells were enriched in the sorted splenic subpopulations (23, 54). The CSF1R-tgneg MHCIIdim and CSF1R-tgneg MHCIIhi subpopulations were significantly enriched for T cell and B cell gene fingerprints compared to the other cell populations (Figure 8B). Fingerprints of pDC genes were enriched in the CSF1R-tgneg MHCIIhi subpopulation when compared to the CSF1R-tgdim MHCIIinter−hi subpopulation but at the lowest level of significance. When comparing the CSF1R-tgdim subpopulation, signatures of different cells lineages were enriched, such as T cells, B cells, cDC1, and moDC. The CSF1R-tghi MHCIIhi CD11cdim subpopulation was enrichment of fingerprints of cDC1 and cDC vs. Mo/Mp (Figure 8B). The CSF1R-tghi MHCIIhi CD11chi subpopulation expressed Mo/Mp vs. cDC gene signatures. cDC, pDC, Mo/Mp vs. cDC, ncMo, and MoDc gene signatures were enriched in the CSF1R-tghi MHCIIinter subpopulation (Figure 8B). The mammalian cDC2 transcriptomic fingerprint could not be established due to the low number of genes to generate reliable statistical analysis. GSEA analysis indicate that the CSF1R-tghi MHCIIhi subpopulation consist of macrophages and cDC.
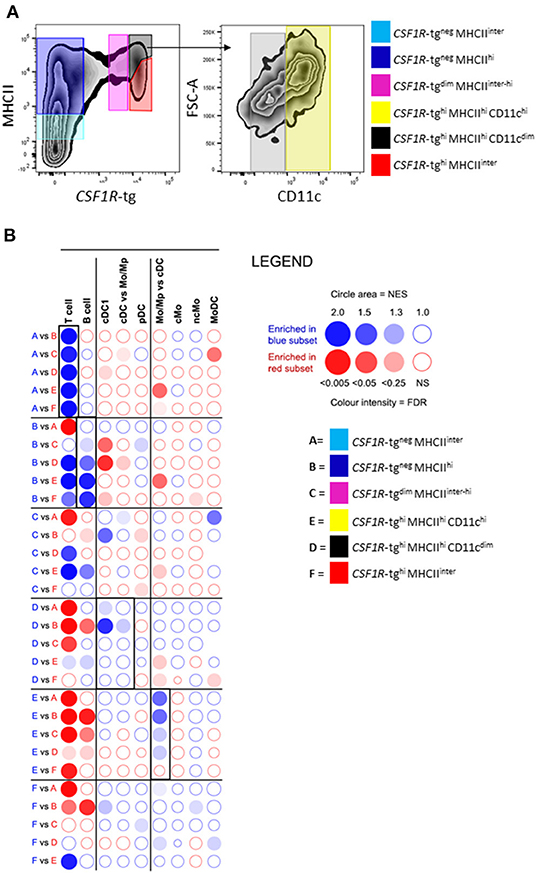
Figure 8. The CSF1R-tghi MHCIIhi and CSF1R-tghi MHCIIinter cells are enriched with cells of the cDC and macrophage lineages. (A) FACS plot demonstrating the sorting strategy of the splenocytes subpopulations for RNA-seq analysis and the separation of the CSF1R-tghi MHCIIhi subpopulation into CD11chi and CD11cdim cells; (B) GSEA-based analysis of immune cell signature enrichment in chicken spleen cell populations. The chicken spleen cell subpopulations were compared in pairs for their relative enrichment of mouse spleen immune cell signatures. Red and blue circles correspond to the enrichment of mouse immune cell gene sets in the cell population labeled with the same color. The bubble area is proportional to the normalized enrichment score (NES) calculated by GSEA. The intensity of the color corresponds to the FDR of the analysis.
The CSF1R-tghi MHCIIhi and CSF1R-tghi MHCIIinter Subpopulations Express Gene Signatures Characteristic of cDC, Macrophages, and Red Pulp Macrophages
We next analyzed the enrichment of conserved mRNA transcripts characteristic of different cell lineages across the sorted subpopulations. Firstly, core T/NK cell and B cell related genes signatures were analyzed and as expected the CSF1R-tgneg MHCIIdim subpopulation were enriched for T/NK cells, significantly expressing CD3E, CD3D, CD28, CD5, RUNX3, and FR2 transcripts whereas the CSF1R-tgneg MHCIIhi subpopulation were enriched for B cells, significantly expressing key transcripts such as CD79B, CXCR5, and PAX5 (Supplementary Figure 8). The CSF1R-tgdim MHCIIinter−hi subpopulation also strongly expressed CD79B and PAX5 (Supplementary Figure 8).
Next, the enrichment of cell-fate determining transcriptional regulators involved in macrophage and cDC lineages as reported in the ImmGen Consortium (56) and the mammalian literature were analyzed in the CSF1R-tg+ subpopulations (Figure 8B). The CSF1R-tghi MHCIIhi CD11chi subpopulation was enriched for cells expressing cDC lineage related transcriptional regulators or genes positively associated with cDC differentiation [EGR1, ID2, IRF8 (56, 57), NR4A3 (58), and ZBTB46 (59, 60)] while the CSF1R-tghi MHCIIhi CD11cdim subpopulation was enriched for macrophage-related transcription factors [MAFB (61, 62), MITF (63), SPI1 (64), TFEC (65), and ZEB2 (66); Figure 8B]. The red pulp macrophage-lineage related transcription factor, SpiC (67) was expressed at the highest level in the CSF1R-tghi MHCIIinter subpopulation but also strongly expressed in the CSF1R-tghi MHCIIhi CD11chi and CSF1R-tgdim MHCIIinter−hi subpopulations.
The CSF1R-tgdim MHCIIinter−hi subpopulation expressed higher levels of genes encoding transcripts characteristic of cDC and macrophages (ETSI, ID2, IRF4, IRF8, SpiC, and SLA2). This observation, along with the expression of B cell and T cell related transcripts, indicates that this subpopulation is very heterogeneous. Overall the CSF1R-tghi MHCIIhi CD11chi and the CSF1R-tghi MHCIIhi CD11cdim subpopulations express higher levels of genes characteristic of cDC and macrophage lineages across warm blooded vertebrate species (18, 19, 54). Thus, it can be deduced from this data that the CSF1R-tghi CD11chi and the CSF1R-tghi CD11cdim subpopulations must primarily encompass cDC and macrophages, respectively.
We next analyzed the enrichment of cell-lineage related surface receptors involved in a number of cellular processes, such as T cell co-stimulation, antigen presentation and migration. cDC related markers FLT3, CADM1, and XCR1 (10, 13), were significantly enriched in the CSF1R-tghi MHCIIhi CD11chi subpopulation whereas macrophage-associated genes, CSF1R, CD14, CX3CR1, CCR2, CXCR4, and TNFSF1A were enriched in the CSF1R-tghi MHCIIhi CD11cdim subpopulation (Figure 9A). The CSF1R-tghi MHCIIhi CD11cdim subpopulation were enriched for migratory and adhesion related transcripts such as, CCR7, CDH2, C3AR1, and CDH2 (Supplementary Figure 9). The integrin ITGAD was enriched in the CSF1R-tghi MHCIIhi CD11chi and CSF1R-tghi MHCIIinter subpopulations whereas ITGAV transcript was enriched in CSF1R-tghi MHCIIhi CD11cdim subpopulation. Co-stimulatory molecules, CD80 and CD86 transcripts were significantly expressed by cells within the CSF1R-tghi MHCIIhi CD11chi and CD11cdim subpopulations. DPP4 (CD26) is highly expressed in the CSF1R-tghi MHCIIhi CD11cdim subpopulation (not CD11chi), which is not consistent with DPP4 being expressed to high levels selectively on cDC1 in humans, mice, and sheep (19). We next analyzed the expression of Toll-like receptors (TLR) transcripts across the CSF1R-tg+ subpopulations and found that the CSF1R-tghi MHCIIhi CD11cdim subpopulation was enriched for cells expressing TLR4, TLR2A and co-receptor, CD14. The CSF1R-tghi MHCIIinter subpopulation expressed high levels of C-type lectin receptors, FCER2 (CLEC17AL-A), and CLEC17A (CLEC17AL-B) (68). The apoptotic cell recognition receptor, TIMD4 (69) transcript expression was enriched in both the CSF1R-tghi MHCIIhi CD11chi and CD11cdim subpopulations (Figure 9A).
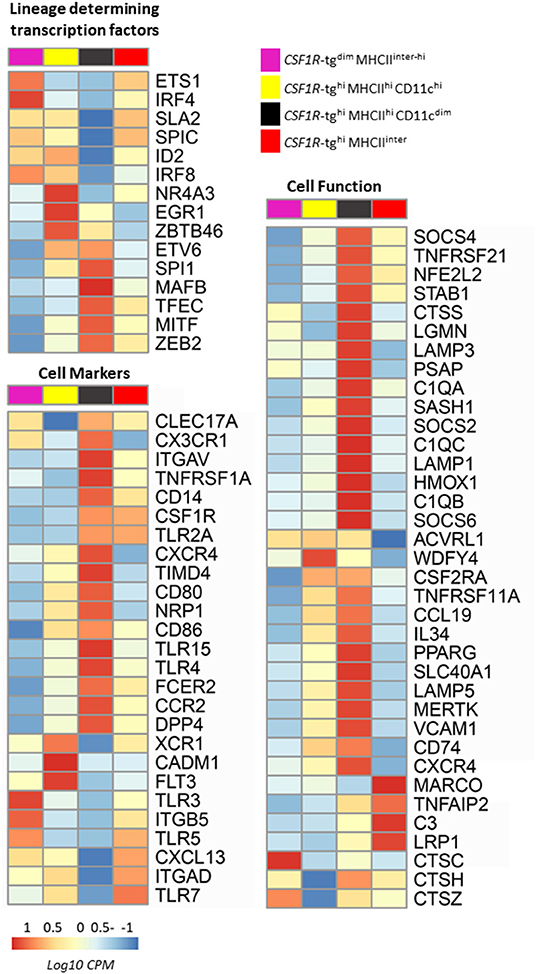
Figure 9. The CSF1R-tghi MHCIIhi and CSF1R-tghi MHCIIinter cells are enriched with transcripts related to cDC, macrophage and red pulp macrophage function. FACS sorted CSF1R-tg+ subpopulations were analyzed by RNA-seq for lineage-specific transcription factors and genes related to function. The CSF1R-tghi MHCIIhi CD11chi subpopulation was enriched for cDC transcription factors (EGR1, IRF8, ID2, NR4A3, and ZBTB46) and the CSF1R-tghi MHCIIhi CD11cdim subpopulation was enriched for macrophage signature genes (MAFB, MITF, SPI1, TFEC, ZEB2). The CSF1R-tgdim and CSF1R-tghi MHCIIinter subpopulations were enriched for transcripts associated with red pulp macrophages (SpiC) and regulation of CSF1R expression (ETS1, SLA2). The CSF1R-tghi MHCIIhi CD11chi cells were enriched with cells expressing gene related to the cDC lineage (CADM1, FLT3, XCR1) and CSF1R-tghi MHCIIhi CD11cdim subpopulation were enriched macrophage related genes (CCR2, CD14, CX3CR1, CXCR4, TNFSF1A). The CSF1R-tghiMHCIIinter subpopulation was enriched for cells expressing red pulp macrophage-related genes (C3, LRG1, and MARCO). The CSF1R-tgdim subpopulation were enrich with a mixture of different cell lineages expressing genes related to the cDC and macrophage lineages. Heatmaps of log10 transformed normalized expression of genes. Heatmaps coloring is based on counts per million with red indicating high counts and blue indicating low counts.
The CSF1R-tghi MHCIIhi CD11chi subpopulation significantly expressed genes involved in cross-presentation and MHCII-associated genes [ACVRL1 (70), CD74, LAMP5 (71), and WDFY4 (72)]. Key macrophage related genes, MERTK, VCAM1, and genes related to red pulp and alternatively activated macrophages, C1QA, C1QB, and PPARG (73), and suppressor of cytokine signaling molecules (SOCS2, SOCS4, and SOCS6) were highly expressed in the CSF1R-tghi MHCIIhi CD11cdim subpopulation compared to the CD11chi subpopulation. An array of transcripts involved in antigen processing [CD74, CTSS, LGMN, LAMP1, LAMP3, LAMP5, MERTK, and PSAP (71)] were also strongly expressed by the CSF1R-tghi MHCIIhi CD11cdim subpopulation (Figure 9B). The CSF1R-tghi MHCIIinter subpopulation expressed the highest levels of genes characteristic of the red pulp macrophage lineage, MARCO, C3, and LRG1 (73). Chicken heterophils express the CSF1R-tg at low levels (33, 34). Therefore, we analyzed the expression of core heterophil gene transcripts across the CSF1R-tg+ subpopulations (74) and found no significant enrichment of heterophil related gene transcripts in any of the CSF1R-tg+ subpopulations (Supplementary Table 2). The CSF1R-tgdim MHCIIinter−hi subpopulation were enriched for cathepsins family members (CTSC, CTSH, and CTSZ) but no clear definition of what enriched macrophage cell type this subpopulation represented was identified. To analyze whether the CSF1R-tgdim subpopulation were true phagocytic cells and not an artifact of transgene expression or cells undergoing physiological stress, we carried out an in vivo liposome depletion study, where phagocytic cells were targeted for depletion by apoptosis induction after the uptake of clondronate liposomes (75). Three days after a single IV-administration of liposomes, we observed a severe depletion of the CSF1R-tgdim MRC1L-B+ subpopulation in chickens treated with the clondronate liposomes compared to those treated with PBS liposomes indicating that this subpopulation contains phagocytic cells belonging to the MPS (Supplementary Figure 10). Although our sorting approach would not have led to pure cell populations, we were able to determine the enrichment of cDC in the CSF1R-tghi MHCIIhi CD11chi subpopulations as previously described (23). Furthermore, we demonstrated the existence of at least three subsets of resident tissue macrophages in the chicken spleen. Based on the RNA-seq and immunohistological analysis, the CSF1R-tghi MHCIIhi CD11clow subpopulation are enriched with macrophages from the PWP and PALS while the CSF1R-tghi MHCIIinter cells are enriched with red pulp macrophages. Although we cannot demonstrate which splenic cell they represent, the CSF1R-tgdim MHCIIinter−hi MRC1L-B+ are a subset of the chicken splenic MPS.
Discussion
Mononuclear phagocytes reside within distinct niches of the spleen where they partake in the number of cellular processes from homeostasis, removal of aged, or damaged erythrocytes to killing of pathogens and induction of adaptive immune responses. The development, proliferation, and survival of monocytes, macrophages, and cDC are controlled by CSF1R [reviewed by (76)]. Lineage specific expression of CSF1R has allowed for the detailed study of the MPS using the CSF1R-reporter transgenic chickens. Since their generation, transcriptome analysis of bursal macrophages, liver macrophages, and to some extent cDC, along with subsets of blood monocytes have been described (22). Hu et al., observed the lack of CSF1R-tg expression in chicken Kupffer cells that express similar CSF1R mRNA levels as tissue macrophages. In certain cell types in mice, CSF1R expression is under controlled of a 150 bp distal promoter not included in the generation of the CSF1R-reporter chickens and thus is inferred as the reason for the lack of CSF1R-tg expression in chicken Kupffer cells (22, 77). The splenic MPS cells has been described based on their MHCII, MRC1L-B, Ch74.2 expression, and acid-phosphatase staining and to a certain extent using the CSF1R-reporter transgenic chickens (24, 25, 29, 33, 78–80). However, the separation of PALS and PWP macrophages has not been described while comparative gene profiling has identified the existence of the XCR1 cDC in the chicken spleen but not their location (23). Using the CSF1R-reporter transgenic chickens we carried out a comprehensive analysis of the splenic MPS.
In the chicken spleen, interdigitating cells (also known as interdigitating DC) and PALS-associated macrophages express MHCII and MRC1L-B while MHCIIhi CD11c+ MRC1L-Bneg cells are enriched for cDC (28, 29). As the CD11c, 8F2 antibody is not commercially available, progress in the field of chicken DC research has been limited. Using the CSF1R-reporter transgenic chickens, we observed a CSF1R-tg+ subpopulation lacking MRC1L-B expression in the PALS (Figure 1) demonstrating that these chicken models can be used to study cDC without requiring specific cDC antibodies such as FLT3. In the PWP, the equivalent of the mammalian MZ, two subpopulations have previously been shown to express the CSF1R-tg (22, 33). On the outer margins of the PWP, intermingled with B cells are the CSF1R-tg+ EAM while the CSF1R-tg+ EAC are anchored into the ellipsoid (81). In contrast to EAM, EAC lack MRC1L-B and MHCII expression and specifically stain for Ch68.2, a chicken monoclonal which binds to an unknown epitope (25, 28). In this study, we show that EAC express higher levels of CD11c compared to the EAM [Figure 1; (23, 42)]. Due to their location in the PWP, the EAM resemble the mammalian MZM which function to trap and display antibody-coated antigens from the blood for transfer to the MZ B cells which is subsequently deposit to FDC in the follicles (82). However, in chickens, surface antigen display has been observed in EAC but not EAM (28, 83). The high level of CD11c expression by the EAC may correlate with their ability to detach from the ellipsoid upon antigen exposure and their subsequent migration to the PALS to develop into FDC (28). We found intracellular punctate expression of MHCII by EAC but could not fully determine whether these cells express surface MHCII (Figure 2). These cells were found to express LAMP1, possibly demonstrating their ability to digest substances delivered by endocytosis and phagocytosis (84). In the red pulp, we found that the CSF1R-tg+ cells express high levels of MRC1L-B but not all stained for the chicken macrophage marker, Ch74.2 as previously described (24). A previous study has described the presence of CD45+ Ch68.2neg cells within the inner regions of the ellipsoid (28). We observed cells lacking CSF1R-tg expression in a similar location in the ellipsoid and found they express high levels of MHCII, MRC1L-B, CD11c, LAMP1, and CSF1R (22). We have called this cell population “ellipsoid macrophages” (EM). The EM may represent incoming monocytes or ellipsoid resident macrophages and requires further study in the future. Through flow cytometry we show that CSF1R-tgneg MRC1L-B+ cells express high levels of CD80, CD40, and the chicken monocyte/thrombocyte marker, K1 (Supplementary Figure 4).
When analyzing the phenotype of cells via flow cytometry we found that splenic MPS diversely express the CSF1R-tg and MHCII. One subpopulation could be distinguished based on their CSF1R-tgdim MHCIIinter−hi phenotype while two subpopulations expressed similar levels of the CSF1R-tg and were separated based on MHCIIhi and MHCIIinter levels (Figure 3). We found that the CSF1R-tgdim and CSF1R-tghi MHCIIhi subpopulations were very heterogenic in their MRC1L-B and CD11c expression levels while the CSF1R-tghi MHCIIinter subpopulation expressed these markers more uniformly (Figure 3). We did not identify a cell phenotype resembling EAC or FDC which have the CSF1R-tg+ MHCIIneg/low MRC1L-Bneg CD11c+ phenotype (28, 33). This may be due to their lack of survival during cell isolation or they express low or dynamic levels of MHCII. Although there is an EAC-specific surface marker, Ch68.2, this antibody fails to provide consistent staining in flow cytometry (data not shown). Further phenotypical analysis demonstrated low expression levels of CD80, CD40, MHCI, and CD44 in the CSF1R-tghi MHCIIinter subpopulation compared to the CSF1R-tgdim and CSF1R-tghi MHCIIhi subpopulations (Figure 4). The CSF1R-tghi MHCIIinter subpopulation express low levels of Ch74.2 which was also observed for red pulp macrophages via immunohistology (Figure 4). Mammalian red pulp macrophages express low level of co-stimulatory molecules and MHCII due to their reduced role in T cell antigen presentation (2). These observations would suggest that the CSF1R-tghi MHCIIinter subpopulation may consist of red pulp macrophages.
In vivo functional analysis demonstrated that the CSF1R-tghi MHCIIhi subpopulation phagocytosed significantly more beads compared to the CSF1R-tgdim and CSF1R-tghi MHCIIinter subpopulations while labeling beads with LPS increased the phagocytosis of the CSF1R-tghi MHCIIinter subpopulation (Figure 5). LPS has been shown to enhance antigen uptake by chicken red pulp macrophages (24). In a recent study, ex vivo isolated splenic MRC1L-Bhi MHCIIlo cells showed higher phagocytosis of dead cells than MRC1L-Blo MHCIIhi cells with the latter cell population suggested to represent red pulp macrophages. Another study has also demonstrated the expression of the apoptotic cell receptor, Tim4, by EAM which we show express high levels of MRC1L-B [Figure 1; (22, 85)]. Therefore, the previous characterized, MRC1L-Bhi MHCIIlo cells may represent a heterogeneous population of red pulp macrophages and EAM. In vivo functional analysis indicated that the majority of the bead+ CSF1R-tg+ subpopulations expressed MRC1L-B. When we analyzed location of the beads in the spleen we observed large deposits in the EAM while few beads were observed associated with EAC (Figure 6). Both flow cytometric and immunohistological analysis suggests that a subsets of CSF1R-tgdim MHCIIinter−hi MRC1L-B+ and CSF1R-tghi MHCIIhi MRC1L-B+ subpopulations are located in the PWP demonstrating that EAM differ in their CSF1R-tg expression levels but not MRC1L-B. For the bead+ CSF1R-tghi MHCIIinter subpopulation, we speculate that these cells are either a subset of EAM or red pulp macrophages residing in close proximity to the EAM, hence their ability to capture antigens.
We observed very little in vivo bead uptake by the CSF1R-tg+ MHCII+ MRC1L-Bneg cells which may be due to their higher numbers in the PALS and not the PWP where antigen capture primarily takes place. In vitro functional analysis demonstrated that the CSF1R-tg+ MRC1L-Bneg subpopulation were capable of phagocytosis (Figure 7). Mammalian macrophages express large intracellular pools of MRC1 within their early endosomes, which undergo continual rapid recycling to the cell surface to endocytose bound antigens (86). Due the high recycling nature of MRC1 in mammals and the fixture of adherent cells with PFA in this study, we only observed intracellular punctate expression of MRC1L-B (Figure 7). However, we found the co-localization of MRC1L-B and LAMP1 expression with the internalized beads in vitro which for the first time demonstrates the ability of MRC1L-B to traffic with antigens to lysosomes and endosomes similar to mammalian MRC1 (86). Our in vivo functional analysis provided the first demonstration of antigen uptake by the CSF1R-tg+ MRC1L-Bneg cDC subpopulation in the spleen further demonstrating the ability to study cDC ex vivo using the CSF1R-transgenic chickens. In addition, future studies using the CSF1R-transgenic chickens and pathogens would allow for the in vivo visualization of cDC-T cell interactions in the chicken spleen.
Transcriptomic analysis has shown the conservation of MPS lineage specific gene signatures throughout distantly related mammals (18, 19, 23, 54). A previous comparative analysis of chicken splenic cells demonstrated the existence of cDC which expressed the MHCII+ MRC1L-Bneg CD11c+ phenotype by their enrichment for XCR1, FLT3, and key cDC lineage gene transcripts. The authors also described the enrichment of macrophage related genes in MRC1L-B+ cells (23). We expanded on this study by separating the CSF1R-tghi MHCIIhi subpopulation into CD11chi and CD11cdim subsets and analyzing two additional subsets of splenic MPS via RNA-seq analysis (Figure 8). It should be noted that MRC1L-B+ cells were not excluded from the CSF1R-tg+ subpopulations as performed in the Vu Manh et al., study (23). Primarily we analyzed the presence of murine splenic immune cell gene signatures using GSEA across all the cell subpopulations (Figure 8). We initially found an enrichment of the cDC1 gene signatures in the CSF1R-tghi MHCIIhi CD11chi subpopulation and macrophage gene signatures in the CSF1R-tghi MHCIIhi CD11cdim subpopulation. We found that the CSF1R-tgdimMHCIIinter−hi subpopulations contained cells expressing B cell, T cell, cDC, and macrophage gene signatures which correlates with the immuno-phenotyping analysis (Figures 3, 4). Upon closer analysis of the enrichment of genes associated with cell lineage development and function, we found that the CSF1R-tghi MHCIIhi CD11chi subpopulation were enriched for genes characteristic of the cDC lineage (IRF8, ID2, ZEB2, FLT3, XCR1, and CAMD1) although they contain ~30% of MRC1L-Bneg−hi cells which may suggest that a significant fraction of chicken cDC express MRC1L-B contrary what was previously reported or this population contains non-cDCs that express MRC1L-B (23). This subpopulation contained cells enriched for genes also involved in cross-presentation and MHCII processing [WDFY4, ACVRL1, CD74, and LAMP5; (72)]. However, in contrast to human, mouse, and sheep cDC, we found strong expression of DPP4 in chicken cells corresponding to macrophages, CSF1R-tghi MHCIIhi CD11cdim cells, discussed later, and not chicken cDC (19, 87). This suggests that chicken macrophages may have a role in T cell-stimulation (88). The hallmark of cDC is their ability to present to and activate T cells, however, numerous attempts to demonstrate DC-T cell interaction through MLR were to no avail, with numerous cells of the MPS engulfing/phagocytosing labeled CD4+ T cells (data not shown).
The CSF1R-tghi MHCIIhi CD11cdim subpopulation were enriched for genes characteristic of macrophages [CCR2, CD14, CD36, CSF1R, CXCR4, CX3CR1, HIF1A, MAFB, MITF, STAT1, SPI1, TLR4, and TNFSF1A; (22, 76)]. This subpopulation was also enriched for M2 anti-inflammatory cell phenotype and red pulp macrophage related gene transcripts (C1QA C1QB, and PPARG) which are associated with tissue repair and homeostasis (89). Based on their CD11cdim phenotype these macrophages likely represent the EAM and PAL-associated macrophages in the spleen. Distinguishing the difference between the EAM and PAL-associated macrophages requires further investigation. The CSF1R-tghi MHCIIinter subpopulation was enriched for genes associated with red pulp macrophages [HEPHL1, LRP1, SpiC, and TF; (67)]. Similar to the CSF1R-tghi MHCIIhi subpopulation, we cannot rule out the possibility of the CSF1R-tghi MHCIIinter subpopulation containing more than one macrophage cell lineage, such as PALS-associated macrophages. The CSF1R-tgdim subpopulation were phenotypically heterogeneous and may represent cells undergoing different levels of development or activation in the spleen and require further analysis. In the murine spleen, pDC make up around 0.5% of cells (90). In our analysis, we found low levels of pDC gene signatures in the CSF1R-tgneg MHCIIhi subpopulation which may be related to the MRC1L-B+ cells present in this subpopulation (Figure 3E). However, more analysis is required to confirm the existence of this cell lineage in chickens. As of yet, no definitive study has identified different chicken cDC subsets as observed in mammals possible indicating the existence of just one cDC subset in chickens. We did observed the cDC2 related transcription factor, IRF4, in the CSF1R-tgdim subpopulation but this may be due to the mixture of B cell, cDC, and macrophage lineages in this subset (91–93). Future single cell RNA-seq analysis of splenocytes has the potential to further contribute to delineating the cells of the chicken splenic MPS.
In conclusion, we have shown that the CSF1R-reporter transgenic chickens can be used to distinguish different cell subsets of the MPS in the spleen. We have demonstrated that the PALS-associated CSF1R-tg+ cells do not uniformly express MRC1L-B helping to differentiate PALS-associated cDC (MRC1L-Bneg) from macrophages (MRC1L-B+) in the chicken spleen. In the PWP, a novel CSF1R-tgneg cell population, called ellipsoid macrophages were also characterized. We demonstrated that there are at least three distinctive cell subpopulations expressing diverse levels of CSF1R-tg and MHCII in the chicken spleen. In addition, we demonstrated that the CSF1R-tghi MHCIIinter subpopulation, phenotypically, and functionally resemble red pulp macrophages and identified functional diversity in EAM. For the first time we demonstrated the functionality of CSF1R-tg+ MRC1L-Bneg cDC in vitro. The phenotype and function of chicken splenic MPS are provided as an overview in Table 2. This is the first description of the function and transcriptome of a number of MPS cell lineages in chicken spleen that will contribute to future studies to dissect their roles in antigen presentation, immune responses, and resolve the EAC and FDC cell lineages and functions.
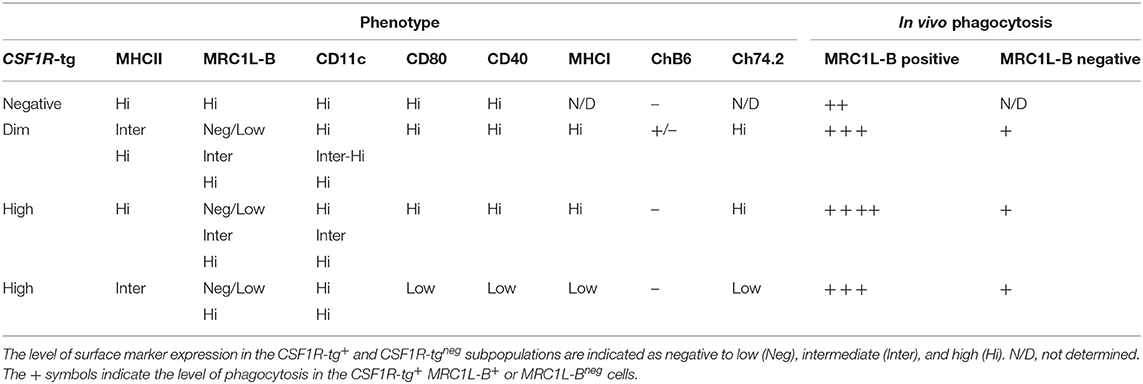
Table 2. An overview of the phenotype and phagocytosis abilities of MPS in the chicken spleen as determined by immunohistology and flow cytometry.
Data Availability Statement
The datasets presented in this study can be found in online repositories. The names of the repository/repositories and accession number(s) can be found in the article/Materials and Methods.
Ethics Statement
The animal study was conducted under Home Office project license PE263A4FA according to the requirements of the Animal (Scientific Procedures) Act 1986, with the approval of the Roslin Institute's ethical review committees. Birds were humanely culled in accordance with Schedule 1 of the Animals (Scientific Procedures) Act 1986.
Author Contributions
KS, LV, and AB conceptualized the study. KS, DB, and LV performed or assisted with the bird experiments. KM performed the transcriptomic data analysis. KS performed all experiments and analysis. LV, PK, and HS secured the funding. KS wrote the manuscript. All authors contributed to read and approved the final manuscript.
Funding
This work was supported by the Biotechnology and Biological Sciences Research Council (BBSRC) through the Project Grant BB/M003094/1 and Institute Strategic Program Grant funding from the BBSRC (BBS/E/D/10002071 and BBS/E/D/20002173).
Conflict of Interest
The authors declare that the research was conducted in the absence of any commercial or financial relationships that could be construed as a potential conflict of interest.
Acknowledgments
We would like to dedicate this paper to our late colleague and friend PK. We express our gratitude to Dr. Sonja Härtle for providing the CD11c and K1 antibodies. We would like to thank Graeme Robertson and Bob Fleming for support with the cell sorting and confocal imaging. We wish to thank the animal caretakers of the National Avian Research Facility for the supply of birds and support during the studies. Sequencing work (library preparation, sequencing, and data generation and initial analysis) was carried out by Edinburgh Genomics at the University of Edinburgh.
Supplementary Material
The Supplementary Material for this article can be found online at: https://www.frontiersin.org/articles/10.3389/fimmu.2021.636436/full#supplementary-material
Supplementary Figure 1. The dynamic expression of CD11c and MHCII in the chicken spleen.
Supplementary Figure 2. Multicolor confocal analysis of the PWP.
Supplementary Figure 3. Gating strategy for flow cytometric analysis and FACS.
Supplementary Figure 4. Immuno-phenotyping of the CSF1R-tg+ and CSF1R-tg− cells in the chicken spleen.
Supplementary Figure 5. Phenotypical analysis of the CSF1R-tgneg MRC1L-B+ cells in the chicken spleen and thrombocyte cell analysis.
Supplementary Figure 6. Analysis of the location of fluorescent bead particles 3 h post-IV administration in chicken spleen.
Supplementary Figure 7. Flow cytometric analysis of adherent primary chicken splenocytes cultured for 48 h and in vitro phagocytosis controls at 4°C and Cytochalasin D treatment.
Supplementary Figure 8. RNA-seq analysis of the chicken splenic subpopulations indicate enrichment for core T cell, NK cell, and B cell in the CSF1R-tgneg subpopulations.
Supplementary Figure 9. RNA-seq analysis of the chicken CSF1R-tg+ subpopulations indicate enrichment of migratory and adhesion related genes in the CSF1R-tghi MHCIIhi CD11cdim subpopulations.
Supplementary Figure 10. The CSF1R-tgdim subpopulations are depleted 3 days post-clondronate liposome treatment.
Supplementary Table 1. Differentially expressed genes comparison in splenic CSF1R-tgneg and CSF1R-tg+ subpopulations (FDR <0.5).
Supplementary Table 2. Differentially expressed chicken heterophil related genes comparison in splenic CSF1R-tg+ subpopulations (FDR <0.5).
References
1. Guilliams M, Ginhoux F, Jakubzick C, Naik SH, Onai N, Schraml BU, et al. Dendritic cells, monocytes and macrophages: a unified nomenclature based on ontogeny. Nat Rev Immunol. (2014) 14:571–8. doi: 10.1038/nri3712
2. Kurotaki D, Kon S, Bae K, Ito K, Matsui Y, Nakayama Y, et al. CSF-1-dependent red pulp macrophages regulate CD4 T cell responses. J Immunol. (2011) 186:2229–37. doi: 10.4049/jimmunol.1001345
3. Kurotaki D, Uede T, Tamura T. Functions and development of red pulp macrophages. Microbiol Immunol. (2015) 59:55–62. doi: 10.1111/1348-0421.12228
4. Swirski FK, Nahrendorf M, Etzrodt M, Wildgruber M, Cortez-Retamozo V, Panizzi P, et al. Identification of splenic reservoir monocytes and their deployment to inflammatory sites. Science. (2009) 325:612–6. doi: 10.1126/science.1175202
5. Kim E, Yang J, Beltran CD, Cho S. Role of spleen-derived monocytes/macrophages in acute ischemic brain injury. J Cereb Blood Flow Metab. (2014) 34:1411–9. doi: 10.1038/jcbfm.2014.101
6. Steiniger BS. Human spleen microanatomy: why mice do not suffice. Immunology. (2015) 145:334–46. doi: 10.1111/imm.12469
7. Mebius RE, Kraal G. Structure and function of the spleen. Nat Rev Immunol. (2005) 5:606–16. doi: 10.1038/nri1669
8. Ito S, Naito M, Kobayashi Y, Takatsuka H, Jiang S, Usuda H, et al. Roles of a macrophage receptor with collagenous structure (MARCO) in host defense and heterogeneity of splenic marginal zone macrophages. Arch Histol Cytol. (1999) 62:83–95. doi: 10.1679/aohc.62.83
9. Aichele P, Zinke J, Grode L, Schwendener RA, Kaufmann SH, Seiler P. Macrophages of the splenic marginal zone are essential for trapping of blood-borne particulate antigen but dispensable for induction of specific T cell responses. J Immunol. (2003) 171:1148–55. doi: 10.4049/jimmunol.171.3.1148
10. Sichien D, Scott CL, Martens L, Vanderkerken M, Van Gassen S, Plantinga M, et al. IRF8 transcription factor controls survival and function of terminally differentiated conventional and plasmacytoid dendritic cells, respectively. Immunity. (2016) 45:626–40. doi: 10.1016/j.immuni.2016.08.013
11. Bachem A, Hartung E, Güttler S, Mora A, Zhou X, Hegemann A, et al. Expression of XCR1 characterizes the Batf3-dependent lineage of dendritic cells capable of antigen cross-presentation. Front Immunol. (2012) 3:214. doi: 10.3389/fimmu.2012.00214
12. Edelson BT, KC W, Juang R, Kohyama M, Benoit LA, Klekotka PA, et al. Peripheral CD103+ dendritic cells form a unified subset developmentally related to CD8α+ conventional dendritic cells. J Exp Med. (2010) 207:823–36. doi: 10.1084/jem.20091627
13. Dorner BG, Dorner MB, Zhou X, Opitz C, Mora A, Guttler S, et al. Selective expression of the chemokine receptor XCR1 on cross-presenting dendritic cells determines cooperation with CD8+ T cells. Immunity. (2009) 31:823–33. doi: 10.1016/j.immuni.2009.08.027
14. Schlitzer A, McGovern N, Teo P, Zelante T, Atarashi K, Low D, et al. IRF4 transcription factor-dependent CD11b+ dendritic cells in human and mouse control mucosal IL-17 cytokine responses. Immunity. (2013) 38:970–83. doi: 10.1016/j.immuni.2013.04.011
15. Ghosh HS, Cisse B, Bunin A, Lewis KL, Reizis B. Continuous expression of the transcription factor e2-2 maintains the cell fate of mature plasmacytoid dendritic cells. Immunity. (2010) 33:905–16. doi: 10.1016/j.immuni.2010.11.023
16. Cisse B, Caton ML, Lehner M, Maeda T, Scheu S, Locksley R, et al. Transcription factor E2-2 is an essential and specific regulator of plasmacytoid dendritic cell development. Cell. (2008) 135:37–48. doi: 10.1016/j.cell.2008.09.016
17. Schlitzer A, Ginhoux F. Organization of the mouse and human DC network. Curr Opin Immunol. (2014) 26:90–9. doi: 10.1016/j.coi.2013.11.002
18. Vu Manh TP, Bertho N, Hosmalin A, Schwartz-Cornil I, Dalod M. Investigating evolutionary conservation of dendritic cell subset identity and functions. Front Immunol. (2015) 6:260. doi: 10.3389/fimmu.2015.00260
19. Contreras V, Urien C, Guiton R, Alexandre Y, Vu Manh TP, Andrieu T, et al. Existence of CD8alpha-like dendritic cells with a conserved functional specialization and a common molecular signature in distant mammalian species. J Immunol. (2010) 185:3313–25. doi: 10.4049/jimmunol.1000824
20. Park KT, ElNaggar MM, Abdellrazeq GS, Bannantine JP, Mack V, Fry LM, et al. Phenotype and function of CD209+ bovine blood dendritic cells, monocyte-derived-dendritic cells and monocyte-derived macrophages. PLoS ONE. (2016) 11:e0165247. doi: 10.1371/journal.pone.0165247
21. Summerfield A, Auray G, Ricklin M. Comparative dendritic cell biology of veterinary mammals. Annu Rev Anim Biosci. (2015) 3:533–57. doi: 10.1146/annurev-animal-022114-111009
22. Hu T, Wu Z, Bush SJ, Freem L, Vervelde L, Summers KM, et al. Characterization of subpopulations of chicken mononuclear phagocytes that express TIM4 and CSF1R. J Immunol. (2019) 202:1186–99. doi: 10.4049/jimmunol.1800504
23. Vu Manh TP, Marty H, Sibille P, Le Vern Y, Kaspers B, Dalod M, et al. Existence of conventional dendritic cells in Gallus gallus revealed by comparative gene expression profiling. J Immunol. (2014) 192:4510–7. doi: 10.4049/jimmunol.1303405
24. Jeurissen SH, Claassen E, Janse EM. Histological and functional differentiation of non-lymphoid cells in the chicken spleen. Immunology. (1992) 77:75–80.
25. Jeurissen SH, Janse EM, Kok GL, De Boer GF. Distribution and function of non-lymphoid cells positive for monoclonal antibody CVI-ChNL-68.2 in healthy chickens and those infected with Marek's disease virus. Vet Immunol Immunopathol. (1989) 22:123–33. doi: 10.1016/0165-2427(89)90055-x
26. Jeurissen SHM, Janse EM, Koch G, de Boer GF. The monoclonal antibody CVI-CHNL-68.1 recognizes cells of the monocyte-macrophage lineage in chickens. Dev Comp Immunol. (1988) 12:855–64. doi: 10.1016/0145-305X(88)90059-6
27. Oláh I, Glick B. Splenic white pulp and associated vascular channels in chicken spleen. Am J Anat. (1982) 165:445–80. doi: 10.1002/aja.1001650408
28. Igyártó BZ, Magyar A, Oláh I. Origin of follicular dendritic cell in the chicken spleen. Cell Tissue Res. (2007) 327:83–92. doi: 10.1007/s00441-006-0250-0
29. Mast J, Goddeeris BM, Peeters K, Vandesande F, Berghman LR. Characterisation of chicken monocytes, macrophages and interdigitating cells by the monoclonal antibody KUL01. Vet Immunol Immunopathol. (1998) 61:343–57. doi: 10.1016/s0165-2427(97)00152-9
30. Staines K, Hunt LG, Young JR, Butter C. Evolution of an expanded mannose receptor gene family. PLoS ONE. (2014) 9:e110330. doi: 10.1371/journal.pone.0110330
31. Dai XM, Ryan GR, Hapel AJ, Dominguez MG, Russell RG, Kapp S, et al. Targeted disruption of the mouse colony-stimulating factor 1 receptor gene results in osteopetrosis, mononuclear phagocyte deficiency, increased primitive progenitor cell frequencies, and reproductive defects. Blood. (2002) 99:111–20. doi: 10.1182/blood.v99.1.111
32. Karsunky H, Merad M, Cozzio A, Weissman IL, Manz MG. Flt3 ligand regulates dendritic cell development from Flt3+ lymphoid and myeloid-committed progenitors to Flt3+ dendritic cells in vivo. J Exp Med. (2003) 198:305–13. doi: 10.1084/jem.20030323
33. Balic A, Garcia-Morales C, Vervelde L, Gilhooley H, Sherman A, Garceau V, et al. Visualisation of chicken macrophages using transgenic reporter genes: insights into the development of the avian macrophage lineage. Development. (2014) 141:3255–65. doi: 10.1242/dev.105593
34. Alber A, Morris KM, Bryson KJ, Sutton KM, Monson MS, Chintoan-Uta C, et al. Avian Pathogenic Escherichia coli (APEC) strain-dependent immunomodulation of respiratory granulocytes and mononuclear phagocytes in CSF1R-reporter transgenic chickens. Front. Immunol. (2020) 10:3055. doi: 10.3389/fimmu.2019.03055
35. Garceau V, Balic A, Garcia-Morales C, Sauter KA, McGrew MJ, Smith J, et al. The development and maintenance of the mononuclear phagocyte system of the chick is controlled by signals from the macrophage colony-stimulating factor receptor. BMC Biol. (2015) 13:12. doi: 10.1186/s12915-015-0121-9
36. Sutton K, Costa T, Alber A, Bryson K, Borowska D, Balic A, et al. Visualisation and characterisation of mononuclear phagocytes in the chicken respiratory tract using CSF1R-transgenic chickens. Vet Res. (2018) 49:104. doi: 10.1186/s13567-018-0598-7
37. Kaufman J, Skjoedt K, Salomonsen J, Simonsen M, Du Pasquier L, Parisot R, et al. MHC-like molecules in some nonmammalian vertebrates can be detected by some cross-reactive xenoantisera. J Immunol. (1990) 144:2258–72.
38. Guillemot FP, Oliver PD, Peault BM, Le Douarin NM. Cells expressing Ia antigens in the avian thymus. J Exp Med. (1984) 160:1803–19. doi: 10.1084/jem.160.6.1803
39. Salomonsen J, Skjodt K, Crone M, Simonsen M. The chicken erythrocyte-specific MHC antigen. Characterization and purification of the B-G antigen by monoclonal antibodies. Immunogenetics. (1987) 25:373–82. doi: 10.1007/BF00396103
40. Salomonsen J, Sørensen MR, Marston DA, Rogers SL, Collen T, van Hateren A, et al. Two CD1 genes map to the chicken MHC, indicating that CD1 genes are ancient and likely to have been present in the primordial MHC. Proc Natl Acad Sci USA. (2005) 102, 8668–73. doi: 10.1073/pnas.0409213102
41. Ly N, Danzl NM, Wang J, Zajonc DM, Dascher CC. Conservation of CD1 protein expression patterns in the chicken. Dev Comp Immunol. (2010) 34:123–32. doi: 10.1016/j.dci.2009.08.015
42. Wu Z, Rothwell L, Young JR, Kaufman J, Butter C, Kaiser P. Generation and characterization of chicken bone marrow-derived dendritic cells. Immunology. (2010) 129:133–45. doi: 10.1111/j.1365-2567.2009.03129.x
43. Kaspers B, Lillehoj HS, Lillehoj EP. Chicken macrophages and thrombocytes share a common cell surface antigen defined by a monoclonal antibody. Vet Immunol Immunopathol. (1993) 36:333–46. doi: 10.1016/0165-2427(93)90029-4
44. Rothwell CJ, Vervelde L, Davison TF. Identification of chicken Bu-1 alloantigens using the monoclonal antibody AV20. Vet Immunol Immunopathol. (1996) 55:225–34. doi: 10.1016/s0165-2427(96)05635-8
45. Kameka AM, Haddadi S, Jamaldeen FJ, Moinul P, He XT, Nawazdeen FHP, et al. Clodronate treatment significantly depletes macrophages in chickens. Can J Vet Res. (2014) 78:274–82. Available online at: http://www.ncbi.nlm.nih.gov/pmc/articles/PMC4170766/
46. Li Z, Nestor KE, Saif YM, Fan Z, Luhtala M, Vainio O. Cross-reactive anti-chicken CD4 and CD8 monoclonal antibodies suggest polymorphism of the turkey CD8alpha molecule. Poult Sci. (1999) 78:1526–31. doi: 10.1093/ps/78.11.1526
47. Lippincott-Schwartz J, Fambrough DM. Lysosomal membrane dynamics: structure and interorganellar movement of a major lysosomal membrane glycoprotein. J Cell Biol. (1986) 102:1593–605. doi: 10.1083/jcb.102.5.1593
48. de Geus ED, Jansen CA, Vervelde L. Uptake of particulate antigens in a nonmammalian lung: phenotypic and functional characterization of avian respiratory phagocytes using bacterial or viral antigens. J Immunol. (2012) 188:4516–26. doi: 10.4049/jimmunol.1200092
49. Martin M. Cutadapt removes adapter sequences from high-throughput sequencing reads. EMBnet J. (2011) 17:10–12. doi: 10.14806/ej.17.1.200
50. Dobin A, Davis CA, Schlesinger F, Drenkow J, Zaleski C, Jha S, et al. STAR: ultrafast universal RNA-seq aligner. Bioinformatics. (2013) 29:15–21. doi: 10.1093/bioinformatics/bts635
51. Liao Y, Smyth GK, Shi W. featureCounts: an efficient general purpose program for assigning sequence reads to genomic features. Bioinformatics. (2014) 30:923–30. doi: 10.1093/bioinformatics/btt656
52. Robinson MD, Oshlack A. A scaling normalization method for differential expression analysis of RNA-seq data. Genome Biol. (2010) 11:R25. doi: 10.1186/gb-2010-11-3-r25
53. Spinelli L, Carpentier S, Montañana Sanchis F, Dalod M, Vu Manh TP. BubbleGUM: automatic extraction of phenotype molecular signatures and comprehensive visualization of multiple Gene Set Enrichment Analyses. BMC Genomics. (2015) 16:814. doi: 10.1186/s12864-015-2012-4
54. Vu Manh TP, Elhmouzi-Younes J, Urien C, Ruscanu S, Jouneau L, Bourge M, et al. Defining mononuclear phagocyte subset homology across several distant warm-blooded vertebrates through comparative transcriptomics. Front Immunol. (2015) 6:299. doi: 10.3389/fimmu.2015.00299
55. Schusser B, Collarini EJ, Yi H, Izquierdo SM, Fesler J, Pedersen D, et al. Immunoglobulin knockout chickens via efficient homologous recombination in primordial germ cells. Proc Natl Acad Sci USA. (2013) 110:20170–5. doi: 10.1073/pnas.1317106110
56. Miller JC, Brown BD, Shay T, Gautier EL, Jojic V, Cohain A, et al. Deciphering the transcriptional network of the dendritic cell lineage. Nat Immunol. (2012) 13:888–99. doi: 10.1038/ni.2370
57. Bagadia P, Huang X, Liu TT, Durai V, Grajales-Reyes GE, Nitschke M, et al. An Nfil3-Zeb2-Id2 pathway imposes Irf8 enhancer switching during cDC1 development. Nat Immunol. (2019) 20:1174–85. doi: 10.1038/s41590-019-0449-3
58. Boulet S, Daudelin JF, Odagiu L, Pelletier AN, Yun TJ, Lesage S, et al. The orphan nuclear receptor NR4A3 controls the differentiation of monocyte-derived dendritic cells following microbial stimulation. Proc Natl Acad Sci USA. (2019) 116:15150–9. doi: 10.1073/pnas.1821296116
59. Satpathy AT, Kc W, Albring JC, Edelson BT, Kretzer NM, Bhattacharya D, et al. Zbtb46 expression distinguishes classical dendritic cells and their committed progenitors from other immune lineages. J Exp Med. (2012) 209:1135–52. doi: 10.1084/jem.20120030
60. Meredith MM, Liu K, Darrasse-Jeze G, Kamphorst AO, Schreiber HA, Guermonprez P, et al. Expression of the zinc finger transcription factor zDC (Zbtb46, Btbd4) defines the classical dendritic cell lineage. J Exp Med. (2012) 209:1153–65. doi: 10.1084/jem.20112675
61. Sieweke MH, Tekotte H, Frampton J, Graf T. MafB is an interaction partner and repressor of Ets-1 that inhibits erythroid differentiation. Cell. (1996) 85:49–60. doi: 10.1016/s0092-8674(00)81081-8
62. Bakri Y, Sarrazin S, Mayer UP, Tillmanns S, Nerlov C, Boned A, et al. Balance of MafB and PU.1 specifies alternative macrophage or dendritic cell fate. Blood. (2005) 105:2707–16. doi: 10.1182/blood-2004-04-1448
63. Luchin A, Suchting S, Merson T, Rosol TJ, Hume DA, Cassady AI, et al. Genetic and physical interactions between Microphthalmia transcription factor and PU.1 are necessary for osteoclast gene expression and differentiation. J Biol Chem. (2001) 276:36703–10. doi: 10.1074/jbc.M106418200
64. DeKoter RP, Singh H. Regulation of B lymphocyte and macrophage development by graded expression of PU.1. Science. (2000) 288:1439-41. doi: 10.1126/science.288.5470.1439
65. Rehli M, Lichanska A, Cassady AI, Ostrowski MC, Hume DA. TFEC is a macrophage-restricted member of the microphthalmia-TFE subfamily of basic helix-loop-helix leucine zipper transcription factors. J Immunol. (1999) 162:1559–65
66. Scott CL, T'Jonck W, Martens L, Todorov H, Sichien D, Soen B, et al. The Transcription factor ZEB2 is required to maintain the tissue-specific identities of macrophages. Immunity. (2018) 49:312–25.e5. doi: 10.1016/j.immuni.2018.07.004
67. Kohyama M, Ise W, Edelson BT, Wilker PR, Hildner K, Mejia C, et al. Role for Spi-C in the development of red pulp macrophages and splenic iron homeostasis. Nature. (2009) 457:318–21. doi: 10.1038/nature07472
68. Larsen FT, Bed'Hom B, Guldbrandtsen B, Dalgaard TS. Identification and tissue-expression profiling of novel chicken c-type lectin-like domain containing proteins as potential targets for carbohydrate-based vaccine strategies. Mol Immunol. (2019) 114, 216–25. doi: 10.1016/j.molimm.2019.07.022
69. Miyanishi M, Tada K, Koike M, Uchiyama Y, Kitamura T, Nagata S. Identification of Tim4 as a phosphatidylserine receptor. Nature. (2007) 450:435–9. doi: 10.1038/nature06307
70. Verma R, Jaiswal H, Chauhan KS, Kaushik M, Tailor P. Cutting edge: ACVRL1 signaling augments CD8α+ dendritic cell development. J Immunol. (2016) 197:1029–34. doi: 10.4049/jimmunol.1501849
71. Forni D, Cagliani R, Tresoldi C, Pozzoli U, De Gioia L, Filippi G, et al. An evolutionary analysis of antigen processing and presentation across different timescales reveals pervasive selection. PLoS Genet. (2014) 10:e1004189. doi: 10.1371/journal.pgen.1004189
72. Theisen DJ, Davidson JT, Briseno CG, Gargaro M, Lauron EJ, Wang Q, et al. WDFY4 is required for cross-presentation in response to viral and tumor antigens. Science. (2018) 362:694–9. doi: 10.1126/science.aat5030
73. Gautier EL, Shay T, Miller J, Greter M, Jakubzick C, Ivanov S, et al. Gene-expression profiles and transcriptional regulatory pathways that underlie the identity and diversity of mouse tissue macrophages. Nat Immunol. (2012) 13:1118–28. doi: 10.1038/ni.2419
74. Sekelova Z, Stepanova H, Polansky O, Varmuzova K, Faldynova M, Fedr R, et al. Differential protein expression in chicken macrophages and heterophils in vivo following infection with Salmonella Enteritidis. Vet Res. (2017) 48:35. doi: 10.1186/s13567-017-0439-0
75. Rooijen NV, Sanders A. Liposome mediated depletion of macrophages: mechanism of action, preparation of liposomes and applications. J Immunol Methods. (1994) 174:83–93. doi: 10.1016/0022-1759(94)90012-4
76. Hume DA. The mononuclear phagocyte system. Curr Opin Immunol. (2006) 18:49–53. doi: 10.1016/j.coi.2005.11.008
77. Sauter KA, Pridans C, Sehgal A, Bain CC, Scott C, Moffat L, et al. The MacBlue binary transgene (csf1r-gal4VP16/UAS-ECFP) provides a novel marker for visualisation of subsets of monocytes, macrophages and dendritic cells and responsiveness to CSF1 administration. PLoS ONE. (2014) 9:e105429. doi: 10.1371/journal.pone.0105429
78. Jeurissen SH. The role of various compartments in the chicken spleen during an antigen-specific humoral response. Immunology. (1993) 80:29–33.
79. Mast J, Goddeeris BM. CD57, a marker for B-cell activation and splenic ellipsoid-associated reticular cells of the chicken. Cell Tissue Res. (1998) 291:107–15. doi: 10.1007/s004410050984
80. Wu Z, Harne R, Chintoan-Uta C, Hu TJ, Wallace R, MacCallum A, et al. Regulation and function of macrophage colony-stimulating factor (CSF1) in the chicken immune system. Dev Comp Immunol. (2019) 105:103586. doi: 10.1016/j.dci.2019.103586
81. Nagy N, Biro E, Takacs A, Polos M, Magyar A, Olah I. Peripheral blood fibrocytes contribute to the formation of the avian spleen. Dev Dyn. (2005) 232:55–66. doi: 10.1002/dvdy.20212
82. Cinamon G, Zachariah MA, Lam OM, Foss FW, Cyster JG. Follicular shuttling of marginal zone B cells facilitates antigen transport. Nat Immunol. (2008) 9:54–62. doi: 10.1038/ni1542
83. Jeurissen SHM. Structure and function of the chicken spleen. Res Immunol. (1991) 142:352–5. doi: 10.1016/0923-2494(91)90090-6
84. Huynh KK, Eskelinen EL, Scott CC, Malevanets A, Saftig P, Grinstein S. LAMP proteins are required for fusion of lysosomes with phagosomes. EMBO J. (2007) 26:313–24. doi: 10.1038/sj.emboj.7601511
85. Yu K, Gu MJ, Pyung YJ, Song KD, Park TS, Han SH, et al. Characterization of splenic MRC1hiMHCIIlo and MRC1loMHCIIhi cells from the monocyte/macrophage lineage of White Leghorn chickens. Vet Res. (2020) 51:73. doi: 10.1186/s13567-020-00795-9
86. Stahl P, Schlesinger PH, Sigardson E, Rodman JS, Lee YC. Receptor-mediated pinocytosis of mannose glycoconjugates by macrophages: characterization and evidence for receptor recycling. Cell. (1980) 19:207–15. doi: 10.1016/0092-8674(80)90402-x
87. Nakano H, Moran TP, Nakano K, Gerrish KE, Bortner CD, Cook DN. Complement receptor C5aR1/CD88 and dipeptidyl peptidase-4/CD26 define distinct hematopoietic lineages of dendritic cells. J Immunol. (2015) 194:3808–19. doi: 10.4049/jimmunol.1402195
88. Ikushima H, Munakata Y, Ishii T, Iwata S, Terashima M, Tanaka H, et al. Internalization of CD26 by mannose 6-phosphate/insulin-like growth factor II receptor contributes to T cell activation. Proc Natl Acad Sci USA. (2000) 97:8439–44. doi: 10.1073/pnas.97.15.8439
89. Naito Y, Takagi T, Higashimura Y. Heme oxygenase-1 and anti-inflammatory M2 macrophages. Arch Biochem Biophys. (2014) 564:83–8. doi: 10.1016/j.abb.2014.09.005
90. Hey YY, O'Neill HC. Murine spleen contains a diversity of myeloid and dendritic cells distinct in antigen presenting function. J Cell Mol Med. (2012) 16:2611–9. doi: 10.1111/j.1582-4934.2012.01608.x
91. Pridans C, Holmes ML, Polli M, Wettenhall JM, Dakic A, Corcoran LM, et al. Identification of Pax5 target genes in early B cell differentiation. J Immunol. (2008) 180:1719–28. doi: 10.4049/jimmunol.180.3.1719
92. Tamura T, Tailor P, Yamaoka K, Kong HJ, Tsujimura H, O'Shea JJ, et al. IFN regulatory factor-4 and−8 govern dendritic cell subset development and their functional diversity. J Immunol. (2005) 174:2573–81. doi: 10.4049/jimmunol.174.5.2573
Keywords: chicken, CSF1R, dendritic cells, macrophages, mononuclear phagocyte system, RNA-seq, spleen
Citation: Sutton KM, Morris KM, Borowska D, Sang H, Kaiser P, Balic A and Vervelde L (2021) Characterization of Conventional Dendritic Cells and Macrophages in the Spleen Using the CSF1R-Reporter Transgenic Chickens. Front. Immunol. 12:636436. doi: 10.3389/fimmu.2021.636436
Received: 01 December 2020; Accepted: 09 February 2021;
Published: 09 March 2021.
Edited by:
Nicolas Bertho, INRA Biologie, Épidémiologie et Analyse de Risque en santé Animale (BIOEPAR), FranceReviewed by:
Marc Dalod, Centre National de la Recherche Scientifique (CNRS), FranceArtur Summerfield, Institute of Virology and Immunology (IVI), Switzerland
Copyright © 2021 Sutton, Morris, Borowska, Sang, Kaiser, Balic and Vervelde. This is an open-access article distributed under the terms of the Creative Commons Attribution License (CC BY). The use, distribution or reproduction in other forums is permitted, provided the original author(s) and the copyright owner(s) are credited and that the original publication in this journal is cited, in accordance with accepted academic practice. No use, distribution or reproduction is permitted which does not comply with these terms.
*Correspondence: Kate M. Sutton, a2F0ZS5zdXR0b25Acm9zbGluLmVkLmFjLnVr