 Tessa Höper1,2
 Katherina Siewert1
 Verónica I. Dumit1
 Martin von Bergen3,4
 Kristin Schubert3*†
 Andrea Haase1*†
- 1Department of Chemical and Product Safety, German Federal Institute for Risk Assessment (BfR), Berlin, Germany
- 2Department of Clinical Pharmacy and Biochemistry, Institute of Pharmacy, Freie Universität Berlin, Berlin, Germany
- 3Department of Molecular Systems Biology, Helmholtz-Centre for Environmental Research - UFZ, Leipzig, Germany
- 4Institute of Biochemistry, Leipzig University, Leipzig, Germany
Dendritic cells (DC) play a central role in the pathogenesis of allergic contact dermatitis (ACD), the most prevalent form of immunotoxicity in humans. However, knowledge on allergy-induced DC maturation is still limited and proteomic studies, allowing to unravel molecular effects of allergens, remain scarce. Therefore, we conducted a global proteomic analysis of human monocyte-derived dendritic cells (MoDC) treated with NiSO4, the most prominent cause of ACD and compared proteomic alterations induced by NiSO4 to the bacterial trigger lipopolysaccharide (LPS). Both substances possess a similar toll-like receptor (TLR) 4 binding capacity, allowing to identify allergy-specific effects compared to bacterial activation. MoDCs treated for 24 h with 2.5 μg/ml LPS displayed a robust immunological response, characterized by upregulation of DC activation markers, secretion of pro-inflammatory cytokines and stimulation of T cell proliferation. Similar immunological reactions were observed after treatment with 400 μM NiSO4 but less pronounced. Both substances triggered TLR4 and triggering receptor expressed on myeloid cells (TREM) 1 signaling. However, NiSO4 also activated hypoxic and apoptotic pathways, which might have overshadowed initial signaling. Moreover, our proteomic data support the importance of nuclear factor erythroid 2-related factor 2 (Nrf2) as a key player in sensitization since many Nrf2 targets genes were strongly upregulated on protein and gene level selectively after treatment with NiSO4. Strikingly, NiSO4 stimulation induced cellular cholesterol depletion which was counteracted by the induction of genes and proteins relevant for cholesterol biosynthesis. Our proteomic study allowed for the first time to better characterize some of the fundamental differences between NiSO4 and LPS-triggered activation of MoDCs, providing an essential contribution to the molecular understanding of contact allergy.
Introduction
Dendritic cells (DC) play a crucial role during the immune response given their linking function between innate and adaptive immunity. Immature DCs are phagocytic and sample antigens from surrounding tissues. The presence of additional stimuli, for instance activation via pattern recognition receptors such as toll-like receptors (TLR), triggers maturation of DCs. Upon maturation, the cells will partially lose their phagocytic characteristics and start migrating to draining lymph nodes while they undergo metabolic and phenotypic alterations (1–3) facilitating the presentation of the captured antigen to prime naïve T cells. These alterations include the secretion of different cytokines [e g., interleukin (IL) 1β, IL-6, IL-12 or tumor necrosis factor (TNF) α and the upregulation of antigen-presenting molecules and other DC surface proteins such as adhesion molecules, chemokine receptors, and co-stimulatory proteins. Particularly well described is the upregulation of the cluster of differentiation (CD) 86, CD54, CD40 and CD83 (4). A metabolic shift toward glycolysis supplies sufficient energy for the maturation of activated DCs (5).
DCs do not only play an essential role during host defense but also during chemical-induced immune responses like allergic contact dermatitis (ACD). It is assumed, that about 20% of the general population of Europe and North America are sensitized to at least one contact allergen (6). ACD is a prototypic T cell-mediated delayed-type hypersensitivity immune response that may be elicited after skin contact with organic chemicals or metal ions from cosmetics, jewelery or other commodities. Pathogenesis of ACD is sub-divided in two phases. Upon initial exposure to a contact allergen, the sensitization phase is initiated. Significant clinical symptoms will only emerge after re-exposure to the contact allergen during the so-called elicitation phase (7). The importance of DCs during the sensitization phase is well-understood and also reflected in the adverse outcome pathway on skin sensitization (8). To date, the maturation of DCs in the context of contact allergy has been insufficiently investigated. For instance, there is an ongoing debate, whether or not there are allergy-specific alterations of DCs, which may be used as allergy-specific biomarkers. Proteomics studies can help to elucidate molecular alterations induced by allergens. Proteins directly affect the phenotype of an organism and possess an enormous functional repertoire. They may, for instance, act as transporters, messenger molecules or as enzymatic catalyst. Furthermore, the number of genes is outnumbered by the number of proteins, e.g., due to manifold post-translational modifications. Thus, studying the proteome and metabolism of DCs after exposure to contact allergens is mandatory to get insights in the biological state of the cells (9).
Therefore, the aim of this study was to compare DC maturation induced by the metal allergen NiSO4 to the bacterial trigger lipopolysaccharide (LPS). DC maturation by the latter has been investigated extensively (10–13). Nickel has been selected for several reasons. Firstly, nickel is the most common cause of ACD in Europe. Even though numbers of affected individuals are decreasing as the EU nickel directive restricts nickel release from products intended for prolonged skin contact, still 8–18% of the European population are sensitized to nickel (14). Secondly, it was shown that both Ni2+ and LPS act via TLR4 although with different molecular binding mechanisms. LPS binds to a specific pocket on myeloid differentiation factor 2 (MD-2) which forms a heterodimer with TLR4 (15), inducing dimerization and internalization of TLR4 (16, 17). In contrast, Ni2+ was shown to bind to three histidine residues on the ectodomain of human TLR4, which is distinct from the endotoxin binding site (18). TLR4 dimerization, which is mandatory for receptor activation, was found to occur independently of MD-2 in the presence of Co2+ and Ni2+ (19).
We were interested in elucidating whether these differences in binding to TLR4 might eventually induce different proteins and pathways. The comparison of an allergen with a bacterial stimulant allows the identification of allergy specific effects and possible biomarkers which may support current in vitro testing strategies for skin sensitization. Hence, we here present a global proteomic analysis of LPS and NiSO4-treated primary human monocyte-derived DCs (MoDCs) using label-free quantification (LFQ). MoDCs were treated for 24 h with 400 μM NiSO4 or 2.5 μg/ml LPS. Upon harvest, cells were prepared for proteomic analysis as well as for flow cytometry analysis of selected cell surface markers and cytokines. Proteomic data were validated using suitable methods like qPCR revealing differences in NiSO4- and LPS-induced activation.
Materials and Methods
Reagents
Unless stated otherwise, all chemicals were purchased from Sigma-Aldrich. Phosphate buffered saline (PBS, P04-36500), RPMI 1640 (P04-17500), human serum (P-2701), HEPES (P05-01100), sodium pyruvate (P04-43100), penicillin-streptomycin (P06-07100) and non-essential amino acids (NEAA, P08-32100) were purchased from PAN.
MoDC Generation and Chemical Treatment
PBMCs were isolated by standard density gradient centrifugation with Ficoll Paque Plus (GE Healthcare, 17-1440-03) from human buffy coats. Buffy coats were obtained from German Red Cross (Berlin, Germany) according to the current version of the declaration of Helsinki with an approved ethic vote (Charité, Berlin Germany; EA4/071/13). Untouched CD14+ and CD14+CD16+ monocytes were isolated by negative depletion using the human PAN monocyte isolation kit (Biolegend, 480060), following the manufacturer's instructions. Monocytes were cultured in commercial ready-to-use MoDC differentiation medium containing 400 IU/ml IL-4 and 500 IU/ml GM-CSF (Miltenyi Biotec, 130-094-812) at 37°C with 5% CO2. Every two days, half of the culture medium was replaced with fresh medium. On day six, immature MoDCs were harvested, washed with PBS and resuspended in fresh medium at a density of 106 cells/ml. Cells were either treated with medium only as control, 2.5 μg/ml LPS (from Escherichia coli O111:B4, L3024-5MG) or 400 μM NiSO4 (31483, tested endotoxin-free using QCL-1000TM Endpoint Chromogenic LAL Assay (Lonza, 50-647U) according to the manufacturers protocol). For proteomic studies and flow cytometry, cells were harvested after 24 h of continuous chemical incubation; for quantitative RT-PCR, cells were incubated either for 24 h or over a 36 h period with sample collections at various time points.
Flow Cytometry
To characterize the phenotype of harvested MoDCs, cells were stained for 30 min at 4°C with BV421 anti-CD86 (FUN-1, 562433), FITC anti-CD40 (5C3, 555588), FITC anti–CD83 (HB15e, 556910), PE anti–CD80 (L307.4, 557227), APC anti-CD1a (HI149, 559775) (all BD Biosciences) and PE anti-CD14 (TÜK4, Miltenyi, 130-113-147). Viability was monitored using fixable near-IR dead cell stain (Thermo Fisher Scientific, L34976). For each antibody staining, a control isotype staining was included. Data were acquired using a FACSAria III flow cytometer (BD Biosciences) and analyzed with FlowJo software (V.10.6.1, FlowJo LLC, Ashland, OR, United States). An exemplary gating plot is depicted in Supplementary Figure 1. Graphical visualization was performed using GraphPad Prism 6 (GraphPad Inc., San Diego, CA, United States). On day 6 of MoDC differentiation, the immature state of MoDCs was confirmed by measuring downregulation of the monocytic marker CD14 and upregulation of the DC-marker CD1a (data not shown).
Phagocytosis of TNBS-Modified Human Serum Albumin
Human serum albumin (HSA, fraction V, Merck, 12668-10GM-M) was dissolved in PBS (10 mg/ml) and incubated at 37°C for 60 min with 5 mM trinitrobenzenesulfonic acid (TNBS, 92822-1ML) (mole ratio HSA:TNBS 1:300) following a modified protocol of Dietz et al. (20). Subsequently, free TNBS was removed with a 30 kDa cutoff spin filter and two consecutive washes with PBS. Purified trinitrophenyl (TNP)-modified HSA was resuspended in PBS, and protein concentration was determined using the Pierce BCA protein assay (Thermo Fisher Scientific, 23225). As a control, pure HSA dissolved in PBS was processed equally. MoDCs were treated for 3 h or 24 h with LPS or 400 μM NiSO4. To monitor phagocytosis, cells were harvested, seeded at a density of 105 cells/well in a 96-well plate and incubated with HSA-TNP or pure HSA (200 μg/ml). After 3 h, cells were stained with fixable near-IR dead cell stain followed by an intracellular BV421 anti-TNP (A19-3, BD Biosciences, 562601) stain with inside stain kit (Miltenyi, 130-090-477).
Mixed Leukocyte Reaction (MLR)
Chemical-treated MoDCs were harvested after 24 h, washed with PBS and 6 × 10⁴ cells/well were seeded in a 96-well U-bottom plate. Following the manufacturer's instructions, allogenic PAN T cells were negatively depleted from PBMCs with PAN T cell isolation kit (Miltenyi, 130-096-535). T cells were labeled with 4 nM CSFE (Thermo Fisher Scientific, C34554) to monitor cell proliferation and added to MoDCs at a concentration of 6 × 10⁵ cells/well (ratio T cells: MoDCs = 10:1). As a negative control, T cells were cultured without MoDCs. As a positive control, a co-culture of T cells and medium-treated MoDCs, was stimulated with 1 μg/ml staphylococcal enterotoxin B superantigen (S4881-1MG). Cells were cultured in RPMI 1640 supplemented with 10% human serum, 2 mM GlutaMAX (Gibco, Thermo Fisher Scientific, 35050061), 10 mM HEPES, 1x NEAA, 1 mM sodium pyruvate, 100 U/ml penicillin, 0.1 mg/ml streptomycin and 100 U/ml β-mercaptoethanol (Gibco, 21985023) at 37°C with 5 % CO2. On day 4, proliferating T cells were identified by their reduced CFSE signal.
Inhibition of p38 and HIF1α
MoDCs were treated with 20 μM SB203580 (Biomol, AG-CR1-0030-M005) to inhibit p38 activity, or with 0.5 nM echinomycin (Biomol, BVT-0267-M001) to inhibit binding of hypoxia-inducible factor (HIF) 1α to hypoxia response elements for 30 min. Subsequently, LPS and NiSO4 were added at final concentrations of 2.5 μg/ml and 400 μM, respectively. After 24 h, viability and CD86 expression were analyzed by flow cytometry.
Immunoblotting of HIF1α
Chemically treated MoDCs were collected after 24 h of treatment. Cells were washed with ice-cold PBS and cell lysis was performed with the lysis buffer described in the LC-MS/MS sample preparation section. Protein concentration was determined using the Pierce BCA protein assay. Subsequently, 20 μg protein were loaded on 10% SDS-PAGEs. Following the separation, proteins were transferred to nitrocellulose membranes (BioRad, 1620115). The immunoblots were blocked in 5% skimmed milk and incubated for 16 h at 4°C to allow binding of the primary anti-HIF1α antibody (H1alpha67, Novus Biologicals, NB100-105). Binding of the secondary antibody (horseradish peroxidase labeled, Dianova, 115-035-206) was performed for 1 h at room temperature. The blot was visualized using Pierce ECL West Pico Substrate (Thermo Fisher Scientific, 34078) using a Fusion FX6 gel documentation (Vilber, Eberhardzell, Germany). A HRP anti-β actin antibody (AC-15, Abcam, ab49900) was used as loading control. Blots were analyzed using the Image Lab 6.0.1 software (BioRad). All values were background-corrected and the HIF1α-signal was normalized to the β-actin signal and medium control.
Quantification of Secreted Cytokines
MoDC culture supernatants were collected after chemical treatment for 24 h. Cells and debris were removed by centrifugation for 10 min at 300 g. Following the manufacturer's instructions, IL-1β, IL-6, IL-8, IL-10, IL12p70, IL-18 and TNFα were quantified with a customized bead-based LEGENDplex immunoassay (Biolegend) on a FACS Aria III. Data were analyzed using the provided LEGENDplex v8.0 software. Data were log2 transformed and visualized with GraphPad prism. Student's t-test was applied to calculate p-values relative to medium control.
Quantitative Real-Time PCR
MoDCs were collected after chemical treatment, washed with ice-cold PBS and resuspended in TRIzol reagent (Invitrogen, Thermo Fisher Scientific, 15596026). RNA was isolated from 106 cells following the TRIzol manufacturer's protocol. Quantification of isolated RNA was performed on a NanoDrop 1000 (VWR, Radnor, PA, United States). One microgram RNA was used for reverse transcription into cDNA using the High-capacity cDNA reverse transcription kit (Applied Biosystems, Thermo Fisher Scientific, 4368813). Quantitative real-time PCR was performed on a TaqMan PCR 7500 fast system (Applied Biosystems) using Fast SYBR green master mix (Applied Biosystems, 4385618) and the following primers: HPRT DNA forward 5′-GTTCTGTGGCCATCTGCTTAG-3′, reverse 5′- GCCCAAAGGGAACTGATAGTC-3′; HIF1α DNA forward 5′-TTTTTGCTGAAGACACAGAAGC-3′, reverse 5′- GCTTGCGGAACTGCTTTCTA-3′; SLC2A1 DNA forward 5′- CCAGCAGCAAGAAGCTGAC-3′, reverse 5′- AGGATGCTCTCCCCATAGC-3′; HMGCR DNA forward 5′-TGTTTACTGGTAACAATAAGATCTGTG-3′, reverse 5′-GTTGACGTAAATTCTGGAACTGG-3′; SOD2 DNA forward 5′-TTGGCCAAGGGAGATGTTAC-3′, reverse 5′-AGTCACGTTTGATGGCTTCC-3′; NQO1 DNA forward 5′-GCACTGATCGTACTGGCTCA-3′, reverse 5′-GAACACTCGCTCAAACCAG-3′; TNFα DNA forward 5′-CTTCTGCCTGCTGCACTTTGGAG-3′, reverse 5′-GGCTACAGGCTTGTCACTCGG-3′; HK2 DNA forward 5′-GTTCCTGGCTCTGGATCTTG-3′, reverse 5′-GGCAATGTGGTCAAACAGC-3′; SREBF2 DNA forward 5′-CACCAAGCACGGAGAGGT-3′, reverse 5′-GGGGAGGAGAGGAAGGAGA-3′; PFKFB3 DNA forward 5′-AAAAGTGTTCAACGTCGGGG-3′, reverse 5'-CGAAAACCGCAATTTGTCCC-3'; SLC2A3 DNA forward 5'-GAGGACGTGGAGAAAACTTGC-3', reverse 5′-GCCAAATTGGAAAGAGCCGA-3′; SLC2A6 DNA forward 5′-ATCCCAGGCATCCTGGTTTG-3′, reverse 5′-GGTCGTTGAGGATCATGGCA-3′. The following genes were analyzed using QuantiTect Primer Assay (Qiagen): HMOX1 (#QT00092645); PRDX1 (#QT01005536); GSTO1 (#QT02394287); CAT1 (#QT00079674). cDNA was 1:10 fold diluted in water and 1 μl was used for qRT-PCR analysis. Gene expression was normalized to the housekeeping gene HPRT, and relative gene expression was determined using the ΔΔCT method (21). Significance relative to medium-control was calculated using Student's t-test in GraphPad Prism.
Cholesterol Quantification
To evaluate effects of chemical treatment on cellular cholesterol content, MoDCs were treated with LPS and NiSO4 as stated above. As a positive control for the inhibition of the cholesterol biosynthesis, medium-treated MoDCs were treated with 40 μM lovastatin (M2147-25MG). After 24 h, cells were harvested and washed with PBS. Lipids were extracted following the Folch protocol (22). Briefly, cells were resuspended in 500 μL chloroform-methanol (2:1, 1024451000, 1060072500), and lipids were extracted for 20 min by shaking and occasional vortexing at 4°C. Extraction was repeated after addition of 125 μL water. The suspension was centrifuged for 10 min at 1,000 g and 300 μL of the organic phase were transferred to a new Eppendorf tube and vacuum-dried. Proteins were obtained from the interphase and their concentration was determined using the Pierce BCA protein assay. Cholesterol levels of the samples were quantified using the Amplex Red Cholesterol Assay Kit (Thermo Fisher Scientific, 10236962). Desiccated lipids were dissolved in assay buffer and analyzed following the manufacturer's protocol. Fluorescence was measured at 590 nm emission on a Synergy Neo2 plate reader (BioTek, Winooski, VT, United States) with excitation at 540 nm. Total cholesterol levels were standardized to the respective protein concentration and normalized to the untreated control. P-values were calculated using Student's t-test relative to the medium control.
LC-MS/MS
Cell Lysis
After chemical treatment, MoDCs were collected, washed twice with ice-cold 0.9% NaCl and lysed in 100 μL lysis buffer per 106 cells. The lysis buffer was composed of 150 mM NaCl (S7653-250G), 10 mM TRIS pH 7.2 (T1503-250G), 5 mM EDTA (E5134-250G), 0.1% SDS (436143-25G), 1% Triton X-100 (T8787-100ML), 1% sodium deoxycholate (30970-100G), 200 μM phenylmethylsulfonyl fluoride (P7626-1G), 1 mM sodium orthovanadate (S6508-10G) and cOmplete protease inhibitor cocktail (Roche, 1.167.498.001). Cells were vortexed, incubated on ice for 15 min and centrifuged. The protein concentration of the supernatant was determined using Pierce BCA protein assay.
Sample Preparation
An untargeted proteomics approach was applied using label-free quantification as described before (23). Briefly, 30 μg protein per sample was reduced with 0.1 μmol tris(2-carboxyethyl) phosphine (C4706-10G), followed by alkylation with 0.2 μmol iodoacetamide (Merck, 8.04744.0025). Protein solutions were acidified and acetonitrile (ACN, Carl Roth, AE70.2) was added to reach more than 50 % (v/v) organic content facilitating protein binding to SpeedBeads™ magnetic carboxylate modified particles (SP3 beads, GE Healthcare, 65152105050250). Proteins were loaded on 20 μg beads, followed by a first washing step with 70% (v/v) ethanol (Merck, 22.462.500) in water and a second step with 100 % (v/v) ACN. Proteins were digested with trypsin (enzyme:protein ratio 1:50, Promega, V5117) in 100 mM tetraethylammonium bromide (T7408-100ML). Digestion was stopped by addition of 100 % (v/v) ACN to reach ≥ 95% (v/v) organic content, thus again allowing the peptides to bind to the beads. Peptides were again cleaned-up using 100% (v/v) ACN. Elution of peptides was carried out in two steps with 87% (v/v) ACN in ammonium formate (pH 10) (Agilent Technologies, AGG1946-85021), followed by 2% (v/v) dimethyl sulfoxide (D2650-5x-10ml), resulting in two fractions per sample. Samples were evaporated to dryness and reconstituted in 0.1% (v/v) formic acid (FA, Fluka, Thermo Fisher Scientific, 56302-50ML-F) before measurement.
LC-MS/MS
Samples were analyzed on a UPLC system (Ultimate 3000, Dionex, Thermo Fisher Scientific) coupled to a Q Exactive HF (Thermo Fisher Scientific) as described previously (23). Peptides were loaded on an Acclaim PepMap 100 C18 trap column (3 μm, nanoViper, 75 μm × 5 cm, Thermo Fisher Scientific, PN164535) at a flow rate of 5 μl/min using an eluent composed of 2% (v/v) ACN and 0.05% (v/v) trifluoroacetic acid (Biosolve, 202341A8) in water. Peptides were separated by a 150 min non-linear gradient from 0 to 80% ACN in 0.1% FA on a reversed-phase column (Acclaim PepMap 100 C18, 3 μm, nanoViper, 75 μm × 25 cm, Thermo Fisher Scientific, PN164569). A chip-based ESI source (Nanomate, Advion, Ithaca, NY, United States) was used for ionization at 1.7 kV and coupled to the Q Exactive HF. The MS1 scans were acquired at a resolution of 120K in a range of 350–1,550 m/z. AGC target was set to 3 × 10⁶ with a maximal injection time of 100 ms. The top 10 most abundant peptides were isolated for MS2 acquisition with an isolation window of 1.4 m/z. Peptides were fragmented at normalized collision energy of 28, and the fragment ion spectra were acquired at a resolution of 15K using AGC target of 2 × 10⁵ and maximal IT of 100 ms. All spectra were acquired using XCalibur (Version 3.0).
Analysis
MS raw data were processed with MaxQuant Version 1.6.3.10 (24). If not stated otherwise, default parameters were used. Peptides were identified using a database search against the Homo sapiens UniProtKB reference proteome (24-09-2019, 74349 reviewed and unreviewed entries). Carbamidomethylation of cysteine was chosen as fixed, whereas oxidation of methionine and acetylation of protein N-terminus were set as variable modifications. A minimum of two peptides with at least one unique peptide was required for protein identification applying FDR ≤ 0.01. Match between runs was activated. Proteins were quantified based on two unique peptides. Protein contaminants and reverse hits were excluded before further use. LFQ protein intensities were processed, and results were visualized in R-3.5.0. Accordingly, the data were log2-transformed, filtered for proteins that were quantified in a minimum of four replicates under at least one condition, followed by variance-stabilization. Imputation was performed using the DEP package (25) (fun = “MinProb,” q = 0.01) for proteins not quantified in any of the replicates under the particular condition. Fold changes (FCs) and p-values were calculated using Student's t-test relative to the medium control. Proteins with a p-value ≤ 0.05 were considered as significantly changed.
Pathway Enrichment
Significantly enriched pathways were identified using ingenuity pathway analysis (IPA, Qiagen), considering significantly enriched proteins.
Results
Phenotypical and Functional MoDC Characterization
The effects of NiSO4 and LPS on the phenotype and function of primary human monocyte-derived DCs (MoDCs) were investigated first. MoDCs were generated from buffy coats of five individual donors, and treated with LPS (2.5 μg/mL) or NiSO4 (400 μM) for 24 h. Cell viability and upregulation of the maturation markers CD86, CD83, CD40 and CD80 on their surface was measured (Supplementary Figure 1). Cell viability was assured to be above 75% for all samples (Supplementary Figure 1A), in agreement with the acceptance criteria of the human Cell Line Activation Test (26). MoDCs were used in further experiments, if maturation markers were upregulated after LPS- and NiSO4-treatment (Supplementary Figures 1B–E). Overall, changes induced by LPS were more pronounced.
Furthermore, the gene expression of the allergy relevant cytokine TNFα was determined by qRT-PCR. The TNFA gene is directly induced after TLR4 signaling and activates nuclear factor κB (NFκB). To capture the dynamics of TNFA expression, we measured its gene expression over 36 h at various time points. The time course of gene induction was comparable for LPS and NiSO4 peaking 2 h after treatment. However, LPS acted as a much more potent inducer (Supplementary Figure 2).
Moreover, selected inflammatory cytokines (IL-1β, IL-6, IL-8, IL-10, IL12p70, IL-18, and TNFα) were quantified in the cell culture supernatants using a bead-based immunoassay (Supplementary Figure 3). The production of IL-8 for example is used as a biomarker for DC activation (26). All cytokines were significantly enriched in the cell culture supernatant of both treatments compared to the unstimulated control. Only for IL-10, NiSO4-induced release was not significantly altered compared to medium control. Overall, the secreted amounts of all analyzed cytokines were higher in LPS-treated compared to NiSO4-treated cells.
The Phagocytotic Activity of LPS- and NiSO4-Treated MoDCs Is Markedly Reduced
It is widely accepted that mature DCs are less phagocytotic compared to their immature progenitors. The degree of reduction of phagocytosis depends on the stimuli as well as on the DC maturation state (27–29). Thus, we aimed to functionally compare dendritic cells that were maturated with either LPS or NiSO4 by monitoring uptake of trinitrophenyl-modified HSA. MoDCs maturated for 3 h with either substance showed no significant reduced phagocytotic activity compared to untreated cells (Supplementary Figure 1G). However, prolonged chemical treatment of 24 h reduced phagocytosis of MoDCs (Supplementary Figure 1F). The degree of reduction in phagocytotic activity was comparable for LPS and NiSO4.
LPS- and NiSO4-Treated MoDCs Induce Proliferation of Allogenic T Cells
To test whether NiSO4 affects the ability of MoDCs to activate T cells, we performed a mixed leukocyte reaction. Control, LPS- or NiSO4-treated MoDCs were incubated for 4 days with allogenic T cells, and proliferation of the latter was determined by CFSE dilution. LPS- and NiSO4-treated MoDCs induced stronger proliferation of T cells compared to control MoDCs with LPS being the more potent inducer (Supplementary Figure 4A). These results are in concordance with the upregulation of co-stimulatory molecules on the DC surface. As control, T cells were incubated in the absence of MoDCs, which resulted in hardly any proliferation compared to T cells cultured in the MLR (negative control, data not shown) while the superantigen staphylococcal enterotoxin B induced a strong T cell proliferation (positive control, data not shown).
Overall, the upregulation of activation markers, expression of inflammatory cytokines, reduced antigen-uptake and the ability to induce T cell proliferation prove the activation of MoDCs after treatment with NiSO4 and LPS. Thus, even if less pronounced compared to LPS, immunological signaling induced by NiSO4 was demonstrated.
Proteomic Analysis
To analyze the underlying cellular effects and to identify similarities and changes of LPS- and NiSO4-activated DCs, we applied a global proteomics approach. A principal component analysis was employed to assess the similarity of the treatment groups. Biological replicates show little variance, indicative for the high quality of our proteomic dataset. NiSO4-samples cluster between LPS- and control-samples (Figure 1A), pointing toward an intermediate cellular state of NiSO4-treated cells. In total, more than 3,300 proteins were identified using a label-free quantification approach (Supplementary Table 1). Of these, the majority was identified in both treatment groups (Figure 1B). Analysis of significantly altered proteins relative to the control exhibited 493 significantly altered proteins by LPS, while 402 proteins were changed by NiSO4-treatment and 144 proteins were altered by both treatments with p ≤ 0.05 (Figure 1B). Furthermore, the z-score of each fold change was calculated and plotted in a heat map (Figure 1C), which allowed comparison across replicates and treatments. Biological replicates show minimal variance, which allowed the identification of clusters of significantly altered proteins compared to the control. Interestingly, we observed different clusters of upregulated proteins for NiSO4-treated cells compared to LPS-treatments, indicating a distinct mode of action. Next, we visualized the data using volcano plots to identify statistically significantly regulated proteins based on their p-value compared to the magnitude of change. As shown in Figure 1D, LPS induced a more pronounced spread of the data. Overall, upregulation was favored over downregulation for both chemicals.
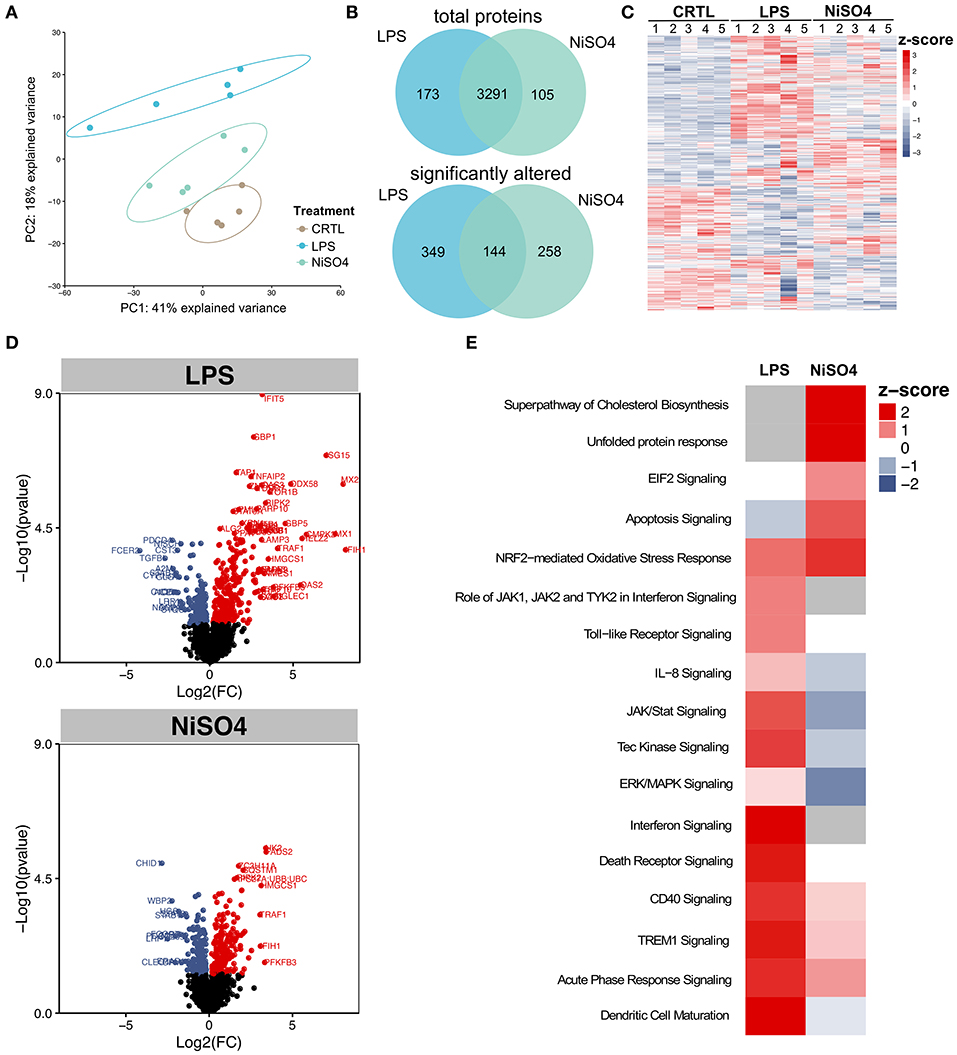
Figure 1. Quantitative proteomic analysis of differentially regulated proteins in LPS- and NiSO4-treated MoDCs. (A) Principal component analysis of the five biological replicates showing a distinct clustering of each group, (B) Venn-diagrams of total as well as significantly altered proteins in the LPS-group (blue) and NiSO4-group (green), (C) heat map of significantly regulated proteins. Plotted are z-scores for all identified proteins, (D) volcano plots showing significantly regulated proteins for LPS- and NiSO4-treated MoDCs compared to untreated MoDCs (p ≤ 0.05). Mean values of the log2-fold change are displayed and plotted against –log10(p-value), red = upregulation, blue = downregulation, (E) significantly changed pathways in LPS and NiSO4-treated MoDCs. Canonical IPA pathways with a positive z-score (red) are predicted to be activated; blue represents a negative z-score and inactivation of the pathway. Gray indicates unmatched pathways. IPA analysis was based on proteins that were significantly changed compared to control (p ≤ 0.05). Within the IPA software, z-scores were calculated and only experimental data of human origin was allowed. The tissue specificity was set to immune cells. Significance was calculated using Student's t-test.
To differentiate the effects of LPS- or NiSO4-treatment on cellular pathways, significantly altered proteins (p ≤ 0.05) were used to identify enriched pathways using QIAGEN's Ingenuity Pathway Analysis (IPA). Notably, LPS-treatment induced more significantly enriched pathways than NiSO4 (Figure 1E). Shared pathways between the two groups included Nrf2-mediated oxidative stress response, CD40 signaling, triggering receptor expressed on myeloid cells (TREM) 1 signaling and acute phase response signaling. Pathways that were uniquely induced after NiSO4-treatment comprised the superpathway of cholesterol biosynthesis, the unfolded protein response and eukaryotic initiation factor (EIF) 2 signaling.
NiSO4-Treatment Activates Nrf2 Target Genes in MoDCs
The nuclear factor erythroid 2-related factor 2 (Nrf2)-mediated oxidative stress response was predicted to be highly activated in the ingenuity pathway analysis for NiSO4-treated MoDCs. Furthermore, this pathway was among the few pathways that were induced much stronger by NiSO4 compared to LPS (Figure 1E). Hence, we ought to investigate the differences between the two stimuli concerning the Nrf2 pathway in more detail. Gene expression of Nrf2-target genes was analyzed by quantitative RT-PCR (Figure 2). Indeed, 4 out of 6 genes, namely GSTO1, GSTM1, NQO1, and PRDX1, were induced only due to NiSO4- but not after LPS-treatment. HMOX1 gene expression was more pronounced after NiSO4-treatment; however, the effect was not statistically significant. SOD2 gene levels were exacerbated after both treatments, rendering SOD2 the only Nrf2 target gene that was found to be significantly upregulated after LPS-treatment. On the protein level, heme oxygenase (HMOX) 1 was confirmed in the proteomic data set as significantly upregulated after NiSO4-treatment. Superoxide dismutase (SOD) 2 showed strong upregulation on protein level after both treatments. However, only LPS induced changes were significant. From this data, it can be concluded that NiSO4 causes a distinct oxidative stress level in MoDCs which may strongly contribute to the activation of the cells. Thus, induction of oxidative stress may be an additional mode of action besides TLR4 activation in NiSO4-treated MoDCs.
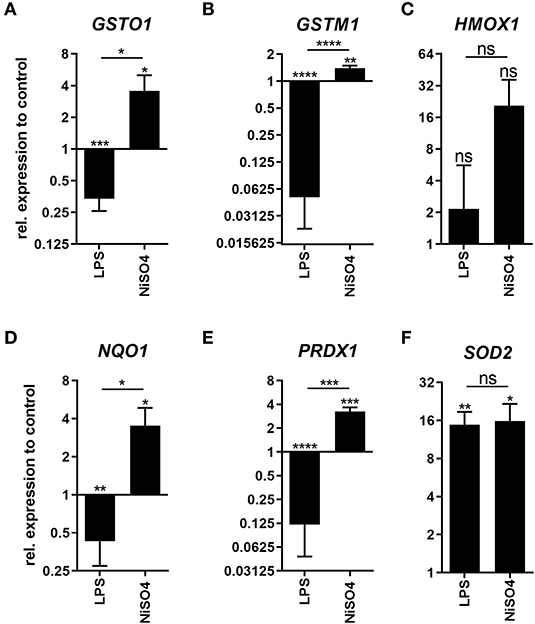
Figure 2. Expression of Nrf2-target genes in LPS- and NiSO4-treated MoDCs. Depicted is the gene expression of glutathione S-transferase omega (GSTO1, A), glutathione S-transferase mu (GSTM1, B), heme oxygenase (HMOX1, C), NAD(P)H dehydrogenase (NQO1, D), peroxiredoxin (PRDX1, E) and superoxide dismutase (SOD2, F) as measured by the qRT-PCR after treatment of MoDCs with medium only, 2.5 μg/ml LPS or 400 μM NiSO4 for 24 h. Gene expression was normalized to the gene expression of the housekeeping gene HPRT and medium control. Thereof, mean and SD are shown (n = 3 donors). Applying the Student's t-test, significance was calculated to medium control (*p-value ≤ 0.05; **p-value ≤ 0.01; ***p-value ≤ 0.001; ****p-value < 0.0001).
NiSO4 Leads to Cholesterol Depletion but Induces Cholesterol Biosynthesis Pathway
Pathway enrichment analysis by IPA revealed the superpathway of cholesterol biosynthesis as one of the strongly activated pathways after treatment of MoDCs with NiSO4 (Figure 1E). Proteins matched to this pathway were significantly upregulated and comprised proteins like lanosterol 14α-demethylase (CYP51A1), hydroxymethylglutaryl-CoA synthase (HMGCS1) and 7-dehydrocholesterol reductase. We therefore quantified cellular cholesterol levels using the Amplex Red Cholesterol assay and confirmed a significant depletion of cholesterol in NiSO4-treated MoDCs (Figure 3A). The strength of this effect was comparable to that of cells treated with lovastatin, an inhibitor of 3-hydroxy-3-methyl-glutaryl-coenzyme A reductase (HMGCR), which is the rate-limiting enzyme of the cholesterol biosynthesis. In contrast, LPS did not induce changes in cellular cholesterol levels. Based on these findings, we analyzed the gene expression of HMGCR and sterol regulatory element-binding protein (SREBB) 2, the regulating transcription factor of this pathway. Both genes were found to be constantly upregulated in NiSO4-treated MoDCs but were not induced (or even slightly downregulated) after treatment with LPS (Figures 3B,C).
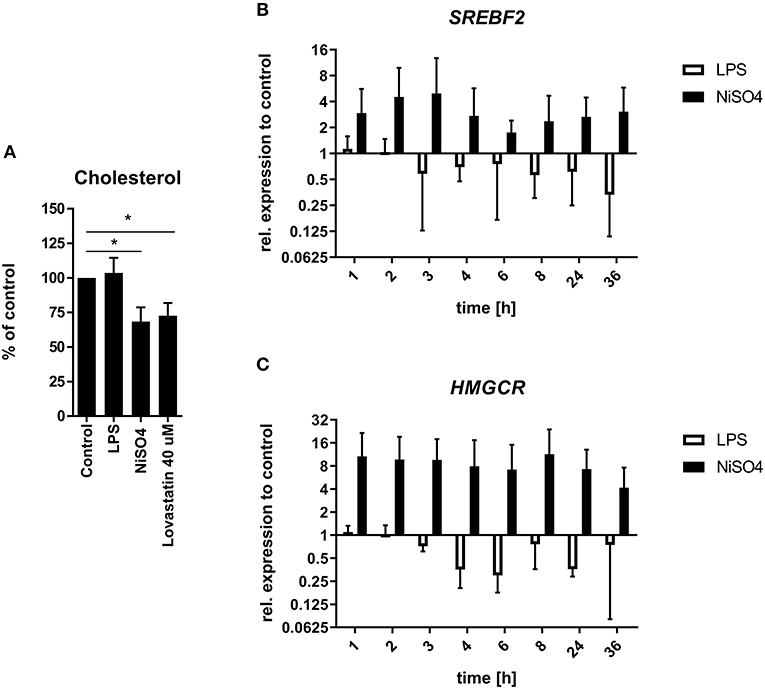
Figure 3. Cellular cholesterol quantification and relative gene expression of relevant genes in LPS- and NiSO4-treated MoDCs. (A) Cellular cholesterol levels were determined fluorometrically using the Amplex Red Cholesterol Assay kit after lipid extraction from MoDCs treated for 24 h. The fluorescence intensity was normalized to the protein concentration of the respective sample. Cholesterol/protein-ratios were then further normalized to the untreated control. Significance to medium control was calculated using Student's t-test and is indicated with *p ≤ 0.05. The relative gene expression of sterol regulatory element-binding protein 2 (SREBF2, B) as well as 3-hydroxy-3-methylglutaryl-coenzyme A reductase (HMGCR, C) were analyzed at selected time points after treatment of MoDCs. Gene expression was measured by qRT-PCR and normalized to the gene expression of HPRT (housekeeping gene) and medium control. Plotted are mean and SD of the normalized data (n = 3 donors). For each assay MoDCs were treated with medium only, 2.5 μg/ml LPS, 400 μM NiSO4 or 40 μM lovastatin.
LPS and NiSO4 Induce Metabolic Shifts That Lead to Hypoxic Conditions in Case of NiSO4
Metabolic reprogramming is essential during DC maturation since the metabolic switch from oxidative phosphorylation to glycolysis ensures adequate energy supply to support cellular reconstructions. Thus, we aimed to investigate the effects of NiSO4 on the metabolism of DCs. In the proteomic data set, proteins associated with anaerobic glycolysis were significantly upregulated after treatment with NiSO4, including lactate dehydrogenase (LDHA) along with the glycolytic enzymes aldolase A (ALDOA), hexokinase (HK) 2 and 6-phosphofructo-2-kinase/fructose-2,6-biphosphatase (PFKFB) 3. These findings were supported by elevated expressions of proteins from the glucose transporter (GLUT) family which facilitate the transport of sugars. Namely, solute carrier (SLC) 2A1, SLC2A3/2A14 and SLC2A6 expression were significantly increased after NiSO4-treatment (Figure 4A).
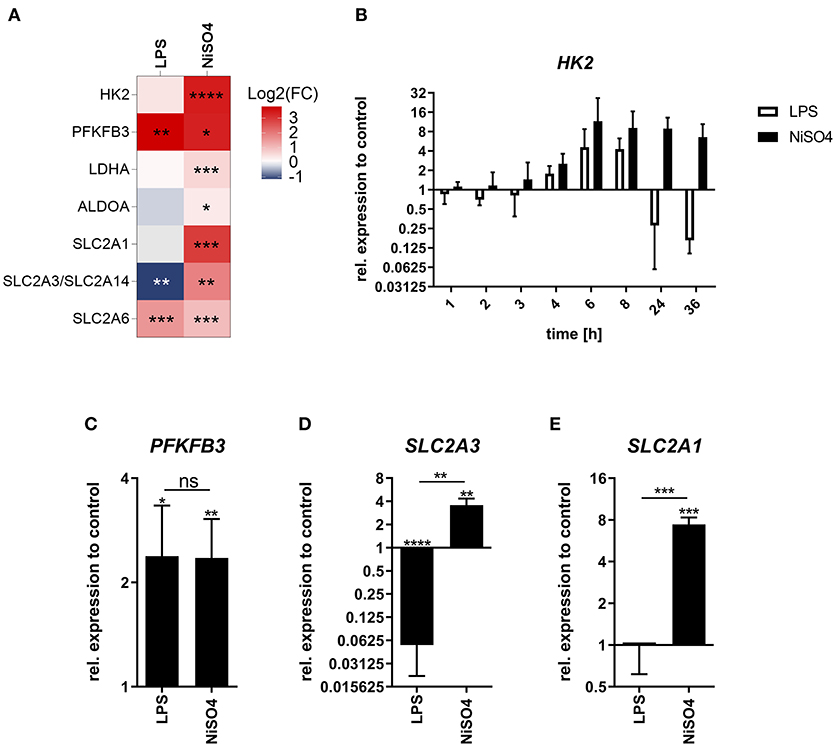
Figure 4. Fold change of glycolytic proteins and their respective gene expression in LPS- and NiSO4-treated MoDCs. (A) Heat map of differentially upregulated proteins in the proteomics data set linked to glycolysis and glucose transport. Red indicates upregulation of the respective protein and blue refers to downregulation (n = 5 donors). (B–E) Relative gene expression of hexokinase 2 (HK2, B), 6-phosphofructo-2-kinase/fructose-2,6-bisphosphatase 3 (PFKFB3, C), solute carrier family 2 member 3 (SLC2A3, D) and solute carrier family 2 member 1 (SLC2A1, E). Gene expression was measured by qRT-PCR at indicated time points (B) or after 24 h of treatment for (C–E). Gene expression was normalized to the gene expression of HPRT (housekeeping gene) and medium control. Mean and SD of the normalized data are shown (n = 3 donors). Significance to medium control was calculated using Student's t-test (ns: not significant; *p-value ≤ 0.05; **p-value ≤ 0.01; ***p-value ≤ 0.001; ****p-value < 0.0001). MoDCs were treated with medium only, 2.5 μg/ml LPS or 400 μM NiSO4.
In contrast, cells treated with LPS induced only upregulation of PFKFB3 and SLC2A6. SLC2A1 was not detected, and SLC2A3 was significantly downregulated in this group (Figure 4A). Thus, we aimed to investigate these differences in more detail using RT-PCR. Gene expression analysis suggests different kinetics for HK2 gene expression. Both treatments resulted in an increasing HK2 gene expression over the first 6 h of treatment. After 6 h a plateau was reached, which NiSO4-treated MoDCs maintained over the investigated time. Yet, LPS-treated MoDCs appear to counteract this gene induction leading to subsequent downregulated expression of HK2 (Figure 4B). Upregulation of PFKFB3 induced by LPS and NiSO4 was verified by measuring gene expression after 24 h (Figure 4C). Protein expression of the GLUT family proteins was confirmed by measuring the gene expression of the respective genes 24 h after treatment (Figures 4D,E, Supplementary Figure 5B). Stimulation of MoDCs with LPS was shown to cause metabolic reprogramming that was mainly dependent on p38 mitogen-activated protein kinase signaling leading to HIF1α accumulation and elevated HK2 gene expression and activity (30). In our study, expression of the HIF1A gene was downregulated for both groups (Supplementary Figure 5A) but quantitative immunoblot analysis revealed increased cellular HIF1α protein levels after 24 h of treatment (Supplementary Figure 5C). Since we found HK2 upregulated on protein and gene level, we were interested in studying whether inhibition of p38 using the inhibitor SB203580 had similar effects in LPS- and NiSO4-stimulated cells. Indeed, CD86 expression was decreased after inhibition of p38. However, the reduction was only significant in LPS-treated MoDCs (Supplementary Figure 6A). Additionally, we analyzed the effect of echinomycin-induced HIF1α inhibition on the MoDCs. Inhibition of HIF1α induced a significant reduction of the CD86 fluorescence signal in NiSO4- treated cells (Supplementary Figure 6B). The pronounced dependency of NiSO4-treated cells on HIF1α along with increased protein levels and gene expression of glycolytic enzymes and glucose transporters can be indicative for a prolonged stabilization of HIF1α and hypoxia-like conditions (31).
Figure 5 summarizes the main findings of this study in a comprehensive and visual way.
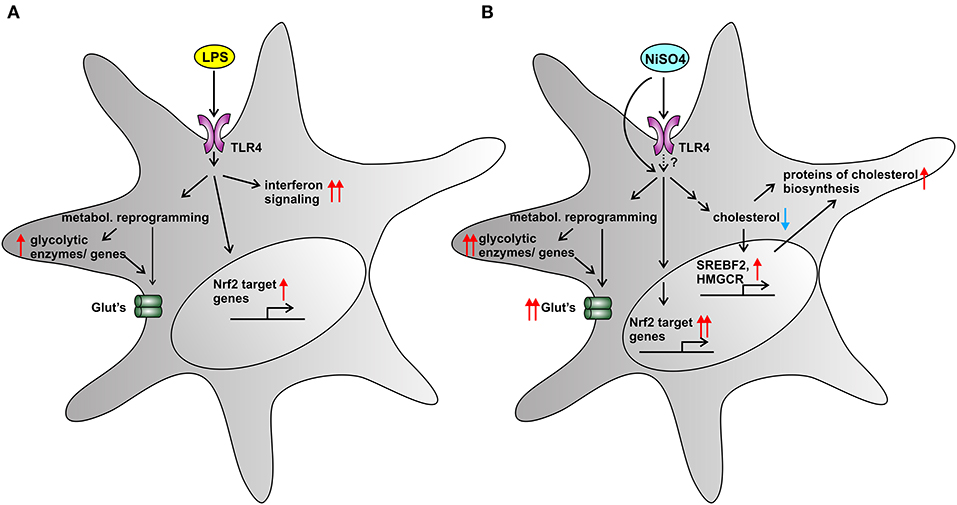
Figure 5. Summarizing Figure. Cellular effects of two TLR4-activators on MoDCs: LPS (A) and NiSO4 (B). (A) LPS-treatment induced a metabolic shift toward glycolysis and a weak Nrf2-dependent stress response. IPA pathway analysis revealed a strong upregulation of interferon signaling. (B) NiSO4-treated cells showed a distinct upregulation of glycolytic enzymes both on mRNA and protein level, suggesting metabolic reprogramming and hypoxia-like conditions. The metal allergen NiSO4 also triggered a pronounced Nrf2-dependent stress response that culminated in upregulation of Nrf2-target genes. Most strikingly, NiSO4 induced a cellular cholesterol depletion in MoDCs, which was reflected in the upregulation of genes and proteins involved into cholesterol biosynthesis. We speculate that haptenation to other cellular proteins than TLR4 also contributed to the observed changes. A blue arrow indicates downregulation and red arrows indicate upregulation. A pronounced change is indicated by two arrows.
Discussion
The present study aimed at elucidating the cellular mode of action of NiSO4-stimulation in primary human MoDCs in comparison to LPS activation. Nickel is a well-known allergen, whereas LPS belongs to pathogen-associated molecular patterns of Gram-negative bacteria. Both agents are known to activate DCs by ligation to TLR4 (15, 18). As the molecular binding mechanism is not identical (19), we studied if this may lead to the differential regulation of allergy-specific proteins in NiSO4-treated MoDCs. To investigate proteome alterations and underlying mechanisms, we applied different approaches including proteomics, quantitative RT-PCR and flow cytometry. MoDCs generated from five individual donors were treated with 2.5 μg/ml LPS or 400 μM NiSO4 to induce maturation of DCs. We confirmed maturation of MoDCs by both stimuli along with reduced phagocytosis, secretion of immunostimulatory cytokines as well as induction of T cell proliferation. Overall, NiSO4-treatment appears to elicit a phenotype comparable to LPS.
At the protein level, LPS-treated cells in our study elicited proteins and signaling as reported previously. Arya et al. (13) conducted a study to characterize proteomic changes induced in MoDCs after LPS treatment. The pathways of interferon signaling and IL-9 signaling and the proteins nuclear factor NF-kappa-B p105 subunit (NFKB1), nuclear factor NF-kappa-B p100 subunit (NFKB2), IL-1β, TNF receptor-associated factor (TRAF) 1, E3 ubiquitin-protein ligase TRIM4, CD54, fascin and signal transducer and activator of transcription 1 were also significantly altered by LPS in our study. NiSO4-treatment likewise lead to significantly altered levels of NFKB2, fascin, CD54 and TRAF1. Hussaarts et al. (3) analyzed proteomic changes in MoDCs that were incubated with LPS for 32 h. The authors identified TRAF1, myristoylated alanine-rich C-kinase substrate, human leukocyte antigen B as well as fascin as TOP4 upregulated proteins. We could confirm these findings for LPS-treated MoDCs. However, after NiSO4-treatment, only TRAF1 and fascin were significantly altered. The respective TOP4 downregulated proteins in the study by Hussaarts et al. (3) were cathepsins, ganglioside GM2 activator and macrophage mannose receptor 1, which again were also significantly downregulated after LPS-treatment in our proteomic data. Macrophage mannose receptor 1 was the sole protein that was significantly downregulated after NiSO4-treatment, too. Despite these eight proteins, also other proteins were identified to be significantly regulated after LPS-treatment in both studies, such as SOD2, WARS and CD54 indicating that the maturation of MoDCs due to LPS is generally robust. In the context of allergy, Strasser et al. (32) published a proteomic study in MoDCs reacting to the prominent birch pollen allergen Bet v 1. The pure recombinant allergen induced only minor changes in MoDC. However, changes caused by birch pollen extract were comparable to LPS induced changes. The authors therefore suspect that Bet v 1 only displays its allergenic potential in combination with additional danger signals such as LPS. The data presented for the birch pollen extract and LPS show high similarities with the data set presented here. The allergenic pollen extract and NiSO4 induce similar IPA pathways including Nrf2 mediated oxidative stress response, TREM1 signaling and ERK/MAPK signaling. Furthermore, we were able to identify HMOX1, SOD2, sequestosome-1, TRAF1 and nicotinamide phosphoribosyltransferase as significantly changed due to NiSO4. Proteomic changes induced by the investigated NiSO4 are hence more comparable with the birch pollen extract than with the recombinant protein itself. It can be suspected that NiSO4 does possess the ability to induce danger signaling that Bet v 1 seems to lack. These findings also point to TREM1 as one important signaling pathway in the induction of an allergy.
In our study, both stimuli, LPS and NiSO4, induced protein and gene expression changes that are characteristic for TLR4 signaling, reflected by upregulation of NFκB2 on the protein level. NFκB signaling was identified as a crucial pathway in DC maturation in response to NiSO4 as it is tightly connected to the expression of maturation markers like CD40, HLA-DR, CD86 and the secretion of pro-inflammatory cytokines like IL-8 and IL-6 (33). Furthermore, NFκB signaling is indicative for the activation of TLR4 by NiSO4. The central role of NFκB in mediating the response to NiSO4 in MoDCs was also reflected in the strong upregulation of proteins such as SAM and SH3 domain-containing protein (SASH) 1 and TRAF1 which are known to positively regulate NFκB activity (34, 35) and which were also significantly upregulated in our proteomic data set for NiSO4-exposed MoDCs. Downstream of NFκB, we identified increased gene expression for TNFα and could also show that NiSO4 triggered elevated secretion of this cytokine along with IL-8. Again, LPS induced more pronounced alterations, suggesting a more substantial capacity to activate TLR4 compared to NiSO4.
One of the most distinct differences between LPS- and NiSO4-treatment was the induction of the Nrf2-pathway after treatment with NiSO4. Nrf2 is an important transcription factor for cytoprotective genes. Under normal conditions, Nrf2 is located in the cytoplasm where it is associated with a protein complex including the kelch-like ECH-associated protein (KEAP) 1. KEAP1 continually promotes ubiquitination and proteasomal degradation of Nrf2 (36). Electrophilic and oxidative stress induces a conformational change in KEAP1 which suppresses Nrf2 ubiquitination and enables translocation of Nrf2 to the nucleus. In the nucleus, Nrf2 binds to antioxidant-responsive elements and induces transcription of target genes (37). Nrf2-dependent stress response was identified as a major player in the immunological reaction to allergens (38). Specifically, the high relevance of Nrf2 during skin sensitization was reflected in the upregulation of target genes like HMOX1 and NAD(P)H dehydrogenase [quinone] (NQO) 1 at the protein level in CD34-derived dendritic cells and THP-1 cells (39). A prior proteomic study of our lab used Nrf2 knockout mice for the identification of potential biomarkers for skin sensitization among them HMOX1 and PRDX1 (40). Previously, activation of Nrf2 due to treatment with NiCl2 was shown in monocytic THP-1 cells (41). Our findings also underline the importance of Nrf2 in response to NiSO4 since the Nrf2 stress response signaling was identified as highly activated pathway using IPA analysis. In this context, we were able to identify significantly increased gene expression levels for the Nrf2 target genes peroxiredoxin (PRDX) 1, SOD2, NQO1, glutathione S-transferase (GST) M1 and GSTO1 as well as elevated protein levels of SOD2 and HMOX1. Besides NiSO4, LPS is also able to induce oxidative stress in dendritic cells which is believed to support the maturation of the cells (42, 43). We identified SOD2 as strongly upregulated protein after treatment with LPS which was verified by quantitative RT-PCR. Proteomic upregulation of SOD2 after LPS-treatment was also reported by Hussaarts et al. (3). Thus, Nrf2-dependent proteins play a major role during cellular response to an allergen. However, biomarker candidates from this group of proteins have to be selected carefully since other substances like LPS that induce DC maturation also regulate Nrf2-dependent proteins.
The induction of TLR4 signaling pathways by binding of nickel undoubtedly contributed to the activation of the cells as proposed by Schmidt et al. (18). However, Vennegaard et al. (44) showed that sensitization to Ni2+ occurs independent of TLR4 in mice. MyD88-dependent and IL-1-related pathways mediated the immunological reaction to Ni2+ in their in vivo model. In our study with human MoDCs, we found significantly elevated secretion levels of IL-1β after treatment with NiSO4, which may be indicative for an involvement of IL-1-related pathways during sensitization to NiSO4. We also believe that the haptenation of nickel to other cellular proteins led to the induction of a distinct oxidative stress response which eventually resulted in cellular activation and the observed proteomic phenotype of the MoDCs. The haptenation mechanisms of metal allergens remain to date under-investigated. Yet, nickel was shown to bind to a broad range of cellular proteins, including many heat shock proteins and cytoskeletal proteins (45, 46). Binding of nickel to serum albumin was shown to bypass antigen-processing of antigen-presenting cells by a transfer of the Ni2+-ion to peptide-major histocompatibility complexes inducing subsequent T cell activation (45). Due to the modus operandi in this study, further nickel-interacting proteins could not be detected.
IPA results revealed the superpathway of cholesterol biosynthesis as strongly induced due to NiSO4- but not after LPS-treatment. NiSO4-treated MoDCs exhibited significantly reduced cellular cholesterol levels which were accompanied by upregulation of genes and proteins involved in the cholesterol biosynthesis. Cellular cholesterol homeostasis is a delicate equilibrium. Under cholesterol deficiency, sterol response element-binding proteins (SREBP) become activated and subsequently activate genes of the mevalonate pathway like HMGCR to fuel cholesterol accumulation (47). Changes in cholesterol levels can lead to fatal effects with major impacts on DCs role in immunity. Disrupted cholesterol homeostasis may affect DC differentiation and maturation, antigen presentation, migration, as well as priming of T cells (48). During DC maturation cholesterol highly supports the synthesis of membranes needed for cellular expansion. Especially the formation of lipid rafts in the cell membrane is sensitive to changed cholesterol levels. Since TLR or major histocompatibility complexes are located in these rafts, receptor-induced signaling like NFκB- or IFN-signaling is directly affected upon perturbed cholesterol levels (48–51). Excessive cholesterol biosynthesis may also be a cellular mechanism to restore and maintain cell membranes. Cholesterol decreases membrane fluidity and therefore stabilizes the latter (52).
Cholesterol is also known to play a pivotal role in cellular stress response and during hypoxia. Under hypoxic conditions, sterol levels were depleted in the yeast Saccharomyces pombe, which was counteracted by activation of Sre1 (the analog of SREBPs in eukaryotes) until normal levels of sterol synthesis were again reached after a few hours (53). In our experiment, the gene expression of SREBP and HMGCR was continuously upregulated in NiSO4-treated cells. Thus, potentially being a compensatory effect for the cellular cholesterol depletion induced by NiSO4. A recently published study on the lipid composition in maturated human MoDCs, revealed that mature MoDCs are stiffer than their immature progenitors. These findings were explained by an altered lipid class composition in mature MoDCs. Strikingly the performed lipidomic analysis also disclosed reduced cholesterolester levels in mature MoDCs (54), which supports our findings of cellular cholesterol depletion. However, the role and fate of cholesterol during DC maturation is to date not fully understood.
We suspect that diminished cellular cholesterol levels can be explained by the formation and secretion of extracellular vesicles. Extracellular vesicles were proven to play a pivotal role in allergy and immunity in general (55). Exosomes of dendritic cells may transport allergens and thereby activate T cells (56). Another example for the relevance of DC exosomes is their use as vaccine in cancer immunotherapy (57). Taken together, the impact of NiSO4 on the cellular fate of cholesterol is an exciting target for future research. Hence, we already conducted a subsequent proteomic experiment to unravel whether the observed changes in cholesterol biosynthesis are unique for NiSO4. Appling a stable isotope labeling with amino acids in cell culture (SILAC), we analyzed the effects of organic allergens, including the strong allergens p-benzoquinone and 2,4-dinitrochlorobenzene, on the proteome of THP-1 cells. THP-1 cells are validated for usage within the human Cell Line Activation Test to assess skin sensitizers (26). We were able to confirm the upregulation of pathways connected to the cholesterol biosynthesis after treatment of THP-1 cells with all contact sensitizers tested (unpublished data). These data support the evidence presented in our study in MoDCs and underline the need for further research in this field which may eventually lead to a better understanding of cellular mechanisms in the context of ACD.
Due to strict search criteria for the IPA pathway analysis, no metabolic pathways were identified as significantly regulated. However, as already described in the literature, phenotypic alterations and cellular reconstruction during DC maturation are supported by a metabolic reprogramming, i.e. cellular metabolism is shifted from oxidative phosphorylation toward glycolysis which fuels the cells with sufficient energy. The metabolic shift toward glycolysis is triggered by strong and weak DC activators likewise and is essential for DC migration (58). However, long-term dependency on glycolysis was only induced by potent DC activators and is achieved by HIF1α stabilization (59, 60). As reported before, LPS triggered a metabolic shift toward glycolysis by increasing the gene expression of HK2 (30). Although protein levels of HK2 were not significantly changed due to LPS, HK2 was one of the proteins with the most pronounced differential expressions after NiSO4-treatment. HK2 protein expression was significantly altered and 3.4-fold upregulated, respectively. Additionally, we identified another protein supporting the shift toward glycolysis: PFKFB3 was significantly upregulated after LPS- and NiSO4-treatment. PFKFB3 is a kinase producing fructose 2,6-bisphosphate which is an allosteric activator of the phosphofructokinase, a bottleneck enzyme in the glycolysis. PFKFB3 was reported to increase glycolytic activity in cells in the context of the Warburg effect (61) as well as after LPS stimulation of macrophages (60). As the PFKFB3 gene promotor possesses a binding site for HIF1α (62), it is also induced under hypoxic and hypoxia-like conditions, e.g. triggered by Co2+ (63).
The findings, as mentioned above, can be matched to the proteomic data generated from MoDCs treated with NiSO4. However, NiCl2 was reported to induce distinct hypoxia-like conditions via induction of HIF1α (64, 65). Accordingly, increased gene expression for glycolytic enzymes like HK2, LDHA and SLC2A1 was reported (66). These proteins were also significantly changed after treatment of MoDCs with NiSO4 in our study, and additionally, elevated protein levels of HIF1α were detected. MoDCs stimulated with NiSO4 were more sensitive to HIF1α-inhibition than cells stimulated with LPS. NiSO4 and cobalt are known to induce TLR4-dependent IL-8 production, which is defined as a key event for skin sensitization. However, both metals also elicit hypoxia. Asakawa et al. (67) showed that NiCl2 binds to heat shock protein 90β in THP-1 cells and thus increases the activity of HIF1α. Elevated HIF1α activity eventually resulted in elevated IL-8 expression. TREM1 protein expression and IL-8 secretion were both previously reported to be increased under hypoxic conditions (68). We could show that NiSO4-treated MoDCs also induced TREM1 signaling as well as IL-8 secretion. Additionally, Viemann et al. (65) described a central role of HIF1α in endothelia cells in response to nickel. Besides pro-inflammatory signaling by NFκB, HIF1α was identified as a central inducer of genes that act on cell survival and metabolism. Hypoxia and HIF1α were found to be elementary drivers during DC activation and thereby enhancing the immunological response of the latter. Precisely, hypoxia was shown to enhance pro-inflammatory signaling, cellular glucose metabolism as well as cell surface maker expression in mouse-derived DCs. This eventually resulted in an amplified ability to stimulate T cell proliferation (59). We could confirm the metabolic shift in NiSO4-treated cells along with the upregulation of important cell surface makers and the ability to stimulate lymphocyte proliferation. Hence, the induction of a pronounced hypoxia by NiSO4 contributed strongly to the immunological response of the MoDCs. However, more data is needed to allow distinct discrimination between TLR4-dependent and hypoxia-induced proteins in NiSO4-treated MoDCs. Furthermore, the pronounced Nrf2-mediated stress response may also favorably contribute to HIF1α-dependency in NiSO4-treated MoDCs since Nrf2 directly regulates HIF1α gene expression (69).
Conclusion
In the present work, we extensively studied the activation of MoDCs by mass spectrometry-based proteomics. We aimed to elucidate the cellular mode of action of NiSO4-induced MoDC maturation concerning nickel allergy by comparing MoDC activation induced by NiSO4 to the well-studied bacterial LPS. Overall, the results for LPS-treated MoDCs are in concordance with literature data, confirming that our technical approach detects DC activation as such. NiSO4-treated cells upregulated relevant activation markers, such as CD83 and CD86, and pathways that point toward signaling in immunology, like CD40 and TREM1 signaling. However, the immunological response triggered by NiSO4 is partly overshadowed by oxidative stress that is potentially caused by the metallic character of Ni2+. This implicates a subordinate role of TLR4-activation and -signaling in NiSO4-activated MoDCs for the chosen experimental settings. NiSO4-induced oxidative stress is likely the responsible event upstream of the upregulation of Nrf2-target genes, as detected at mRNA as well as at protein level. The metabolic shift observed for NiSO4-treated MoDCs resembles that of LPS-treated MoDCs. Nevertheless, prolongation of the upregulation of detected glycolytic enzymes, in connection with elevated HIF1α levels, suggest a hypoxia-like cellular state, which is remarkably different from LPS-induced effects. The link between cellular cholesterol depletion and activation of DCs triggered by NiSO4 remains to be elucidated by future studies.
Taken together, our study suggests immunostimulatory and cytotoxic effects of NiSO4 leading to DC activation, and possibly culminating in sensitization to nickel in vivo. Our results illuminate the phenotype of activated DCs during sensitization to an allergen and thereby enhance our understanding of nickel-induced molecular pathways.
Data Availability Statement
The dataset presented in this study can be found online in the PRIDE repository with the dataset identifier PXD022599 (70). A full list of all proteins including the protein names and accession numbers can be found in the article/Supplementary Material.
Ethics Statement
The studies involving human participants were reviewed and approved by Charité, Berlin Germany; EA4/071/13. Written informed consent for participation was not required for this study in accordance with the national legislation and the institutional requirements.
Author Contributions
TH and AH conceived and designed the experiments. TH performed the experimental work. Data analysis was done by TH, VD, and KSc. Figures were created by TH and KSc. KSi and TH conceived, conducted, and analyzed the mixed leukocyte reaction. MB provided conceptual input. The manuscript was written by TH, KSc, and AH with contributions from all co-authors. All authors contributed to the article and approved the submitted version.
Funding
The authors acknowledge financial support from their institutes, BfR and UFZ. The work was funded via a BfR-internal grant (SFP 1322-470), which is gratefully acknowledged.
Conflict of Interest
The authors declare that the research was conducted in the absence of any commercial or financial relationships that could be construed as a potential conflict of interest.
Supplementary Material
The Supplementary Material for this article can be found online at: https://www.frontiersin.org/articles/10.3389/fimmu.2021.644700/full#supplementary-material
Abbreviations
ACD, allergic contact dermatitis; ACN, acetonitrile; ALDOA, aldolase A; APC, allophycocyanin; BV421, brilliant violet 421; CD, cluster of differentiation; CFSE, carboxyfluorescein succinimidyl ester; CYP51A1, lanosterol 14α-demethylase; DC, dendritic cell; EIF, eukaryotic initiation factor; FA, formic acid; FC, fold change; FITC, fluorescein isothiocyanate; GLUT, glucose transporter type; GM-CSF, granulocyte-macrophage colony-stimulating factor; GST, glutathione S-transferase; HEPES, 4-(2-hydroxyethyl)-1-piperazineethanesulfonic acid; HIF, hypoxia-inducible factor; HK, hexokinase; HMGCS1, hydroxymethylglutaryl-CoA synthase; HMGCR, 3-hydroxy-3-methyl-glutaryl-coenzyme A reductase; HMOX, heme oxygenase; HPRT, hypoxanthineguanine phosphoribosyltransferase; HSA, human serum albumin; IL, interleukin; IPA, ingenuity pathway analysis; KEAP, kelch-like ECH-associated protein; LDHA, lactate dehydrogenase; LFQ, label-free quantification; LPS, lipopolysaccharide; MD-2, myeloid differentiation factor 2; MLR, mixed leukocyte reaction; MoDC, monocyte-derived dendritic cell; NEAA, non-essential amino acids; NFκB, nuclear factor κB; NQO, NAD(P)H dehydrogenase [quinone]; Nrf2, nuclear factor erythroid 2-related factor 2; OECD, Organization for Economic Co-operation and Development; PBMC, peripheral blood mononuclear cell; PBS, phosphate buffered saline; PE, phycoerythrin; PFKFB, 6-phosphofructo-2-kinase/fructose-2,6-biphosphatase; PRDX, peroxiredoxin; q(RT)-PCR, quantitative real time polymerase chain reaction; SD, standard deviation; SLC, solute carrier; SOD, superoxide dismutase; SREBP, sterol regulatory element-binding protein; TLR, toll-like receptor; TNBS, trinitrobenzenesulfonic acid; TNF, tumor necrosis factor; TNP, trinitrophenyl-; TRAF, TNF receptor-associated factor; TREM, triggering receptor expressed on myeloid cells.
References
1. Everts B, Amiel E, Huang SC, Smith AM, Chang CH, Lam WY, et al. TLR-driven early glycolytic reprogramming via the kinases TBK1-IKKvarepsilon supports the anabolic demands of dendritic cell activation. Nat Immunol. (2014) 15:323–32. doi: 10.1038/ni.2833
2. Everts B, Pearce EJ. Metabolic control of dendritic cell activation and function: recent advances and clinical implications. Front Immunol. (2014) 5:203. doi: 10.3389/fimmu.2014.00203
3. Hussaarts L, Kaisar MMM, Guler AT, Dalebout H, Everts B, Deelder AM, et al. Human dendritic cells with Th2-polarizing capacity: analysis using label-free quantitative proteomics. Int Arch Allergy Immunol. (2017) 174:170–82. doi: 10.1159/000479512
4. Dudek AM, Martin S, Garg AD, Agostinis P. Immature, semi-mature, and fully mature dendritic cells: toward a DC-cancer cells interface that augments anticancer immunity. Front Immunol. (2013) 4:438. doi: 10.3389/fimmu.2013.00438
5. Krawczyk CM, Holowka T, Sun J, Blagih J, Amiel E, DeBerardinis RJ, et al. Toll-like receptor-induced changes in glycolytic metabolism regulate dendritic cell activation. Blood. (2010) 115:4742–9. doi: 10.1182/blood-2009-10-249540
6. Alinaghi F, Bennike NH, Egeberg A, Thyssen JP, Johansen JD. Prevalence of contact allergy in the general population: a systematic review and meta-analysis. Contact Dermatitis. (2019) 80:77–85. doi: 10.1111/cod.13119
7. Kimber I, Basketter DA, Gerberick GF, Dearman RJ. Allergic contact dermatitis. Int Immunopharmacol. (2002) 2:201–11. doi: 10.1016/S1567-5769(01)00173-4
8. OECD. The Adverse Outcome Pathway for Skin Sensitisation Initiated by Covalent Binding to Proteins. Paris (2014).
9. Hoper T, Mussotter F, Haase A, Luch A, Tralau T. Application of proteomics in the elucidation of chemical-mediated allergic contact dermatitis. Toxicol Res. (2017) 6:595–610. doi: 10.1039/C7TX00058H
10. Angenieux C, Fricker D, Strub J-M, Luche S, Bausinger H, Cazenave J-P, et al. Gene induction during differentiation of human monocytes into dendritic cells: an integrated study at the RNA and protein levels. Funct Integr Genomics. (2001) 1:323–9. doi: 10.1007/s101420100037
11. Watarai H, Hinohara A, Nagafune J, Nakayama T, Taniguchi M, Yamaguchi V. Plasma membrane-focused proteomics: dramatic changes in surface expression during the maturation of human dendritic cells. Proteomics. (2005) 5:4001–11. doi: 10.1002/pmic.200401258
12. Buschow SI, Lasonder E, van Deutekom HWM, Oud MM, Beltrame L, Huynen MA, et al. Dominant processes during human dendritic cell maturation revealed by integration of proteome and transcriptome at the pathway level. J Proteome Res. (2010) 9:1727–37. doi: 10.1021/pr9008546
13. Arya S, Wiatrek-Moumoulidis D, Synowsky SA, Shirran SL, Botting CH, Powis SJ, et al. Quantitative proteomic changes in LPS-activated monocyte-derived dendritic cells: a SWATH-MS study. Sci Rep. (2019) 9:4343. doi: 10.1038/s41598-019-40773-6
14. Ahlstrom MG, Thyssen JP, Menne T, Johansen JD. Prevalence of nickel allergy in Europe following the EU Nickel Directive - a review. Contact Dermatitis. (2017) 77:193–200. doi: 10.1111/cod.12846
15. Park BS, Song DH, Kim HM, Choi BS, Lee H, Lee JO. The structural basis of lipopolysaccharide recognition by the TLR4-MD-2 complex. Nature. (2009) 458:1191–5. doi: 10.1038/nature07830
16. Kagan JC, Medzhitov R. Phosphoinositide-mediated adaptor recruitment controls Toll-like receptor signaling. Cell. (2006) 125:943–55. doi: 10.1016/j.cell.2006.03.047
17. Kagan JC, Su T, Horng T, Chow A, Akira S, Medzhitov R. TRAM couples endocytosis of Toll-like receptor 4 to the induction of interferon-beta. Nat Immunol. (2008) 9:361–8. doi: 10.1038/ni1569
18. Schmidt M, Raghavan B, Muller V, Vogl T, Fejer G, Tchaptchet S, et al. Crucial role for human Toll-like receptor 4 in the development of contact allergy to nickel. Nat Immunol. (2010) 11:814–9. doi: 10.1038/ni.1919
19. Raghavan B, Martin SF, Esser PR, Goebeler M, Schmidt M. Metal allergens nickel and cobalt facilitate TLR4 homodimerization independently of MD2. EMBO Rep. (2012) 13:1109–15. doi: 10.1038/embor.2012.155
20. Dietz L, Esser PR, Schmucker SS, Goette I, Richter A, Schnolzer M, et al. Tracking human contact allergens: from mass spectrometric identification of peptide-bound reactive small chemicals to chemical-specific naive human T-cell priming. Toxicol Sci. (2010) 117:336–47. doi: 10.1093/toxsci/kfq209
21. Livak KJ, Schmittgen TD. Analysis of relative gene expression data using real-time quantitative PCR and the 2–ΔΔCT method. Methods. (2001) 25:402–8. doi: 10.1006/meth.2001.1262
22. Folch J, Lees M, Sloane Stanley GH. A simple method for the isolation and purification of total lipides from animal tissues. J Biol Chem. (1957) 226:497–509. doi: 10.1016/S0021-9258(18)64849-5
23. Wang Z, Karkossa I, Großkopf H, Rolle-Kampczyk U, Hackermüller J, von Bergen M, et al. Comparison of quantitation methods in proteomics to define relevant toxicological information on AhR activation of HepG2 cells by BaP. Toxicology. (2020) 448:152652. doi: 10.1016/j.tox.2020.152652
24. Cox J, Hein MY, Luber CA, Paron I, Nagaraj N, Mann M. Accurate proteome-wide label-free quantification by delayed normalization and maximal peptide ratio extraction, termed MaxLFQ. Mol Cell Proteomics. (2014) 13:2513–26. doi: 10.1074/mcp.M113.031591
25. Zhang X, Smits AH, van Tilburg GB, Ovaa H, Huber W, Vermeulen M. Proteome-wide identification of ubiquitin interactions using UbIA-MS. Nat Protoc. (2018) 13:530–50. doi: 10.1038/nprot.2017.147
27. Gil-Torregrosa BC, Lennon-Duménil AM, Kessler B, Guermonprez P, Ploegh HL, Fruci D, et al. Control of cross-presentation during dendritic cell maturation. Eur J Immunol. (2004) 34:398–407. doi: 10.1002/eji.200324508
28. Alloatti A, Kotsias F, Magalhaes JG, Amigorena S. Dendritic cell maturation and cross-presentation: timing matters! Immunol Rev. (2016) 272:97–108. doi: 10.1111/imr.12432
29. Kim MK, Kim J. Properties of immature and mature dendritic cells: phenotype, morphology, phagocytosis, and migration. RSC Adv. (2019) 9:11230–8. doi: 10.1039/C9RA00818G
30. Perrin-Cocon L, Aublin-Gex A, Diaz O, Ramiere C, Peri F, Andre P, et al. Toll-like receptor 4-induced glycolytic burst in human monocyte-derived dendritic cells results from p38-dependent stabilization of HIF-1alpha and increased hexokinase II expression. J Immunol. (2018) 201:1510–21. doi: 10.4049/jimmunol.1701522
31. Lee P, Chandel NS, Simon MC. Cellular adaptation to hypoxia through hypoxia inducible factors and beyond. Nat Rev Mol Cell Biol. (2020) 21:268–83. doi: 10.1038/s41580-020-0227-y
32. Strasser L, Dang HH, Schwarz H, Asam C, Ferreira F, Horejs-Hoeck J, et al. Unbiased quantitative proteomics reveals a crucial role of the allergen context for the activation of human dendritic cells. Sci Rep. (2017) 7:16638. doi: 10.1038/s41598-017-16726-2
33. Ade N, Antonios D, Kerdine-Romer S, Boisleve F, Rousset F, Pallardy M. NF-kappaB plays a major role in the maturation of human dendritic cells induced by NiSO(4) but not by DNCB. Toxicol Sci. (2007) 99:488–501. doi: 10.1093/toxsci/kfm178
34. Lavorgna A, De Filippi R, Formisano S, Leonardi A. TNF receptor-associated factor 1 is a positive regulator of the NF-kappaB alternative pathway. Mol Immunol. (2009) 46:3278–82. doi: 10.1016/j.molimm.2009.07.029
35. Dauphinee SM, Clayton A, Hussainkhel A, Yang C, Park YJ, Fuller ME, et al. SASH1 is a scaffold molecule in endothelial TLR4 signaling. J Immunol. (2013) 191:892–901. doi: 10.4049/jimmunol.1200583
36. Itoh K, Wakabayashi N, Katoh Y, Ishii T, Igarashi K, Engel JD, et al. Keap1 represses nuclear activation of antioxidant responsive elements by Nrf2 through binding to the amino-terminal Neh2 domain. Genes Dev. (1999) 13:76–86. doi: 10.1101/gad.13.1.76
37. Ma Q. Role of Nrf2 in oxidative stress and toxicity. Ann Rev Pharmacol Toxicol. (2013) 53:401–26. doi: 10.1146/annurev-pharmtox-011112-140320
38. Helou DG, Martin SF, Pallardy M, Chollet-Martin S, Kerdine-Römer S. Nrf2 involvement in chemical-induced skin innate immunity. Front Immunol. (2019) 10:1004. doi: 10.3389/fimmu.2019.01004
39. Ade N, Leon F, Pallardy M, Peiffer JL, Kerdine-Romer S, Tissier MH, et al. HMOX1 and NQO1 genes are upregulated in response to contact sensitizers in dendritic cells and THP-1 cell line: Role of the Keap1/Nrf2 pathway. Toxicol Sci. (2009) 107:451–60. doi: 10.1093/toxsci/kfn243
40. Mussotter F, Tomm JM, El Ali Z, Pallardy M, Kerdine-Romer S, Gotz M, et al. Proteomics analysis of dendritic cell activation by contact allergens reveals possible biomarkers regulated by Nrf2. Toxicol Appl Pharmacol. (2016) 313:170–9. doi: 10.1016/j.taap.2016.11.001
41. Lewis JB, Messer RL, McCloud VV, Lockwood PE, Hsu SD, Wataha JC. Ni(II) activates the Nrf2 signaling pathway in human monocytic cells. Biomaterials. (2006) 27:5348–56. doi: 10.1016/j.biomaterials.2006.06.007
42. Matsue H, Edelbaum D, Shalhevet D, Mizumoto N, Yang C, Mummert ME, et al. Generation and function of reactive oxygen species in dendritic cells during antigen presentation. J Immunol. (2003) 171:3010–8. doi: 10.4049/jimmunol.171.6.3010
43. Yamada H, Arai T, Endo N, Yamashita K, Fukuda K, Sasada M, et al. LPS-induced ROS generation and changes in glutathione level and their relation to the maturation of human monocyte-derived dendritic cells. Life Sci. (2006) 78:926–33. doi: 10.1016/j.lfs.2005.05.106
44. Vennegaard MT, Dyring-Andersen B, Skov L, Nielsen MM, Schmidt JD, Bzorek M, et al. Epicutaneous exposure to nickel induces nickel allergy in mice via a MyD88-dependent and interleukin-1-dependent pathway. Contact Dermatitis. (2014) 71:224–32. doi: 10.1111/cod.12270
45. Thierse HJ, Moulon C, Allespach Y, Zimmermann B, Doetze A, Kuppig S, et al. Metal-protein complex-mediated transport and delivery of Ni2+ to TCR/MHC contact sites in nickel-specific human T cell activation. J Immunol. (2004) 172:1926–34. doi: 10.4049/jimmunol.172.3.1926
46. Heiss K, Junkes C, Guerreiro N, Swamy M, Camacho-Carvajal MM, Schamel WWA, et al. Subproteomic analysis of metal-interacting proteins in human B cells. Proteomics. (2005) 5:3614–22. doi: 10.1002/pmic.200401215
47. Luo J, Yang H, Song B-L. Mechanisms and regulation of cholesterol homeostasis. Nat Rev Mol Cell Biol. (2020) 21:225–45. doi: 10.1038/s41580-019-0190-7
48. Wang SH, Yuan SG, Peng DQ, Zhao SP. HDL and ApoA-I inhibit antigen presentation-mediated T cell activation by disrupting lipid rafts in antigen presenting cells. Atherosclerosis. (2012) 225:105–14. doi: 10.1016/j.atherosclerosis.2012.07.029
49. Hiltbold EM, Poloso NJ, Roche PA. MHC class II-peptide complexes and APC lipid rafts accumulate at the immunological synapse. J Immunol. (2003) 170:1329–38. doi: 10.4049/jimmunol.170.3.1329
50. Cheng AM, Handa P, Tateya S, Schwartz J, Tang C, Mitra P, et al. Apolipoprotein A-I attenuates palmitate-mediated NF-kappaB activation by reducing Toll-like receptor-4 recruitment into lipid rafts. PLoS ONE. (2012) 7:e33917. doi: 10.1371/journal.pone.0033917
51. York AG, Williams KJ, Argus JP, Zhou QD, Brar G, Vergnes L, et al. Limiting cholesterol biosynthetic flux spontaneously engages type I IFN signaling. Cell. (2015) 163:1716–29. doi: 10.1016/j.cell.2015.11.045
52. Simons K, Ikonen E. How cells handle cholesterol. Science. (2000) 290:1721–6. doi: 10.1126/science.290.5497.1721
53. Hughes AL, Todd BL, Espenshade PJ. SREBP pathway responds to sterols and functions as an oxygen sensor in fission yeast. Cell. (2005) 120:831–42. doi: 10.1016/j.cell.2005.01.012
54. Lühr JJ, Alex N, Amon L, Kräter M, Kubánková M, Sezgin E, et al. Maturation of monocyte-derived DCs leads to increased cellular stiffness, higher membrane fluidity, and changed lipid composition. Front Immunol. (2020) 11:590121. doi: 10.3389/fimmu.2020.590121
55. Nazimek K, Bryniarski K, Askenase PW. Functions of exosomes and microbial extracellular vesicles in allergy and contact and delayed-type hypersensitivity. Int Arch Allergy Immunol. (2016) 171:1–26. doi: 10.1159/000449249
56. Vallhov H, Gutzeit C, Hultenby K, Valenta R, Gronlund H, Scheynius A. Dendritic cell-derived exosomes carry the major cat allergen Fel d 1 and induce an allergic immune response. Allergy. (2015) 70:1651–5. doi: 10.1111/all.12701
57. Pitt JM, Andre F, Amigorena S, Soria JC, Eggermont A, Kroemer G, et al. Dendritic cell-derived exosomes for cancer therapy. J Clin Invest. (2016) 126:1224–32. doi: 10.1172/JCI81137
58. Guak H, Al Habyan S, Ma EH, Aldossary H, Al-Masri M, Won SY, et al. Glycolytic metabolism is essential for CCR7 oligomerization and dendritic cell migration. Nat Commun. (2018) 9:2463. doi: 10.1038/s41467-018-04804-6
59. Jantsch J, Chakravortty D, Turza N, Prechtel AT, Buchholz B, Gerlach RG, et al. Hypoxia and hypoxia-inducible factor-1 alpha modulate lipopolysaccharide-induced dendritic cell activation and function. J Immunol. (2008) 180:4697–705. doi: 10.4049/jimmunol.180.7.4697
60. Ruiz-García A, Monsalve E, Novellasdemunt L, Navarro-Sabaté A, Manzano A, Rivero S, et al. Cooperation of adenosine with macrophage Toll-4 receptor agonists leads to increased glycolytic flux through the enhanced expression of PFKFB3 gene. J Biol Chem. (2011) 286:19247–58. doi: 10.1074/jbc.M110.190298
61. Shi L, Pan H, Liu Z, Xie J, Han W. Roles of PFKFB3 in cancer. Sig Transduct Target Ther. (2017) 2:17044. doi: 10.1038/sigtrans.2017.44
62. Obach M, Navarro-Sabate A, Caro J, Kong X, Duran J, Gomez M, et al. 6-Phosphofructo-2-kinase. (pfkfb3) gene promoter contains hypoxia-inducible factor-1 binding sites necessary for transactivation in response to hypoxia. J Biol Chem. (2004) 279:53562–70. doi: 10.1074/jbc.M406096200
63. Minchenko A, Leshchinsky I, Opentanova I, Sang N, Srinivas V, Armstead V, et al. Hypoxia-inducible factor-1-mediated expression of the 6-phosphofructo-2-kinase/fructose-2,6-bisphosphatase-3 (PFKFB3) gene. Its possible role in the Warburg effect. J Biol Chem. (2002) 277:6183–7. doi: 10.1074/jbc.M110978200
64. Salnikow K, Blagosklonny MV, Ryan H, Johnson R, Costa M. Carcinogenic nickel induces genes involved with hypoxic stress. Cancer Res. (2000) 60:38–41. Available online at: https://cancerres.aacrjournals.org/content/60/1/38.full-text.pdf
65. Viemann D, Schmidt M, Tenbrock K, Schmid S, Muller V, Klimmek K, et al. The contact allergen nickel triggers a unique inflammatory and proangiogenic gene expression pattern via activation of NF-kappaB and hypoxia-inducible factor-1alpha. J Immunol. (2007) 178:3198–207. doi: 10.4049/jimmunol.178.5.3198
66. Salnikow K, Davidson T, Costa M. The role of hypoxia-inducible signaling pathway in nickel carcinogenesis. Environ Health Perspect. (2002) 110(Suppl. 5):831–4. doi: 10.1289/ehp.02110s5831
67. Asakawa S, Onodera R, Kasai K, Kishimoto Y, Sato T, Segawa R, et al. Nickel ions bind to HSP90β and enhance HIF-1α-mediated IL-8 expression. Toxicology. (2018) 395:45–53. doi: 10.1016/j.tox.2018.01.006
68. Mishra KP, Jain S, Ganju L, Singh SB. Hypoxic stress induced TREM-1 and inflammatory chemokines in human peripheral blood mononuclear cells. Indian J Clin Biochem. (2014) 29:133–8. doi: 10.1007/s12291-013-0345-9
69. Lacher SE, Levings DC, Freeman S, Slattery M. Identification of a functional antioxidant response element at the HIF1A locus. Redox Biol. (2018) 19:401–11. doi: 10.1016/j.redox.2018.08.014
Keywords: monocyte-derived dendritic cells, allergic contact dermatitis, proteomics, nickel, LPS
Citation: Höper T, Siewert K, Dumit VI, von Bergen M, Schubert K and Haase A (2021) The Contact Allergen NiSO4 Triggers a Distinct Molecular Response in Primary Human Dendritic Cells Compared to Bacterial LPS. Front. Immunol. 12:644700. doi: 10.3389/fimmu.2021.644700
Received: 22 December 2020; Accepted: 19 February 2021;
Published: 11 March 2021.
Edited by:
Alexandre Corthay, Oslo University Hospital, NorwayReviewed by:
Saadia Kerdine-Römer, Université Paris-Sud, FranceRami Bechara, University of Pittsburgh, United States
Fatima Ferreira, University of Salzburg, Austria
Marc Pallardy, Université Paris-Sud, France
Copyright © 2021 Höper, Siewert, Dumit, von Bergen, Schubert and Haase. This is an open-access article distributed under the terms of the Creative Commons Attribution License (CC BY). The use, distribution or reproduction in other forums is permitted, provided the original author(s) and the copyright owner(s) are credited and that the original publication in this journal is cited, in accordance with accepted academic practice. No use, distribution or reproduction is permitted which does not comply with these terms.
*Correspondence: Andrea Haase, YW5kcmVhLmhhYXNlQGJmci5idW5kLmRl; Kristin Schubert, a3Jpc3Rpbi5zY2h1YmVydEB1ZnouZGU=
†These authors have contributed equally to this work