 Shanqiang Qu
 Jin Liu
 Huafu Wang
- 1Department of Neurosurgery, Nanfang Hospital, Southern Medical University, Guangzhou, China
- 2Department of Neurosurgery, Lishui People’s Hospital (The Sixth Affiliated Hospital of Wenzhou Medical University), Lishui, China
- 3Department of Clinical Pharmacy, Lishui People’s Hospital (The Sixth Affiliated Hospital of Wenzhou Medical University), Lishui, China
Background: Previous research indicated that the tumor cells and microenvironment interactions are critical for the immunotherapeutic response. However, predicting the clinical response to immunotherapy remains a dilemma for clinicians. Hence, this study aimed to investigate the associations between EVA1B expression and prognosis and tumor-infiltrating immune cells in glioma.
Methods: Firstly, we detected the EVA1B expression in glioma tissues through biological databases. The chi-squared test, Kaplan-Meier, and univariate and multivariate Cox regression analyses were used to analyze the clinical significance of EVA1B expression. The correlation between EVA1B expression and levels of tumor-infiltrating immune cells in glioma tissues was investigated. Receiver operating characteristic (ROC) analysis was performed to compare the predictive power between EVA1B and other commonly immune-related markers.
Results: In the CGGA cohort of 325 glioma patients, we found that EVA1B was upregulated in glioma, and increased with tumor grade. High EVA1B expression was prominently associated with unfavorable clinicopathological features, and poorer survival of patients, which were further confirmed by TCGA (n=609) and GEO (n=74) cohorts. Furthermore, multivariate analysis indicated that EVA1B is an independent prognostic biomarker for glioma. Importantly, EVA1B overexpression was associated with a higher infiltration level of CD4+ T cells, CD8+ T cells, B cells, macrophages, and neutrophils in glioma. ROC curves showed that, compared with PD-L1, CTLA-4, and Siglec15, EVA1B presented a higher area under the curve (AUC) value (AUC=0.824) for predicting high immune infiltration levels in glioma.
Conclusions: We found that EVA1B was upregulated and could act as a poor prognostic biomarker in glioma. Importantly, EVA1B overexpression was associated with the immune infiltration levels of immune cells including B cells, CD4+ T cells, CD8+ T cells, macrophages, and neutrophils, and strongly with the overall immune infiltration levels of glioma. These findings suggested that EVA1B might be a potential biomarker for evaluating prognosis and immune infiltration in glioma.
Introduction
Glioma is one of the brain malignancies with the highest prevalence, and the incidence of glioma is on the increase worldwide (1, 2). Despite the variety of modern therapies against glioblastoma, it is still a deadly disease with an extremely poor prognosis. The median overall survival (OS) of glioblastoma (GBM) patients is less than two years (3). Most patients have a few months of survival if they are left untreated (4). Therefore, it is of great significance to indicate how to develop further effective therapeutic strategies to improve the OS of glioma patients.
In recent years, immunotherapy has increasingly attracted scholars’ attention in the field of tumor therapy worldwide (5). Since January 2015, cancer immunotherapy has made significant advances (6). The programmed cell death protein 1 (PD-1) blockade is effective in the treatment of Hodgkin’s lymphoma (HL) and raises hopes that it may change the treatment pattern of the disease (7). Immunotherapy, such as cytotoxic T lymphocyte associated antigen 4 (CTLA4), programmed death-1 (PD-1), and programmed death ligand-1 (PD-L1) inhibitors, showed promising antitumor effects in malignant melanoma (8). However, current immunotherapies, such as anti-CTLA4, anti-PD-1, and anti-PD-L1, showed poor clinical efficacy in GBM (9). The reason for the ineffectiveness of the treatment is very complicated, which may be related to the lack of biomarkers for guiding individualized immune targets (9). Increasing studies have also found that tumor-infiltrating lymphocytes, such as tumor associated macrophages (TAMs) and tumor-infiltrating neutrophils (TINs), affect the prognosis and efficacy of chemotherapy and immunotherapy (10). Thus, there is an urgent need for the elucidation of the immunophenotypes of tumor-immune interaction and identification of novel immune-related biomarkers and therapeutic targets in glioma.
In humans, the EVA1 family includes three main groups: EVA1A, EVA1B, and EVA1C. Previous studies have revealed that EVA1A, an endoplasmic reticulum-related protein were involved in regulating autophagy and apoptosis-related mechanisms in many cancers (11, 12). Additionally, Bang-Yi Lin et al. found that EVA1A promotes papillary thyroid cancer progression and epithelial-mesenchymal transition via upregulating immune-related signaling pathways (11). Hippo signaling pathway. MST1/2 is the core kinases of the classical Hippo signaling pathway in mammals (13), which also plays a key role in the immune microenvironment by regulating the adhesion and trafficking of immune cells (14). A paralogous gene of the EVA1A gene is EVA1B, which both belong to the EVA1 family. EVA1B has high sequence similarity with the EVA1A gene. We also found that the EVA1B protein has the same domain as the EVA1A protein using the GenesLikeMe database. However, what role EVA1B plays in tumors has not yet been reported, especially its correlation with immune infiltration.
Consequently, this study was conducted to comprehensively identify EVA1B expression levels in glioma, and its correlation with malignant features and the prognosis of glioma patients. Moreover, we also investigated the correlation of EVA1B with infiltration levels of different immune cells and further assessed the predictive performance of EVA1B for high infiltration levels of glioma.
Materials and Methods
Gene Expression Profiles
The mRNA expression profiles of EVA1B were obtained from the GEO (https://www.ncbi.nlm.nih.gov/geo/) and TCGA database (http://cancergenome.nih.gov/). Moreover, a pan-cancer analysis of EVA1B was conducted using the Oncomine (http://www.oncomine.org) and the online tool TIMER (https://cistrome.shinyapps.io/timer/). Additionally, the localization of EVA1B protein was analyzed by immunofluorescence images from the Human Protein Atlas (HPA) database (https://www.proteinatlas.org/).
Patients
The included glioma patients were retrospectively collected from the CGGA database (http://cgga.org.cn/, Dataset ID: mRNAseq_325) and acted as a CGGA cohort. A total of 325 glioma patients were analyzed, and general clinical data and RNA-sequencing data were retrieved from the CGGA database. Among them, the mean age of included patients was 42.94 years (age range: 8-79 years). The details of patients’ characteristics are summarized in Supplementary Table 1. Ethical approval was obtained through the Ethics Committee of Lishui People’s Hospital, written informed consent was waived by the ethics committee because all data comes from public databases.
Validation of External Datasets (TCGA and GEO Databases)
To validate the prognostic value of EVA1B in glioma, two independent datasets from TCGA and GEO databases were used to validate the TCGA (n=609) and GEO (n=74) cohorts. In the TCGA cohort, 609 glioma patients (mean age=47.3 years, range: 14-89 years) were included. The details of patients’ characteristics are summarized in Supplementary Table 1. In the GEO cohort, 74 glioma patients (age range, 18-82) were included, and 32 (43.2%) of them were male and 42 (56.8%) were female. The correlation between EVA1B expression and prognosis of patients was analyzed by the comprehensive platform PrognoScan website (http://www.prognoscan.org/).
Biological Functions of EVA1B Participation in Glioma
First of all, the top 500 genes most co-expressed with EVA1B were extracted from the LinkedOmics database (http://www.linkedomics.org) (15). Function annotations were conducted to identify the biological processes potentially involved, cellular components, molecular function, and signaling pathway using DAVID 6.8 (https://david.ncifcrf.gov/) (16). To identify the potential interacting proteins, a functional protein network was built by GeneMANIA software (http://www.genemania.org/) (17).
Systematic Analysis of Immune Infiltration
To comprehensively investigate the associations between EVA1B and immune cells and immune molecules, we used the TIMER and EPIC algorithm to estimate the abundance of six immune infiltrates including B cells, CD4+ T cells, CD8+ T cells, Neutrophils, Macrophages, and Dendritic cells (DCs) (18).
Statistical Analysis
In this study, statistical analysis was performed using SPSS (Version 23.0; IBM), GraphPad (version 6.0), and R software (version 3.6.1). Chi-square test was used to calculate categorical variables. For continuous variables, when continuous variables follow the normal distribution, an independent Student’s t-test was conducted. Otherwise, a Mann-Whitney test was conducted. Spearman rank tests were also performed for correlation analysis. Kaplan-Meier analysis was performed to compare the OS of patients. Univariate and multivariate analyses were used to explore the prognostic factor for glioma patients. A time-dependent ROC curve was performed to evaluate prediction power. All P-value <0.05 was considered statistically significant (*P<0.05, **P<0.01, ***P<0.001, ****P<0.0001).
Results
Expression of EVA1B in Various Tumor Types
Firstly, we compared the differential mRNA level of EVA1B between the normal brain tissue and glioma tissues from the GEO and TCGA database. Compared with normal tissues, EVA1B mRNA expression was remarkably upregulated in gliomas based on GSE50161 (normal: 13, glioma: 49, Figure 1A) and GSE4290 (normal: 23, WHOII: 45, WHOIII: 31, WHOIV: 77, Figure 1B), and the EVA1B expression level increased with tumor grade. Similar results were obtained by analyzing TCGA sequencing data of glioma tissues (normal: 5, GBM: 156, Figure 1C). To gain insight into the subcellular localization of EVA1B protein, we obtained the immunofluorescence images of EVA1B in the U251 cell line from the HPA database, which contains high-resolution, multi-color immunofluorescence images of cells that detail the subcellular distribution pattern of proteins. Immunofluorescence analysis showed that EVA1B protein mainly localized to cytoplasm and membrane (Figure 1D). In total, the EVA1B expression levels in glioma were significantly overexpressed and were increased with tumor grade.
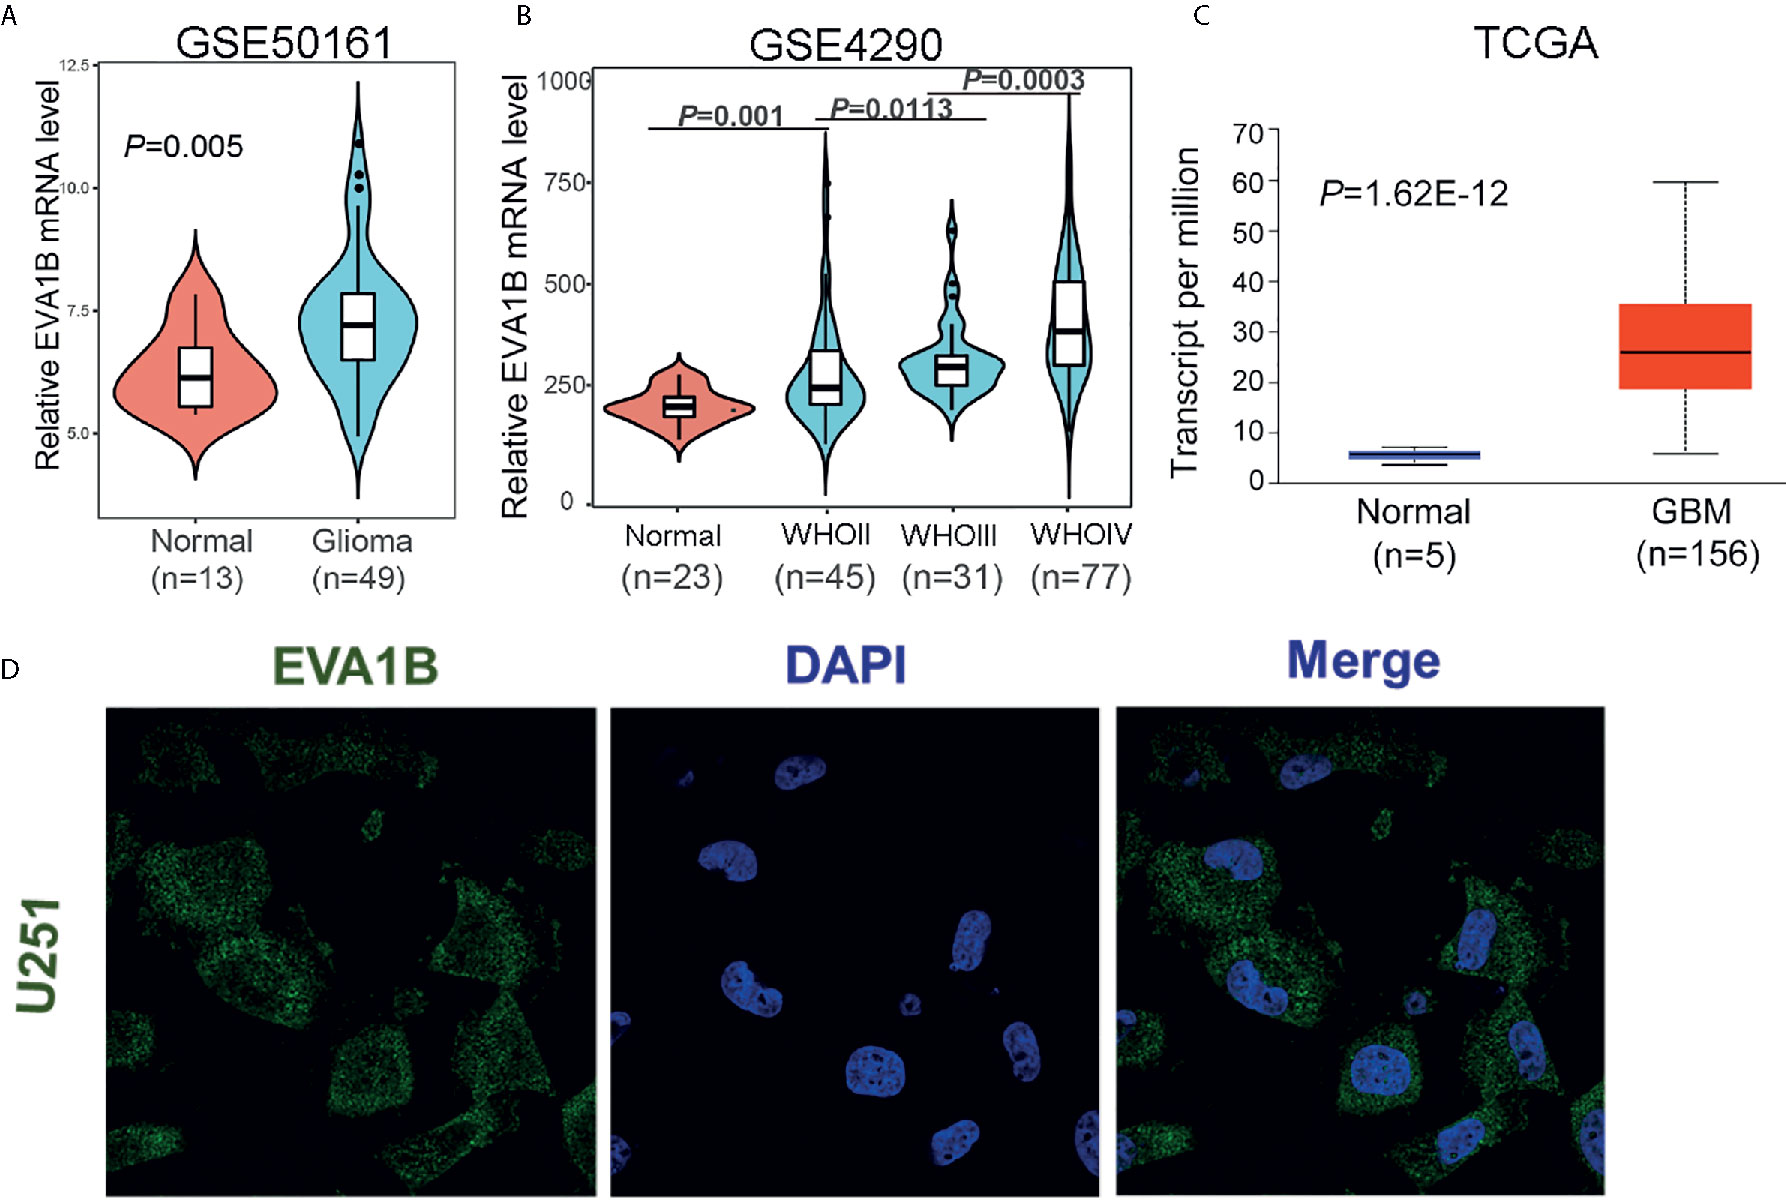
Figure 1 The expression of EVA1B is highly expressed in glioma compared to the normal brain tissues. (A–C) The EVA1B expression is significantly regulated in glioma in the GSE50161, GSE4290, and TCGA, and increases with tumor grade. (D) The EVA1B protein is predominantly localized in the cytoplasm and cellular membrane of U251 (images obtained from the Human Protein Atlas).
We also explored the EVA1B expression level in pan-cancer. As expected, compared with normal tissue, the EVA1B expression was also upregulated in breast cancer, colorectal cancer, lymphoma, melanoma, and sarcoma based on the Oncomine database (Supplementary Figure 1A). To confirm these findings, we further analyzed the TCGA data of tumors and obtained similar results (Supplementary Figure 2B).
The Association Between EVA1B Expression and the Clinicopathological Features of Glioma Patients
In the above, we reported that EVA1B expression was positively related to tumor grade. To further explore EVA1B overexpression and malignant behavior of glioma, 325 patients with glioma were obtained from the CGGA database. First, we compared the differential mRNA level of EVA1B in different subgroups stratified by WHO grade, IDH mutation, 1p/19q codeletion, age, recurrence, and sex. As shown in Figures 2A–F, EVA1B expression was significant different between subgroups stratified by WHO grade (P<0.0001, P<0.0001, respectively, Figure 2A), IDH mutation (P<0.0001, Figure 2B), 1p/19q codeletion (P<0.0001, Figure 3C), age (P<0.0001, Figure 3D), but not in subgroups stratified by recurrence (P=0.053, Figure 2E), and sex (P=0.929, Figure 2F).
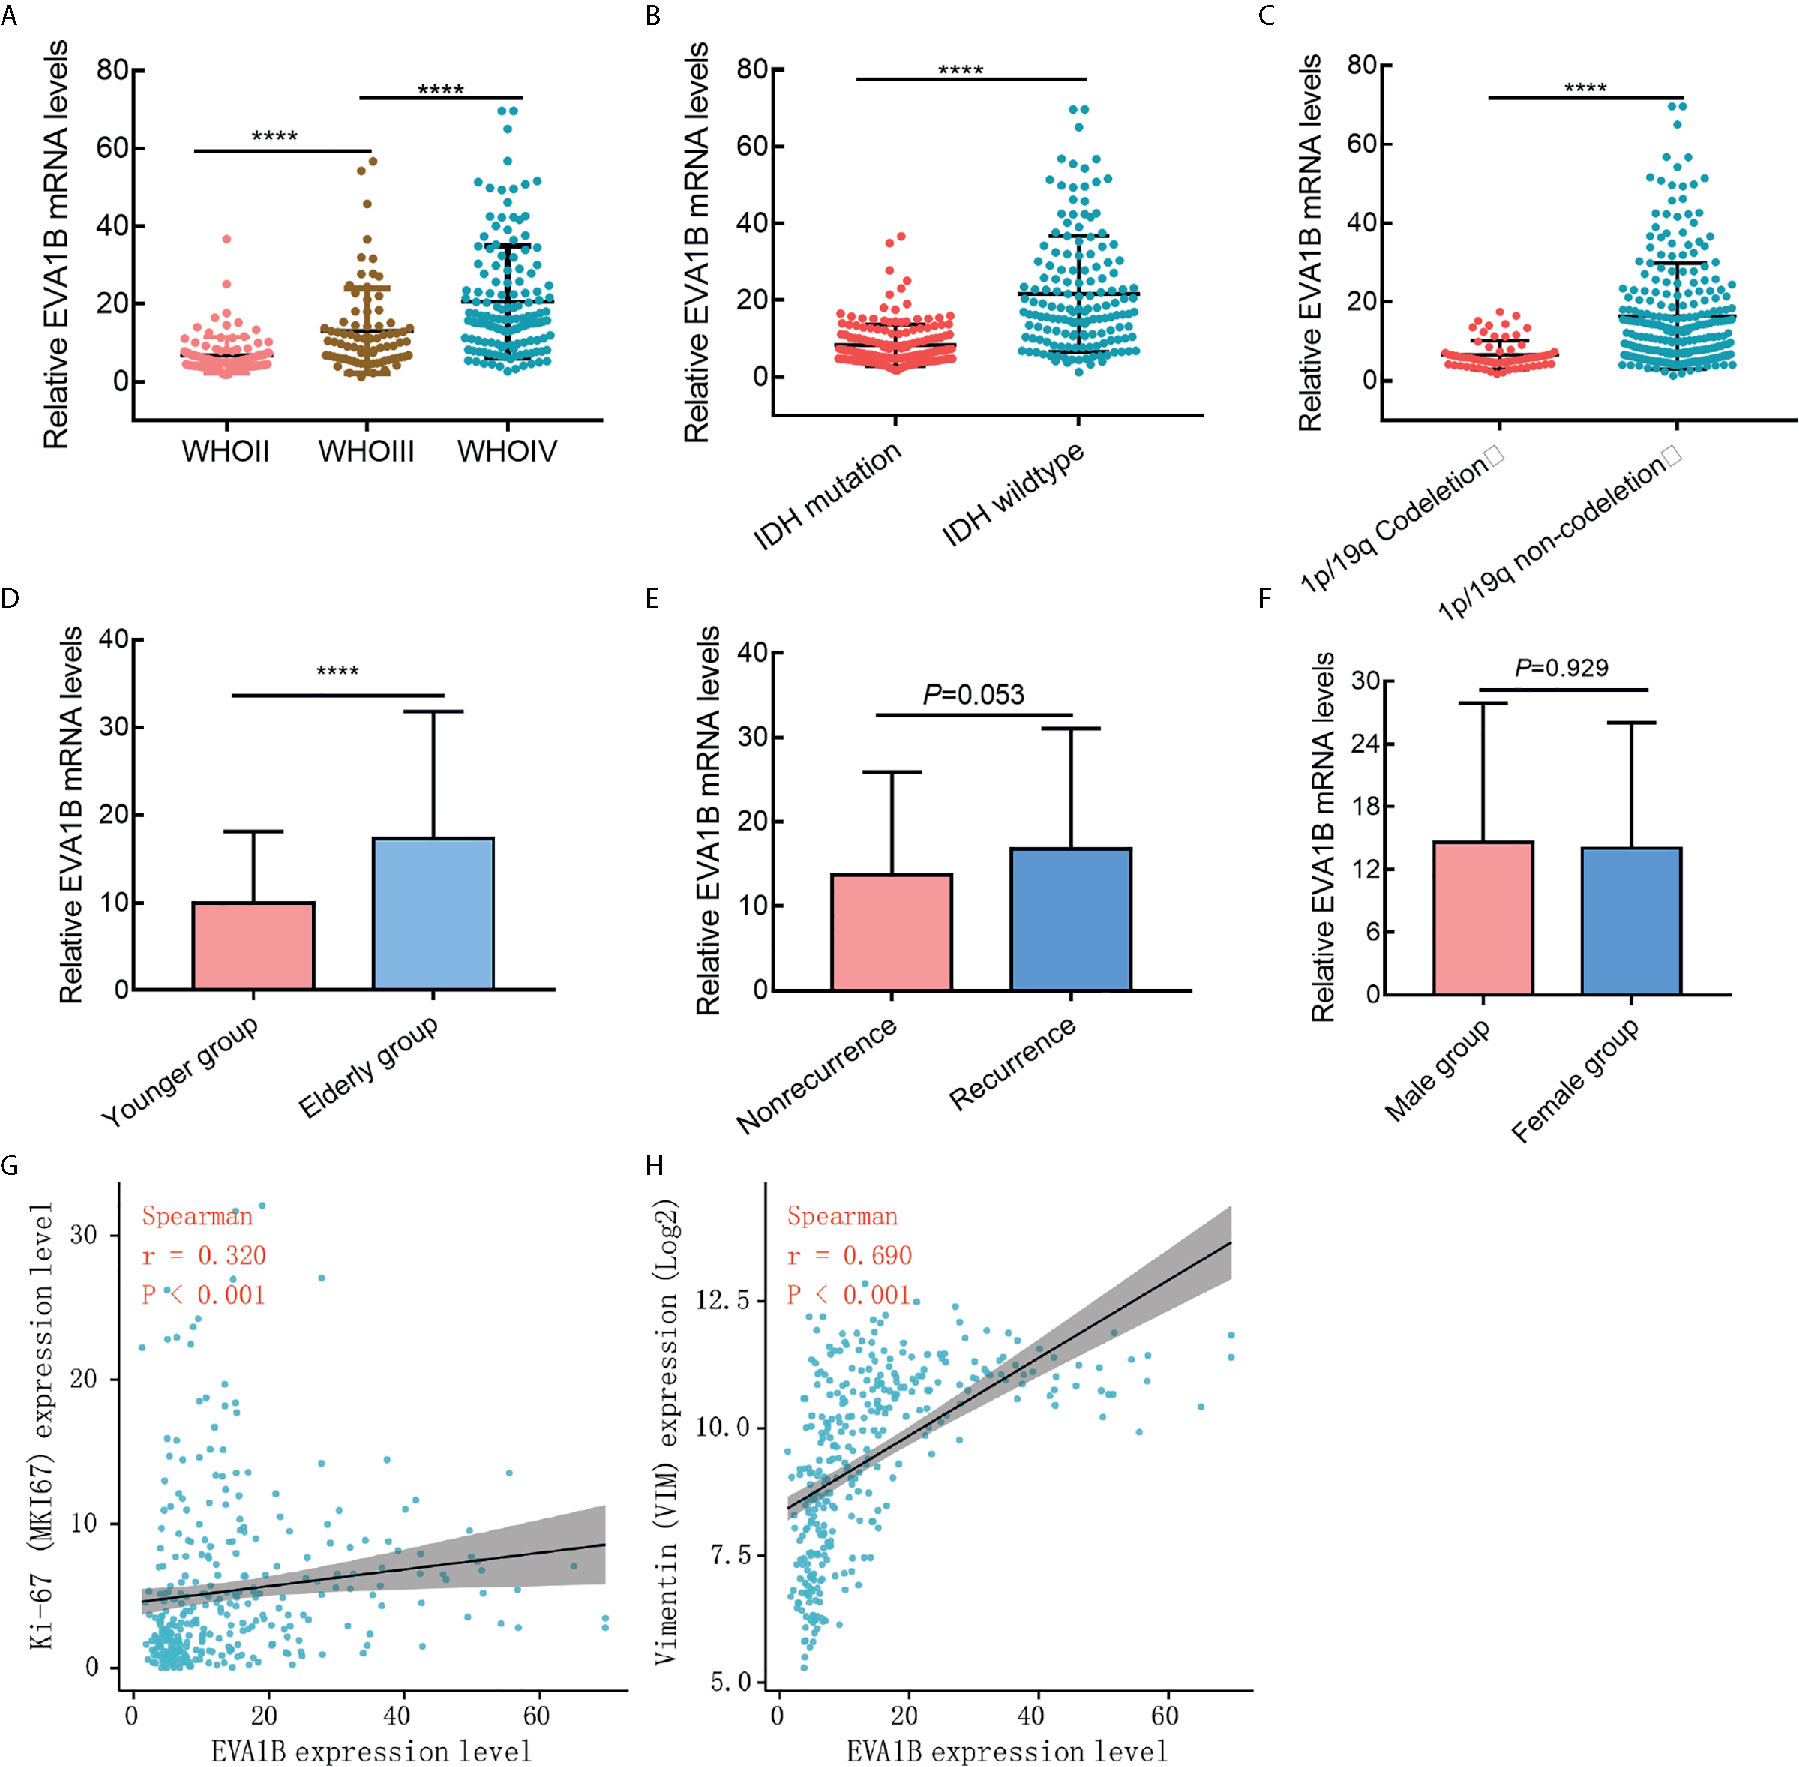
Figure 2 The association between EVA1B expression and clinicopathological features in glioma cohort (CGGA cohort, n = 325). (A–F) The EVA1B expression was significantly associated with WHO grade, IDH wildtype, 1P/19q non-codeletion, and age, but not with recurrence of glioma and sex. (G, H) EVA1B expression was weakly associated with proliferation marker (Ki-67 expression), and strongly associated with invasion marker (Vimentin expression). (****P < 0.0001).
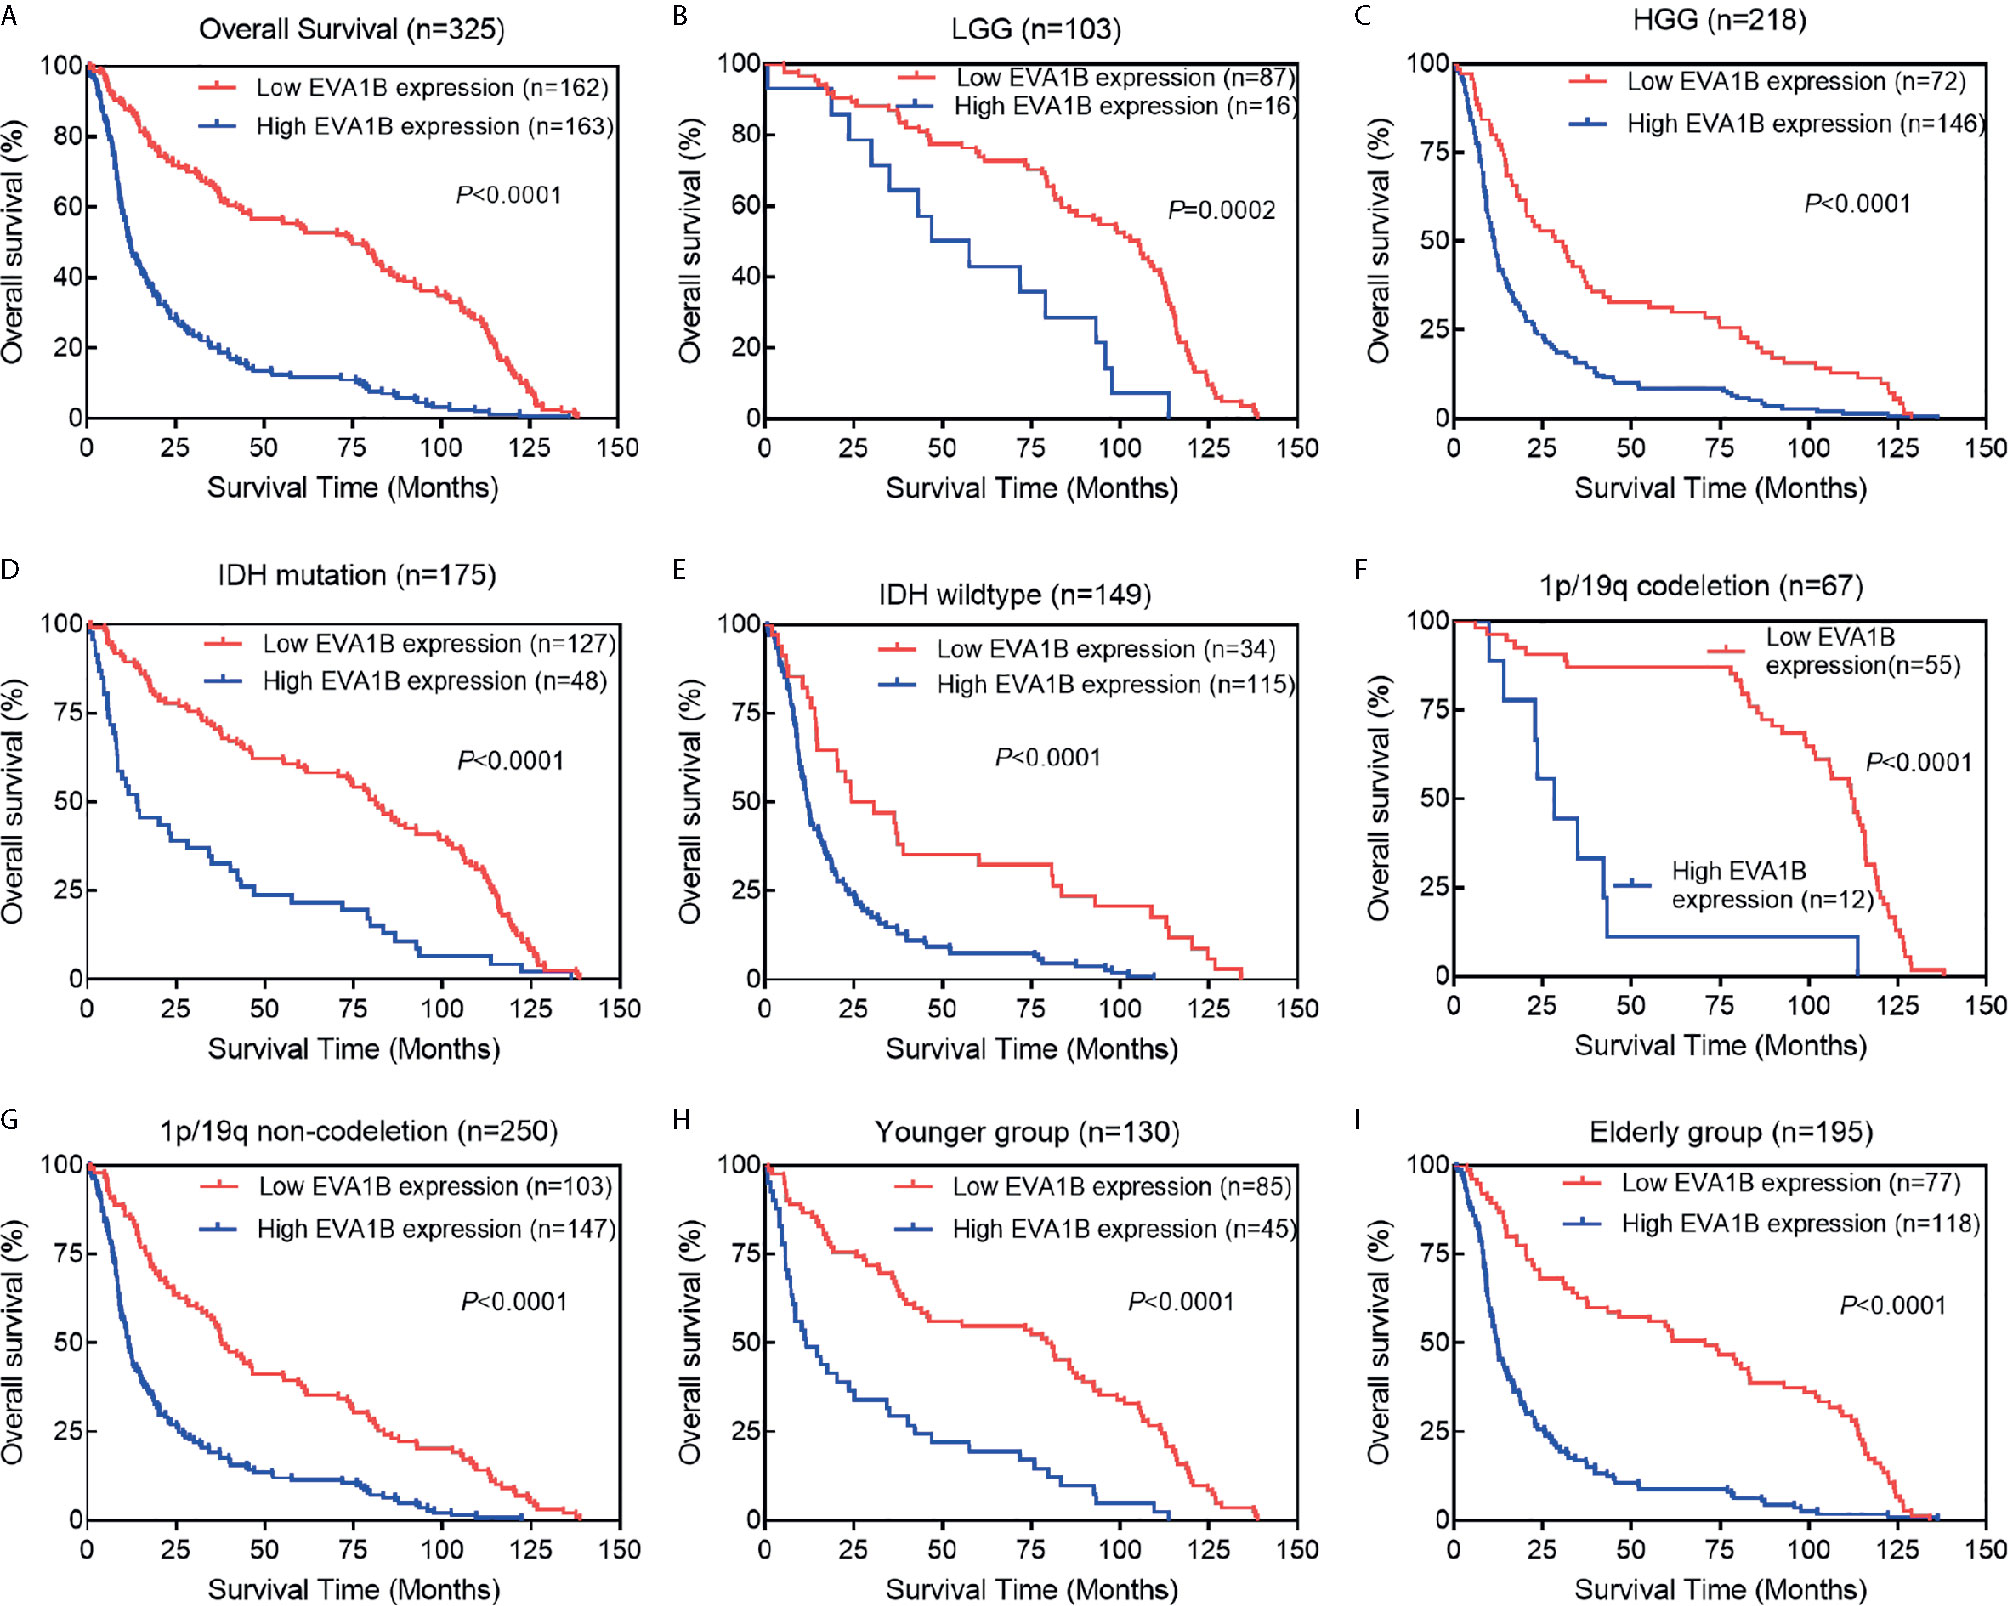
Figure 3 The association between EVA1B expression and prognosis of glioma patients. (A) Overall, Kaplan-Meier curves showed that patients with EVA1B overexpression have a poorer prognosis than those with low expression. (B–I) In the subgroup analysis, patients with EVA1B overexpression showed significantly poorer prognosis than those with low expression in the LGG subgroup, HGG subgroup, IDH mutation subgroup, IDH wildtype subgroup, 1p/19q codeletion subgroup, 1p/19q non-codeletion subgroup, younger subgroup, and elderly subgroup.
Second, we analyzed its correlation with MKI67 (Ki-67 proliferation index) and VIM expression level (Vimentin invasion index) and found that EVA1B was weakly correlated with Ki-67 (r=0.320, P<0.001, Figure 2G), but strongly correlated with Vimentin expression (r=0.690, P<0.001, Figure 2H). This result was also verified by the TCGA cohort of 609 glioma patients (Supplementary Figures 2A, B).
Third, according to the median value of EVA1B expression, all patients were divided into low or high EVA1B groups. Chi-square test results showed that overexpressed EVA1B was significantly associated with age (P<0.001), WHO grade (P<0.001), histopathology (P<0.001), IDH status (P<0.001), and 1p/19q status (P<0.001) (Table 1, Supplementary Table 2). These results suggested that EVA1B overexpression was related to the malignant clinicopathological features of glioma patients.
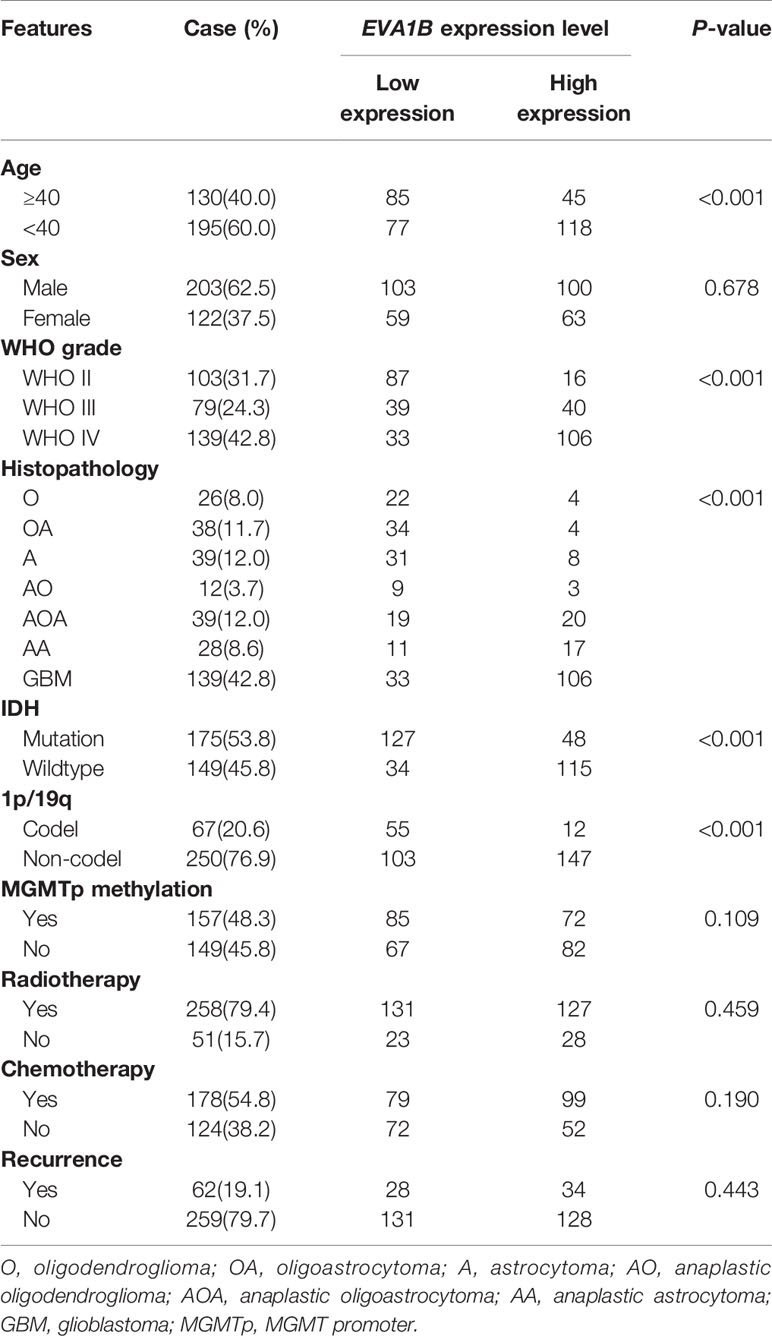
Table 1 The correlation between the expression of EVA1B and clinicopathological factors (CGGA).
The Prognostic Value of EVA1B Expression in Glioma Patients
To assess whether EVA1B could act as a prognosis marker for glioma patients, Kaplan-Meier survival analysis was conducted to compare the OS of patients between high and low EVA1B expression groups. Overall, the Kaplan-Meier curve showed that patients from the high EVA1B expression group had a remarkably poorer OS (HR=0.38, 95%CI=0.30-0.49, P<0.0001, Figure 3A). Furthermore, stratified survival analysis was performed to assess the prognostic significance of EVA1B in different subgroups of glioma patients stratified by age, WHO grade, IDH status, and 1p/19q status. The results of stratified survival analysis were consistent with the results shown in Figure 3A (Figures 3B–I). Next, the univariate and multivariate analysis results revealed that EVA1B expression was an independent prognostic biomarker for glioma patients (HR= 1.93, 95%CI=1.42-2.62, P<0.001, Table 2).
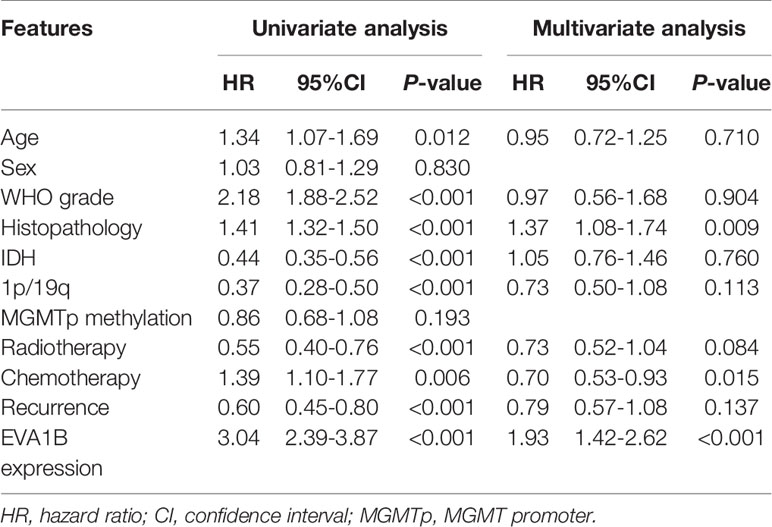
Table 2 Univariate and multivariate Cox-regression analysis of clinicopathological factors affecting the prognosis of patients.
A time-dependent ROC curve was also used to assess the predictive power of EVA1B in predicting 1-, 3- and 5-years OS, and the AUC for 1-, 3- and 5-year survival rate of glioma patients was 0.767, 0.810, and 0.813, respectively (Figure 4A). It is noteworthy that, compared with the clinical common indicators including IDH mutation, WHO grade, and histopathology, EVA1B had a higher predictive power (Figure 4B). Taken together, these results suggest that EVA1B is a moderately sensitive index for predicting the prognosis of glioma patients, and can act as an effective prognostic biomarker in glioma.
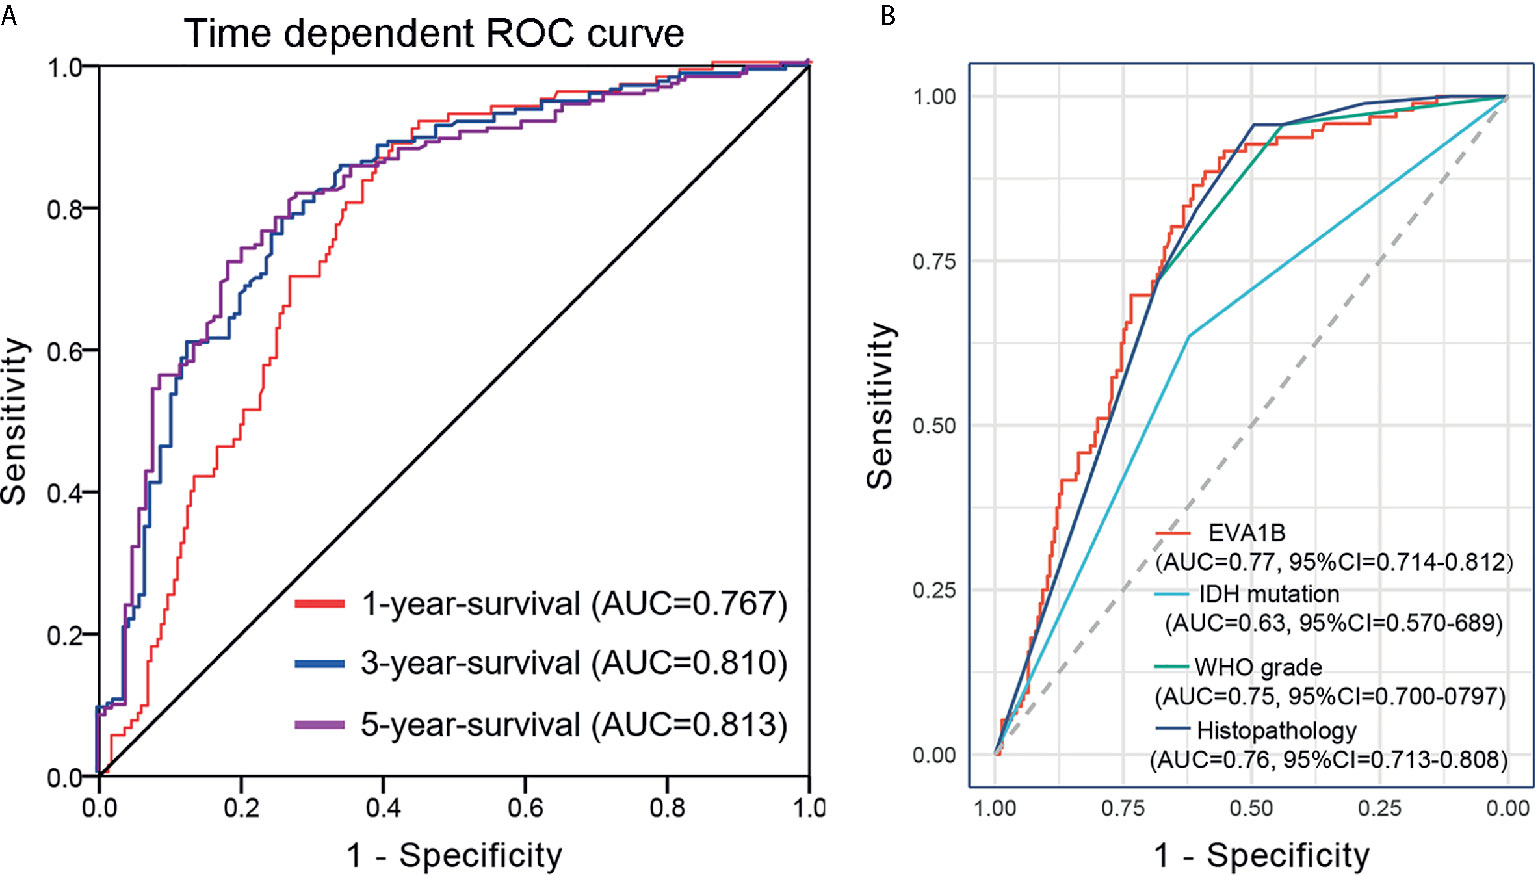
Figure 4 Predictive power for prognosis with EVA1B expression by ROC curve analysis. (A) ROC curves showed that the AUC of EVA1B for predicting 1-, 3- and 5-years survival of patients is 0.767, 0.810, and 0.813, respectively. (B) The prediction performance of EVA1B protein is higher than IDH mutation, WHO grade, and histopathology.
Validation of the Prognostic Significance of EVA1B in TCGA and GEO Cohorts
To independently verify the prognostic significance of EVA1B, data from the TCGA and GEO databases were used as validation cohorts, respectively. In the TCGA cohort of 609 glioma patients, we also compared the differential mRNA level of EVA1B in different subgroups based on WHO grade, IDH mutation, and 1p/19q codeletion. As shown in Supplementary Figures 3A–C, the results of the TCGA validation cohort are consistent with the results of the CGGA cohort in WHO grade (P<0.0001, Supplementary Figure 3A), IDH status (P<0.0001, Supplementary Figure 3B), and 1p/19q status groups (P<0.0001, Supplementary Figure 3C). Similarly, Supplementary Table 3 revealed the comparison of clinicopathological features between the high and low EVA1B groups, which yielded similar results.
Next, to validate the prognostic value of EVA1B for glioma patients, Kaplan-Meier analysis was used to compare the OS between Low-EVA1B and high-EVA1B groups and showed that patients with high EVA1B expression had a remarkably worse OS than patients with low-EVA1B expression (P<0.0001, Supplementary Figure 3D). Likewise, all patients were further stratified by WHO grade and IDH mutation. Kaplan-Meier curves showed that patients with low EVA1B were significantly correlated with a much better OS than patients with high EVA1B in the LGG subgroup (P<0.05, Supplementary Figure 3E), HGG subgroup (P<0.0001, Supplementary Figure 3F), and IDH-wildtype subgroup (P=0.0092, Supplementary Figure 3H). Although there was no statistical difference between patients with low and high EVA1B in the IDH-mutation subgroup (P>0.05, Supplementary Figure 3G), the median survival of patients with low-EVA1B expression was better than patients with high-EVA1B expression (105.1 months and 75.1 months, respectively).
We also verified the prognostic value of EVA1B for glioma patients by the GEO dataset (GSE4412-GPL96, n=74). The details of GSE4412-GPL96 were summarized in Supplementary Figure 4A. Likewise, the 74 glioma patients were divided into low-EVA1B and high-EVA1B subgroups (Supplementary Figures 4B, C). Consistently, patients with high-EVA1B expression were associated with shorter OS (P=0.001616, Supplementary Figure 4D). Taken together, we found that EVA1B overexpression was an unfavorable prognostic indicator for glioma patients.
Gene Function Annotation and Pathway Analysis
After determining the prognostic value of EVA1B in glioma, we next explored what kind of biological function EVA1B protein might be associated with. GO and KEGG enrichment analyses were performed, and the top twenty GO terms and signaling pathways are shown in Figures 5A, B. EVA1B gene was associated with many biological processes such as focal adhesion, regulation of actin cytoskeleton, cell proliferation, and tumor necrosis factor. Of note, EVA1B was also associated with NF-kappa B signaling, apoptotic signaling pathway, and TNF signaling pathway. These three signaling pathways are known to be associated with immune and inflammation processes.
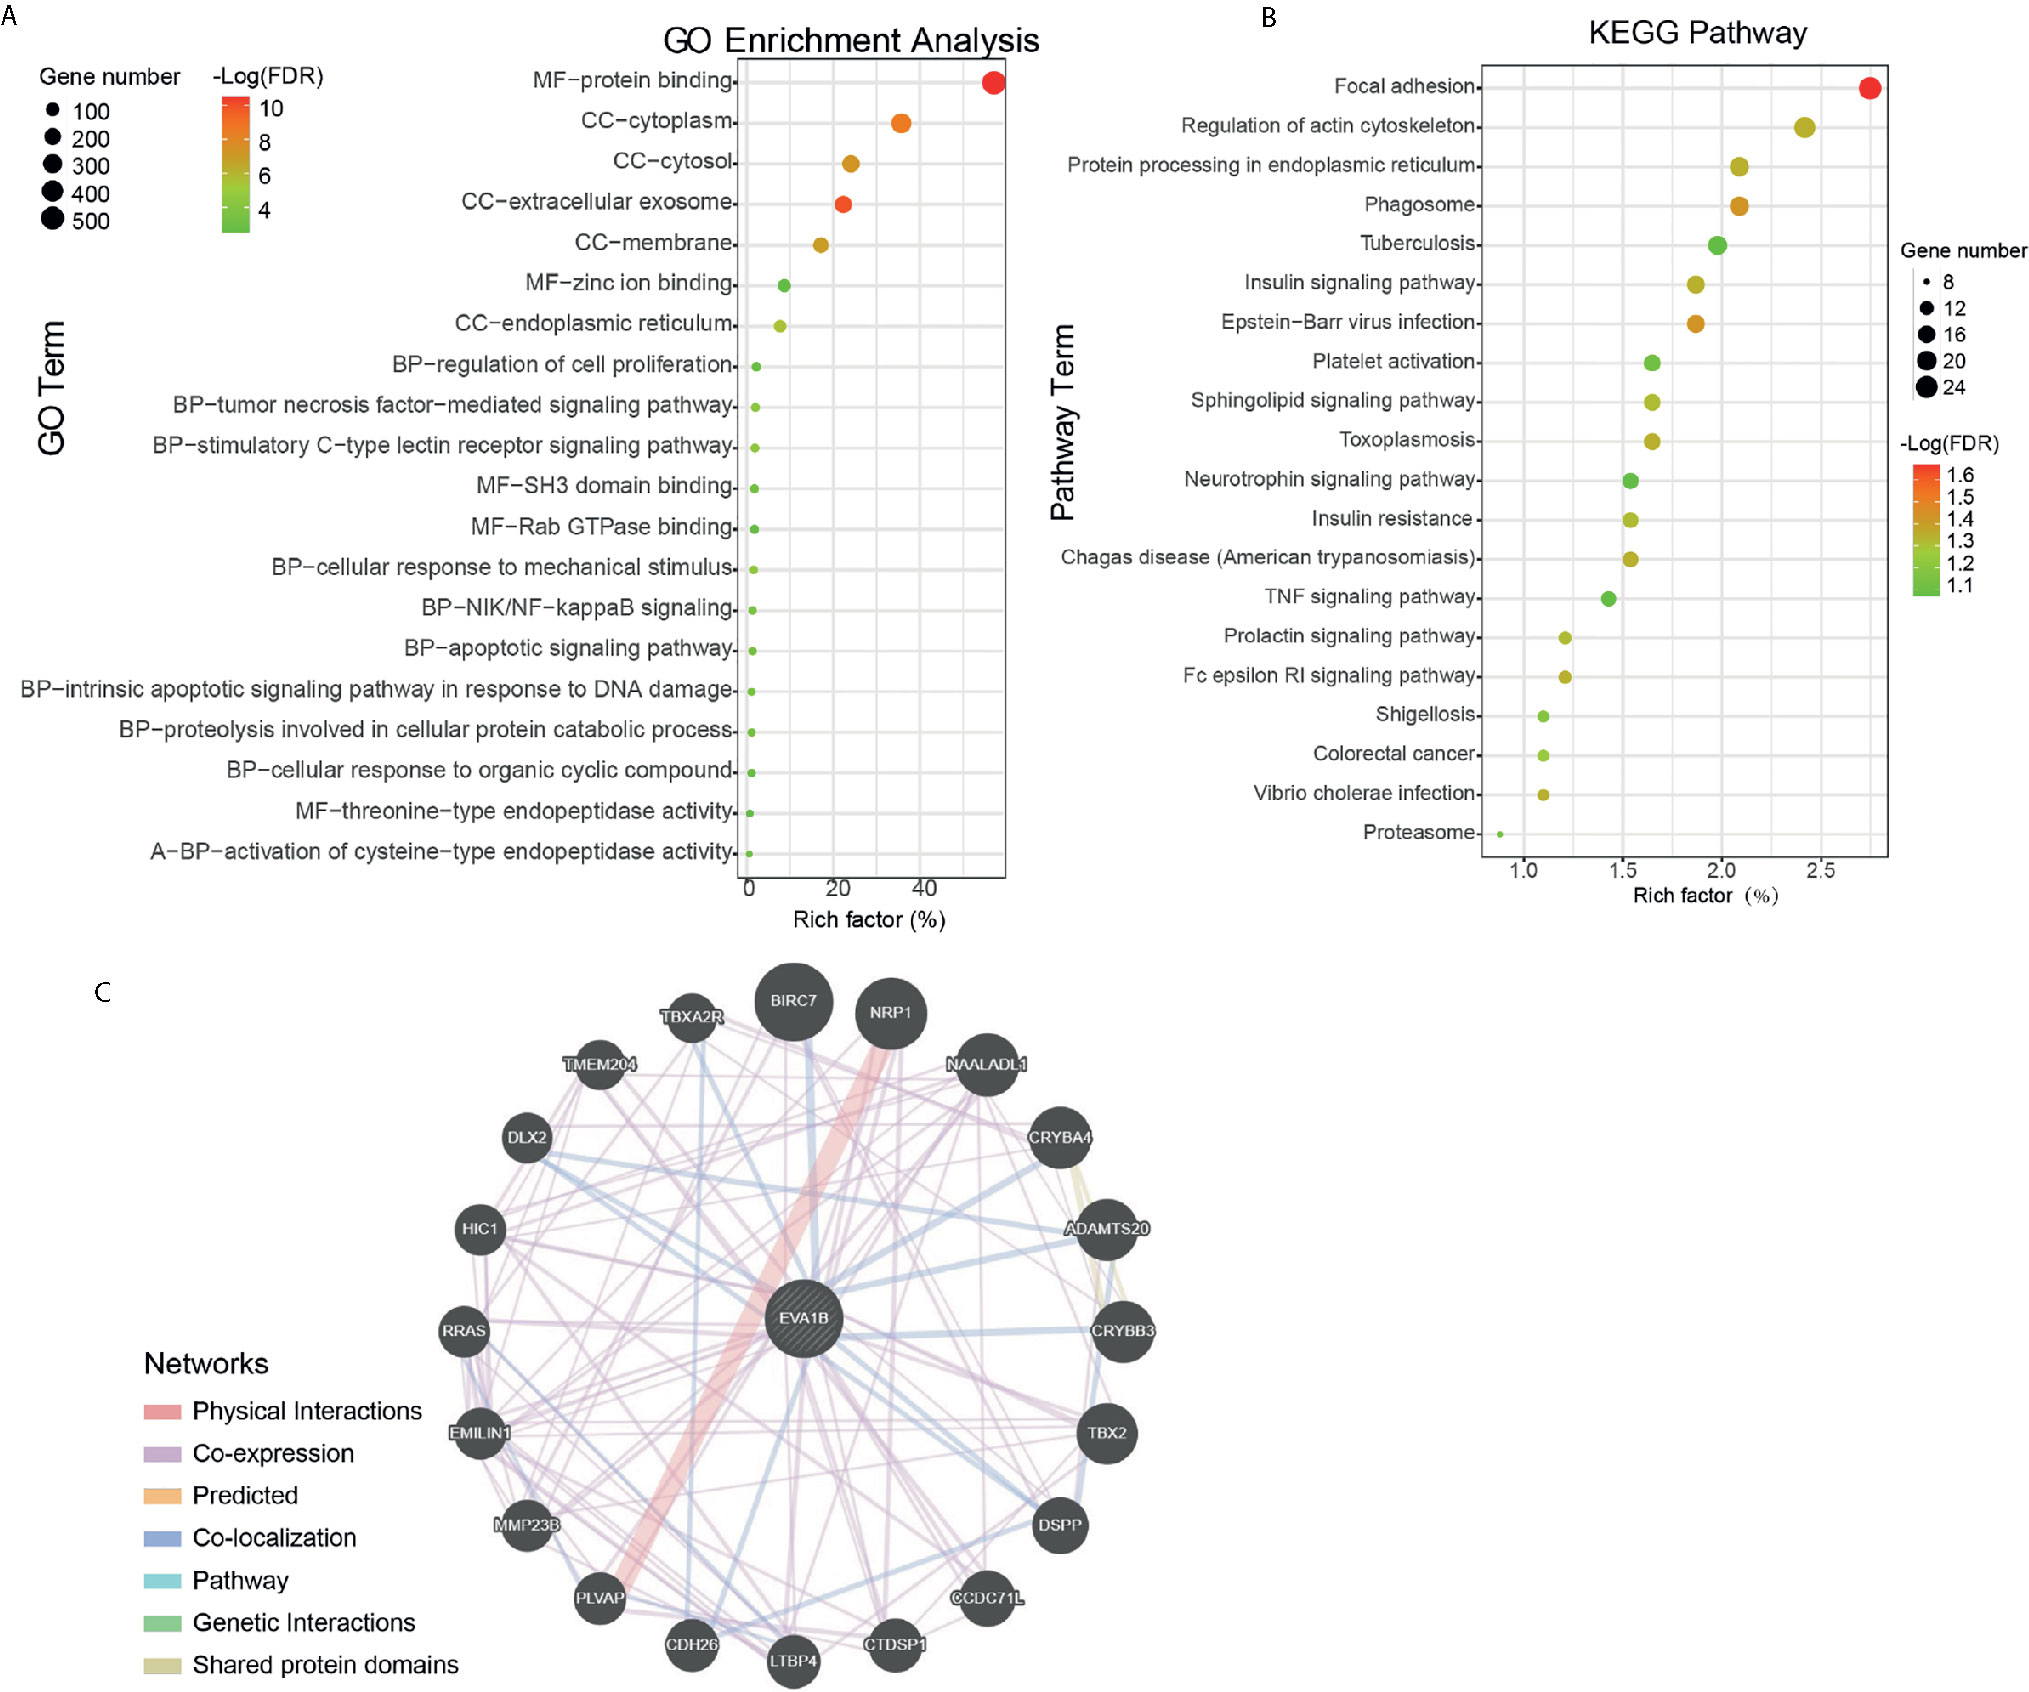
Figure 5 Protein annotation and protein-protein interaction analysis of EVA1B gene in glioma. (A, B) GO and KEGG pathway analysis of EVA1B in glioma. (C) Predicted structural proteins essential for the functioning of EVA1B generated from GeneMANIA. The different colors of the connecting lines represent the physical interactions, co-expression, predicted interactions, co-localization, the same pathway, genetic interactions, and shared protein domains.
To understand the potential interaction proteins of EVA1B, a visual interaction network was generated by GeneMANIA software (Figure 5C). The GeneMANIA results covered 20 EVA1B-interacting proteins, and the proteins are tightly interconnected around BIRC7, NRP1, NAALADL1, CRYBA4, ADAMTS20, CRYBB3, DSPP, CCDC71L, CTDSP1, and LTBP4.
Association Between EVA1B Expression Levels and Tumor-Immune Microenvironment in Glioma
We further explored the correlation between EVA1B expression and the infiltration levels of different immune cells in a cohort of 609 glioma patients. We obtained the immune infiltration status of glioma patients by the TIMER algorithm. As shown in Figures 6A–G, EVA1B expression was shown to be weakly correlated with B cells (r=0.37, P<0.0001), CD4+ T cells (r=0.39, P<0.0001), moderately with macrophages (r=0.50, P<0.0001), and also strongly with CD8+ T cells (r=0.71, P<0.0001). However, EVA1B was very weakly or not correlated with DCs (r=0.17, P<0.0001). Importantly, there was a strong correlation between EVA1B expression and the overall immune-infiltration levels in glioma (r=0.64, P<0.0001). These findings suggested that EVA1B might be associated with the regulation of immune infiltration of glioma. Next, to verify the correlation between EVA1B and immune infiltration levels, we also calculated the infiltration levels of different immune cells by another commonly EPIC algorithm. As expected, we obtained similar results (Supplementary Figure 5). In addition, Figure 6H shows the correlation between EVA1B expression and the various immune marker genes.
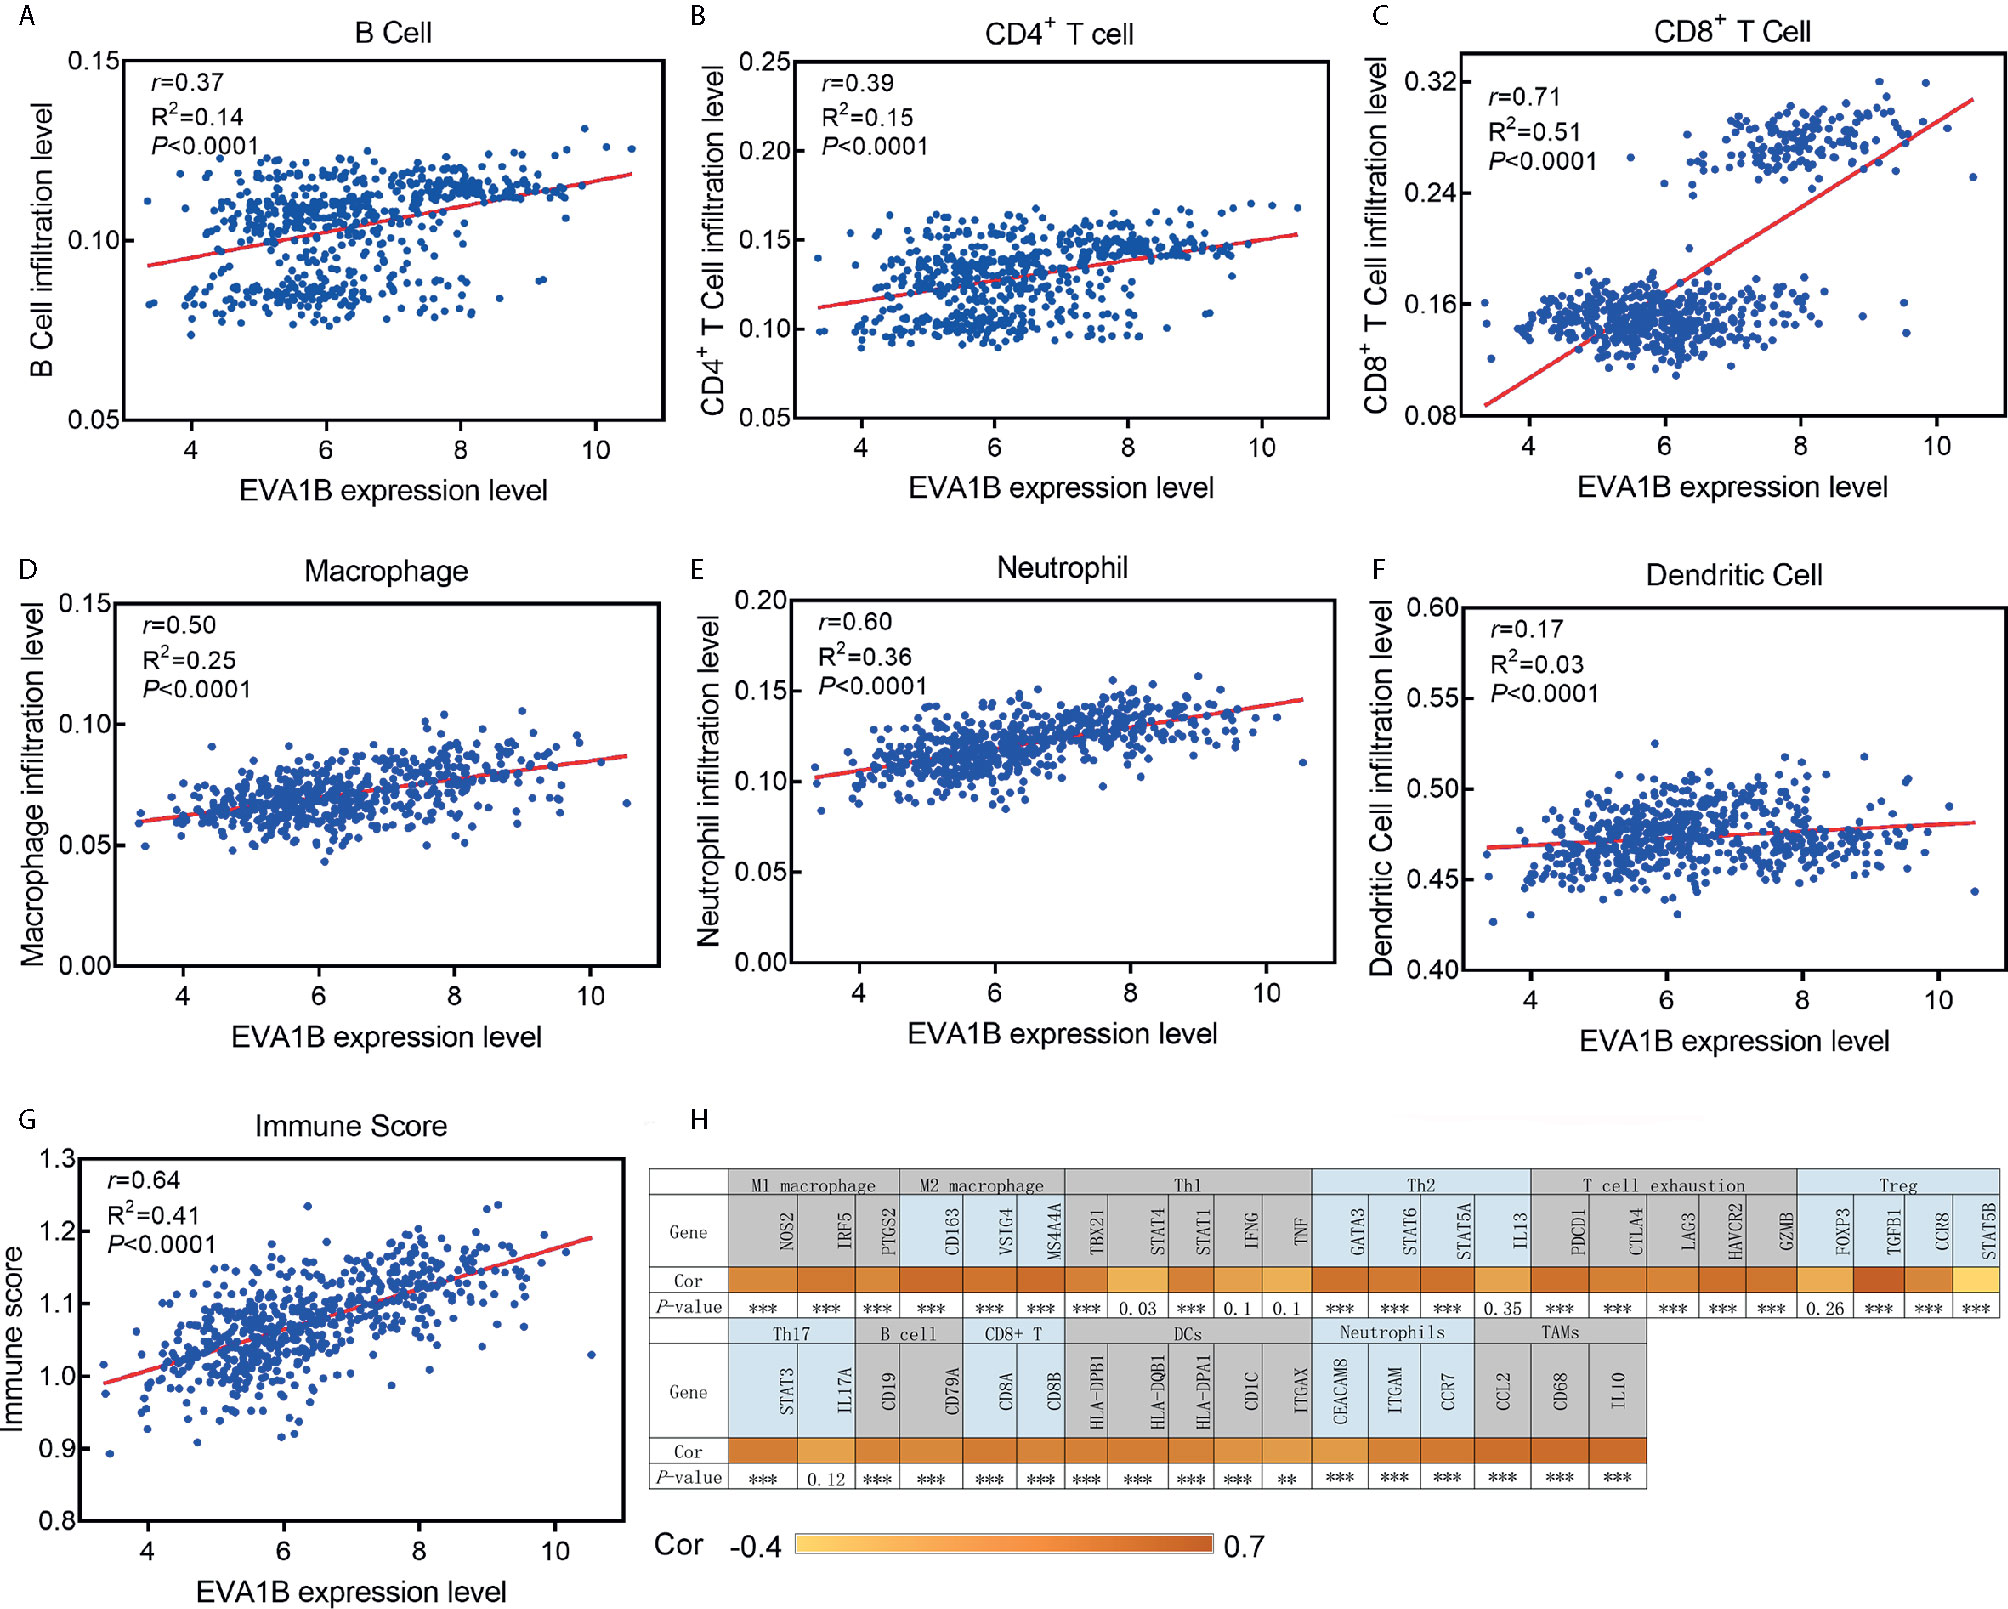
Figure 6 The association between EVA1B expression and immune infiltration level. (A–F) EVA1B expression is correlated with infiltration levels of B cells, CD4+ T cells, CD8+ T cells, macrophages, neutrophils, but very weakly or not correlated with DCs. (G) EVA1B expression is strongly correlated with the overall immune score of glioma. (H) Heatmap showing the correlation between EVA1B expression and the immune markers of various immune cells.
Finally, to assess the predictive performance of EVA1B for the high infiltration levels of immune cells in glioma, ROC curves were conducted to compare the AUC value between EVA1B, PD-L1, CTLA-4, and Siglec15. The results revealed that, compared with other markers, EVA1B presented a higher predictive power (AUC=0.824, 95%CI=0.79-0.86, P<0.0001, Supplementary Figure 6).
Discussion
In this study, we found, for the first time, that EVA1B expression was highly upregulated in glioma tissues compared with normal brain tissues, and increased with tumor grade. The pan-cancer analysis also revealed that EVA1B was broadly and highly expressed in multiple kinds of tumors. In glioma, we observed that EVA1B overexpression was associated with age, WHO grade, histopathology, IDH wildtype, 1p/19q non-codeletion, and marker of invasion, which suggested that EVA1B overexpression may be involved in the malignant behavior of glioma. What is more, multivariate Cox regression analysis showed that EVA1B overexpression is an independent poor factor for the prognosis of glioma patients, which was also confirmed in two other independent cohorts. Functional enrichment analysis (DAVID) also indicated that EVA1B overexpression was associated with tumor proliferation, focal adhesion, regulation of actin cytoskeleton, anti-apoptotic effect, and the inflammatory response, which was in agreement with the above findings. These results implied that EVA1B overexpression may have played a key role in the malignant phenotypes of gliomas, and is a potentially unfavorable prognostic biomarker for glioma patients. However, the role EVA1B plays in the tumor-immune microenvironment is not reported.
The EVA1 family protein has three members, EVA1A, EVA1B, and EVA1C. To date, functional studies of EVA1B protein in glioma are still not reported. Lan Wang et al. first reported that EVA1A is a novel transmembrane protein (19), and a highly homologous protein of EVA1B. Recently, Bang-Yi Lin et al. further found that, compared with the normal tissues, the EVA1A was overexpressed in thyroid cancer tissues, and overexpression of EVA1A significantly promoted cell proliferation, metastasis, and apoptosis through the Hippo signaling pathway (20). In this study, we observed that EVA1B is associated with many biological processes such as focal adhesion, regulation of actin cytoskeleton, cell proliferation, and tumor necrosis factor. Focal adhesion mediates cell migration, survival, proliferation, and apoptosis, which are regulated by tyrosine kinase and small G-protein (21). Focal adhesion proteins are integrin-rich microdomains, which transmit mechanical signals from the ECM to activate signaling pathways inside the cell and structurally link the cytoskeleton to the ECM (22). This result is consistent with the strong correlation between EVA1B and vimentin in glioma. Additionally, EVA1B was also associated with NF-kappa B signaling, the apoptotic signaling pathway, and TNF signaling pathway. These three signaling pathways were known to be associated with immune and inflammation processes.
Another important finding in this study is that EVA1B expression has a positive correlation with the abundance of infiltrating B cells, CD4+ T cells, CD8+ T cells, macrophages, and neutrophils in glioma. Furthermore, the immune cells were involved in the tumor immune network (23). For instance, Neeta Somalia et al. found that LV305 could selectively induce NY-ESO-1 expression of DCs, which further promotes tumor response in patients (24). The abundance of immune cells affects the outcomes of patients in head and neck squamous cell carcinoma (HNSCC) and lung adenocarcinoma (LUAD) (25, 26), which is in agreement with the results of this study. However, the role of immune cells in tumors is very complex. As studies have reported, on the one hand, DCs are professional antigen-presenting cells, which can capture and process antigen to present antigenic peptides on MHC Class I and Class II to activate CD8+ and CD4+ cells respectively (27). On the other hand, DCs could promote breast cancer bone metastasis via increasing Treg cells and reducing CD8+ cytotoxic T cells (28) and play a crucial role in cell proliferation, invasion, and intercellular communication (5, 29). At present, Treg cells are considered to be one of the main reasons for glioma producing an immunosuppressive microenvironment (30). Several studies have suggested that the proportion of Treg cells increases with the malignant degree of glioma (31).
Previous studies have mainly focused on the correlations between new antigens and survival by genomics (32). A comprehensive understanding of the immune infiltration status of tumor patients is of great significance for patients in choosing individual immunotherapy (33). In recent years, some immune-associated markers, such as PD-L1, tumor mutational burden (TMB), have been reported to become the indicators for immunotherapy response (34, 35). However, the dynamics of the immune microenvironment, other checkpoint molecules, infiltrating immune cells, and immune biomarkers may also be important for the response to immunotherapy (36). In recent years, the study of immune checkpoints has made a breakthrough in the field of tumor immunotherapy, and immune checkpoint blockade has also been approved for the treatment of melanoma and lung cancer (37). Although PD-L1 expression could predict the immunotherapy response of some patients, PD-L1 expression is not enough to predict which patients should be treated with immunotherapy (38, 39). Therefore, an accurate precision biomarker is of great importance to individualized immunotherapy. Jing-Hua Pan et al. (40) recently found that LAYN overexpression is closely related to the abundance of immune cell infiltration in gastric and colon cancer, and may be involved in the regulation of tumor-associated macrophages, DCs, T cell exhaustion, and Tregs function. They concluded that overexpression of LYAN can be used as a molecular biomarker of immune infiltration and survival prognosis in patients with gastric or colon cancer. Similarly, we found that EVA1B was significantly correlated with immune checkpoint blocking molecules PD-1, CTLA4, LAG3, and TIM3, which suggested that EVA1B has the potential to act as a predictive biomarker for the effectors of immune checkpoint blockade in glioma. However, whether the same is true for other types of cancer remains to be studied.
There were limitations to the present study. Firstly, this study did not further verify the functional role of EVA1B in the immune microenvironment of glioma. This subject is very novel and worthy of further study. Secondly, although we found that EVA1B was mainly localized to cytoplasm and membrane in immunofluorescence images from HPA, the result should be verified by different cell lines. Thirdly, the present findings may be the basis for further studies to validate the outcomes.
In conclusion, we discovered for the first time that EVA1B was significantly upregulated in glioma, and increased with tumor grade. EVA1B overexpression was remarkably associated with malignant behavior and poorer prognosis in glioma patients. Another important finding is that the expression level of EVA1B correlates with the infiltration levels of immune cells including B cells, CD4+ T cells, CD8+ T cells, macrophages, and neutrophils. Thus, EVA1B is strongly correlated with the overall immune infiltration levels of glioma and could serve as an independent prognosis biomarker for glioma patients.
Data Availability Statement
Publicly available datasets were analyzed in this study. This data can be found here: CGGA (http://cgga.org.cn/, Dataset ID: mRNAseq_325) and TCGA (http://cgga.org.cn/, Dataset ID: mRNAseq_325) database, and requests for further access to datasets can be directed to aHVheXVhbmx1NDAyQDEyNi5jb20=.
Ethics Statement
The studies involving human participants were reviewed and approved by Ethics Committee of Lishui People’s hospital. The ethics committee waived the requirement of written informed consent for participation.
Author Contributions
JL and HW conceived the study. JL and SQ performed data analysis. SQ wrote the manuscript. HW revised the manuscript. All authors contributed to the article and approved the submitted version.
Conflict of Interest
The authors declare that the research was conducted in the absence of any commercial or financial relationships that could be construed as a potential conflict of interest.
Supplementary Material
The Supplementary Material for this article can be found online at: https://www.frontiersin.org/articles/10.3389/fimmu.2021.648416/full#supplementary-material
Abbreviations
CNS, central nervous system; OS, overall survival; GBM, glioblastoma; IHC, immunohistochemistry. EMT, epithelial-mesenchymal transition; TMB, tumor mutational burden; HNSCC, head, and neck squamous cell carcinoma; LUAD, lung adenocarcinoma.
References
1. Miller CR, Perry A. Glioblastoma. Arch Pathol Lab Med (2007) 131:397–406. doi: 10.1043/1543-2165(2007)131[397:g]2.0.co;2
2. Liu Y, Tang ZG, Yang JQ, Zhou Y, Lin Y, Lv W, et al. Effect of silencing S-phase kinase-associated protein 2 on chemosensitivity to temozolomide of human glioma cells U251. Am J Transl Res (2019) 11:2470–6.
3. Weingart J, Grossman SA, Carson KA, Fisher JD, Delaney SM, Rosenblum ML, et al. Phase I trial of polifeprosan 20 with carmustine implant plus continuous infusion of intravenous O6-benzylguanine in adults with recurrent malignant glioma: new approaches to brain tumor therapy CNS consortium trial. J Clin Oncol (2007) 25:399–404. doi: 10.1200/jco.2006.06.6290
4. Tan C, Liu L, Liu X, Qi L, Wang W, Zhao G, et al. Activation of PTGS2/NF-κB signaling pathway enhances radiation resistance of glioma. Cancer Med (2019) 8:1175–85. doi: 10.1002/cam4.1971
5. Zhao Q, Yu J, Meng X. A good start of immunotherapy in esophageal cancer. Cancer Med (2019) 8:4519–26. doi: 10.1002/cam4.2336
6. Hu H, Wang Z, Li M, Zeng F, Wang K, Huang R, et al. Gene Expression and Methylation Analyses Suggest DCTD as a Prognostic Factor in Malignant Glioma. Sci Rep (2017) 7:11568. doi: 10.1038/s41598-017-11962-y
7. Bennani-Baiti N, Thanarajasingam G, Ansell S. Checkpoint Inhibitors for the Treatment of Hodgkin Lymphoma. Expert Rev Clin Immunol (2016) 12:673–9. doi: 10.1586/1744666x.2016.1147350
8. Barbee MS, Ogunniyi A, Horvat TZ, Dang TO. Current status and future directions of the immune checkpoint inhibitors ipilimumab, pembrolizumab, and nivolumab in oncology. Ann Pharmacother (2015) 49:907–37. doi: 10.1177/1060028015586218
9. Wang H, Xu T, Huang Q, Jin W, Chen J. Immunotherapy for Malignant Glioma: Current Status and Future Directions. Trends Pharmacol Sci (2020) 41:123–38. doi: 10.1016/j.tips.2019.12.003
10. Zhang H, Liu H, Shen Z, Lin C, Wang X, Qin J, et al. Tumor-infiltrating Neutrophils is Prognostic and Predictive for Postoperative Adjuvant Chemotherapy Benefit in Patients With Gastric Cancer. Ann Surg (2018) 267:311–8. doi: 10.1097/sla.0000000000002058
11. Lin BY, Wen JL, Zheng C, Lin LZ, Chen CZ, Qu JM. Eva-1 homolog A promotes papillary thyroid cancer progression and epithelial-mesenchymal transition via the Hippo signalling pathway. J Cell Mol Med (2020) 24:13070–80. doi: 10.1111/jcmm.15909
12. Zhen Y, Zhao R, Wang M, Jiang X, Gao F, Fu L, et al. Flubendazole elicits anti-cancer effects via targeting EVA1A-modulated autophagy and apoptosis in Triple-negative Breast Cancer. Theranostics (2020) 10:8080–97. doi: 10.7150/thno.43473
13. Xu L, Zhang T, Huang W, Liu X, Lu J, Gao X, et al. YAP mediates the positive regulation of hnRNPK on the lung adenocarcinoma H1299 cell growth. Acta Biochim Biophys Sin (Shanghai) (2019) 51:677–87. doi: 10.1093/abbs/gmz053
14. Yamauchi T, Moroishi T. Hippo Pathway in Mammalian Adaptive Immune System. Cells (2019) 8:398. doi: 10.3390/cells8050398
15. Vasaikar SV, Straub P, Wang J, Zhang B. LinkedOmics: analyzing multi-omics data within and across 32 cancer types. Nucleic Acids Res (2018) 46:D956–63. doi: 10.1093/nar/gkx1090
16. Dennis G Jr., Sherman BT, Hosack DA, Yang J, Gao W, Lane HC, et al. DAVID: Database for Annotation, Visualization, and Integrated Discovery. Genome Biol (2003) 4:P3. doi: 10.1186/gb-2003-4-9-r60
17. Warde-Farley D, Donaldson SL, Comes O, Zuberi K, Badrawi R, Chao P, et al. The GeneMANIA prediction server: biological network integration for gene prioritization and predicting gene function. Nucleic Acids Res (2010) 38:W214–20. doi: 10.1093/nar/gkq537
18. Li T, Fan J, Wang B, Traugh N, Chen Q, Liu JS, et al. TIMER: A Web Server for Comprehensive Analysis of Tumor-Infiltrating Immune Cells. Cancer Res (2017) 77:e108–10. doi: 10.1158/0008-5472.can-17-0307
19. Wang L, Yu C, Lu Y, He P, Guo J, Zhang C, et al. TMEM166, a novel transmembrane protein, regulates cell autophagy and apoptosis. Apoptosis (2007) 12:1489–502. doi: 10.1007/s10495-007-0073-9
20. Guan Y, Chen L, Bao Y, Qiu B, Pang C, Cui R, et al. High miR-196a and low miR-367 cooperatively correlate with unfavorable prognosis of high-grade glioma. Int J Clin Exp Pathol (2015) 8:6576–88.
21. Paluch EK, Aspalter IM, Sixt M. Focal Adhesion-Independent Cell Migration. Annu Rev Cell Dev Biol (2016) 32:469–90. doi: 10.1146/annurev-cellbio-111315-125341
22. Qian Y, Sun H, Xiao H, Ma M, Xiao X, Qu Q. Microarray analysis of differentially expressed genes and their functions in omental visceral adipose tissues of pregnant women with vs. without gestational diabetes mellitus. BioMed Rep (2017) 6:503–12. doi: 10.3892/br.2017.878
23. Bindea G, Mlecnik B, Tosolini M, Kirilovsky A, Waldner M, Obenauf AC, et al. Spatiotemporal dynamics of intratumoral immune cells reveal the immune landscape in human cancer. Immunity (2013) 39:782–95. doi: 10.1016/j.immuni.2013.10.003
24. Somaiah N, Block MS, Kim JW, Shapiro GI, Do KT, Hwu P, et al. First-in-Class, First-in-Human Study Evaluating LV305, a Dendritic-Cell Tropic Lentiviral Vector, in Sarcoma and Other Solid Tumors Expressing NY-ESO-1. Clin Cancer Res (2019) 25:5808–17. doi: 10.1158/1078-0432.ccr-19-1025
25. Wu ZH, Tang Y, Niu X, Cheng Q. Expression and gene regulation network of INHBA in Head and neck squamous cell carcinoma based on data mining. Sci Rep (2019) 9:14341. doi: 10.1038/s41598-019-50865-y
26. Chen Y, Chen H, Mao B, Zhou Y, Shi X, Tang L, et al. Transcriptional Characterization Of The Tumor Immune Microenvironment And Its Prognostic Value For Locally Advanced Lung Adenocarcinoma In A Chinese Population. Cancer Manag Res (2019) 11:9165–73. doi: 10.2147/cmar.s209571
27. Zhang X, He T, Li Y, Chen L, Liu H, Wu Y, et al. Dendritic Cell Vaccines in Ovarian Cancer. Front Immunol (2020) 11:613773. doi: 10.3389/fimmu.2020.613773
28. Sawant A, Hensel JA, Chanda D, Harris BA, Siegal GP, Maheshwari A, et al. Depletion of plasmacytoid dendritic cells inhibits tumor growth and prevents bone metastasis of breast cancer cells. J Immunol (2012) 189:4258–65. doi: 10.4049/jimmunol.1101855
29. Tordjman R, Lepelletier Y, Lemarchandel V, Cambot M, Gaulard P, Hermine O, et al. A neuronal receptor, neuropilin-1, is essential for the initiation of the primary immune response. Nat Immunol (2002) 3:477–82. doi: 10.1038/ni789
30. Dong Y, Han Y, Huang Y, Jiang S, Huang Z, Chen R, et al. PD-L1 Is Expressed and Promotes the Expansion of Regulatory T Cells in Acute Myeloid Leukemia. Front Immunol (2020) 11:1710. doi: 10.3389/fimmu.2020.01710
31. Ooi YC, Tran P, Ung N, Thill K, Trang A, Fong BM, et al. The role of regulatory T-cells in glioma immunology. Clin Neurol Neurosurg (2014) 119:125–32. doi: 10.1016/j.clineuro.2013.12.004
32. Brown SD, Warren RL, Gibb EA, Martin SD, Spinelli JJ, Nelson BH, et al. Neo-antigens predicted by tumor genome meta-analysis correlate with increased patient survival. Genome Res (2014) 24:743–50. doi: 10.1101/gr.165985.113
33. Peng L, Chen Z, Chen Y, Wang X, Tang N. MIR155HG is a prognostic biomarker and associated with immune infiltration and immune checkpoint molecules expression in multiple cancers. Cancer Med (2019) 8:7161–73. doi: 10.1002/cam4.2583
34. Johnson A, Severson E, Gay L, Vergilio JA, Elvin J, Suh J, et al. Comprehensive Genomic Profiling of 282 Pediatric Low- and High-Grade Gliomas Reveals Genomic Drivers, Tumor Mutational Burden, and Hypermutation Signatures. Oncologist (2017) 22:1478–90. doi: 10.1634/theoncologist.2017-0242
35. Giunta EF, Barra G, De Falco V, Argenziano G, Napolitano S, Vitale P, et al. Baseline IFN-γ and IL-10 expression in PBMCs could predict response to PD-1 checkpoint inhibitors in advanced melanoma patients. Sci Rep (2020) 10:17626. doi: 10.1038/s41598-020-72711-2
36. Kaderbhaï C, Tharin Z, Ghiringhelli F. The Role of Molecular Profiling to Predict the Response to Immune Checkpoint Inhibitors in Lung Cancer. Cancers (Basel) (2019) 11:201. doi: 10.3390/cancers11020201
37. Gong J, Chehrazi-Raffle A, Reddi S, Salgia R. Development of PD-1 and PD-L1 inhibitors as a form of cancer immunotherapy: a comprehensive review of registration trials and future considerations. J Immunother Cancer (2018) 6:8. doi: 10.1186/s40425-018-0316-z
38. Shen X, Zhao B. Efficacy of PD-1 or PD-L1 inhibitors and PD-L1 expression status in cancer: meta-analysis. BMJ (2018) 362:k3529. doi: 10.1136/bmj.k3529
39. Tong M, Wang J, He W, Wang Y, Pan H, Li D, et al. Predictive biomarkers for tumor immune checkpoint blockade. Cancer Manag Res (2018) 10:4501–7. doi: 10.2147/cmar.s179680
Keywords: EVA1B, prognosis, glioma, biomarker, microenvironment
Citation: Qu S, Liu J and Wang H (2021) EVA1B to Evaluate the Tumor Immune Microenvironment and Clinical Prognosis in Glioma. Front. Immunol. 12:648416. doi: 10.3389/fimmu.2021.648416
Received: 31 December 2020; Accepted: 15 March 2021;
Published: 06 April 2021.
Edited by:
Barbara Rolfe, The University of Queensland, AustraliaReviewed by:
Gary Kohanbash, University of Pittsburgh, United StatesTiziana Schioppa, University of Brescia, Italy
Copyright © 2021 Qu, Liu and Wang. This is an open-access article distributed under the terms of the Creative Commons Attribution License (CC BY). The use, distribution or reproduction in other forums is permitted, provided the original author(s) and the copyright owner(s) are credited and that the original publication in this journal is cited, in accordance with accepted academic practice. No use, distribution or reproduction is permitted which does not comply with these terms.
*Correspondence: Huafu Wang, aHVheXVhbmx1NDAyQDEyNi5jb20=; Shanqiang Qu, cXVzaHEzQDE2My5jb20=
†ORCID: Huafu Wang, orcid.org/0000-0001-9894-9860
Shanqiang Qu, orcid.org/0000-0002-2709-0101