 M. Ursula Norman
 Zachary Chow
 Sarah L. Snelgrove
 Peemapat Prakongtham
 Michael J. Hickey
- Centre for Inflammatory Diseases, Department of Medicine, Monash Medical Centre, Monash University, Clayton, VIC, Australia
The presence of regulatory T cells (Tregs) in skin is important in controlling inflammatory responses in this peripheral tissue. Uninflamed skin contains a population of relatively immotile Tregs often located in clusters around hair follicles. Inflammation induces a significant increase both in the abundance of Tregs within the dermis, and in the proportion of Tregs that are highly migratory. The molecular mechanisms underpinning Treg migration in the dermis are unclear. In this study we used multiphoton intravital microscopy to examine the role of RGD-binding integrins and signalling through phosphoinositide 3-kinase P110δ (PI3K p110δ) in intradermal Treg migration in resting and inflamed skin. We found that inflammation induced Treg migration was dependent on RGD-binding integrins in a context-dependent manner. αv integrin was important for Treg migration 24 hours after induction of inflammation, but contributed to Treg retention at 48 hours, while β1 integrin played a role in Treg retention at the later time point but not during the peak of inflammation. In contrast, inhibition of signalling through PI3K p110δ reduced Treg migration throughout the entire inflammatory response, and also in the absence of inflammation. Together these observations demonstrate that the molecular mechanisms controlling intradermal Treg migration vary markedly according to the phase of the inflammatory response.
Introduction
CD4+ regulatory T cells (Tregs) are recognized for their capacity to control inappropriate activity of the immune system both systemically, and in peripheral sites (1–3). While Tregs have powerful systemic effects, in many cases suppression of inflammation in the periphery is dependent on the local actions of Tregs in these sites. A growing body of evidence indicates that the actions of these cells are of particular relevance in the skin. A high proportion of circulating Tregs express adhesion molecules and chemokine receptors used by immune cells for skin entry (4, 5). Also, healthy skin in humans and mice contains numerous Tregs, predominantly restricted to the dermis (6–9). In patients affected by Treg dysfunction, the skin is one of the organs severely affected by uncontrolled inflammation (10). Moreover, in models of skin inflammation, Tregs accumulate in the skin and selective inhibition of their homing to, or retention in, the skin results in uncontrolled skin inflammation (1, 2, 4, 6, 11, 12). Despite this, little is known about the behaviour of Tregs within the skin. We have previously used intravital multiphoton microscopy (MP-IVM) to demonstrate that in the absence of inflammation, most Tregs are static, but that upon induction of inflammation, many Tregs become highly migratory. Notably, Treg migration remains increased after the inflammatory response has resolved (6, 13). While studies of conventional effector CD4+ T cells in models of skin infection have demonstrated that efficient intradermal migration is critical for effective anti-microbial function (14), the requirement for Treg migration throughout the skin in resolution of skin inflammation is unclear. To test this idea, it is first necessary to understand the molecular basis of this response.
Interstitial immune cell migration is controlled by cell surface molecules as well as intracellular molecular pathways. Previous intravital imaging studies of effector Th1 and Th2 CD4+ T cells in the skin demonstrated a key role for the Arg-Gly-Asp (RGD)-binding αv integrin, partnered with either the β1 or β3 integrin, in facilitating their migration in the inflamed dermis (14, 15). Whether Tregs, as a CD4+ subset, also utilize RGD-binding integrins for motility in inflamed skin is unknown. The αv integrin is highly expressed on Tregs in inflamed tissues (16). However, investigation of its contribution to Treg accumulation in inflammatory responses in the brain and colon has shown divergent results. Absence of the αv integrin impaired the capacity of Tregs to accumulate in the colon and reverse colonic inflammation, while in the brain this integrin was not required for Treg accumulation or anti-inflammatory function (16). The role of the RGD-binding integrins in Treg migration in skin is yet to be explored.
Treg motility and localisation can also be influenced by intracellular signalling pathways activated via the T cell receptor (TCR), particularly those of the phosphoinositide 3-kinase (PI3K) lipid kinase family. The PI3K p110δ subunit activated in response to TCR-mediated antigen recognition, co-stimulatory CD28 receptor ligation and ICOS-ICOS ligand interactions, plays numerous roles in T cells, including in promotion of migration (17–19). In Tregs, PI3K p110δ is critical for Treg suppressor function and peripheral tissue homing (20–23). Inhibition of PI3K p110δ also reduces the recruitment of Tregs into tissue driven by recognition of cognate antigen presented by endothelial cells (24). However, the contribution of this signalling pathway to interstitial migration of Tregs following their entry into tissue is unknown. Therefore, the overall aim of this study was to investigate the molecular mechanisms that control Treg interstitial migration in the skin. Using MP-IVM, we found that RGD-binding integrins contributed to intradermal Treg migration to variable degrees, according to the phase of the inflammatory response, while signalling through the PI3K p110δ subunit was important for Treg motility under both resting and inflamed conditions.
Materials and Methods
Mice
Experiments were conducted using eight- to 12-week-old male B6N.129(Cg)-Foxp3tm3Ayr/J (Foxp3-GFP) mice, were bred in-house under specific pathogen-free conditions. All animal experiments were approved in advance by the Monash Medical Centre Animal Ethics Committee B.
Antibodies and Reagents
All antibodies were purchased from either BD Biosciences or Biolegend. For analysis of integrin expression on leukocytes extracted from skin samples or draining lymph nodes (dLNs), cells were stained with a Live/Dead Fixable Near-IR Dead Cell Stain Kit (Invitrogen) and anti-CD45 (clone 30-F11), anti-CD4 (clone GK1.5), anti-CD8 (clone 53-6.7), anti-CD103 (clone M290), anti-αV integrin (clone HMa5-1 and RMV-7), anti-β1 integrin (clone HMb1−1); anti-β3 integrin (clone 2C9.G2), anti-ICOS (clone 7E.17G9), anti-CD69 (clone), anti-CD62L (clone MEL-14) and anti-CD44 (clone IM7). For in vivo function-blocking experiments, 25 µg of the following azide-free, low endotoxin, antibodies (all from Biolegend) were injected intradermally 2 hours prior to imaging: anti-αV (clone HMa5-1) and anti-β1 (clone HMb1-1, 5 x 10 µL in a 10 x 20 mm region of skin). Control mice received the same amount of non-specific isotype control antibodies (Armenian Hamster IgG).
Oxazolone Induced Model of Contact Sensitivity
Oxazolone-induced contact hypersensitivity (CS) inflammatory response was induced as previously described (6, 13, 25). To initiate CS, mice were sensitized by application of 50 µL of 5% oxazolone (Sigma-Aldrich, St Louis, MO) dissolved in acetone/olive oil (4:1) to a shaved area on the back. Five to seven days later, mice were challenged with 50 µL of a 1% oxazolone/acetone/olive oil solution to a shaved area (1 x 2 cm) on the right abdominal flank skin. Multiphoton imaging was performed in untreated mice as well as at 24, 48, 72 hours (h) and 6 days post challenge.
IC-87114 Treatment
The selective p110δ inhibitor, IC-87114 (Santa Cruz Biotech) was injected i.p. (15 mg/kg in 10% DMSO in sterile saline) into either untreated, irritant-treated, or 24 h and 48 h CS-challenged mice (17). Control mice received 10% DMSO in saline.
RGD Peptide Treatment
Two hours prior to imaging, mice were injected intradermally with RGD or control RAD peptide (50 µg, Mimotopes Pty Ltd) in 50 µL sterile saline (5 x 10 µL injections) in flank skin.
Innate Skin Inflammation
Two models of innate skin inflammation were examined. The innate inflammatory response to hapten was examined by application of 1% oxazolone (in acetone/olive oil vehicle) to the flank skin of naïve Foxp3-GFP mice and MP-IVM performed at 24 hours post challenge. Alternatively, inflammation was induced using Croton oil (CO). CO-induced skin inflammation was initiated by application of 50 μL of 2% CO oil (v/v in acetone) to a shaved area (1 x 2 cm) of the abdominal flank (26, 27). As a measure of inflammation in these experiments, ear swelling was assessed following application of 20 µL of 2% CO in acetone vehicle to one ear and 20 µL of vehicle alone to the contralateral ear. Ear thickness was measured using a micrometer and swelling expressed as the difference between challenged and control ears.
Multiphoton Microscopy of the Flank Skin
Flank skin was prepared for multiphoton microscopy as previously described (6). Briefly, mice were anesthetized by i.p. injection of 150 mg/kg ketamine hydrochloride (Troy Laboratories, Smithfield, NSW, Australia) and 10 mg/kg xylazine (Pfizer, West Ryde, NSW, Australia) and the right jugular vein cannulated for the administration of further anesthetic. The body temperature of the mice was maintained by a heat pad. The hair from the previously shaved, challenged area of flank skin was further removed by brief treatment with depilatory cream (Nair). A midline incision was made in the abdominal skin and the flank skin extended over a heated pedestal with the epidermal side facing up. The exposed area was immersed in saline and enclosed with coverslip held in place by vacuum grease.
Skin MP-IVM was performed with an Olympus FVMPE-RS microscope equipped with a 25 x 1.05 NA lens, four non-descanned detectors and a multiphoton laser (Insight X3, Spectra Physics). Experiments were performed at 900 nm excitation. Images were collected at a resolution of 512 x 512 pixels, 2 µm z step size, to depths of 100-150 µm, acquired every 60 seconds for a total of 30 minutes per recording. Typical experiments involved 3 recordings of non-overlapping regions of the flank skin.
Image Analysis
Treg behaviour was analysed using Imaris image analysis software (Bitplane, Zurich, Switzerland). Treg abundance was calculated by counting Tregs in 2-3 randomly-selected regions of the dermis. Data were averaged and expressed as cells/mm3. Migration was tracked using the surfaces tool applied to individual Tregs and track displacement (µm), mean velocity (µm/min) and confinement (displacement divided by the total track length) determined. In order to qualitatively describe Treg migratory behaviour, mean velocity for individual cells was plotted against confinement as previously described (28). This plot is subdivided into quadrants based on a threshold migration velocity of 2 µm/min, which defines cells that move more than one cell width from their point of origin during the period of observation, and a threshold confinement ratio of 0.2 which characterizes cells more likely to migrate in a directed manner (28). Dermal collagen fibre density, as determined from second harmonic generation (SHG) signal intensity, was examined at a single time point extracted from the same recordings, as previously described (14). Images were cropped to a 150 µm x 150 µm region of the image stack to exclude hair follicles and SHG signal in captured images analysed using the FIJI image analysis software determining the average SHG signal intensity.
Flow Cytometric Analysis of Skin Tregs
To analyse immune cells from abdominal skin, flank skin of untreated or challenged (24 or 48 h CS) Foxp3-GFP mice was shaved and cleaned with 70% ethanol. A 1 x 2 cm region of skin was excised and placed into a Liberase TL (0.25 mg/mL, Roche)/DNase I recombinant, RNase-free (0.5 mg/mL, Roche) in RPMI 1640 (Gibco Cell Culture Media) 10% FCS solution. Skin was incubated for 60-90 minutes at 37°C in a cell culture incubator (5% CO2). EDTA (25 mM) was added to stop the digestion and the skin gently macerated with scissors. Digested tissue was washed 2x with complete RPMI and filtered sequentially through 70 µm and 40 µm EASYstrainer cell strainers (Greiner Bio-One International) to generate a single cell suspension. All cell staining was completed in MACs buffer (0.5% BSA, 2 mM EDTA in PBS). For flow cytometry, cells were analysed on a BD LSR Fortessa X-20 and data analysed with FlowJo software.
Statistics
GraphPad Prism software was used for all statistical analysis. Unpaired 2-tailed t tests (Mann-Whitney) were used for comparison of groups, while one-way ANOVA (Kruskal-Wallis tests with Dunn’s test correction for multiple comparisons) was used to compare three or more groups.
Results
During CS, Tregs in Flank Skin Dermis Are Predominantly Found in Persistent Clusters of Highly Migratory Cells
We have previously used MP-IVM of flank skin of Foxp3-GFP mice to show that Tregs in the skin are mostly non-motile and located in the dermis adjacent to hair follicles (6). Induction of CS leads to increased Treg abundance in the skin as well as an increase in the proportion of Tregs undergoing migration (6). In the present study, we examined this response in greater detail, demonstrating that the increase in migratory behaviour extends to at least 3 days post challenge, with Treg migration returning to basal levels by 6 days post-challenge (Figures 1A, B, Supplementary Videos 1, 2). The proportion of motile Tregs, defined as having an average speed ≥ 2 µm/min, increased from 8.5% in untreated skin to greater than 50% 24 hours post challenge (Figure 1C). This increase in motility was maintained through to 72 hours (Figure 1B). The majority of the Tregs migrated within a 50 µm radius of hair follicles and sometimes traversed completely around the follicle. Small clusters of Tregs around hair follicles were already apparent 24 hours post CS challenge (Figure 1A, panel 2) and these became more prevalent and more densely packed with cells 48 and 72 hours post CS challenge (Figure 1A, panels 2-4). These clusters were highly dynamic with Tregs migrating into, within and out of these areas (Supplementary Videos 1, 2), in behaviour similar to what has been previously described for HSV-specific CD4+ T cells in virus-infected skin (29). Six days after CS challenge, Tregs were still present in diffuse clusters surrounding hair follicles but the majority of these Tregs were not motile (70% immotile – Figure 1C).
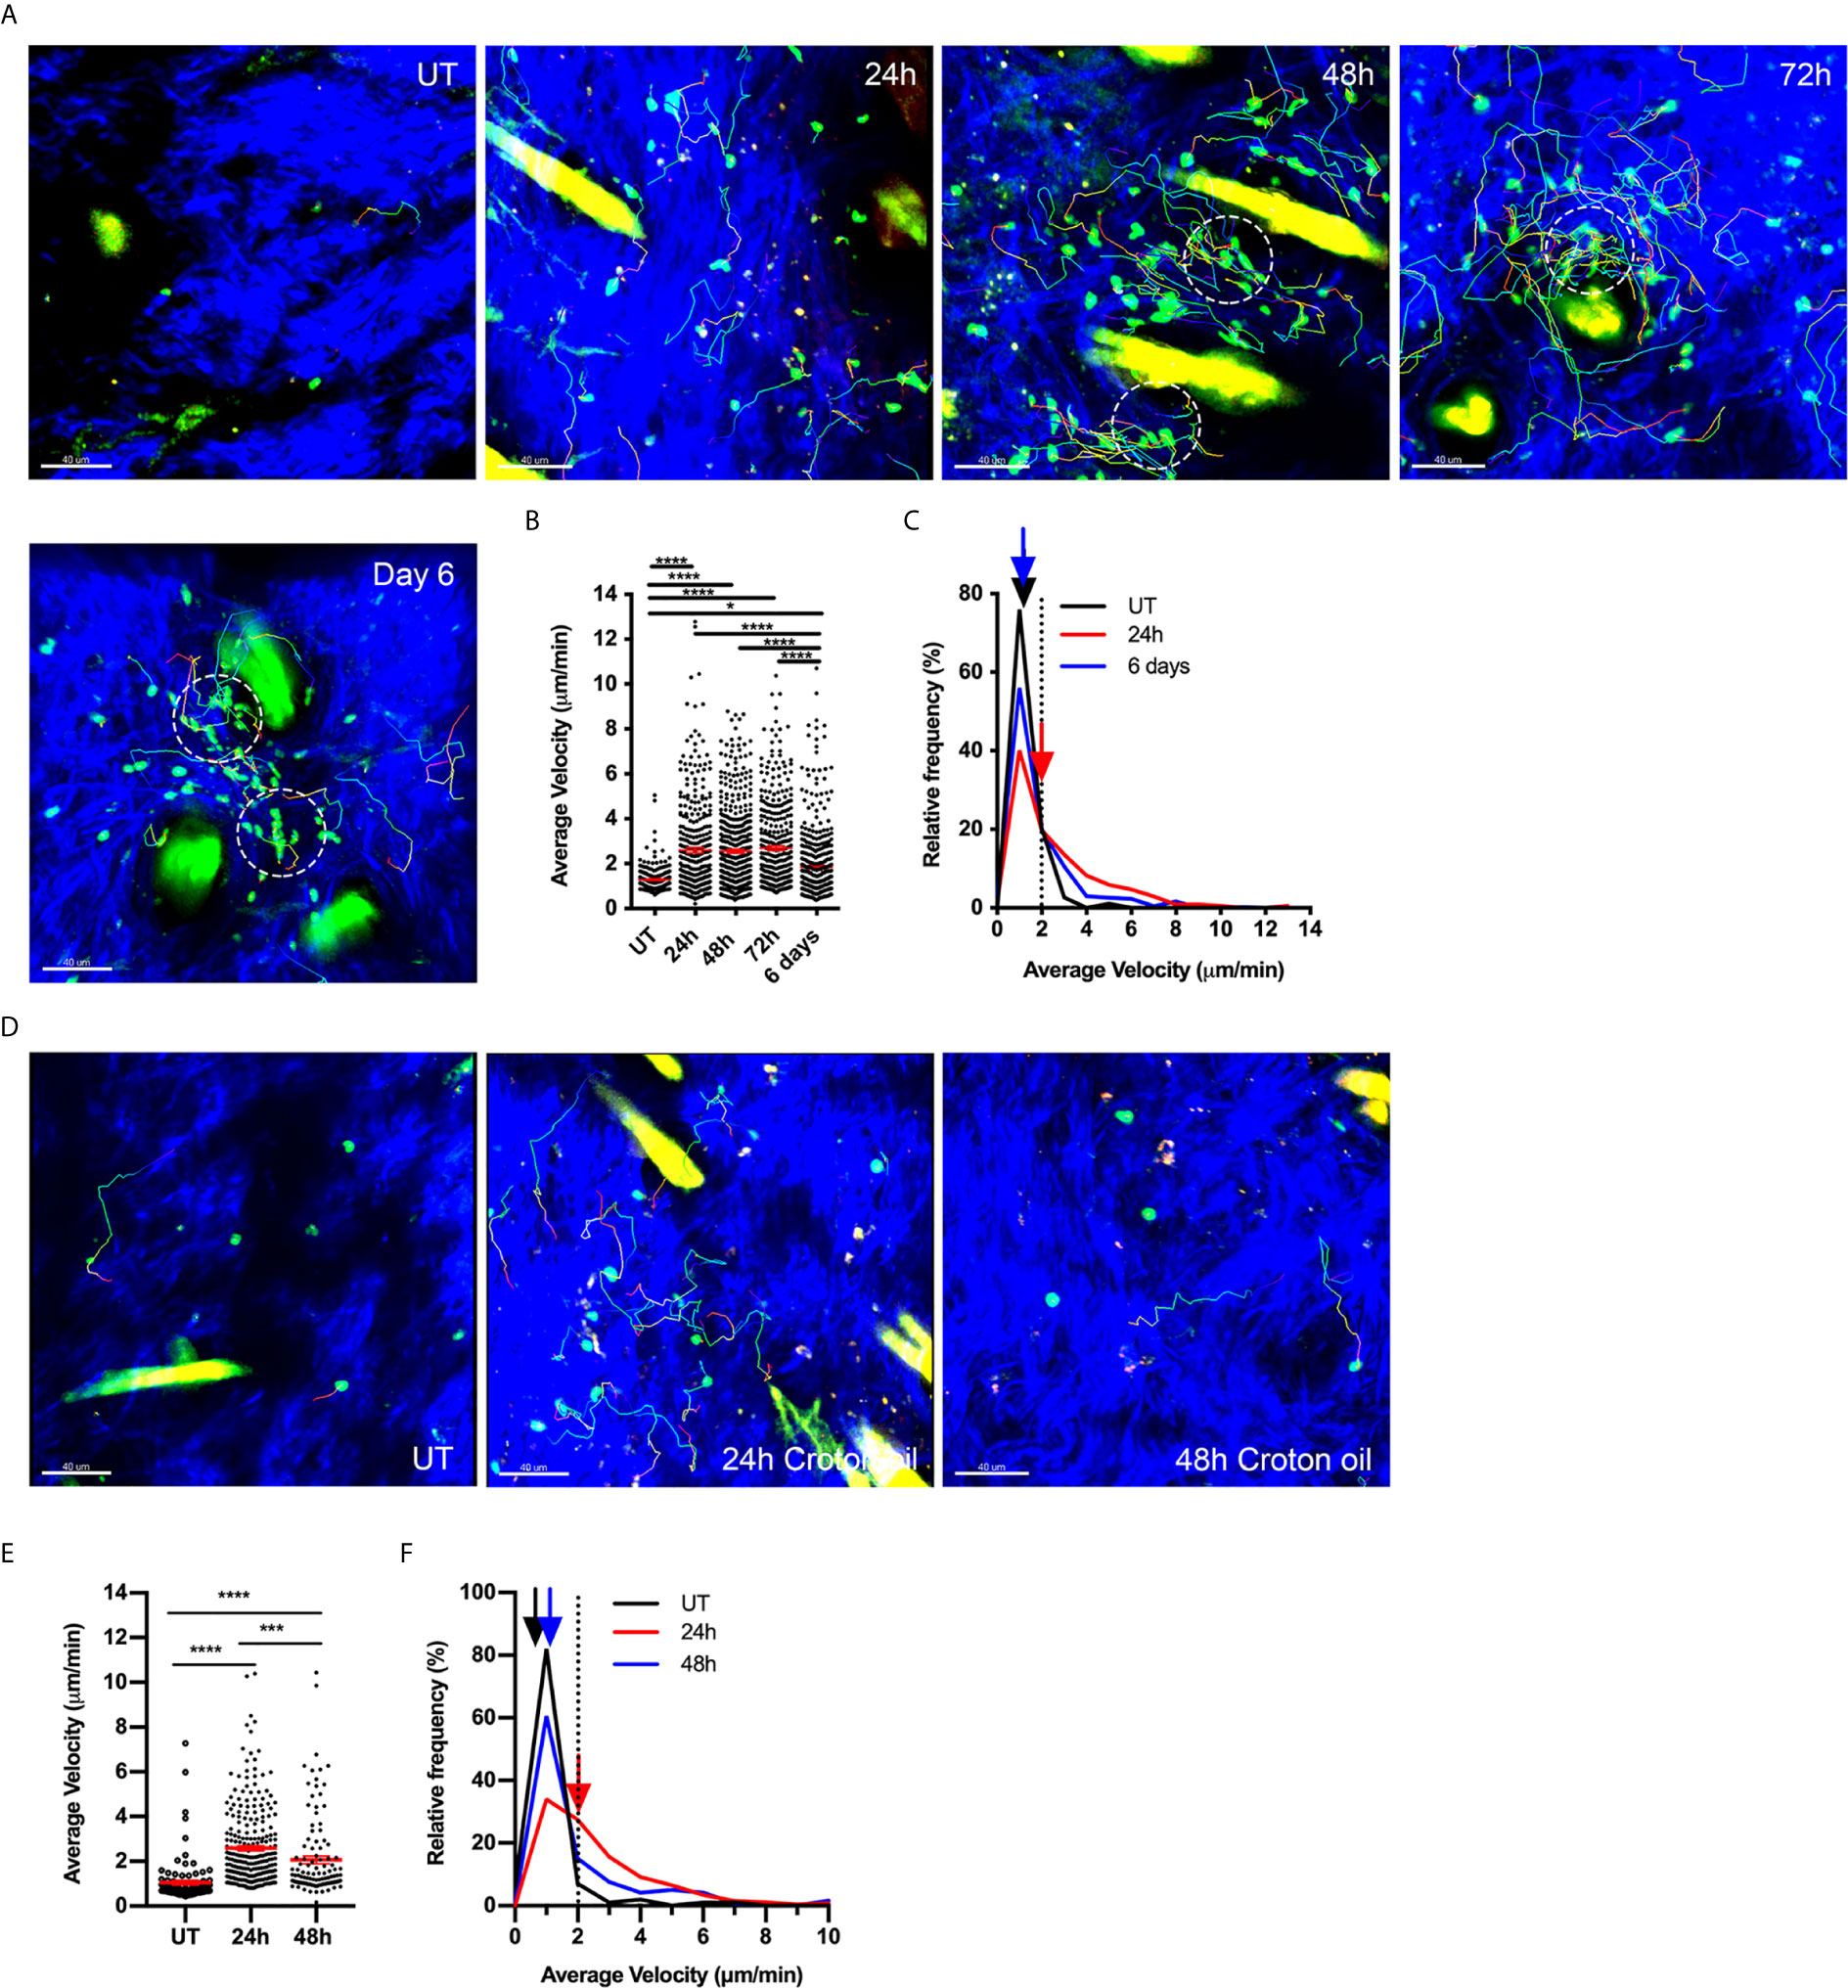
Figure 1 Tregs increase migration around hair follicles in response to both adaptive and innate stimuli. (A–C) Effects of CS response on Treg migration. Treg motility in the flank skin was examined in Foxp3-GFP mice using MP-IVM in either untreated (UT) skin, or over a time course of CS-induced inflammation. (A) MP-IVM images of the dermis of Foxp3-GFP mice showing the paths of migration (multicoloured) of GFP+ Tregs (green) in UT mice, and CS mice 24, 48, 72 h and 6 days after challenge. Scale bars - 40 µm. Collagen fibres (blue) are visualized by secondary harmonic signal (SHG). Dotted circles denote intradermal clusters of Tregs. (B) Alterations in Treg migration velocity over a time course of CS. Data show velocities for individual Tregs as well as group mean ± sem. (C) Relative frequency distribution of the average velocity of individual Tregs from UT, 24 h or 6 days post CS challenge. Arrows indicate the median velocity, and the dotted line indicates the 2 µm/min motility threshold. (D–F) Treg migratory response in innate skin inflammation induced by Croton oil (CO). (D) MP-IVM images of intradermal Treg migration paths in Foxp3-GFP mice undergoing CO-induced inflammation, showing example images from untreated skin (UT), and 24 & 48 h post CO application. Scale bars - 40 µm (E) Alterations in Treg migration velocity during CO-induced inflammation. Data show velocities for individual Tregs as well as group mean ± sem. (F) Relative frequency distribution of the average velocity of individual Tregs from UT, 24 or 48 h CO-treated mice. Arrows indicate the median velocity, and the dotted line indicates the 2 µm/min motility threshold. All data are shown as mean ± SEM from 3-6 mice/group. Data were analysed using a Kruskal-Wallis test with Dunn’s multiple comparison tests between all timepoints. *p < 0.05, ***p < 0.001, ****p < 0.0001 for comparisons shown.
To assess whether this persistence in Treg migration also occurs in an innate form of inflammation, we examined intradermal Treg migration in skin challenged with CO. CO application to flank skin induces an irritant response characterised by neutrophil and monocyte influx (30). Here we observed that CO induced a significant increase in Treg motility within the skin within 24 hours (Figures 1D–F). However, this behaviour did not persist for as long as in CS, as by 48 hours post CO application, the velocity and proportion of motile Tregs were approaching levels in untreated skin (Figures 1E, F), despite inflammation, as shown by ear swelling, persisting at this time point (Supplementary Figure 1A). Moreover, CO did not induce Treg clustering (Figure 1D) or recruitment of Tregs into the skin (Supplementary Figure 1B). Together these findings indicate that antigen-driven inflammation induces persistent changes in intradermal Treg migration and clustering while the effects of an innate stimulus on Treg motility are more subtle and less prolonged.
CS Alters the Distribution of Dermal Collagen
Inflammation of the skin is associated with changes to extracellular matrix (ECM) composition and structure, with decreases in the density of connective fibres associated with increased CD4+ T cell motility within the dermis (14). The intensity of the SHG signal arising from multiphoton imaging can be used to assess changes in the organisation of fibrillar collagen during inflammation (31). Here we used this approach to detect changes in dermal collagen during the CS response. In untreated skin, the SHG signal had a dense mesh-like appearance and covered ~85% of a 150 x150 µm area (xy) of skin (Figures 2A, B). CS-induced inflammation induced changes in collagen organisation, with the fibres being less organised and more loosely-packed. These changes were reflected in a significant reduction in the percentage of area positive for SHG signal over the course of the response, with the lowest signal being observed 48-72 hours post-challenge (Figure 2B). Similar reductions in SHG intensity were observed in the zx cross-sectional skin area. By six days, SHG signal intensity was not significantly different to that seen in untreated skin. These experiments reveal the time course of inflammatory changes in flank dermal collagen during the CS model.
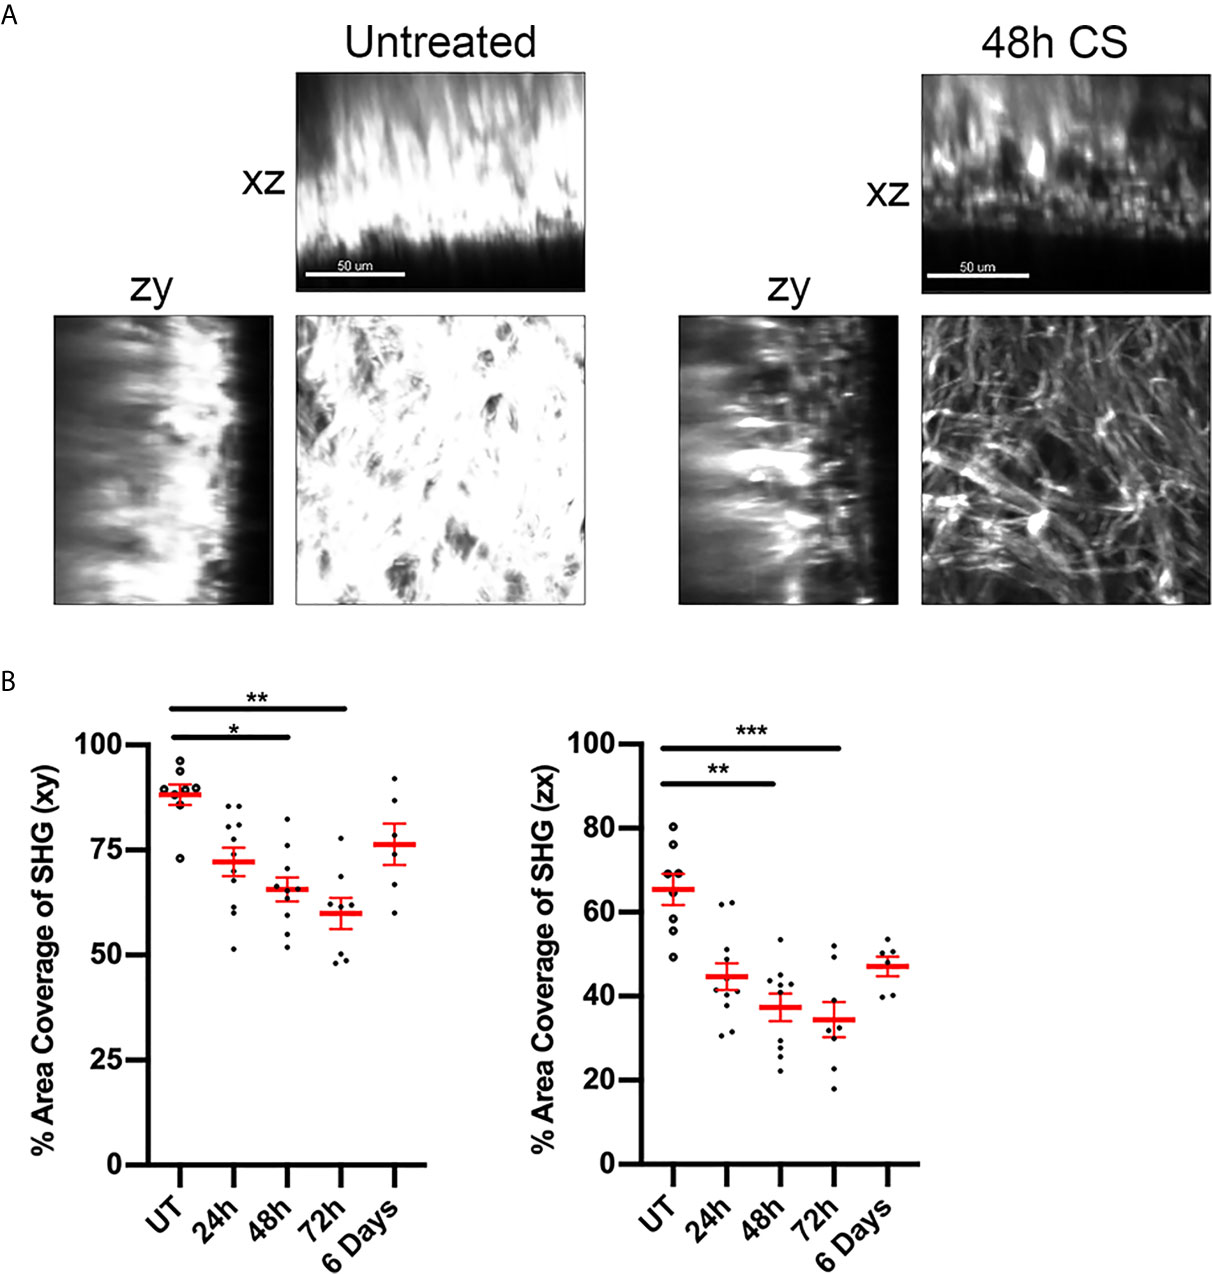
Figure 2 CS alters ECM fibre distribution in flank skin. The effect of CS-induced inflammation on the distribution of dermal collagen fibres was assessed via SHG in MP-IVM experiments. (A) Example images of collagen fibre distribution in untreated skin and at 48 h post CS induction. Images represent single planes from 3D volumes in either the planar (xy), zx or zy planes. Scale bar - 50 µm. (B) Percentage of area filled by SHG signal in or the xy or zx cross sections, taken 60 µm below the skin surface. Data are shown for individual mice and as mean ± SEM from 3-7 mice per group. Data were analysed using Kruskal-Wallis test with Dunn’s multiple comparison. *p < 0.05, **p < 0.01, ***p < 0.001 for comparisons shown.
The Role of RGD-Binding Integrins in Treg Motility Varies During Contact Sensitivity
Migration of effector CD4+ T cells in the inflamed dermis has been shown to be dependent on integrins that bind the RGD motif in fibronectin (14, 32). Moreover, inflammation-induced changes in the structure of dermal collagen correlate with increased levels of fibronectin closely associated with collagen fibres in the skin (32). Therefore, we examined the role of RGD-binding integrins in Treg dermal interstitial migration 24 and 48 hours post CS initiation (Figures 3A–H). Intradermal administration of RGD peptide, which inhibits integrin binding to fibronectin, resulted in the almost complete cessation of Treg migration 24 hours post CS challenge, a response not seen in mice treated with the control RAD peptide (Figures 3A, B, Supplementary Video 3). This was seen as a 2-fold reduction in average Treg migration speed (RGD - 1.4 ± 0.1 µm/min, RAD - 3.0 ± 0.1 µm/min) (Figure 3B), and a shift in the relative frequencies of Treg velocity with 65% of the Treg population in RGD peptide-treated mice displaying speeds below 2 µm/min compared with 20% in RAD peptide-treated mice (Figure 3C). Similarly, the average Treg displacement was significantly reduced (RGD - 7.4 ± 0.7 µm vs. RAD - 25.0 ± 1.4 µm, p<0.0001). This reduction meant that most Tregs in the RGD peptide-treated mice did not move further than one cell distance from their starting position.
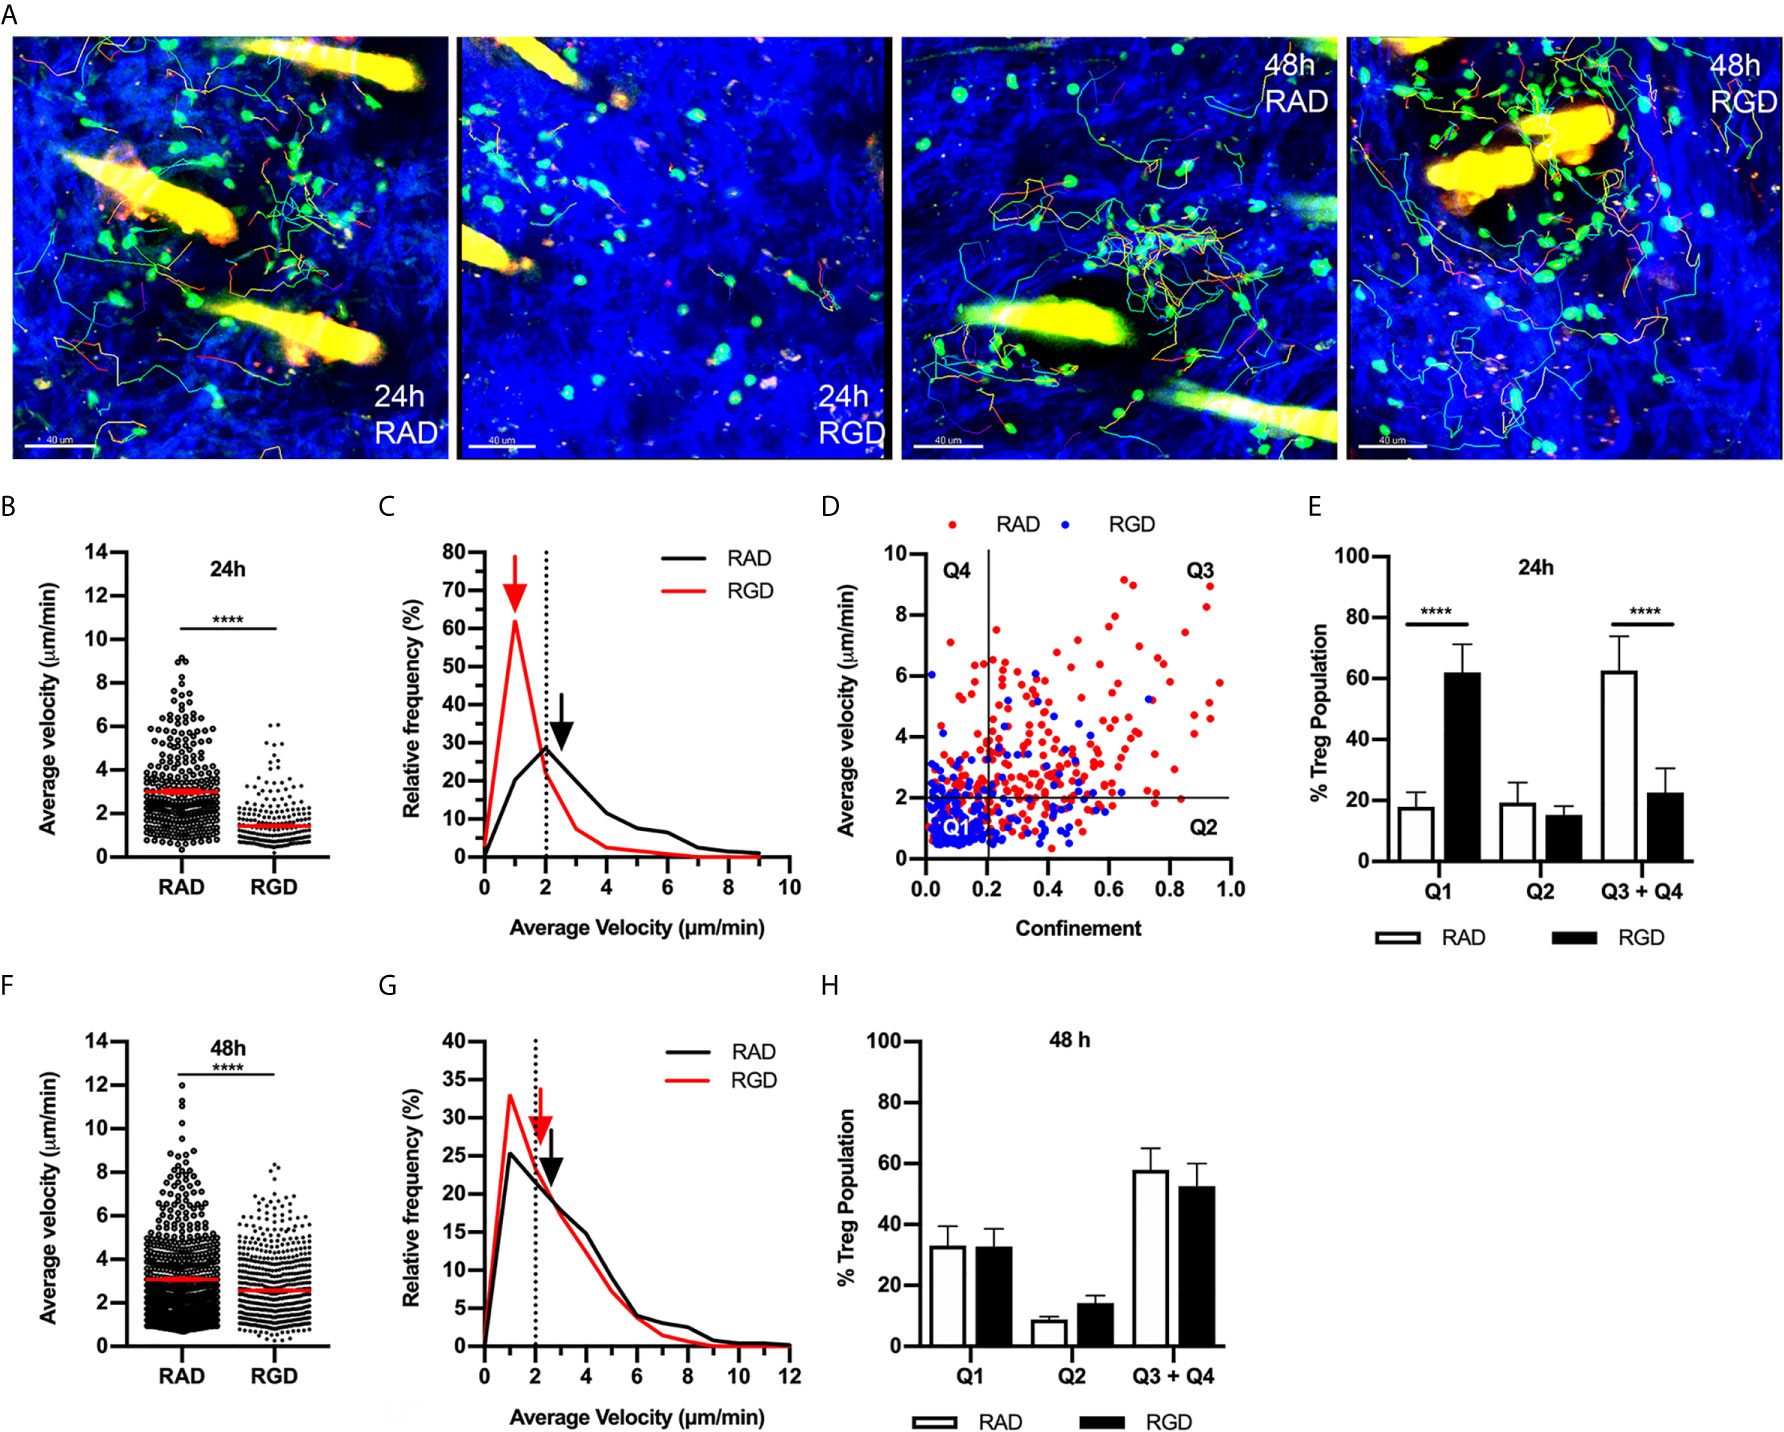
Figure 3 RGD peptide-binding integrins modulate Treg migration during CS. The effect of RGD-binding integrins on Treg migration in CS-inflamed skin was assessed using MP-IVM. Treg migration was examined following i.d. injection of RGD or RAD control peptides 2 h prior to visualization by MP-IVM. (A) MP-IVM images of Treg migration paths in RAD- and RGD-treated Foxp3-GFP mice 24 and 48 h post-CS induction. (B–H) Treg migration in mice treated with either RAD or RGD peptides 24 or 48 h after induction of CS. (B, F) Average velocity of Treg migration 24 (B) and 48 h (F) after induction of CS. Data show velocities for individual Tregs as well as group mean ± sem. (C, G) Relative frequency distributions of the average velocities of individual Tregs from RAD- or RGD-treated mice 24 (C) and 48 h (G) post CS induction. Arrows indicate the median velocity, and the dotted line indicates the 2 µm/min motility threshold. (D) Dot plot distribution of individual Tregs from RAD (red) and RGD (blue)-treated mice at the 24 h CS timepoint, plotted according to average velocity and confinement. (E, H) Distributions of Tregs within the four quadrants plotted for the (E) 24 h and (H) 48 h CS timepoints. Data represent the mean ± SEM of > 250 cells derived from 3-5 mice/group. Quadrant data represent mean ± SEM of data averaged from 3 fields of view (fov)/mouse. Velocity data in (B, F) were compared using Mann-Whitney tests. Quadrant data in (E, H) were assessed using a multiple comparison t test using the Holm-Sidak method (α, 0.05). ****p < 0.0001 for the comparisons shown.
This behaviour was further characterised by plotting the average velocity of individual Tregs against their confinement ratio (straight-line migration distance divided by total track length) (Figure 3D). Using the definition of a migratory Treg as having an average velocity of ≥ 2 µm/min and using a threshold confinement value of 0.2 allows this plot to be subdivided into quadrants that allow qualitative description of different Treg behaviours. Here quadrant 1 (Q1) represents cells that are static (low velocity/low confinement), quadrant 2 (Q2) represents Tregs that display intermittent migration such that their average velocity remains below 2 µm/min, while quadrant 3 (Q3) represents Tregs that display higher velocities and confinement ratios which equate to continuous migration. Finally, quadrant 4 (Q4) represents cells with high migration velocity, but low confinement such that they remain relatively close to their site of origin (Figure 3D). 24 hours post CS, the majority of the Treg population (60%) were in Q3 + Q4, with approximately 20% found in each of Q1 and Q2. At 24 hours CS, treatment with RGD peptide shifted the Treg population from being highly migratory (Q3+Q4) to static (Q1) with no changes to the intermittent migratory population (Q2) (Figure 3E). In contrast, 48 hours post challenge, the impact of RGD peptide treatment was more subtle, inducing a small but significant decrease in Treg average velocity (Figures 3F, G and Supplementary Video 3) and average displacement (RGD - 20.2 ± 1.0 µm vs. RAD - 24.0 ± 1.1 µm, p<0.005). However, this alteration did not change the percentages of Tregs within the different quadrants of the velocity versus confinement plots (Figure 3H). These findings indicate that RGD-binding integrins are critical for Treg migration 24 hours post CS induction, but contribute less to Treg motility at 48 hours.
αv but Not β1 Integrin Contributes to Treg Motility During the CS Response
We next investigated potential RGD-binding integrins responsible for intradermal Treg migration during CS, focusing on the αv integrin found previously to be critical for effector CD4+ T cell migration in inflamed skin (14). αv integrin inhibition at 24 hours CS resulted in significant decreases in Treg average velocity (Figures 4A, B, Supplementary Video 4) and displacement (anti-αv - 17.8 ± 1.6 µm vs. isotype control - 23.8 ± 1.9, p<0.05). The decrease in average velocity was due to a shift in the relative frequency velocity curve with 48% of the Tregs having an average velocity < 2 µm/min compared to 26% in the isotype control group (Figure 4C). Assessment of velocity versus confinement revealed that anti-αv antibody caused a significant reduction in the percentage of Tregs within the highly migratory (Q3+Q4) populations, shifting to the intermittently migratory population (Q2) (Figure 4D). This effect differed from that seen with RGD peptide administration, which caused an increase in the static population at 24 hours CS (Figure 3E). The effect of anti-αv integrin antibody treatment at 48 hours was markedly different from that seen at 24 hours. 48 hours post CS challenge, anti-αv integrin resulted in a subtle but significant increase in Treg velocity (Figures 4E, F and Supplementary Video 4) and total track length (anti-αv – 82.8 ± 2.9 µm vs. isotype control – 69.6 ± 2.5 µm, p<0.005) but not track displacement (data not shown). However, these changes did not change the distribution of cells in the different modes of migratory behaviour (Figure 4G). Taken together these findings indicate that the αv integrin is important for Treg directional migration at 24 hours but not at 48 hours post CS challenge.
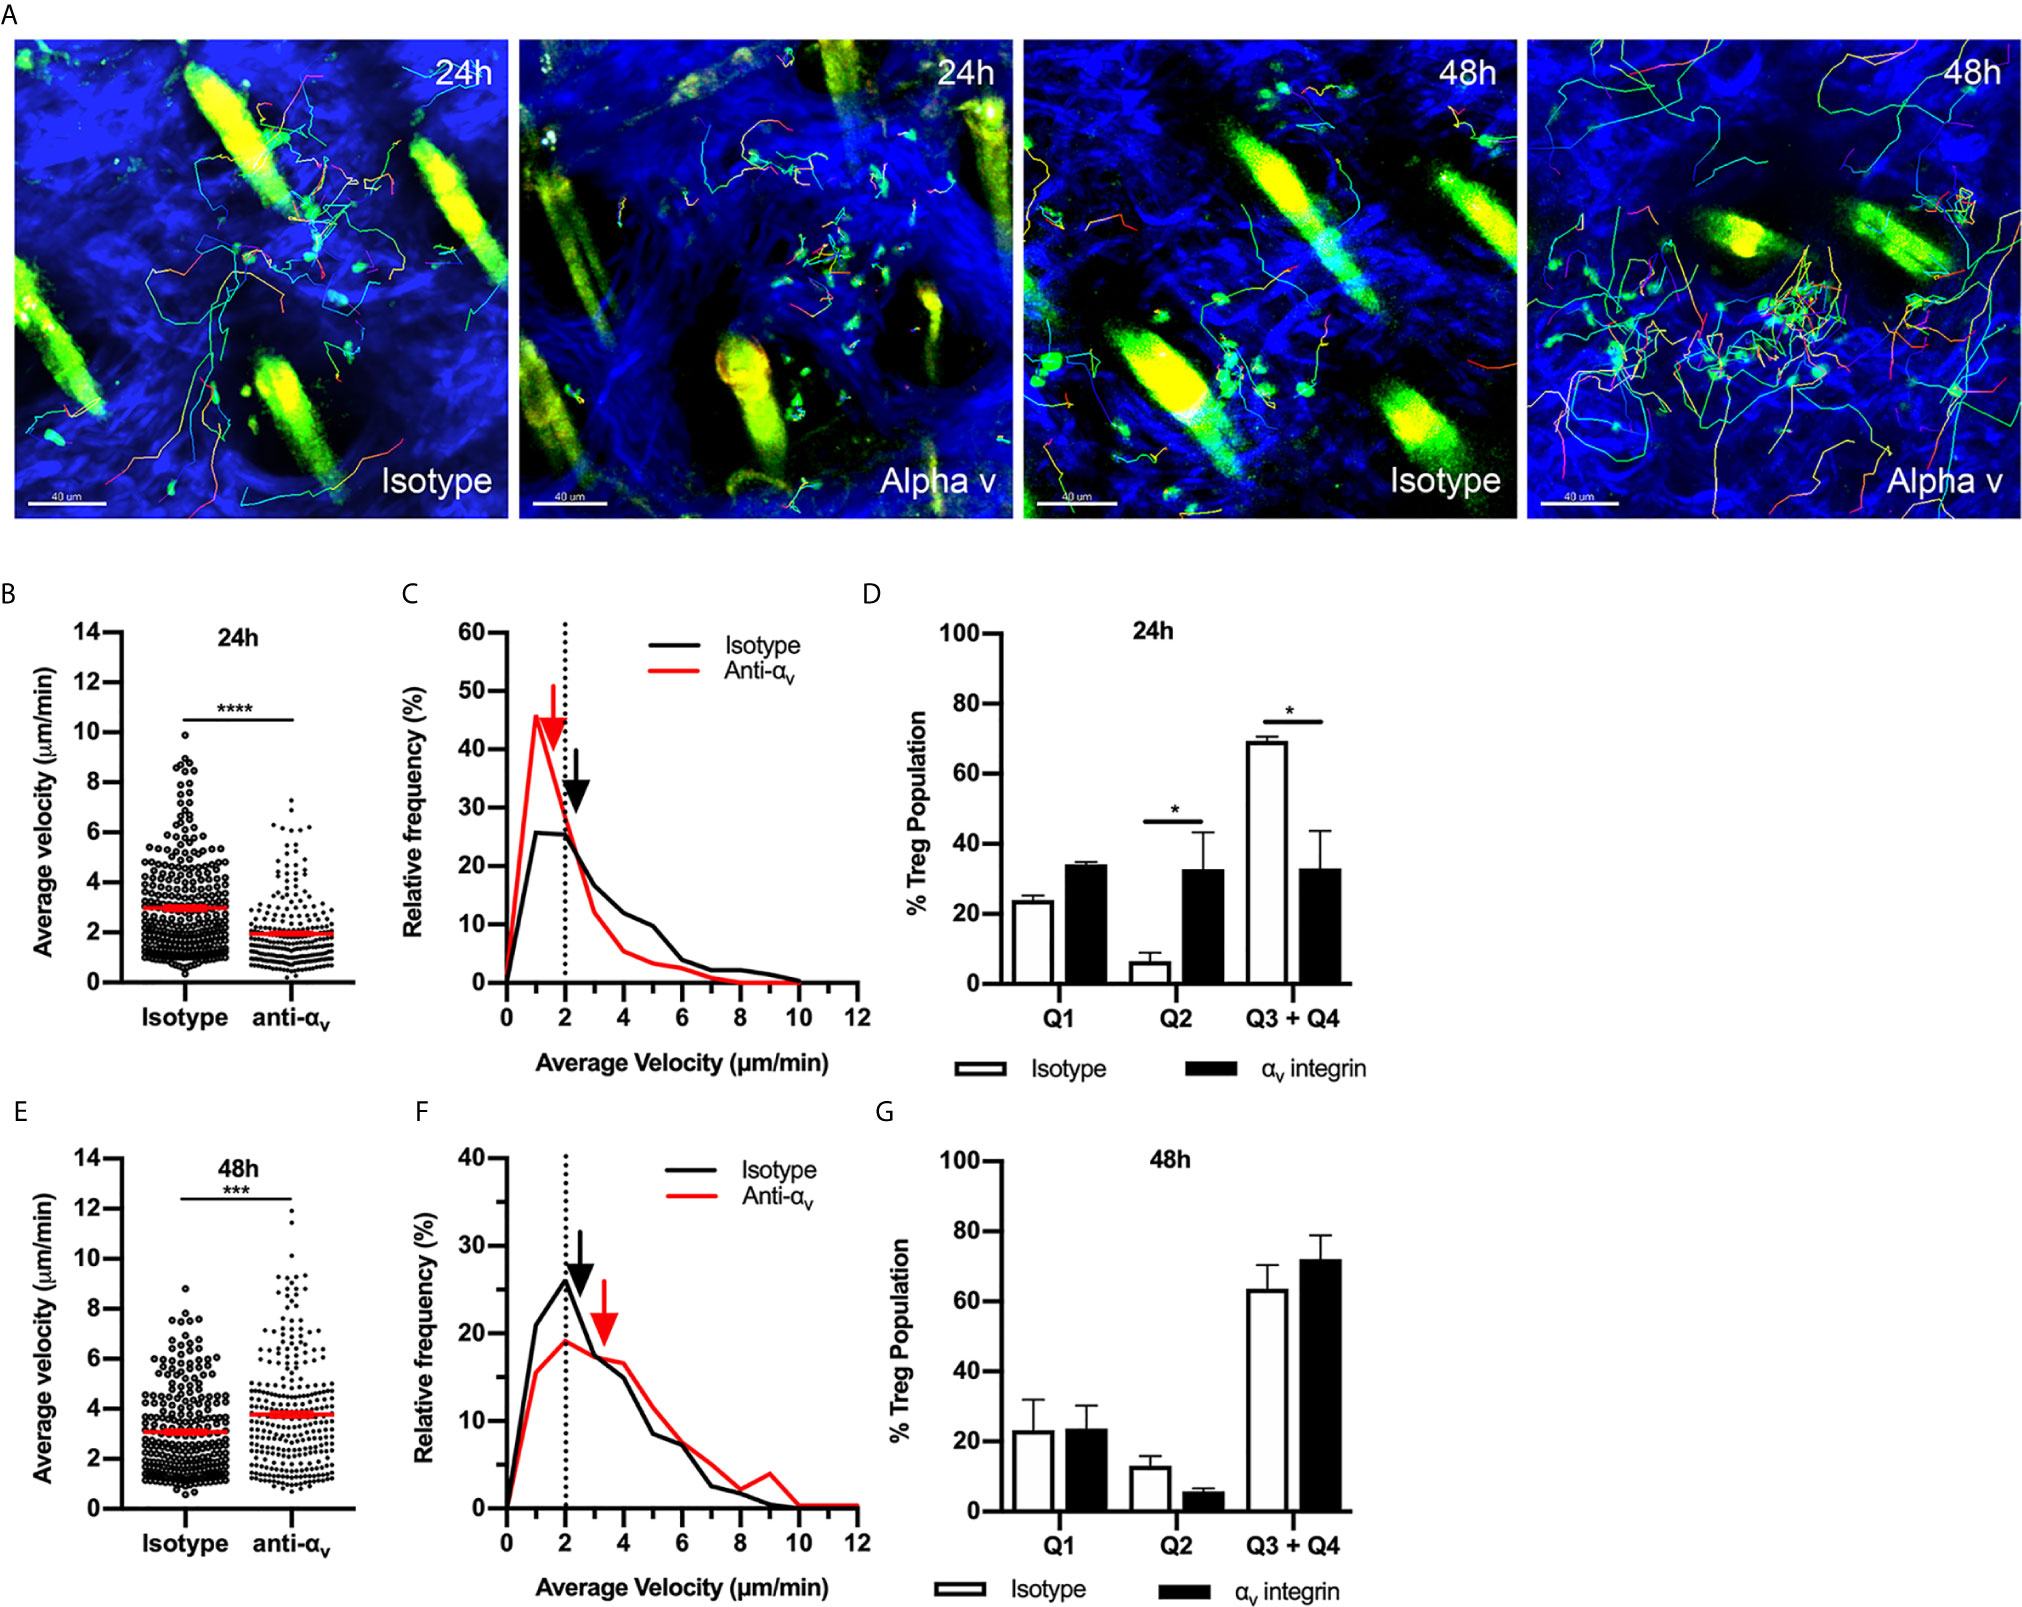
Figure 4 αv integrin has a variable role in Treg migration during CS-induced inflammation. The contribution of the αv integrin to Treg migration in CS-inflamed skin was assessed using MP-IVM of CS-inflamed skin, following administration of anti-αv integrin or isotype control antibodies 2 h prior to visualization by MP-IVM. (A) MP-IVM images of Treg migration paths in Foxp3-GFP mice treated with anti-αv integrin or isotype control antibody at the 24 or 48 h CS timepoints. (B–G) Effect of anti-αv integrin treatment on Treg migration velocity 24 (B) or 48 h (E) after induction of CS. Data show velocities for individual Tregs as well as group mean ± sem. (C, F) Relative frequency distributions of the average velocities of individual Tregs from anti-αv integrin and isotype control antibody-treated mice, shown for 24 (C) and 48 h (F) post-CS induction. Arrows indicate the median velocity, and the dotted line indicates the 2 µm/min motility threshold. (D, G) Distributions of Tregs within the four quadrants of the velocity vs. confinement plots shown for 24 h (D) and 48 h (G) post induction of CS. Data represent the mean ± SEM of > 230 cells derived from 3-4 mice/group. Quadrant data represent mean ± SEM of data averaged from 3 fov/mouse. Data in (B, E) were analysed using Mann-Whitney test. ***p < 0.001, ****p < 0.0001. Quadrant data in (D, G) were compared using a multiple comparison t test using the Holm-Sidak method (alpha 0.05), *p < 0.05 for the comparisons shown.
To assess the possibility that other ECM-binding integrins contribute to Treg migration, we investigated the role of the β1integrin in Treg migration during the CS response. In addition to αv integrin, β1integrin partners with the α chains 1-10, therefore, inhibiting this integrin would interfere with binding to most other ECM molecules in addition to RGD-containing components. 24 hours post CS induction, inhibition of β1integrin antibody did not alter Treg behaviour (Figures 5A–C). In contrast at 48 hours, β1integrin inhibition significantly increased Treg velocity (Figures 5D, E), similar to the effect of αv integrin inhibition at the same time point. However, this increase in average speed was not due to a difference in the percentages of Treg within different quadrants of the velocity vs. confinement plots (Figure 5F). Overall, this indicates that during the early CS response (24 h), αv integrin likely interacts with β3integrin rather than β1integrin to direct Treg migration, while at 48 hours CS, αv together with β1 integrin acts to inhibit Treg movement.
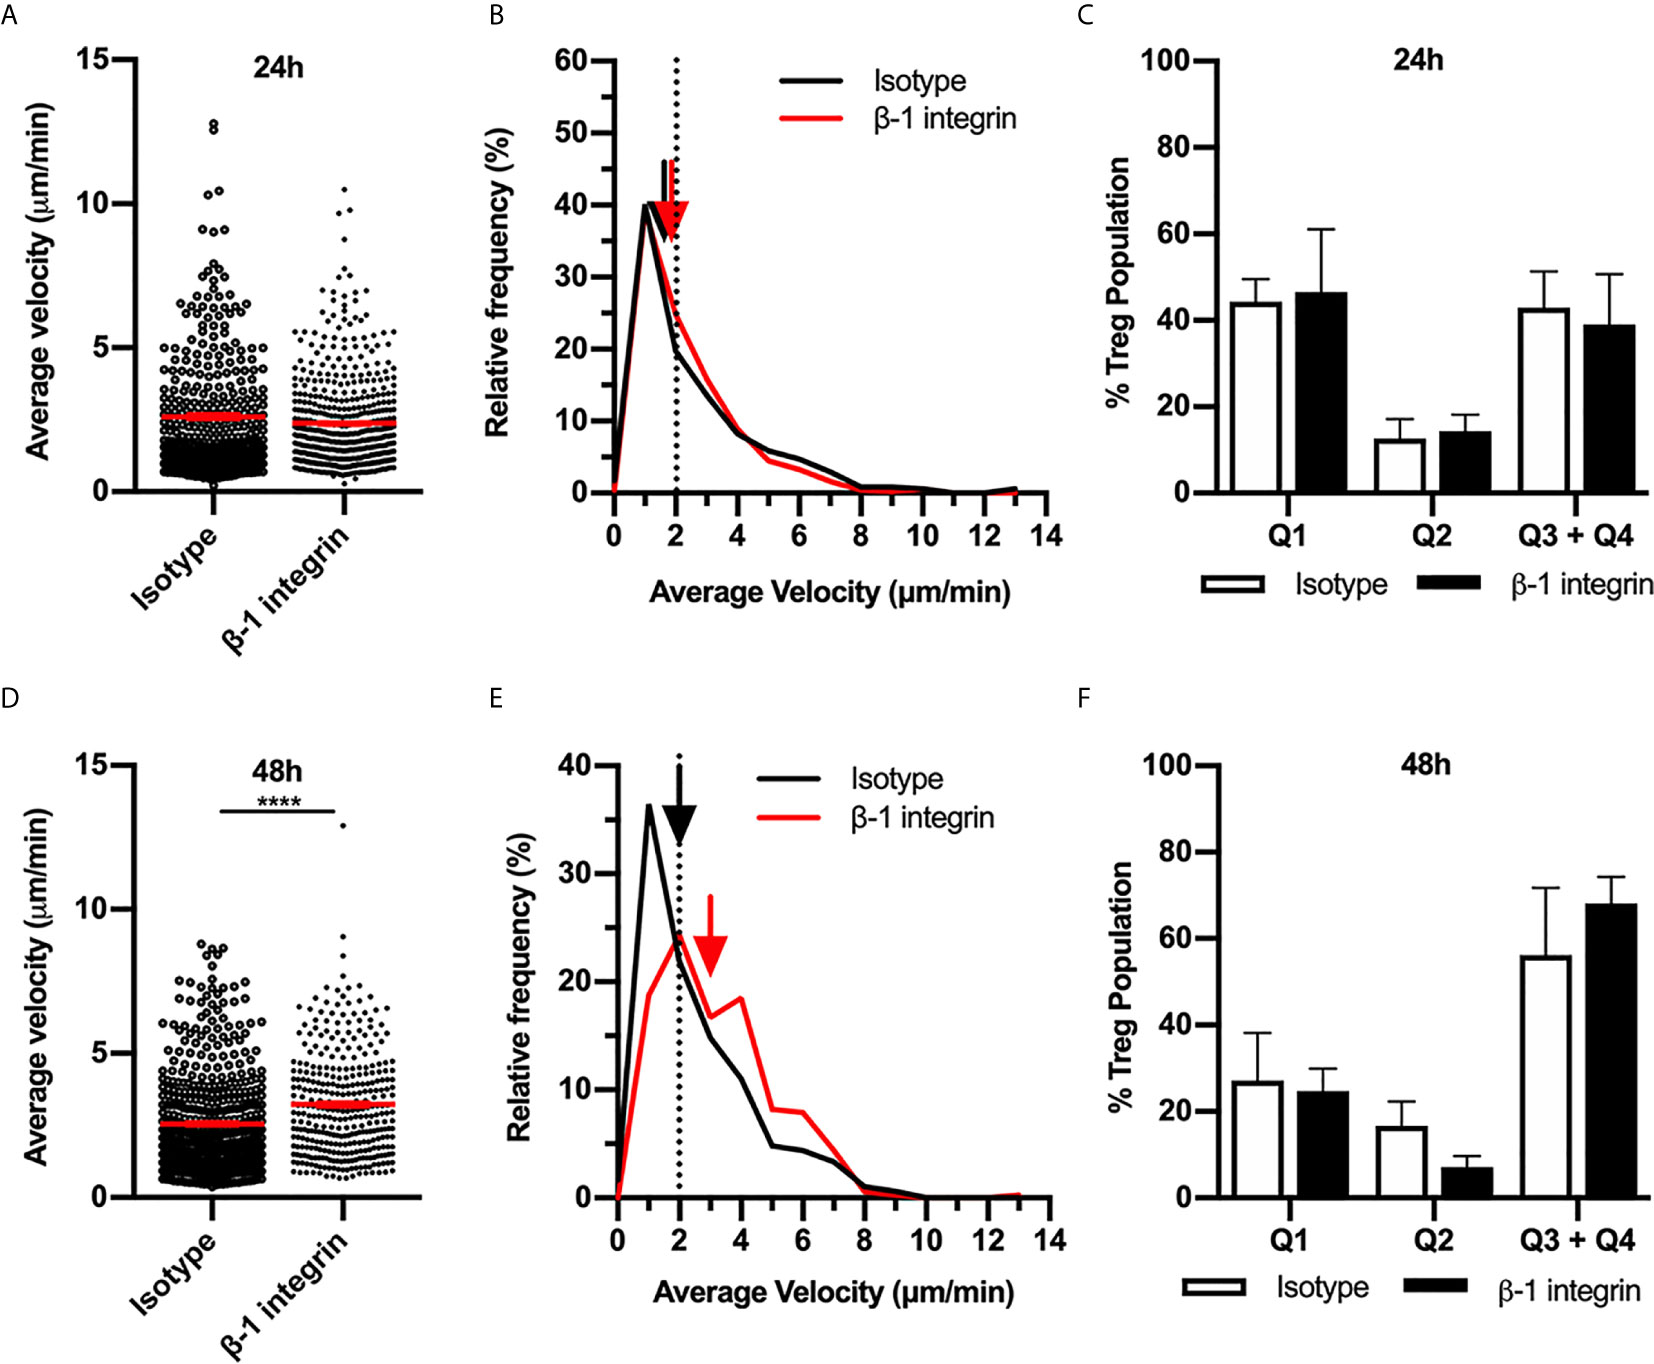
Figure 5 β1 integrin modulates Treg migration speed during 48 h CS-induced inflammation. The contribution of the β1 integrin to Treg migration in CS-inflamed skin was assessed using MP-IVM of CS-inflamed skin following the i.d. injection of anti-β1 integrin or isotype control antibodies 2 h prior to visualization by MP-IVM. Effect of anti-β1 integrin treatment on Treg migration velocity 24 h (A–C) or 48 h (D–F) after induction of CS. (A, D) Treg migration velocity 24 (A) and 48 h (D) post CS induction. Data show velocities for individual Tregs as well as group mean ± sem. (B, E) Relative frequency distributions of the average velocities of individual Tregs from 24 h (B) or 48 h (E) after CS induction. Arrows indicate the median velocity and dotted line indicates the 2 µm/min threshold of motility. (C, F) Distributions of Tregs within the four quadrants of the velocity vs. confinement plots shown for 24 h (C) and 48 h (F) post induction of CS, in anti-β1 integrin vs. isotype control mice. Data represent the mean ± SEM of > 350 cells derived from 3-5 mice/group. Quadrant data represent mean ± SEM of data averaged from 3 fov/mouse. Data in (A, D) analysed using Mann-Whitney test. ****p < 0.0001.
One possible explanation for differences in the functional roles of RGD-binding integrins at different CS timepoints is that Tregs may alter expression of the relevant integrins during the response. To investigate this possibility, we used flow cytometry to examine expression of αv, β1 and β3 integrins on Tregs isolated from flank skin at different stages of the CS response (Figures 6A, B). In uninflamed skin, ~34% of Tregs expressed αv integrin. By comparison, splenic Tregs in non-inflamed mice were comparatively low for αv integrin (10.1 ± 2.1% α v+, mean ± sem, n=4), indicating that elevated αv integrin phenotype is characteristic of Tregs in the skin, and not dependent on inflammatory activation. The proportion of αv+ Tregs in the skin was unaltered at 24 hours CS, but significantly elevated to ~ 47% at 48 hours after CS induction (Figures 6A, B), with this increase also apparent as an increase in the average αv integrin staining intensity (Figure 6B). In contrast, in skin dLNs, αv+ Tregs were very low in abundance under resting conditions (~2% of Tregs), although this increased during CS, being significantly increased, in proportion and expression level, by 48 hours (Figures 6C, D). The β1integrin was expressed at high levels on most skin-derived and dLN Tregs, with no significant differences in expression between uninflamed and CS mice (Supplementary Figures 2A, B). In contrast, β3integrin was expressed by 60-65% of skin-derived Tregs and 40-50% of Tregs from skin dLNs, and inflammation did not alter expression levels in either the skin or skin dLNs (Supplementary Figures 2C, D). These findings indicate that the marked differences in the role of the αv integrin in intradermal Treg migration at different phases of the CS response are not matched by similarly dramatic alterations in expression of this integrin or either of its two main binding partners.
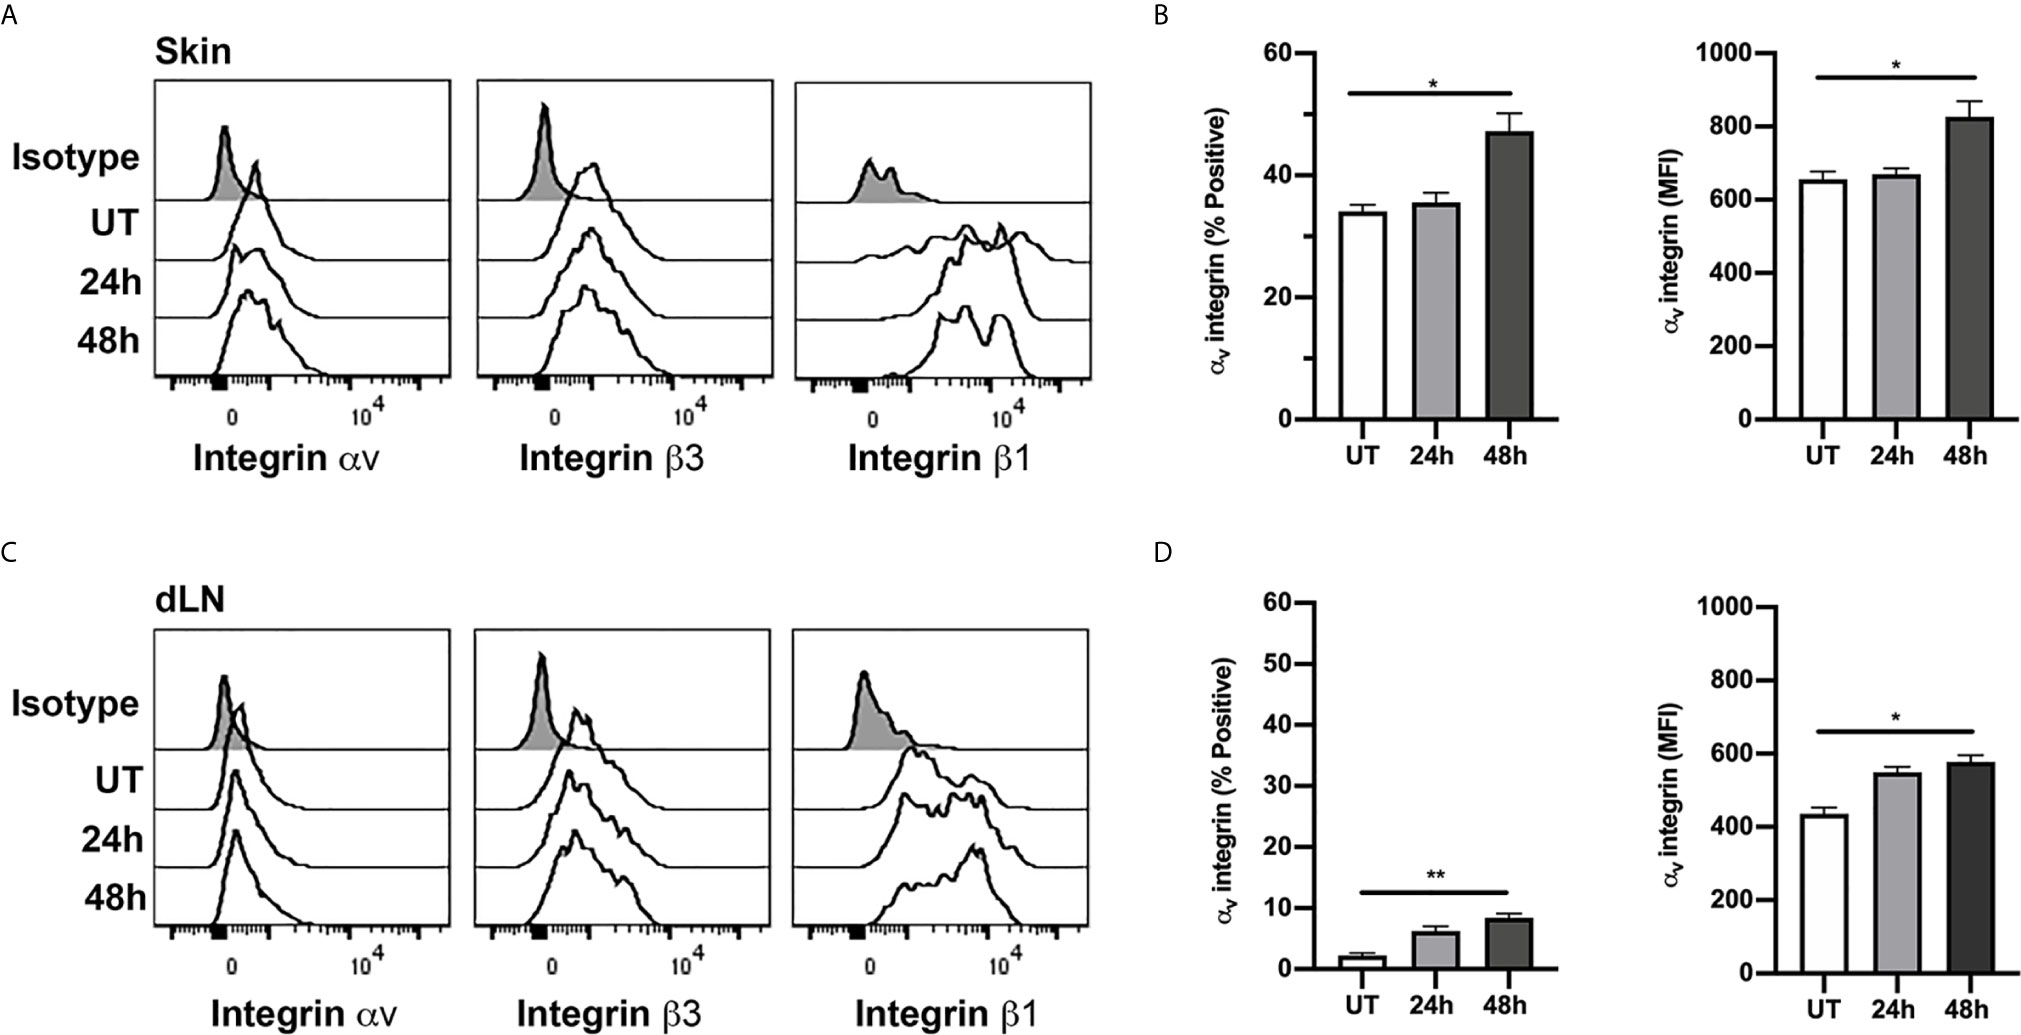
Figure 6 Expression of αv, β1 and β3 integrins on Tregs in skin and dLN. αv, β1 and β3 integrin expression on Tregs from skin and draining lymph nodes (dLN) of untreated (UT) mice, and 24 and 48 h post CS induction was assessed using flow cytometry. (A, C) Example histograms of Tregs from skin (A) and dLN (C) comparing expression of αv, β1 and β3 integrins. Data also shown for isotype control (shaded histograms). (B, D) ⍺v integrin expression on Tregs from skin (B) and dLN (D), shown as % positive and mean fluorescence intensity (MFI) on cells from untreated (UT) mice, and 24 and 48 h post CS induction. Data are shown as mean ± SEM derived from 4 mice/group. Data were evaluated via Kruskal-Wallis test with Dunn’s multiple comparison tests between all timepoints. *p < 0.05, **p < 0.01 for the comparisons shown.
Dermal Tregs Expressing αv Integrin Display a Highly Activated Phenotype
Skin Tregs have previously been reported to display a distinct phenotype, with high expression of activation markers such as CD44 and ICOS as well as a range of adhesion molecules necessary for skin entry (3, 33, 34). This was confirmed here by comparison of CD44 and ICOS expression on dermal Tregs with that on Tregs in the skin dLN (Figures 7A, B). In contrast it was apparent from our assessment of Treg integrin expression that expression of RGD-binding integrins is less uniform within this population. Therefore, we next examined the correlation between expression of αv and β3 integrins and the activation markers, CD44 and ICOS. Comparison of αv+β3+ and αv-β3- Tregs revealed that the αv+β3+ population have a particularly highly-activated phenotype with high expression of CD44 and ICOS, while αv-β3- Tregs displayed intermediate levels of these molecules (Figures 7C–E). This difference was most apparent for CD44 at 24 and 48 hours, and at 48 hours post CS for ICOS. Notably, of the ~2% of αv+β3+Tregs in skin dLN in untreated mice (Figure 6), 25% also display the CD44highICOShigh phenotype (Supplementary Figure 3). Moreover, this percentage increased significantly during inflammation, applying to ~75% of αv+β3+ Tregs 48 hours post CS challenge (Supplementary Figure 3D). Also, the total numbers of αv+β3+- CD44highICOShigh Tregs were significantly elevated in dLNs at 48 hours post CS induction compared to UT mice (Supplementary Figure 3E), an observation potentially explained by extensive migration of Tregs from inflamed skin to the dLNs (34).
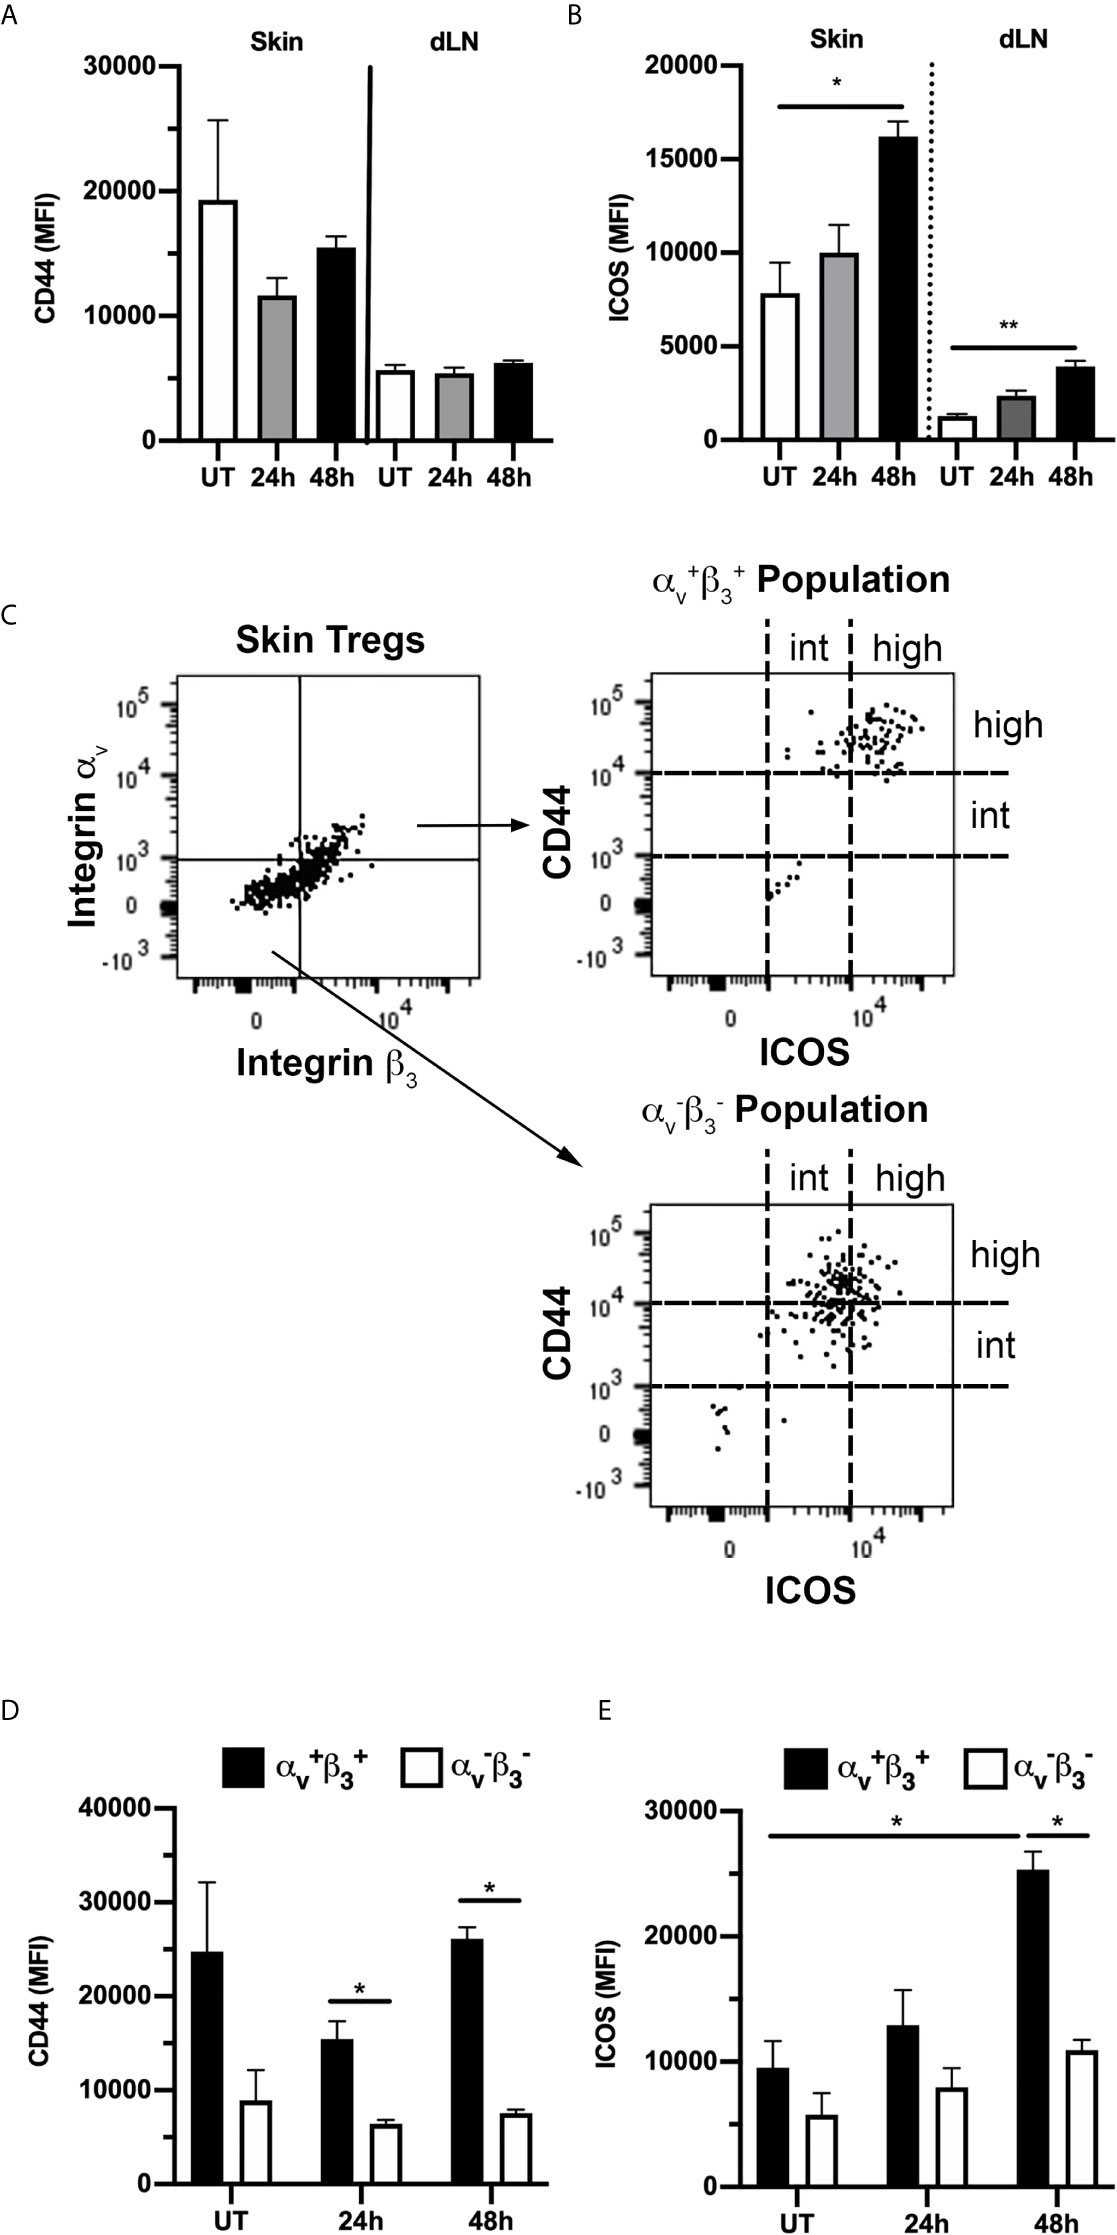
Figure 7 αvβ3+ Tregs in skin have a highly-activated phenotype. Expression of activation markers CD44 and ICOS on Tregs from skin and draining lymph nodes (dLN) of untreated (UT) mice, and 24 and 48 h post CS induction was assessed using flow cytometry. (A, B) Expression (MFI) of CD44 (A) and ICOS (B) on all Tregs, shown for both skin and dLN-derived cells in UT mice, and 24 and 48 h post CS-induction. (C–E) Comparison of expression of CD44 and ICOS on αv+β3+ and αv-β3- Tregs. (C) Representative flow cytometry dot plots showing gating used to define αv+β3+ and αv-β3- Treg populations (left panel) from skin Tregs of an UT mouse, and CD44/ICOS expression on the two populations (right hand panels). (D, E) Quantitation of CD44 (D) and ICOS (E) expression (MFI) on αv+β3+ and αv-β3- skin Tregs from UT mice, and 24 and 48 h post CS induction. Data are shown as mean ± SEM derived from 4 mice/group. Data were evaluated via Kruskal-Wallis test with Dunn’s multiple comparison tests between all timepoints. *p < 0.05, **p < 0.01 for the comparisons shown.
Dermal Treg Migration in Uninflamed and Inflamed Skin Is Dependent on Signalling Through the PI3K p110δ Subunit
The PI3K subunit p110δ is activated in response to TCR-mediated antigen recognition or co-stimulatory receptor ligation and has been shown to control antigen-induced Treg migration into tissue (17, 24). To investigate the role of p110δ in Treg intradermal migration, we treated Foxp3-GFP mice with the p110δ-selective inhibitor IC87114 (Figure 8). In uninflamed mice, p110δ inhibition significantly inhibited the small amount of Treg migration observed in the dermis (Figures 8A–C). This was highlighted in the velocity versus confinement plot showing that this treatment led to a significant increase in the percentage of Tregs within the static Q1 quadrant (Figure 8C). This effect of p110δ inhibition was more striking when examined 24 hours after induction of the CS response (Figures 8D–F, Supplementary Video 5). IC87114 induced a significant reduction in average Treg velocity compared to vehicle controls (Figure 8D), due to a significant reduction in the proportion of highly-migratory Tregs and a corresponding significant increase in the proportion of static Tregs (Figures 8E, F). 48 hours post CS challenge, the effect of IC87114 administration on Treg dermal motility was more subtle in that it again induced a significant reduction in average Treg migration speed (Figures 8G, H), although this response occurred in the absence of significant alterations in the proportions of Tregs within different migration quadrants (Figure 8I). Interestingly, p110δ inhibition also significantly reduced Treg motility in a model of innate skin inflammation (Supplementary Figure 4). Together these findings indicate that signalling through the PI3K p110δ pathway contributes to Treg migration under resting conditions and in both innate and CS-driven responses.
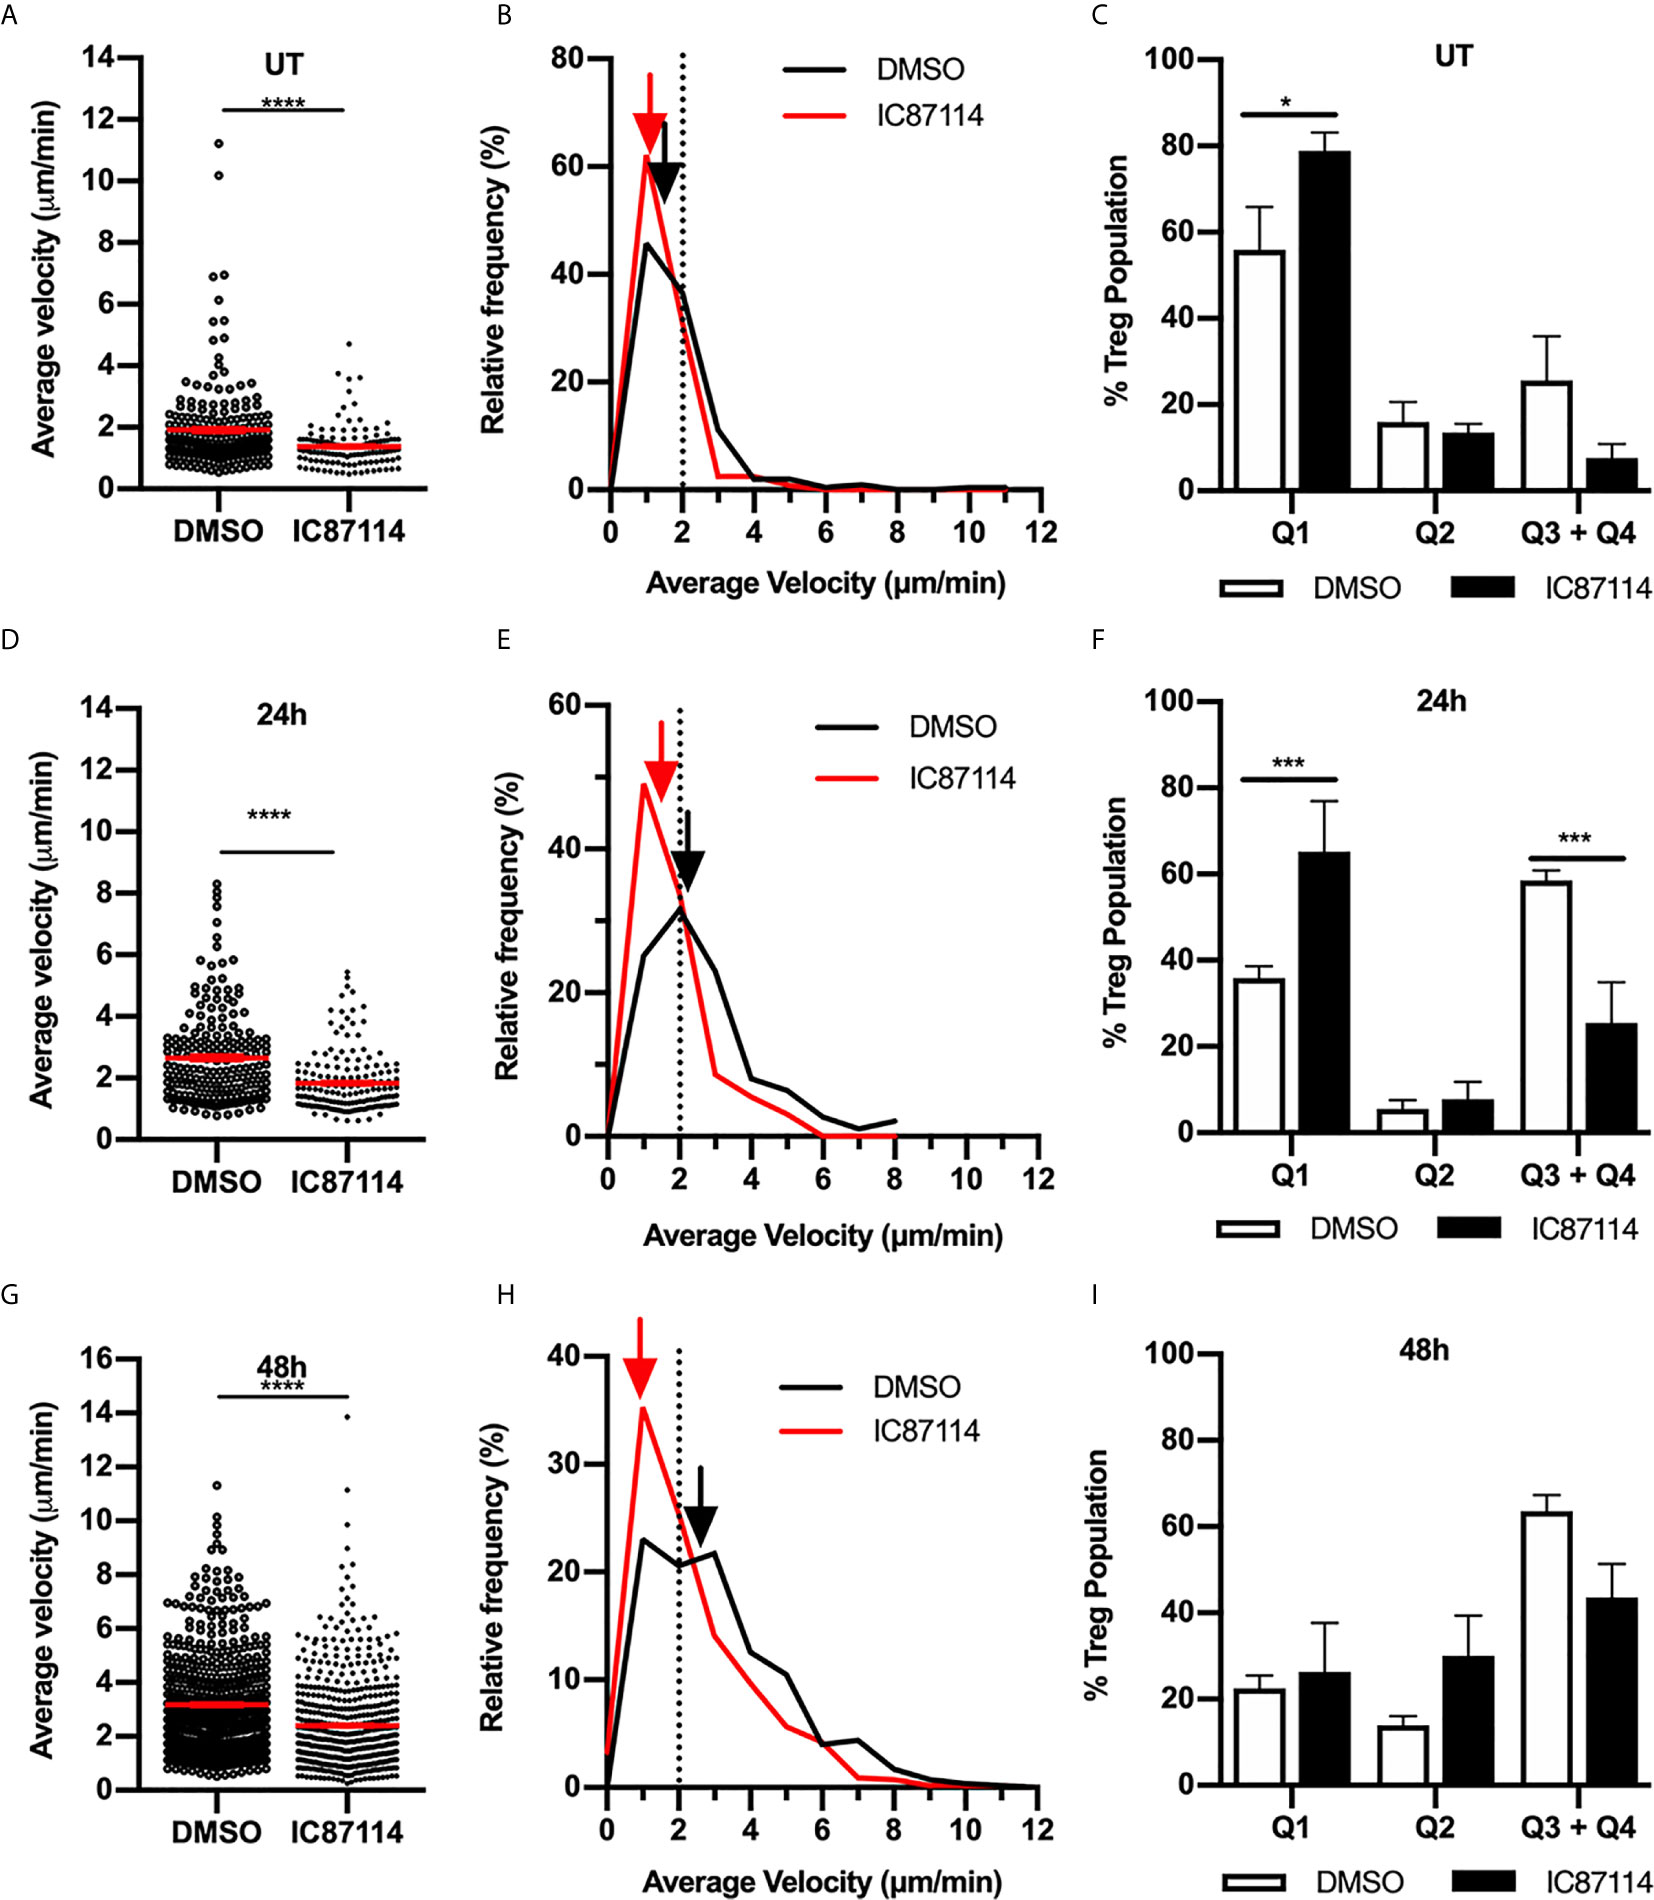
Figure 8 Signalling through the PI3K p110δ subunit promotes Treg migration in resting and inflamed skin. The impact of PI3K p110δ on dermal Treg migration was assessed using MP-IVM, following administration of IC87114 or DMSO vehicle 2 h prior to visualization by MP-IVM. Treg migration was assessed in untreated (UT) skin (A–C), and 24 (D–F) and 48 h (G–I) post CS challenge. (A, D, G) Average velocities of Treg migration. Data show velocities for individual Tregs as well as group mean ± sem. (B, E, H) Relative frequency distributions of the average velocities of individual Tregs from IC87114-treated and control mice. Arrows indicate the median velocity, and the dotted line indicates the 2 µm/min threshold of motility. (C, F, I) Distributions of Tregs within the four quadrants of the velocity vs. confinement plots shown for UT mice, and 24 and 48 h post CS induction. Data represent the mean ± SEM of > 120 cells (UT) and > 300 cells (CS-challenged mice) derived from 3-7 mice/group. Quadrant data represent mean ± SEM of data averaged from 3 fov/mouse. Data in (A, D, G) were analysed by Mann-Whitney test. ****p < 0.0001 for comparisons shown. Data in (C, F, I) were analysed using a multiple comparison t test using the Holm-Sidak method (alpha 0.05). *p < 0.05, ***p < 0.001 for comparisons shown.
Discussion
Treg migration into peripheral tissue is critical to their function in controlling local inflammatory responses. What is less well understood is the behaviour of Tregs upon their entry into inflamed peripheral organs. Here we show in a model of antigen-driven skin inflammation, that as inflammation develops, Tregs accumulate in highly dynamic clusters adjacent to hair follicles in the upper dermis. Moreover, Tregs markedly increase their migratory behaviour with elevated migration persisting well after the inflammatory response has resolved (13, 35). The mechanisms supporting this migration differ at different phases of the response. At the peak of inflammation, Tregs migrate via αv integrin-mediated interactions with components of the ECM, with Tregs expressing high levels of this integrin being of a highly-activated effector phenotype. However, 24 hours later, αvβ1 integrin serves to limit Treg migration. In contrast to these divergent results, PI3K p110δ-dependent signalling was critical to migration both under homeostatic conditions and at all stages of inflammation examined. Together these findings demonstrate that control of intradermal Treg migration during contact sensitivity-mediated skin inflammation is multifactorial and dependent on the phase of the inflammatory response under investigation. It remains to be determined whether this is also the case in other forms of skin inflammation, such as that induced during pathogen-driven inflammation.
One of the most striking observations during the CS response was the tendency of Tregs to congregate and dynamically migrate within clusters adjacent to hair follicles, particularly in the later stages of the response when inflammation was resolving. Previous studies of antigen-driven skin inflammation have revealed that immune cells including conventional CD4+ T cells, inflammatory monocytes and dendritic cells also congregate in similar structures (29, 36, 37). This raises the intriguing possibility that all of these immune cells are colocalising in these clusters, affording Tregs the opportunity to dynamically interact with these pro-inflammatory subsets and modulate their function. In future studies, this possibility will be investigated in imaging studies using strategies to label additional immune cell subsets in addition to Tregs.
It has been previously shown that conventional CD4+ Th1/Th2 effector cells require αv/β1/β3-mediated interactions to move within the skin and exert their effector function (14, 15). Here we observed at the peak of inflammation that Tregs also utilize the αv integrin to migrate within the skin. The finding that Treg migration was also reduced by RGD peptides indicates that the αv integrin was mediating migration via interaction with RGD-containing ECM proteins. However, our evidence indicated that this occurred in the absence of a role for the β1 integrin acting alone, despite Tregs expressing high levels of this molecule. As the majority of Tregs also express β3, and RGD peptides reduce Treg migration at this time point, this provides evidence that the ECM-binding αvβ3 integrin pairing is a key contributor to Treg migration under these circumstances.
However, in contrast, 48 hours after CS induction, inhibition of αv or β1 integrins did not decrease Treg interstitial migration, but induced significant increases in Treg velocity, an observation consistent with integrin:ECM interactions acting to restrict Treg movement at this time point. This alteration in migratory mechanisms during the course of the CS response was not due to marked changes in Treg integrin expression, as dermal Tregs expressed high levels of αv, β1 and β3 integrins throughout the response. This indicates that the extensive Treg migration at later stages in the CS response is independent of the αv integrin. It is important to note that concurrently, the biochemical and cellular composition of the skin is undergoing significant alteration, including reduced collagen density (Figure 2), and increased fibronectin content along with extensive immune cell infiltration (14, 32). These alterations introduce numerous additional adhesive ligands with the potential to support Treg migration. In addition, immune cells have been shown to be capable of switching between integrin-dependent and -independent mechanisms for interstitial migration (38), and alternative pathways such as a switch to glycolytic metabolism can also promote Treg migration (39). Together these studies demonstrate the potential molecular complexity of Treg interstitial migration, particularly in inflamed skin.
Previous studies of Treg phenotype have shown that cells with elevated levels of adhesion molecules associated with trafficking to and retention within the skin, such as ligands for P- and E-selectin, and CD103, have greater capacity to suppress inflammatory responses (4, 40, 41). A similar observation has recently been shown to apply to integrin α2, although the role of this molecule in Treg trafficking is less clear (42). Here we observed that the sub-population of Tregs in the skin that expresses the highest levels of αvβ3 was also highly positive for activation markers CD44 and ICOS, indicating that these cells are among the most highly activated Tregs present in the skin. As elevated ICOS expression distinguishes Tregs with high suppressive function (43, 44), this provides evidence that αvβ3 serves as an additional adhesion molecule marker of highly-suppressive Tregs in inflamed skin. Notably, as the αv integrin was also critical for Treg migration at the peak of the CS response, this is consistent with this adhesion molecule facilitating migration of highly-functional Tregs throughout the inflamed skin.
Previous studies have demonstrated that highly activated (CD44hi) Tregs have a greater capacity to migrate from the skin to the draining lymph node (34). Whether this ability corresponds to a greater capacity of αvβ3hi CD44hi ICOShi Tregs to migrate within the dermis remains to be determined. The role of the αv integrin in Treg function has previously been examined in other tissues, revealing divergent results (16). Studies of inflammatory responses in the brain and colon have demonstrated that many of the Tregs present in these sites of inflammation highly express abundant αv. However, in the brain the αv integrin does not contribute to Treg accumulation or inhibitory function, while in the colon, this integrin can contribute to Treg function under some circumstances (16). These studies demonstrate that αv expression on Tregs does not always correspond to a key functional role for this integrin. This finding is consistent with the present observations which clearly show that the role of the αv integrin differs across different phases of CS. Given this, experiments aimed at investigating the contribution of αv integrin-dependent Treg migration to suppression of skin inflammation will need to be mindful of these phase-dependent differences in αv function.
In contrast to the actions of ECM-binding integrins, blocking PI3K p110δ signalling strongly inhibited Treg migration at all stages of the inflammatory response examined, and in uninflamed skin. The PI3K p110δ pathway is of critical importance to Treg development and function, including in their ability to migrate to inflammatory sites. Fu et al. demonstrated that p110δ-mediated signalling downstream of recognition of antigen presented by activated endothelial cells promoted migration of Tregs across the endothelial barrier and accumulation in the inflamed site (24). Here we show that this pathway is also critical to migration of Tregs after they have crossed the endothelial barrier, not only in inflamed skin, but for the low proportion of migratory Tregs in non-inflamed skin. As the PI3K p110δ pathway acts downstream of the TCR and co-stimulatory molecules such as ICOS and CD28, this suggests that Tregs affected by inhibition of this pathway are responding to their cognate antigen via the TCR (39, 44). Studies in which mature Tregs were rendered deficient in the TCR have demonstrated that Tregs require continuous stimulation via the TCR to maintain suppressor function and a transcriptional profile typical of mature, effector Tregs (45, 46). Here, we showed that interfering with signalling downstream of the TCR, as achieved via PI3K p110δ inhibition, also has an effect on Treg behavioural phenotype, rapidly down-regulating migratory function. Whether the effects on Tregs observed in these two studies are due to related mechanisms requires further investigation. However, it should be noted that the experiments in the present study only examined responses within hours of PI3K p110δ inhibition, whereas the work examining the effect of TCR deficiency examined effects over several days.
One question that remains unanswered is the importance of intradermal migration for the anti-inflammatory function of Tregs in the skin. Given that many of the regulatory mechanisms used by Tregs require either cell-cell contact or proximity to the target cell, it is reasonable to hypothesise that the capacity of Tregs to extensively migrate within the skin is critical to their local anti-inflammatory function (47–49). Evidence supporting this idea has come from imaging studies of Tregs in lymph nodes, where they have been observed to undergo direct contact with dendritic cells reducing their capacity to stimulate immune cell activation (50–52). Whether Treg migration serves a similar function in skin remains to be determined. Moreover, Treg migration is also important for the movement of Tregs out of the skin into skin-draining lymph nodes (dLN), a behaviour which is markedly increased during inflammation (34, 53). As shown here and previously, Tregs that enter skin-dLN have an activated memory phenotype and greater suppressive function as compared to Tregs in the LNs under steady-state conditions (8, 34, 42, 53). This recirculation of Tregs from the skin into dLN and beyond into the circulation is believed to further facilitate regulation of skin inflammation. Together these observations support the idea that the capacity of Tregs to undergo interstitial migration is of key importance in their suppressive function as it affects skin inflammation.
In summary these experiments reveal that control of Treg migration in uninflamed skin and skin undergoing a contact sensitivity-mediated inflammatory response is multifactorial and context-dependent. While PI3K p110δ-transduced signals promote Treg migratory function in both resting and inflamed conditions, during inflammation, the ECM-binding αv integrin first promotes and then retards Treg migration at differing phases of the response. How these varying mechanisms of Treg migration within the skin contribute to control of cutaneous inflammatory responses will require further investigation.
Data Availability Statement
The raw data supporting the conclusions of this article will be made available by the authors, without undue reservation.
Ethics Statement
The animal study was reviewed and approved by Monash Medical Centre ‘B’ Animal Ethics Committee.
Author Contributions
MN designed and performed research, analysed data, and wrote paper. ZC and SS designed and performed research, and analysed data. PP performed research and analysed data. MH designed research and wrote paper. All authors contributed to the article and approved the submitted version.
Funding
This work was supported by the National Health and Medical Research Council (NHMRC), Australia (Senior Research Fellowship IDs 1042775 & 1135971) to MH.
Conflict of Interest
The authors declare that the research was conducted in the absence of any commercial or financial relationships that could be construed as a potential conflict of interest.
Acknowledgments
The authors wish to acknowledge the kind assistance of Monash Micro Imaging, Monash University, for the provision of microscopy instrumentation, training, and technical support.
Supplementary Material
The Supplementary Material for this article can be found online at: https://www.frontiersin.org/articles/10.3389/fimmu.2021.655499/full#supplementary-material
References
1. Dudda JC, Perdue N, Bachtanian E, Campbell DJ. Foxp3+ Regulatory T Cells Maintain Immune Homeostasis in the Skin. J Exp Med (2008) 205(7):1559–65. doi: 10.1084/jem.20072594
2. Sather BD, Treuting P, Perdue N, Miazgowicz M, Fontenot JD, Rudensky AY, et al. Altering the Distribution of Foxp3(+) Regulatory T Cells Results in Tissue-Specific Inflammatory Disease. J Exp Med (2007) 204(6):1335–47. doi: 10.1084/jem.20070081
3. Ali N, Rosenblum MD. Regulatory T Cells in Skin. Immunology (2017) 152(3):372–81. doi: 10.1111/imm.12791
4. Siegmund K, Feuerer M, Siewert C, Ghani S, Haubold U, Dankof A, et al. Migration Matters: Regulatory T-cell Compartmentalization Determines Suppressive Activity. Vivo Blood (2005) 106(9):3097–104. doi: 10.1182/blood-2005-05-1864
5. Hirahara K, Liu L, Clark RA, Yamanaka K, Fuhlbrigge RC, Kupper TS. The Majority of Human Peripheral Blood CD4+CD25highFoxp3+ Regulatory T Cells Bear Functional Skin-Homing Receptors. J Immunol (2006) 177(7):4488–94. doi: 10.4049/jimmunol.177.7.4488
6. Chow Z, Mueller SN, Deane JA, Hickey MJ. Dermal Regulatory T Cells Display Distinct Migratory Behavior That is Modulated During Adaptive and Innate Inflammation. J Immunol (2013) 191(6):3049–56. doi: 10.4049/jimmunol.1203205
7. Gratz IK, Truong HA, Yang SH, Maurano MM, Lee K, Abbas AK, et al. Cutting Edge: Memory Regulatory T Cells Require IL-7 and Not IL-2 for Their Maintenance in Peripheral Tissues. J Immunol (2013) 190(9):4483–7. doi: 10.4049/jimmunol.1300212
8. Sanchez Rodriguez R, Pauli ML, Neuhaus IM, Yu SS, Arron ST, Harris HW, et al. Memory Regulatory T Cells Reside in Human Skin. J Clin Invest (2014) 124(3):1027–36. doi: 10.1172/JCI72932
9. Ali N, Zirak B, Rodriguez RS, Pauli ML, Truong HA, Lai K, et al. Regulatory T Cells in Skin Facilitate Epithelial Stem Cell Differentiation. Cell (2017) 169(6):1119–29.e1111. doi: 10.1016/j.cell.2017.05.002
10. Halabi-Tawil M, Ruemmele FM, Fraitag S, Pauli ML, Truong HA, Lai K, et al. Cutaneous Manifestations of Immune Dysregulation, Polyendocrinopathy, Enteropathy, X-linked (IPEX) Syndrome. Br J Dermatol (2009) 160(3):645–51. doi: 10.1111/j.1365-2133.2008.08835.x
11. Suffia I, Reckling SK, Salay G, Belkaid Y. A Role for CD103 in the Retention of CD4+CD25+ Treg and Control of Leishmania Major Infection. J Immunol (2005) 174(9):5444–55. doi: 10.4049/jimmunol.174.9.5444
12. Billroth-MacLurg AC, Ford J, Rosenberg A, Miller J, Fowell DJ. Regulatory T Cell Numbers in Inflamed Skin Are Controlled by Local Inflammatory Cues That Upregulate CD25 and Facilitate Antigen-Driven Local Proliferation. J Immunol (2016) 197(6):2208–18. doi: 10.4049/jimmunol.1502575
13. Deane JA, Abeynaike LD, Norman MU, Wee JL, Kitching AR, Kubes P, et al. Endogenous Regulatory T Cells Adhere in Inflamed Dermal Vessels Via ICAM-1: Association With Regulation of Effector Leukocyte Adhesion. J Immunol (2012) 188(5):2179–88. doi: 10.4049/jimmunol.1102752
14. Overstreet MG, Gaylo A, Angermann BR, Hughson A, Hyun YM, Lambert K, et al. Inflammation-Induced Interstitial Migration of Effector CD4(+) T Cells is Dependent on Integrin Alphav. Nat Immunol (2013) 14(9):949–58. doi: 10.1038/ni.2682
15. Gaylo-Moynihan A, Prizant H, Popovic M, Fernandes NRJ, Anderson CS, Chiou KK, et al. Programming of Distinct Chemokine-Dependent and -Independent Search Strategies for Th1 and Th2 Cells Optimizes Function At Inflamed Sites. Immunity (2019) 51(2):298–309.e296. doi: 10.1016/j.immuni.2019.06.026
16. Mair I, Zandee SEJ, Toor IS, Saul L, McPherson RC, Leech MD, et al. A Context-Dependent Role for Alphav Integrins in Regulatory T Cell Accumulation At Sites of Inflammation. Front Immunol (2018) 9:264. doi: 10.3389/fimmu.2018.00264
17. Jarmin SJ, David R, Ma L, Chai JG, Dewchand H, Takesono A, et al. T Cell Receptor-Induced phosphoinositide-3-kinase p110delta Activity is Required for T Cell Localization to Antigenic Tissue in Mice. J Clin Invest (2008) 118(3):1154–64. doi: 10.1172/JCI33267
18. Reif K, Okkenhaug K, Sasaki T, Penninger JM, Vanhaesebroeck B, Cyster JG. Cutting Edge: Differential Roles for Phosphoinositide 3-Kinases, p110gamma and p110delta, in Lymphocyte Chemotaxis and Homing. J Immunol (2004) 173(4):2236–40. doi: 10.4049/jimmunol.173.4.2236
19. Ward SG. T Lymphocytes on the Move: Chemokines, PI 3-Kinase and Beyond. Trends Immunol (2006) 27(2):80–7. doi: 10.1016/j.it.2005.12.004
20. Patton DT, Garden OA, Pearce WP, Clough LE, Monk CR, Leung E, et al. Cutting Edge: The Phosphoinositide 3-Kinase p110 Delta is Critical for the Function of CD4+CD25+Foxp3+ Regulatory T Cells. J Immunol (2006) 177(10):6598–602. doi: 10.4049/jimmunol.177.10.6598
21. Okkenhaug K, Patton DT, Bilancio A, Garcon F, Rowan WC, Vanhaesebroeck B. The p110delta Isoform of Phosphoinositide 3-Kinase Controls Clonal Expansion and Differentiation of Th Cells. J Immunol (2006) 177(8):5122–8. doi: 10.4049/jimmunol.177.8.5122
22. Ali K, Soond DR, Pineiro R, Hagemann T, Pearce W, Lim EL, et al. Inactivation of PI(3)K p110delta Breaks Regulatory T-cell-mediated Immune Tolerance to Cancer. Nature (2014) 510(7505):407–11. doi: 10.1038/nature13444
23. Liu D, Zhang T, Marshall AJ, Okkenhaug K, Vanhaesebroeck B, Uzonna JE. The p110delta Isoform of Phosphatidylinositol 3-Kinase Controls Susceptibility to Leishmania Major by Regulating Expansion and Tissue Homing of Regulatory T Cells. J Immunol (2009) 183(3):1921–33. doi: 10.4049/jimmunol.0901099
24. Fu H, Kishore M, Gittens B, Bonacina F, Wang G, Coe D, et al. Self-Recognition of the Endothelium Enables Regulatory T-cell Trafficking and Defines the Kinetics of Immune Regulation. Nat Commun (2014) 5:3436. doi: 10.1038/ncomms4436
25. Norman MU, Hulliger S, Colarusso P, Kubes P. Multichannel Fluorescence Spinning Disk Microscopy Reveals Early Endogenous CD4 T Cell Recruitment in Contact Sensitivity. via complement J Immunol (2008) 180(1):510–21. doi: 10.4049/jimmunol.180.1.510
26. Snelgrove SL, Abeynaike LD, Thevalingam S, Deane JA, Hickey MJ. Regulatory T Cell Transmigration and Intravascular Migration Undergo Mechanistically Distinct Regulation At Different Phases of the Inflammatory Response. J Immunol (2019) 203(11):2850–61. doi: 10.4049/jimmunol.1900447
27. Zhang L, Tinkle SS. Chemical Activation of Innate and Specific Immunity in Contact Dermatitis. J Invest Dermatol (2000) 115(2):168–76. doi: 10.1046/j.1523-1747.2000.00999.x
28. Mrass P, Kinjyo I, Ng LG, Reiner SL, Pure E, Weninger W. CD44 Mediates Successful Interstitial Navigation by Killer T Cells and Enables Efficient Antitumor Immunity. Immunity (2008) 29(6):971–85. doi: 10.1016/j.immuni.2008.10.015
29. Collins N, Jiang X, Zaid A, Macleod BL, Li J, Park CO, et al. Skin CD4(+) Memory T Cells Exhibit Combined Cluster-Mediated Retention and Equilibration With the Circulation. Nat Commun (2016) 7:11514. doi: 10.1038/ncomms11514
30. Mittal D, Saccheri F, Venereau E, Pusterla T, Bianchi ME, Rescigno M. TLR4-Mediated Skin Carcinogenesis is Dependent on Immune and Radioresistant Cells. EMBO J (2010) 29(13):2242–52. doi: 10.1038/emboj.2010.94
31. Mostaco-Guidolin L, Rosin NL, Hackett TL. Imaging Collagen in Scar Tissue: Developments in Second Harmonic Generation Microscopy for Biomedical Applications. Int J Mol Sci (2017) 18(8):1772. doi: 10.3390/ijms18081772
32. Fernandes NRJ, Reilly NS, Schrock DC, Hocking DC, Oakes PW, Fowell DJ. Cd4(+) T Cell Interstitial Migration Controlled by Fibronectin in the Inflamed Skin. Front Immunol (2020) 11:1501. doi: 10.3389/fimmu.2020.01501
33. Miragaia RJ, Gomes T, Chomka A, Jardine L, Riedel A, Hegazy AN, et al. Single-Cell Transcriptomics of Regulatory T Cells Reveals Trajectories of Tissue Adaptation. Immunity (2019) 50(2):493–504.e497. doi: 10.1016/j.immuni.2019.01.001
34. Tomura M, Honda T, Tanizaki H, Otsuka A, Egawa G, Tokura Y, et al. Activated Regulatory T Cells are the Major T Cell Type Emigrating From the Skin During a Cutaneous Immune Response in Mice. J Clin Invest (2010) 120(3):883–93. doi: 10.1172/JCI40926
35. Abeynaike LD, Deane JA, Westhorpe CL, Chow Z, Alikhan MA, Kitching AR, et al. Regulatory T Cells Dynamically Regulate Selectin Ligand Function During Multiple Challenge Contact Hypersensitivity. J Immunol (2014) 193(10):4934–44. doi: 10.4049/jimmunol.1400641
36. Liu Z, Yang F, Zheng H, Fan Z, Qiao S, Liu L, et al. Visualization of T Cell-Regulated Monocyte Clusters Mediating Keratinocyte Death in Acquired Cutaneous Immunity. J Invest Dermatol (2018) 138(6):1328–37. doi: 10.1016/j.jid.2018.01.018
37. Natsuaki Y, Egawa G, Nakamizo S, Ono S, Hanakawa S, Okada T, et al. Perivascular Leukocyte Clusters are Essential for Efficient Activation of Effector T Cells in the Skin. Nat Immunol (2014) 15(11):1064–9. doi: 10.1038/ni.2992
38. Lammermann T, Bader BL, Monkley SJ, Worbs T, Wedlich-Soldner R, Hirsch K, et al. Rapid Leukocyte Migration by Integrin-Independent Flowing and Squeezing. Nature (2008) 453(7191):51–5. doi: 10.1038/nature06887
39. Kishore M, Cheung KCP, Fu H, Bonacina F, Wang G, Coe D, et al. Regulatory T Cell Migration is Dependent on Glucokinase-Mediated Glycolysis. Immunity (2017) 47(5):875–89.e810. doi: 10.1016/j.immuni.2017.10.017
40. Huehn J, Siegmund K, Lehmann JC, Siewert C, Haubold U, Feuerer M, et al. Developmental Stage, Phenotype, and Migration Distinguish Naive- and Effector/Memory-Like CD4+ Regulatory T Cells. J Exp Med (2004) 199(3):303–13. doi: 10.1084/jem.20031562
41. Hanakawa S, Kitoh A, Shibuya R, Dainichi T, Nomura T, Honda T, et al. Percutaneous Sensitization is Limited by in Situ Inhibition of Cutaneous Dendritic Cell Migration Through Skin-Resident Regulatory T Cells. J Allergy Clin Immunol (2019) 144(5):1343–53.e1348. doi: 10.1016/j.jaci.2019.05.033
42. Fan X, Moltedo B, Mendoza A, Davydov AN, Faire MB, Mazutis L, et al. CD49b Defines Functionally Mature Treg Cells That Survey Skin and Vascular Tissues. J Exp Med (2018) 215(11):2796–814. doi: 10.1084/jem.20181442
43. Vocanson M, Rozieres A, Hennino A, Poyet G, Gaillard V, Renaudineau S, et al. Inducible Costimulator (ICOS) is a Marker for Highly Suppressive Antigen-Specific T Cells Sharing Features of T(H)17/T(H)1 and Regulatory T Cells. J Allergy Clin Immunol (2010) 126(2):280–9, 289.e1–7. doi: 10.1016/j.jaci.2010.05.022
44. Li DY, Xiong XZ. Icos(+) Tregs: A Functional Subset of Tregs in Immune Diseases. Front Immunol (2020) 11:2104. doi: 10.3389/fimmu.2020.02104
45. Vahl JC, Drees C, Heger K, Heink S, Fischer JC, Nedjic J, et al. Continuous T Cell Receptor Signals Maintain a Functional Regulatory T Cell Pool. Immunity (2014) 41(5):722–36. doi: 10.1016/j.immuni.2014.10.012
46. Levine AG, Arvey A, Jin W, Rudensky AY. Continuous Requirement for the TCR in Regulatory T Cell Function. Nat Immunol (2014) 15(11):1070–8. doi: 10.1038/ni.3004
47. Vignali DA, Collison LW, Workman CJ. How Regulatory T Cells Work. Nat Rev Immunol (2008) 8(7):523–32. doi: 10.1038/nri2343
48. Tang Q, Bluestone JA. The Foxp3+ Regulatory T Cell: A Jack of All Trades, Master of Regulation. Nat Immunol (2008) 9(3):239–44. doi: 10.1038/ni1572
49. Chinen T, Kannan AK, Levine AG, Fan X, Klein U, Zheng Y, et al. An Essential Role for the IL-2 Receptor in Treg Cell Function. Nat Immunol (2016) 17(11):1322–33. doi: 10.1038/ni.3540
50. Mempel TR, Pittet MJ, Khazaie K, Weissleder R, Weninger W, von Andrian UH. Regulatory T Cells Reversibly Suppress Cytotoxic T Cell Function Independent of Effector Differentiation. Immunity (2006) 25:129–41. doi: 10.1016/j.immuni.2006.04.015
51. Tang Q, Adams JY, Tooley AJ, Bi M, Fife BT, Serra P, et al. Visualizing Regulatory T Cell Control of Autoimmune Responses in Nonobese Diabetic Mice. Nat Immunol (2006) 7(1):83–92. doi: 10.1038/ni1289
52. Liu Z, Gerner MY, Van Panhuys N, Levine AG, Rudensky AY, Germain RN. Immune Homeostasis Enforced by Co-Localized Effector and Regulatory T Cells. Nature (2015) 528(7581):225–30. doi: 10.1038/nature16169
Keywords: regulatory T cell, skin, inflammation, migration, αv integrin, PI3 kinase
Citation: Norman MU, Chow Z, Snelgrove SL, Prakongtham P and Hickey MJ (2021) Dynamic Regulation of the Molecular Mechanisms of Regulatory T Cell Migration in Inflamed Skin. Front. Immunol. 12:655499. doi: 10.3389/fimmu.2021.655499
Received: 19 January 2021; Accepted: 22 April 2021;
Published: 10 May 2021.
Edited by:
Valerie Julia, Galderma, SwitzerlandReviewed by:
Mobin Karimi, Upstate Medical University, United StatesUlrike Lorenz, University of Virginia, United States
Copyright © 2021 Norman, Chow, Snelgrove, Prakongtham and Hickey. This is an open-access article distributed under the terms of the Creative Commons Attribution License (CC BY). The use, distribution or reproduction in other forums is permitted, provided the original author(s) and the copyright owner(s) are credited and that the original publication in this journal is cited, in accordance with accepted academic practice. No use, distribution or reproduction is permitted which does not comply with these terms.
*Correspondence: Michael J. Hickey, TWljaGFlbC5oaWNrZXlAbW9uYXNoLmVkdQ==