 Eun Bin Cho1,2
 Jong Hwa Shin3,4
 Soonwook Kwon5
 Juhyeon Kim1,6
 Jin Myoung Seok7
 Byoung Joon Kim3,4
 Ju-Hong Min3,4,8*
- 1Department of Neurology, Gyeongsang Institute of Health Science, Gyeongsang National University, College of Medicine, Jinju, South Korea
- 2Department of Neurology, Gyeongsang National University Changwon Hospital, Changwon, South Korea
- 3Department of Neurology, Samsung Medical Center, Sungkyunkwan University School of Medicine, Seoul, South Korea
- 4Department of Neurology, Neuroscience Center, Samsung Medical Center, Seoul, South Korea
- 5Department of Neurology, Inha University School of Medicine, Incheon, South Korea
- 6Department of Neurology, Gyeongsang National University Hospital, Jinju, South Korea
- 7Department of Neurology, Soonchunhyang University Cheonan Hospital, Soonchunhyang University College of Medicine, Cheonan, South Korea
- 8Department of Health Sciences and Technology, Samsung Advanced Institute for Health Sciences & Technology (SAIHST), Sungkyunkwan University, Seoul, South Korea
Background: Clear associations have been found between vitamin D deficiency and several autoimmune diseases including multiple sclerosis (MS). However, the benefits of vitamin D supplementation on disease management remain a matter of debate.
Objective and Methods: Patients with MS (N=12) and neuromyelitis optica spectrum disorder (NMOSD; N=12) were enrolled along with 15 healthy controls. Changes in lymphocyte subset proportions during stimulation of their peripheral blood mononuclear cells (PBMCs) with the active form of vitamin D, 1,25-dihydroxyvitamin D3 (1,25(OH)2D3), and correlations with serum concentrations of the vitamin D precursor 25-hydroxyvitamin D3 (serum 25(OH)D3) were explored. The impact of 1,25(OH)2D3 stimulation on the expression of vitamin-D-responsive genes in immune cells was also investigated.
Results: In both MS and NMOSD, stimulation of PBMCs with 1,25(OH)2D3 followed by steroid suppressed the proliferation of total lymphocytes and T cells. The ratio of CD19+CD27+ memory B cells (Bmem) to all B cells after stimulation with 1,25(OH)2D3 was negatively correlated with serum 25(OH)D3 in MS (Spearman’s ρ=–0.594, p=0.042), but positively correlated in NMOSD (Pearson’s r = 0.739, p=0.006). However, there was no relationship between the ratio of Bmem to CD19+CD24+CD38+ regulatory B cells and serum 25(OH)D3 in either MS or NMOSD. In addition, the level of 1,25(OH)2D3-induced CYP24A1 mRNA expression in PBMCs was significantly and negatively correlated with serum 25(OH)D3 (for ΔCT, r=0.744, p=0.014) in MS.
Conclusion: These findings suggest a beneficial impact of stimulation of PBMCs with vitamin D followed by steroid on the T-cell population. The association between patient serum 25(OH)D3 and the proportion of Bmem under immune-cell stimulation differed between MS and NMOSD. Further investigations are warranted with larger patient populations.
Introduction
1,25-Dihydroxyvitamin D3 (1,25(OH)2D3), the active form of vitamin D, is receiving increasing attention due to its role as a regulator of the immune system (1). Immune cells, such as macrophages, dendritic cells, and activated lymphocytes, express both the vitamin D receptor (VDR) and 1α-hydroxylase (CYP27B1), the key enzyme that catalyzes the bioactivation of 1,25(OH)2D3 from its precursor 25-hydroxyvitamin D3 (25(OH)D3) (2–4). Vitamin D suppresses the production of proinflammatory cytokines such as interferon-γ, interleukin (IL)-2, and IL-17, enhances the secretion of anti-inflammatory cytokines such as IL-4 and IL-10, and shifts the balance toward immune responses mediated by T helper (Th) type 2 cells and regulatory T cells (3, 5). In addition, vitamin D interferes with B-cell proliferation and differentiation into memory B cells (Bmem) and antibody-secreting plasma cells (6, 7). From this perspective, the large amount of data linking decreased vitamin D levels to an abnormal immune response, such as increased autoimmunity, is of great concern (8–13). Low vitamin D levels have been correlated with disease activity or disability in various autoimmune disorders, including systemic lupus erythematosus (SLE), Sjögren’s syndrome, multiple sclerosis (MS), and neuromyelitis optica spectrum disorder (NMOSD) (8, 9, 11, 12).
MS and NMOSD are autoimmune inflammatory demyelinating diseases that affect the central nervous system (CNS). Autoreactive T cells in the periphery and T cell–B cell collaboration contribute to the pathogenesis of CNS autoimmunity. CNS antigen-specific T cells, specifically CD4+ Th1 cells and Th17 cells, and antibodies against the aquaporin-4 water channel (AQP4) are believed to play key roles in the development of MS and NMOSD, respectively (14, 15). In the periphery, B cells, and especially Bmem, may serve as antigen-presenting cells, and activate and differentiate the autoreactive T cells into the Th17 lineage by producing cytokines such as IL-6 and IL-21 (14, 16). In addition, Th17 and T follicular helper cells produce the cytokines IL-17a and IL-6, which promote granulocyte activation, and B-cell differentiation and antibody production (17). Vitamin D may exert an immunomodulating effect by suppressing the inflammatory autoimmune response. However, the benefit of vitamin D in terms of therapeutic applications is not clear for either MS or NMOSD (11, 18, 19).
This study investigated the effects of vitamin D on immune cells through peripheral blood mononuclear cell (PBMC) stimulation in patients with MS or NMOSD, and in healthy controls (HCs). The associations between serum 25(OH)D3 concentration (hereafter serum 25(OH)D3) and the proportions of lymphocyte subsets following stimulation with 1,25(OH)2D3 were also evaluated, and 1,25(OH)2D3-induced changes in mRNA expression of the genes encoding VDR (VDR), the vitamin-D-activating and vitamin-D-degrading enzymes 1α-hydroxylase (CYP27B1) and 24-hydroxylase (CYP24A1), respectively, and IL-10 (IL-10) were explored.
Methods
Subjects
Patients with MS (20) (N=12) and AQP4-antibody-positive NMOSD (15) (N=12) were enrolled at Samsung Medical Center in Seoul, South Korea between November 2016 and August 2018. A total of 20 ml of peripheral venous blood samples were taken during remission in all patients. The same amount of venous blood was also obtained from 15 HCs who did not have a history of acute or chronic disease and had not been taking any medication during the previous 3 months. Total serum 25(OH)D3 was measured using commercially available enzyme-linked immunosorbent assay kits (Eagle Biosciences, NH, USA) according to the manufacturer’s instructions. The study was approved by the Institutional Review Board of Samsung Medical Center and written informed consents were obtained from all subjects.
PBMC Preparation and Culture
Whole blood was collected into lithium heparin tubes and PBMCs were then separated using density-gradient centrifugation on Ficoll-Paque PLUS (GE Healthcare Biosciences, Pittsburgh, PA, USA). The isolated PBMCs were suspended in fetal bovine serum (FBS; Life Technologies, Grand Island, NY, USA) and 10% dimethyl sulfoxide (Sigma Aldrich, St. Louis, MO, USA) at a concentration of 1×10⁷ cells/ml, and then stored in liquid nitrogen until required for the stimulation experiments.
The PBMCs were cultured with RPMI (Roswell Park Memorial Institute) 1640 medium containing L-glutamine supplemented with 10% certified inactivated FBS and 50 units of penicillin/streptomycin (Life Technologies). They were then incubated with a nonspecific stimulation mixture of 10 ng/ml lipopolysaccharide (LPS; Sigma ldrich), 100 ng/ml CD40 ligand (CD40L; Enzo Biochem, New York, NY, USA), and 5 nM cytosine-phosphate-guanosine-oligodeoxynucleotides (CpG-ODN 2006; Invivogen, USA), either alone (LPS+CD40L+CpG-ODN) or in combination with steroid (dexamethasone, 10 nM, Sigma Aldrich), 1,25(OH)2D3 (1 μM, Sigma Aldrich), or both steroid and 1,25(OH)2D3. When used, 1,25(OH)2D3 was added 24 hours prior to LPS+CD40L+CpG-ODN. The cells were incubated for 72 hours, after which they were analyzed with flow cytometry.
Immunophenotyping by Flow Cytometry
The percentages of total lymphocytes and T cells, B cells, regulatory B cells (Breg), and Bmem in the PBMC samples were determined by flow cytometric analysis of the surface markers CD3, CD19, CD24, CD38, and CD27. In this study, CD19+CD24+CD38+ cells were defined as Breg and CD19+CD27+ cells as Bmem (21). PBMCs were incubated with the following surface marker antibodies (all from BD Biosciences, San Jose, CA, USA) for 30 min at 4°C in the dark: anti-CD19-APC-Cy7 (clone SJ25C1), anti-CD3-PerCPCy5.5 (clone SK7), anti-CD24-FITC (Clone ML5), anti-CD38-PE (clone HIT), anti-CD27-PE (clone M-T271). They were then washed twice with phosphate-buffered saline (PBS), suspended in PBS, and analyzed using FACS Canto II flow cytometry with FACS DIVA software (version 6.1.3, BD Biosciences).
Real-Time Polymerase Chain Reaction
Total RNA was isolated using the RNeasy Mini kit (Qiagen, Valencia, CA, USA) according to the manufacturer’s instructions. cDNA was synthesized by reverse transcription at 37°C for 30 min, followed by reverse transcriptase (RT) inactivation at 95°C for 5 min using the Fast Advanced RT buffer and Enzyme mix (Thermo Fisher Scientific, Waltham, MA, USA). Each gene-expression assay consisted of a 6-carboxy-fluorescein (FAM)-dye-labeled TaqMan MGB (minor groove binder) probe and two polymerase chain reaction (PCR) primers (TaqMan human FAM assays). The target genes were VDR (Hs00172113_m1), CYP24A1 (Hs00167999_m1), CYP27B1 (Hs00168017_m1), IL-10 (Hs00961622_m1), and glyceraldehyde-3-phosphate dehydrogenase (GAPDH; Hs02786624_g1). All of these genes were obtained from Thermo Fisher Scientific. GAPDH, which is present in all genomes, is commonly used as an endogenous control (i.e., a housekeeping gene) for analyzing the relative levels of gene expression. Real-time PCR was carried out using the TaqMan Fast advanced Master Mix (Thermo Fisher Scientific). Uracil N-glycosylase (UNG) was used to prevent the possible reamplification of carryover PCR products. The thermal cycle conditions were 50°C for 2 min (AMPerase UNG activation), 95°C for 20 sec (Taq activation), and then PCR for 40 cycles of 95°C for 1 sec and 60°C for 20 sec. Relative expression levels of DNA were calculated automatically using QuantStudio 6 Pro Real-Time PCR System software (Thermo Fisher Scientific). Cycle threshold (CT) values were defined as the thresholds required for reference amplification. The average CT was calculated for each target gene (CT, target gene) and for GAPDH (CT, GAPDH); the difference (ΔCT) was calculated for each target gene using the equation ΔCT = CT, target gene−CT, GAPDH.
Statistical Analysis
Lymphocyte subset percentages in PBMC samples were compared between the MS, NMOSD, and HC groups using one-way analysis of variance (ANOVA) or Kruskal–Wallis tests. Two-way ANOVA or Friedman’s test was used to compare the proportions of specific lymphocytes and ΔCT values for VDR, CYP24A1, CYP27B1, and IL-10 mRNA expression among the four stimulation groups (LPS+CD40L+CpG-ODN alone or in combination with 1,25(OH)2D3, steroid, or both) for each of the three study groups. Bonferroni’s correction for multiple comparisons was performed. Correlations between the study participants’ serum 25(OH)D3 and the percentage of each lymphocyte subset or ΔCT values for mRNA expression were evaluated using Pearson’s correlation or Spearman’s correlation. SPSS (version 20, SPSS, Chicago, IL, USA) and Prism (version 8.4.3, GraphPad, La Jolla, CA, USA) were used for statistical analysis and data presentation. The criterion for statistical significance was p<0.05.
Results
The characteristics of the study participants are summarized by group in Table 1. Patients with NMOSD were significantly older than HCs (mean age, 44 vs. 32 years; p=0.013). Vitamin D supplementation was reported by 25% (3/12) of the MS patients and 33% (4/12) of the NMOSD patients, but none of the HCs. Serum 25(OH)D3 was higher in the NMOSD group than in their HC counterparts (p=0.030).
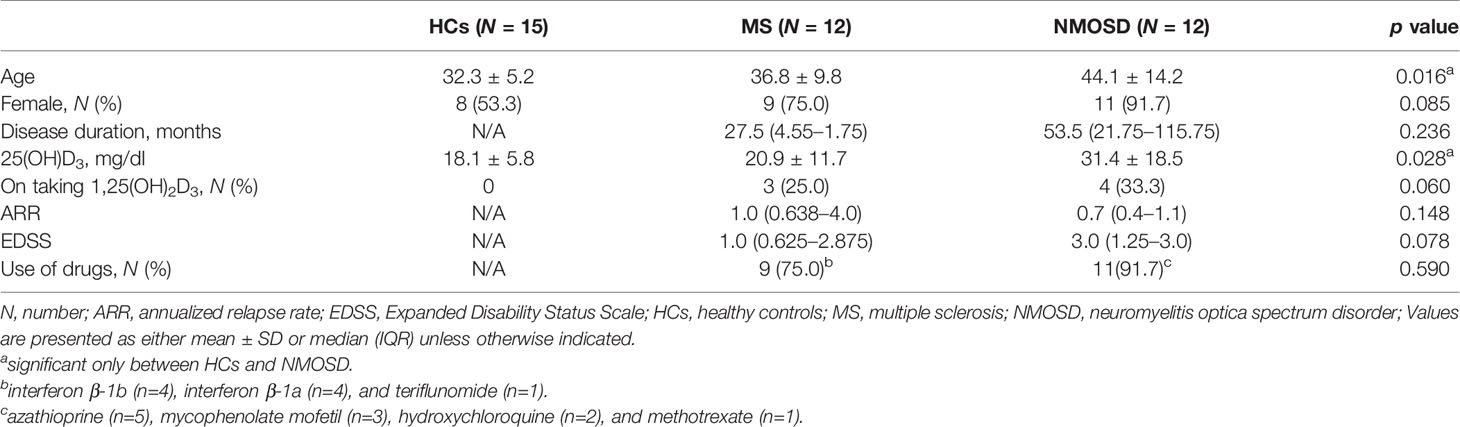
Table 1 Demographics and serum concentrations of 25(OH)D3 in study subjects.
In PBMC samples, the proportion of total lymphocytes was significantly lower in both the MS and NMOSD groups than in the HC group (p=0.020 and 0.005, respectively). The frequency of Breg among B cells was lower and the Bmem/Breg ratio was significantly higher in the NMOSD group than in the MS group (p=0.026 and 0.028, respectively); there were no significant differences in these parameters between the MS and HC groups or between the NMOSD and HC groups (Figure 1). There were no differences in the percentages of T cells, B cells, and Bmem between any of the study groups (HC vs. MS vs. NMOSD).
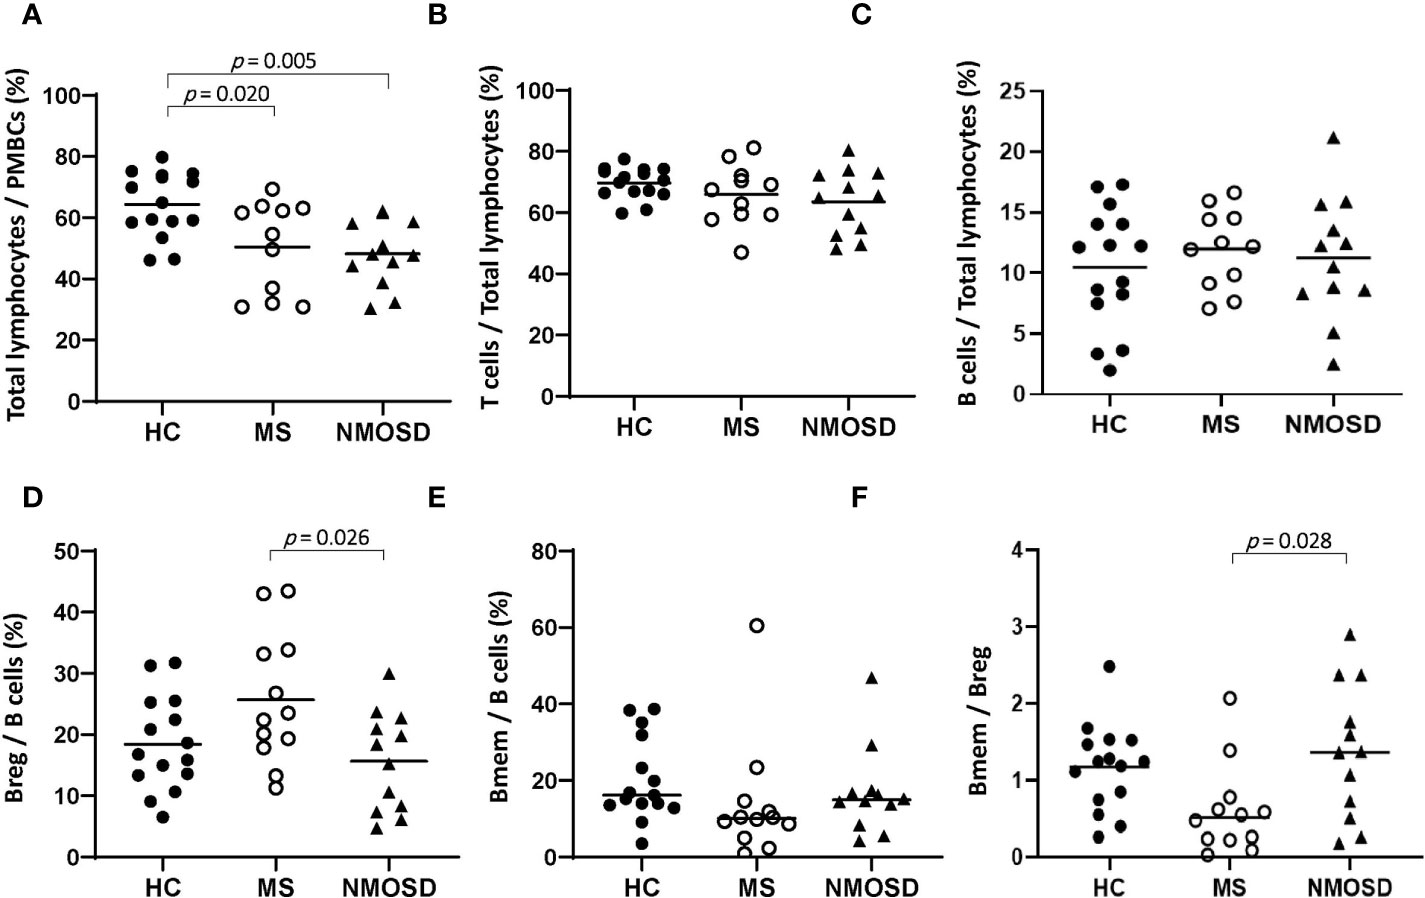
Figure 1 The proportions of lymphocytes in PBMC samples from HCs and patients with MS or NMOSD. The percentage of total lymphocytes was lower in MS and NMOSD than in HCs. The Breg/B cell ratio was higher and the Bmem/Breg ratio was lower in patients with MS than in those with NMOSD. The data are presented as scatter plots in which the horizontal line indicates the mean (A–D) or median (E, F). Only statistically significant p values (p<0.05) are presented. Bmem, CD19+CD27+ memory B cell; Breg, CD19+CD24+CD38+ regulatory B cell; HC, healthy control; MS, multiple sclerosis; NMOSD, neuromyelitis optica spectrum disorder; PBMC, peripheral blood mononuclear cell.
Changes in the Proportion of Lymphocytes in Response to Stimulation With 1,25(OH)2D3
Nonspecific stimulation with LPS+CD40L+CpG-ODN resulted in a significant increase in total lymphocyte percentage (p=0.014) and significant reductions in the Bmem percentage and Bmem/Breg ratio (p=0.010 and 0.028, respectively) in the NMOSD group, while the T-cell percentage decreased in the MS group (p=0.017) (Supplementary Figure 1).
Stimulation of HC PBMCs with 1,25(OH)2D3 significantly reduced the percentage of total lymphocytes (p=0.027), regardless of subsequent stimulation with steroid (Figure 2A). 1,25(OH)2D3 also caused a reduction in the percentage of total lymphocytes in PBMCs from the MS and NMOSD groups, but only when steroid was added after 1,25(OH)2D3 (p<0.05 vs. steroid or 1,25(OH)2D3 alone for both patient groups).
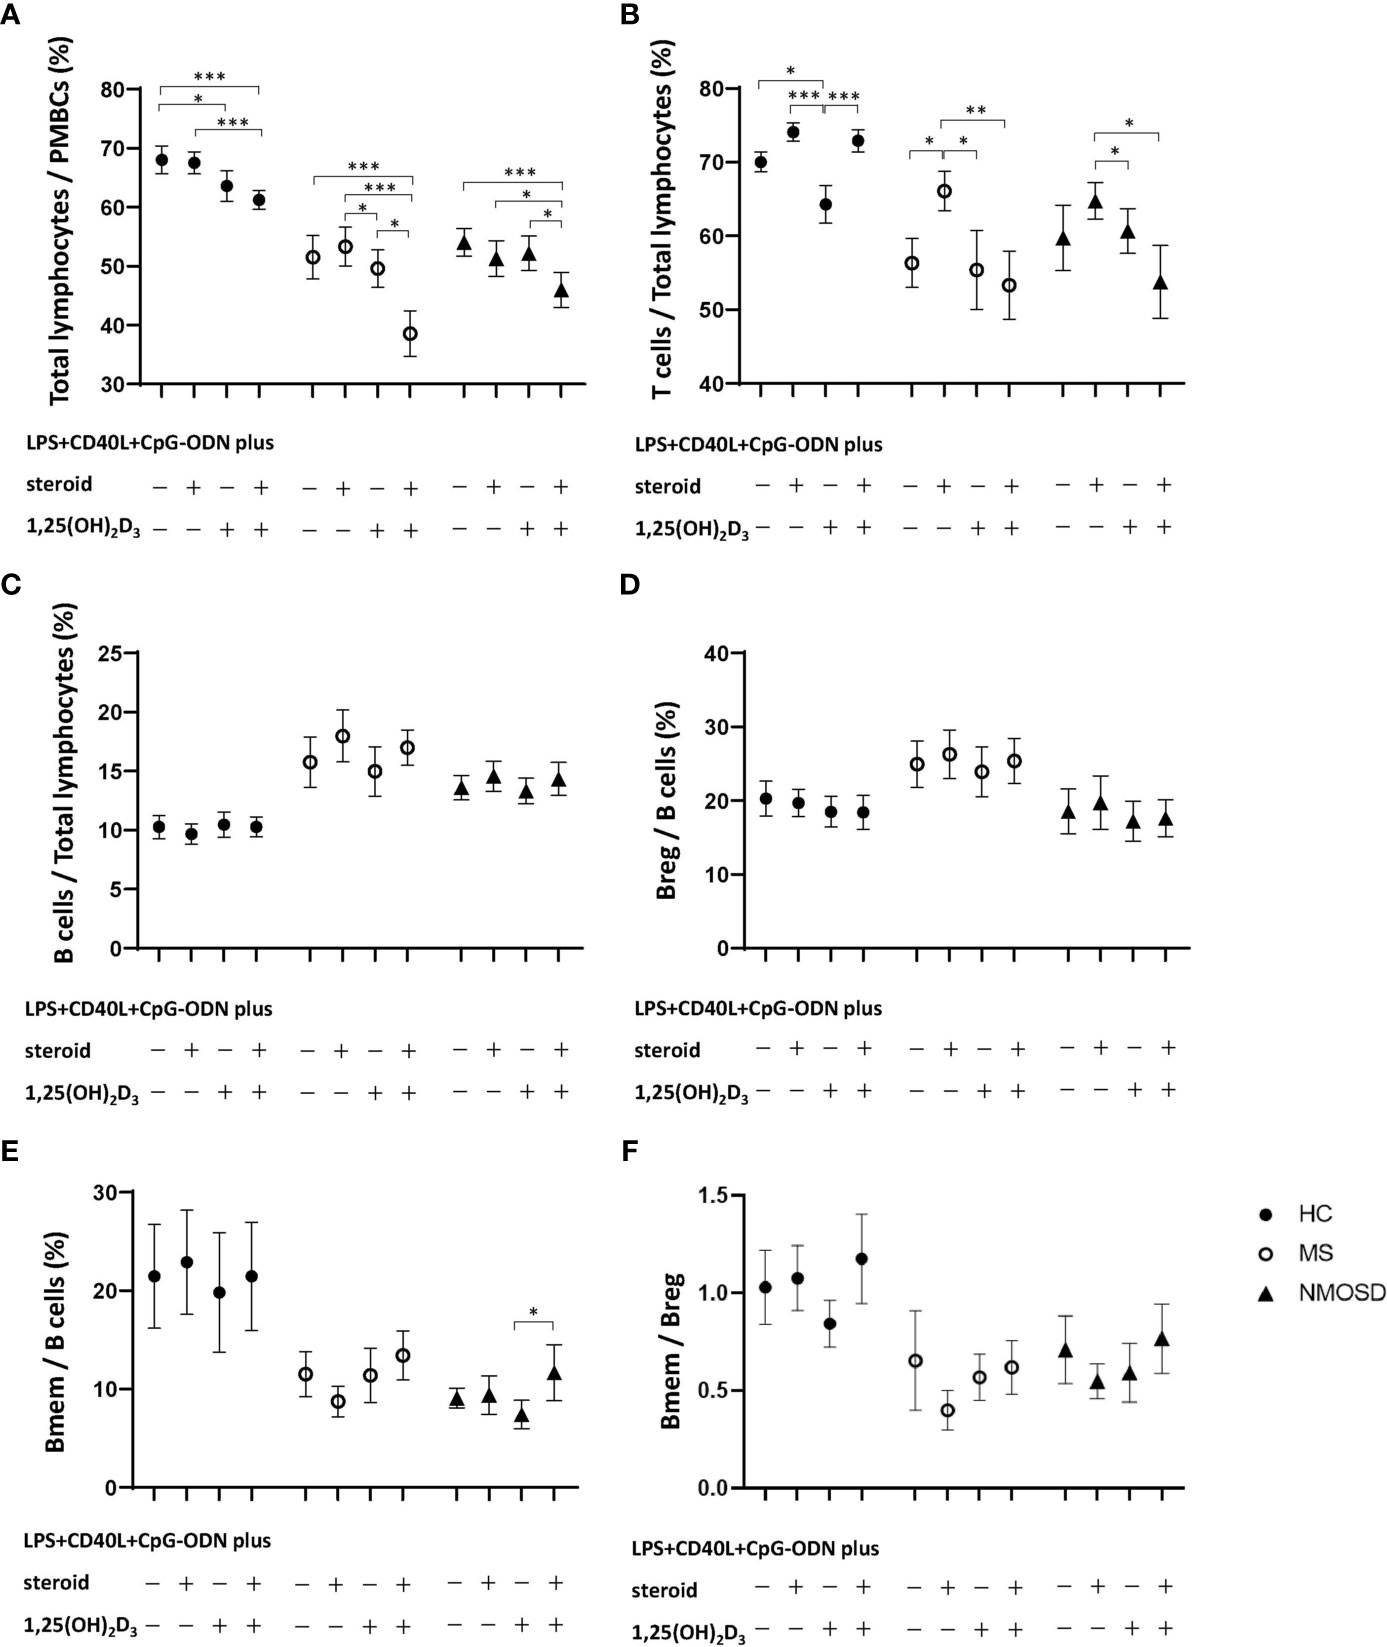
Figure 2 Changes in the proportion of lymphocytes in PBMC samples in response to nonspecific stimulation with LPS+CD40L+CpG-ODN with or without 1,25(OH)2D3, and/or steroid (dexamethasone) in HCs and in patients with MS or NMOSD. Stimulation with 1,25(OH)2D3 significantly reduced the percentages of (A) total lymphocytes and (B) T cells in HCs. However, stimulation with 1,25(OH)2D3 followed by steroid caused significant decreases in the percentages of (A) total lymphocytes and (B) T cells in the MS and NMOSD groups compared with those achieved by stimulation with steroid treatment alone. 1,25(OH)2D3 stimulation did not alter the proportions of (C) B cells or (D) Breg, or (F) the Bmem/Breg ratio in any of the three study groups. Stimulation with 1,25(OH)2D3 followed by steroid significantly increased the proportion of (E) Bmem in PBMC samples compared with 1,25(OH)2D3 stimulation alone in the NMOSD group. Data are mean and standard-error values. Statistically significant differences are indicated by horizontal bars: *p<0.05, **p<0.01, ***p<0.001. 1,25(OH)2D3, 1,25-dihydroxyvitamin D3; Bmem, CD19+CD27+ memory B cell; Breg, CD19+CD24+CD38+ regulatory B cell; CD40L, CD40 ligand; CpG-ODN, cytosine phosphate guanosine oligodeoxynucleotides; HC, healthy control; LPS, lipopolysaccharide; MS, multiple sclerosis; NMOSD, neuromyelitis optica spectrum disorder; PBMC, peripheral blood mononuclear cell.
The proportion of T cells among total lymphocytes was also significantly reduced by stimulation of HC PBMCs with 1,25(OH)2D3 (p=0.012), but that proportion increased upon subsequent stimulation with steroid. In the MS and NMOSD groups, the percentage of T cells increased after PBMC stimulation with steroid (p=0.012 and 0.158, respectively), but not if they were first stimulated with 1,25(OH)2D3 (Figure 2B). 1,25(OH)2D3 stimulation did not alter the proportions of B cells or Breg, or the Bmem/Breg ratio in any of the three study groups (Figures 2C, D, F). However, stimulation with 1,25(OH)2D3 followed by steroid significantly increased the proportion of Bmem in PBMC samples compared with 1,25(OH)2D3 stimulation alone in the NMOSD group (Figure 2E).
Associations Between Serum 25(OH)D3 and Percentage of Bmem
Prior to PBMC stimulation, there were no correlations between the Bmem/B cell ratio and serum 25(OH)D3 in any of the study groups. However, after nonspecific PBMC stimulation with LPS+CD40L+CpG-ODN, there was a negative correlation between the Bmem/B cell ratio and serum 25(OH)D3 in the HC group (Spearman’s ρ=0.529, p=0.043), and a positive correlation (Pearson’s r = 0.731, p=0.007) in the NMOSD group (Figures 3A, C). Additional stimulation with 1,25(OH)2D3 did not alter these correlations for either group. In the MS group, an association between Bmem/B cell ratio and serum 25(OH)D3 was found only following stimulation with 1,25(OH)2D3, which yielded a negative correlation (ρ=–0.594, p=0.042; Figure 3B). There was no correlation between the Breg/B cell ratio in PBMC samples and serum 25(OH)D3 in any of the groups, regardless of the stimulation conditions. A negative association was found between the Bmem/Breg ratio and serum 25(OH)D3 after stimulation of PBMCs with 1,25(OH)2D3 only in the HC group (ρ=–0.583, p=0.023).
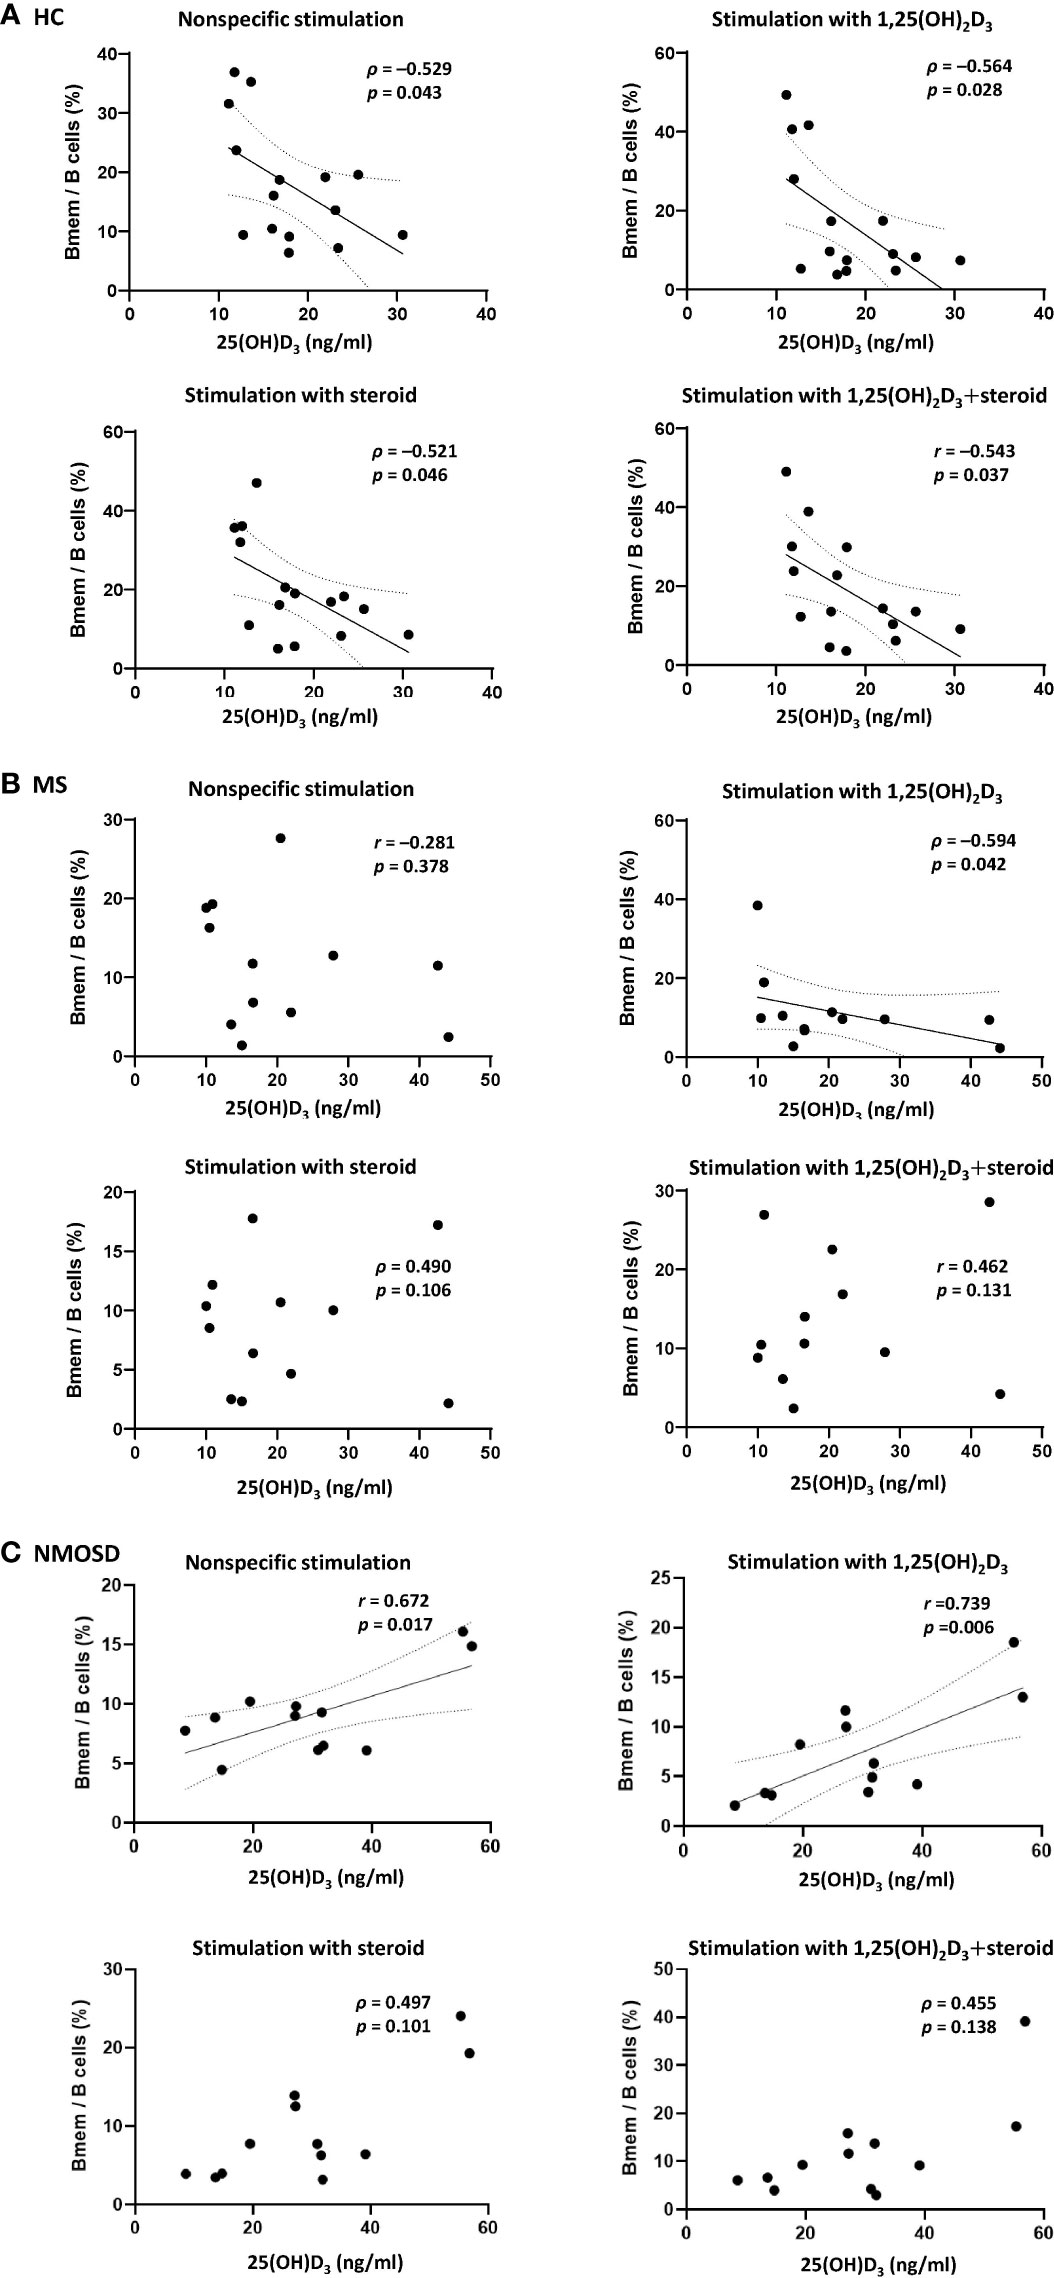
Figure 3 Correlations between the proportion of Bmem in samples of PBMCs and serum 25(OH)D3 in HCs and in patients with MS or NMOSD. A negative correlation between the percentage of Bmem and serum 25(OH)D3 was found (A) in HCs regardless of the type of stimulation (i.e., steroid or 1,25(OH)2D3), and (B) in patients with MS only after stimulation of PBMCs with 1,25(OH)2D3. (C) In NMOSD, significant positive correlations were found after PBMC stimulation, with or without 1,25(OH)2D3. Linear regression lines indicate significant correlations. 1,25(OH)2D3, 1,25-dihydroxyvitamin D3; Bmem, CD19+CD27+ memory B cell; HCs, healthy controls; MS, multiple sclerosis; NMOSD, neuromyelitis optica spectrum disorder; serum 25(OH)D3, serum concentration of 1,25-dihydroxyvitamin D3.
Changes in Expression Levels of VDR, CYP27B1, CYP24A1, and IL-10 Genes in Response to 1,25(OH)2D3
1,25(OH)2D3-induced changes in the PBMC mRNA expression levels of VDR, IL-10, CYP27B1, and CYP24A1 are shown in Figure 4. PBMCs from 15 HCs, 11 MS patients, and 13 NMOSD patients were included (Supplementary Table 1). PBMC stimulation with LPS+CD40L+CpG-ODN increased CYP27B1 mRNA expression, but the addition of 1,25(OH)2D3 suppressed it. PBMC CYP24A1 expression was also induced by stimulation with 1,25(OH)2D3. These findings were observed in PBMCs from all study groups and were statistically significant. However, the expression levels of VDR and IL-10 mRNA were unaffected by stimulation of PBMCs, with or without 1,25(OH)2D3.
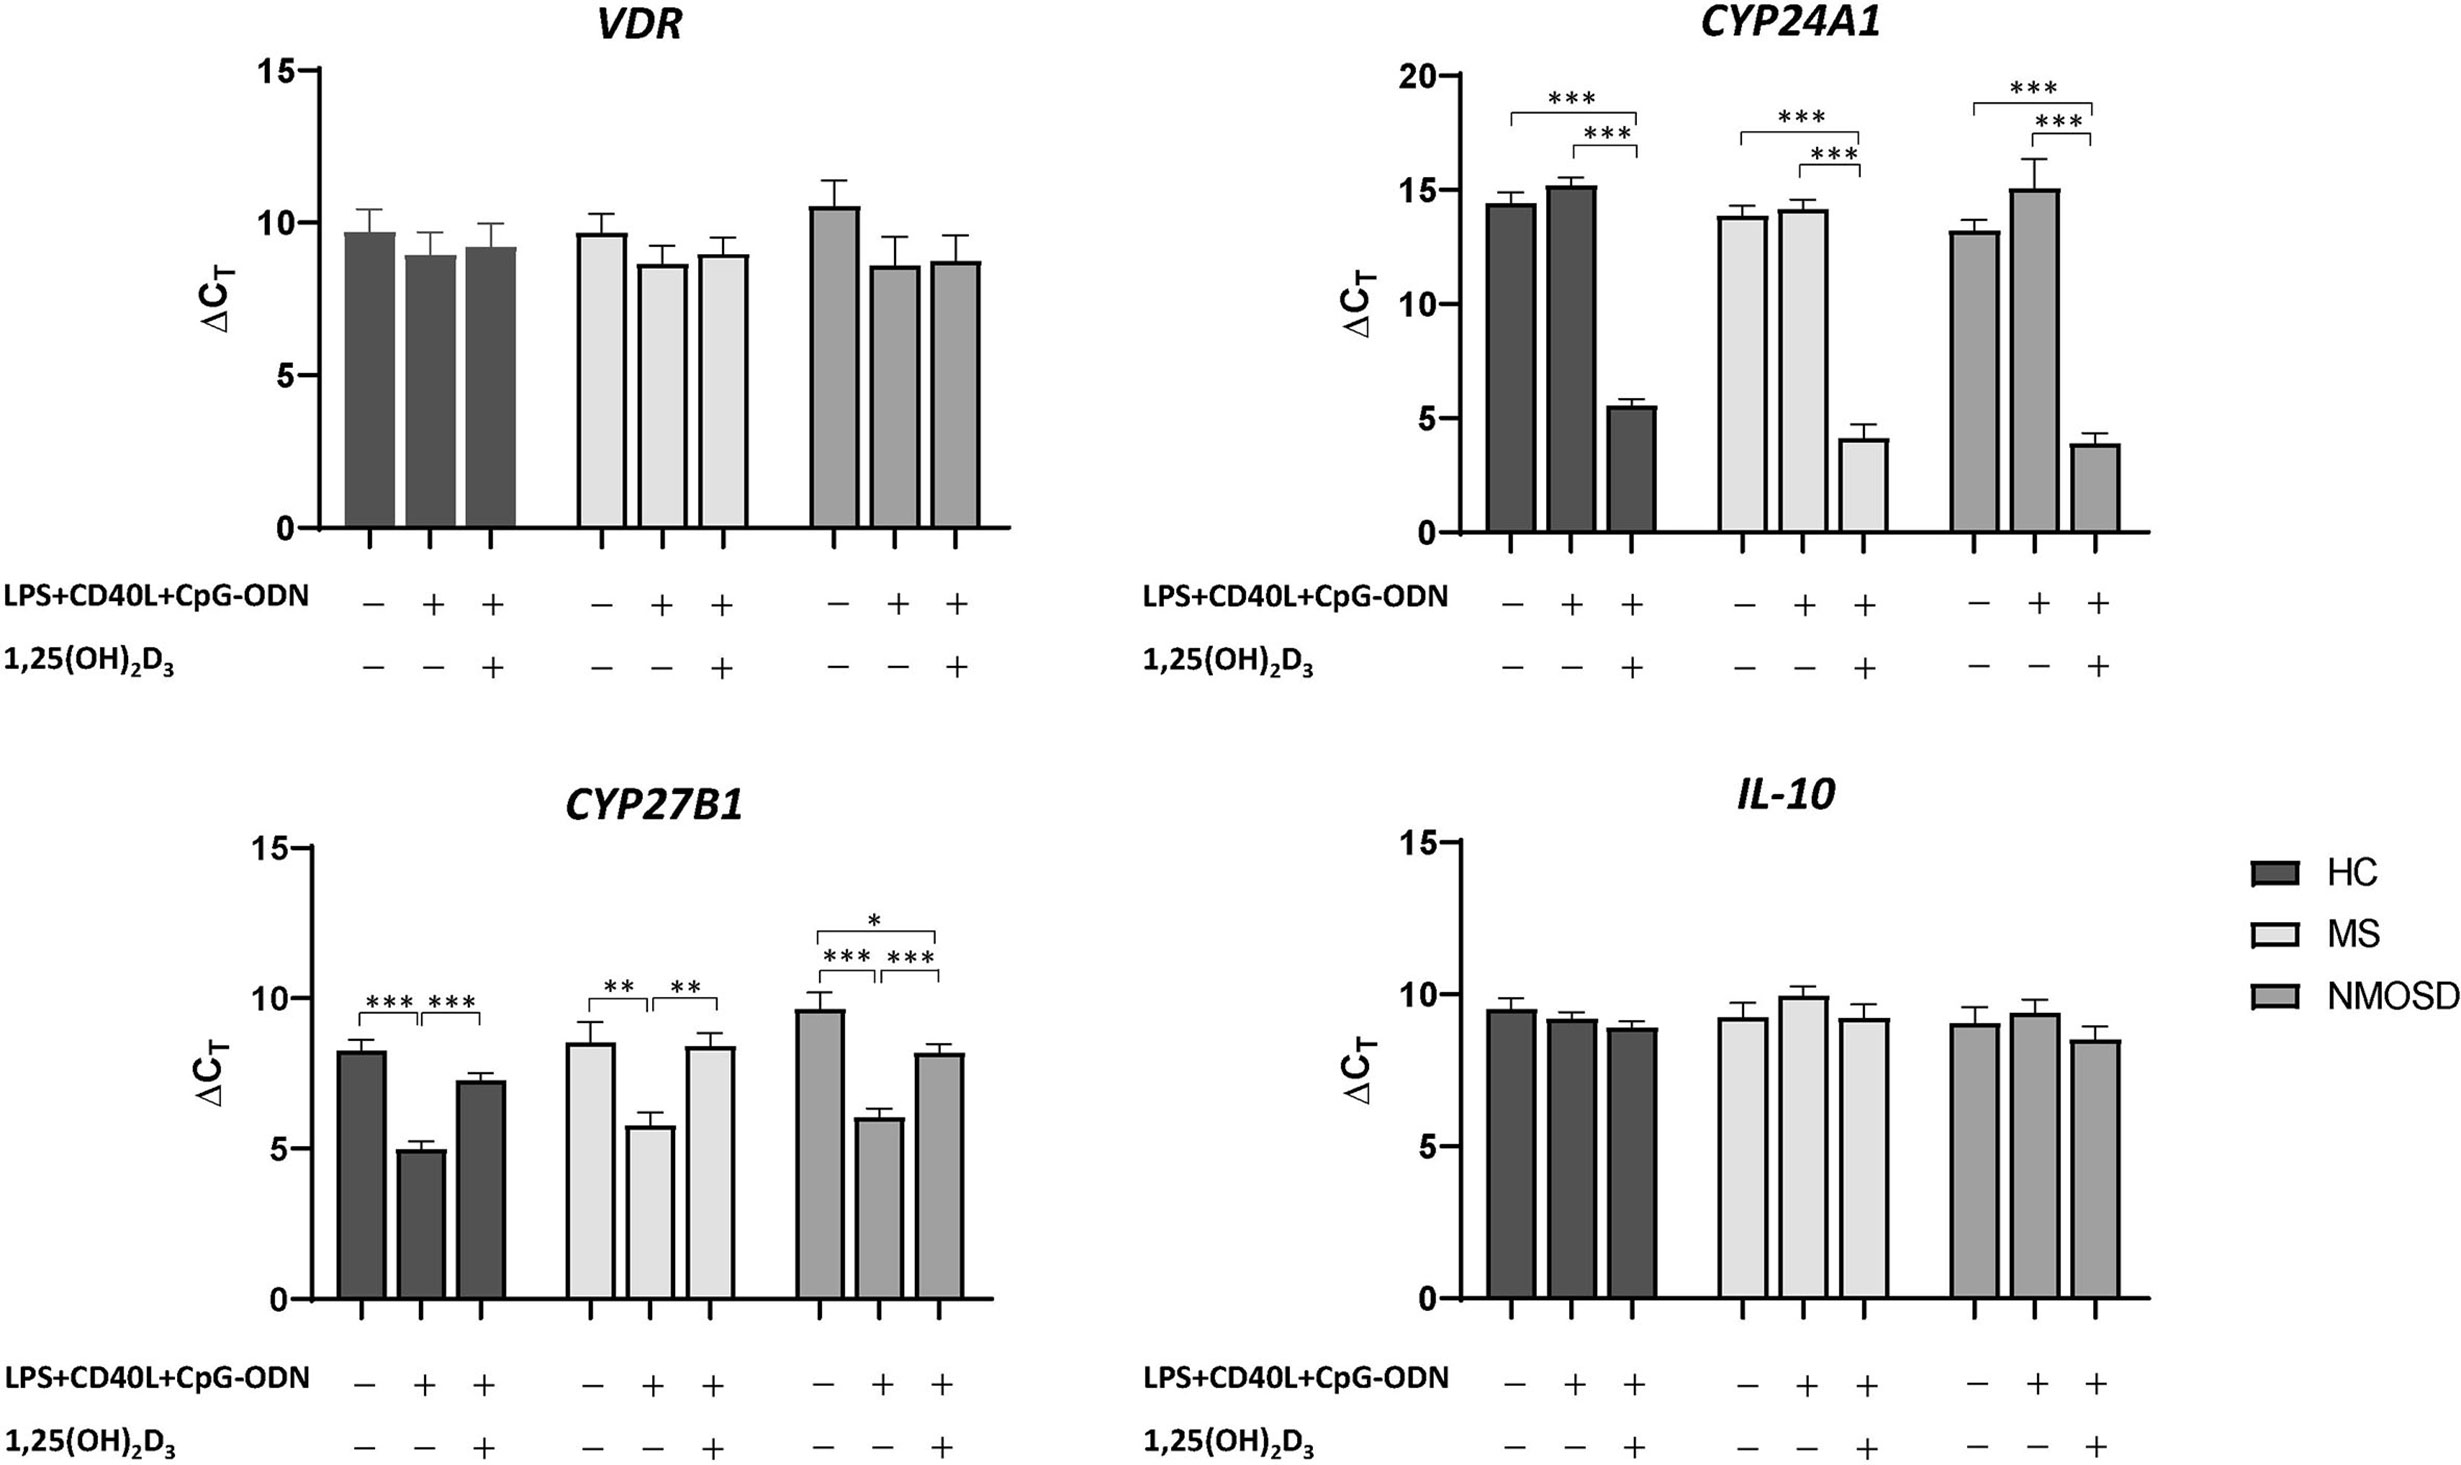
Figure 4 Changes in the mRNA expression of VDR, CYP27B1, CYP24A1, and IL-10 in PBMCs in response to stimulation with LPS+CD40L+CpG-ODN (nonspecific) with or without 1,25(OH)2D3. In HCs and patients with MS or NMOSD, stimulation with 1,25(OH)2D3 increased the mRNA expression of CYP24A1 and decreased that of CYP27B1 over those observed in samples stimulated with LPS+CD40L+CpG-ODN alone. *p<0.05, **p<0.01, ***p<0.001. 1,25(OH)2D3, 1,25-dihydroxyvitamin D3; CD40L, CD40 ligand; CpG-ODN, cytosine phosphate guanosine oligodeoxynucleotides; HC, healthy control; LPS, lipopolysaccharide; MS, multiple sclerosis; NMOSD, neuromyelitis optica spectrum disorder; PBMC, peripheral blood mononuclear cell.
In patients with MS, the level of 1,25(OH)2D3-induced CYP24A1 mRNA expression in PBMCs was significantly and negatively correlated with serum 25(OH)D3 (for ΔCT, r=0.744, p=0.014); however, no significant association was found for VDR, CYP27B1, and IL-10 mRNA expression (Figure 5). In HCs, the level of 1,25(OH)2D3-induced IL-10 mRNA expression was positively correlated with serum 25(OH)D3 (for ΔCT, r=0.590, p=0.026). In patients with NMOSD, there was no correlation between mRNA expression of VDR, CYP27B1, CYP24A1, or IL-10 and serum 25(OH)D3, irrespective of stimulation with 1,25(OH)2D3.
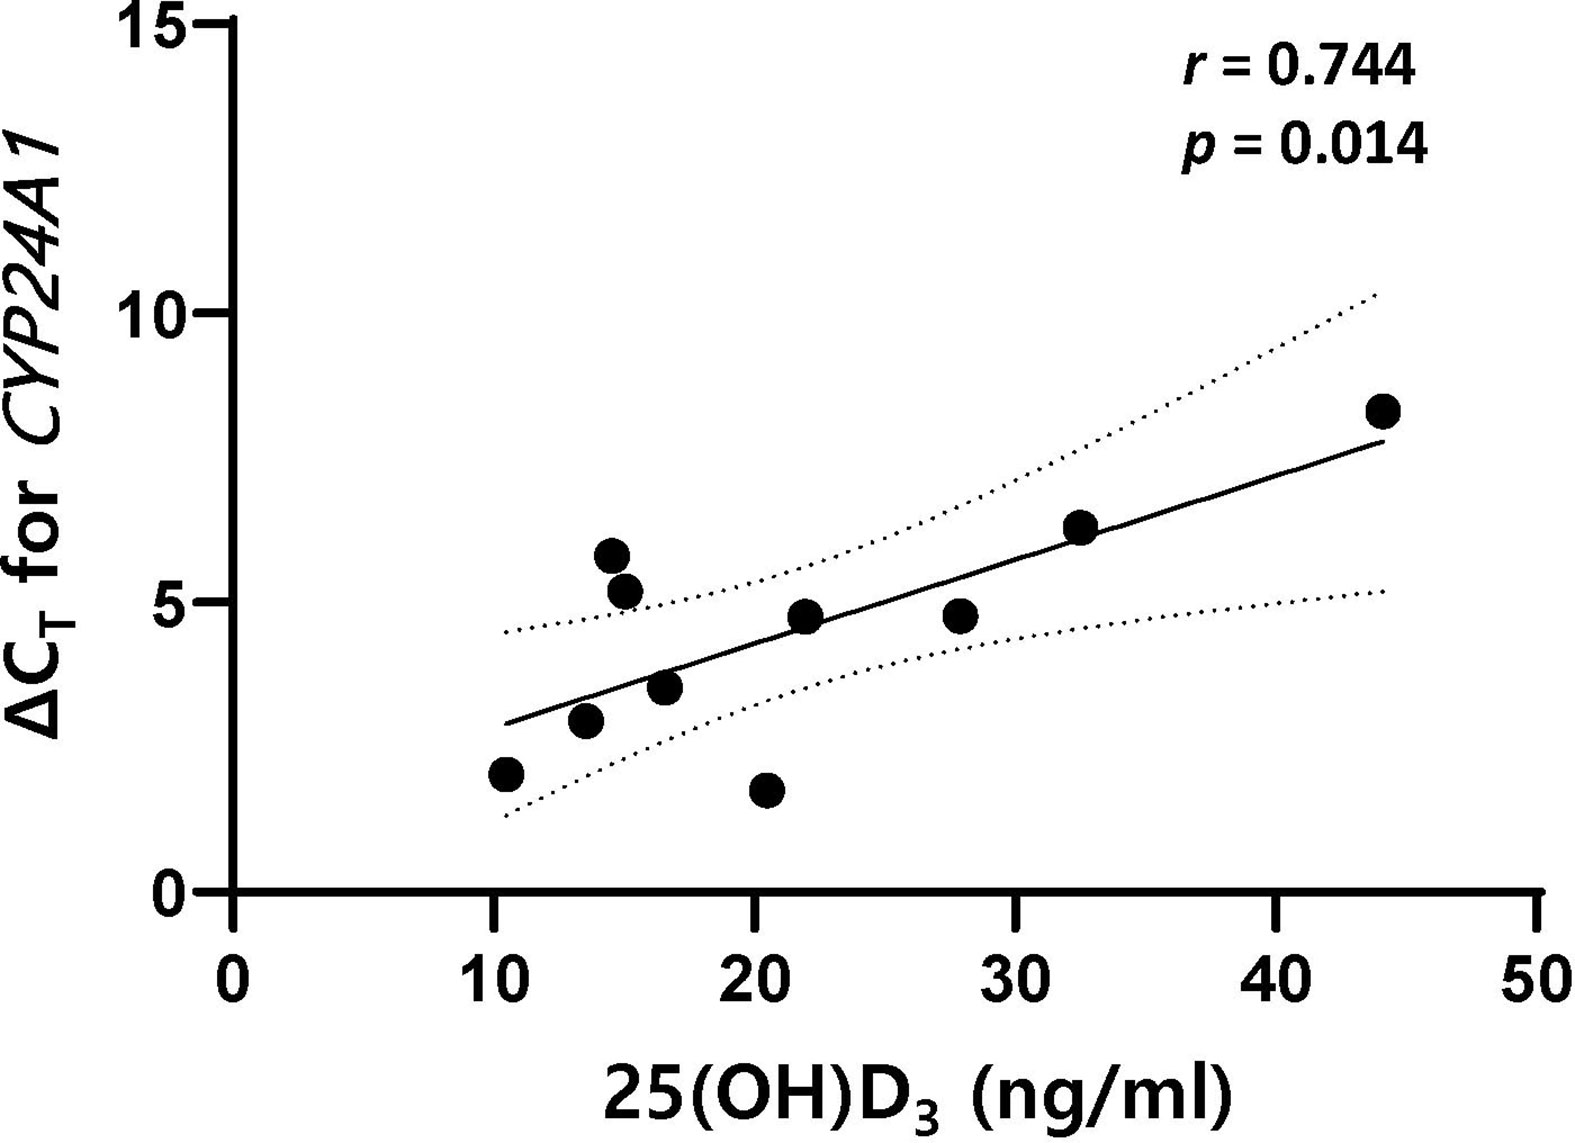
Figure 5 There was a positive correlation between ΔCT for CYP24A1 and serum 25(OH)D3 in patients with MS. The mRNA expression level of CYP24A1 after stimulation with 1,25(OH)2D3 was lower in MS patients with higher serum 25(OH)D3. 1,25(OH)2D3, 1,25-dihydroxyvitamin D3; ΔCT, difference in cycle threshold between that for the target gene and that for GAPDH; MS, multiple sclerosis; serum 25(OH)D3, serum concentration of 1,25-dihydroxyvitamin D3.
Discussion
The findings of this study demonstrate that 1,25(OH)2D3 exerted an inhibitory effect on the proliferation of lymphocytes, and especially T cells. However, in patients with MS and NMOSD, this 1,25(OH)2D3-induced suppression of lymphocytes (total and T cells) was obvious upon subsequent stimulation with steroid. In addition, statistically significant associations in the opposite direction were found between serum 25(OH)D3 and the Bmem/B cell ratio after PBMC stimulation in patients with MS and NMOSD; it should be noted that there was no correlation between the Bmem/Breg ratio and serum 25(OH)D3. Moreover, the expression of CYP24A1, the gene encoding a 1,25(OH)2D3-catabolizing enzyme, was less expressed in response to 1,25(OH)2D3 in MS patients with higher serum 25(OH)D3.
Stimulation with 1,25(OH)2D3 followed by steroid decreased the percentage of total lymphocytes and T cells in PBMCs from patients with MS and NMOSD. This finding could be explained by the known immune regulatory role of vitamin D. The active form of vitamin D, 1,25(OH)2D3, induces monocyte proliferation, which contributes to the innate immune response and attenuates the cytotoxic activity and proliferation of CD4+ and CD8+ T cells by reducing proinflammatory cytokine production (1). 1,25(OH)2D3 could enhance the anti-inflammatory effects of corticosteroids on monocytes and T cells via the induction of glucocorticoid receptor binding of steroids both in vitro and in vivo (22, 23). Combined treatment with steroid and 1,25(OH)2D3 may thus have therapeutic potential in patients with MS or NMOSD by decreasing the T-cell-mediated autoimmune processes. 1,25(OH)2D3 also exerts potent direct effects on B-cell responses, inhibiting their proliferation and differentiation into class-switched Bmem and plasma cells (6). However, there were no significant changes in the proportion of Breg and B cells in response to stimulation of PBMCs with 1,25(OH)2D3. Little is known about the effect of glucocorticoid on B cells. Dexamethasone could induce apoptosis of B cells at all stages (24), and especially immature B cells, and could stimulate T-cell-dependent immunoglobulin production by enhancing the differentiation of B cells into mature plasma cells without proliferation (25). In NMOSD, it was reported that the frequencies of mature Bmem increased after 2 weeks of high-dose steroid treatment (26). In the present study, the proportion of Bmem in PBMCs from NMOSD patients, which were initially reduced by stimulation with 1,25(OH)2D3, subsequently increased after stimulation with steroid, although the frequencies of Bmem did not differ between cells incubated with either 1,25(OH)2D3 or steroid alone. This may indicate that steroid-induced Bmem proliferation could be augmented by 1,25(OH)2D3 (22, 23). However, these findings were not observed in either HCs or MS patients; thus, further investigation is warranted.
It was particularly interesting that significant associations were observed between serum 25(OH)D3 and Bmem frequency in PBMCs stimulated with LPS+CD40L+CpG-ODN, with the correlation being negative in HCs and positive in NMOSD. In MS patients, the PBMC Bmem frequency was negatively correlated with serum 25(OH)D3 after preincubation with 1,25(OH)2D3. Clinical data regarding the relationship between Bmem and serum 25(OH)D3 in autoimmune diseases are scarce. In SLE, a significant negative association was identified between serum 25(OH)D3 and Bmem, but not total B cells or plasmablasts (27). MS patients with a low vitamin D status exhibited decreased cerebrospinal fluid levels of vitamin D and greater intrathecal accumulation of class-switched Bmem and antibody-secreting plasma cells (7). Since Bmem are considered to be a source of proinflammatory cytokines, which are responsible for pathogenic effects during autoimmune processes (28, 29), it seems to be contradictory that NMOSD patients with higher serum 25(OH)D3 would have higher Bmem frequencies. However, the immune balance represented by the Bmem/Breg ratio was not correlated with the vitamin D level in NMOSD. After PBMC stimulation, the proportion of Bmem was significantly decreased in NMOSD, unlike in MS. The significance of a lower proliferation of non-Bmem in NMOSD patients with higher serum 25(OH)D3 remains to be established. The present findings also suggest that the suppressive effect of vitamin D on Bmem is stronger in MS patients with higher serum 25(OH)D3. A recent meta-analysis suggested that vitamin D supplementation has a therapeutic role in the treatment of MS; however, there is uncertainty about the most appropriate dose and factors influencing the immune regulatory roles of 1,25(OH)2D3 (30). The therapeutic potential of vitamin D intake in patients with MS and NMOSD needs to be investigated further.
The biological activity of vitamin D is determined by the combination of levels of VDR expression and the activities of the metabolizing enzymes 1α-hydroxylase (CYP27B1) and 24-hydroxylase (CYP24A1) (1). 1,25(OH)2D3 acts mainly via VDR-mediated regulation of gene expression, and VDR transcription is induced by 1,25(OH)2D3 itself (31). IL-10 expression in activated B cells is enhanced by 1,25(OH)2D3 more than threefold, primarily through the recruitment of VDR to the promoter of IL-10 (32). However, the mRNA expression levels of VDR and IL-10 in PBMCs were not significantly influenced by the presence of 1,25(OH)2D3 in the present study. This may be attributable to upregulated VDR expression by inflammatory signals offsetting the effects of 1,25(OH)2D3 on immune cells (3), or mRNA measurement times that were inappropriate for allowing the detection of any effect (33). In stimulated PBMCs, feedback regulation of vitamin D metabolism by 1,25(OH)2D3 was observed in HCs, and in patients with MS and NMOSD. The presence of CYP27B1 has been demonstrated in immune cells, enabling them to produce locally active 1,25(OH)2D3 from 25(OH)D3 (1). CYP24A1 expression is also induced by 1,25(OH)2D3, creating a self-regulatory feedback loop and enabling 1,25(OH)2D3 to fulfill its role in maintaining immune balance (31). It is noteworthy that in response to stimulation with 1,25(OH)2D3, CYP24A1 mRNA expression was lower in MS patients with higher serum 25(OH)D3. This suggests that serum 25(OH)D3 is associated with impaired regulation of CYP24A1 activity. There are few previous reports on the associations between genetic polymorphisms in vitamin-D-regulated genes such as CYP24A1, vitamin D status, and MS risk (34, 35). Further studies with larger samples are needed to reveal the mechanism underlying the impaired regulation of vitamin D hydroxylation in MS.
This study had several limitations. The small number of samples in each study group must be considered when interpreting these data, which reduced the statistical power and may have introduced unintended bias. In addition, the enrolled patients were all in remission with heterogenous disease duration and had been taking immunosuppressive or disease-modifying drugs, which could affect immune cell function. Moreover, we did not obtain age-matched HCs compared with the NMOSD group, which could affect the composition and quality of the lymphocyte pool.
In conclusion, the findings of this study suggest that vitamin D plus steroid has a therapeutic benefit on T cells in MS and NMOSD, and that differential transcriptional activities of the CYP24A1 gene could exist that affect serum 25(OH)D3 in MS. In addition, vitamin D may have different inhibitory effects on Bmem that are dependent upon serum 25(OH)D3 in MS and NMOSD. The positive association between CD19+CD27+ B-cell frequency and serum 25(OH)D3 in NMOSD after immune-cell stimulation must also be further explored to establish whether vitamin D does have beneficial effects in this autoimmune disease, or if this was simply an accidental correlation. Further large-scale studies could help to elucidate the immunoregulatory mechanism of vitamin D supplementation in patients with MS and NMOSD.
Data Availability Statement
The datasets presented in this study can be found in online repositories. The names of the repository/repositories and accession number(s) can be found in the article/Supplementary Material.
Ethics Statement
The study was approved by the Institutional Review Board of Samsung Medical Center and written informed consents were obtained from all subjects.
Author Contributions
Study concept and design: EBC and J-HM. Acquisition of data: EBC, JHS, SK, JK, JMS, BK, and J-HM. Analysis and interpretation of the data: EBC, BK, and J-HM. Draft and revision of the manuscript for content: EBC and J-HM. All authors contributed to the article and approved the submitted version.
Funding
This research was supported by Basic Science Research Program through the National Research Foundation of Korea (NRF) funded by the Ministry of Education (2016R1D1A1B03934476).
Conflict of Interest
The authors declare that the research was conducted in the absence of any commercial or financial relationships that could be construed as a potential conflict of interest.
Publisher’s Note
All claims expressed in this article are solely those of the authors and do not necessarily represent those of their affiliated organizations, or those of the publisher, the editors and the reviewers. Any product that may be evaluated in this article, or claim that may be made by its manufacturer, is not guaranteed or endorsed by the publisher.
Supplementary Material
The Supplementary Material for this article can be found online at: https://www.frontiersin.org/articles/10.3389/fimmu.2021.677041/full#supplementary-material
Supplementary Figure 1 | Changes in the proportion of lymphocytes in samples of PBMCs in response to stimulation with LPS+CD40L+CpG-ODN (nonspecific) in HCs and in patients with MS or NMOSD. A significant increase in total lymphocyte percentage was noted in the NMOSD group (A). Relative B-cell proliferation compared with T cells was found in the MS and NMOSD groups (B, C). The Bmem/Breg ratio was significantly reduced in HCs and patients with NMOSD, but not in those with MS (D–F). Bmem, CD19+CD27+ memory B cell; Breg, CD19+CD24+CD38+ regulatory B cell; CD40L, CD40 ligand; CpG-ODN, cytosine phosphate guanosine oligodeoxynucleotides; HC, healthy control; LPS, lipopolysaccharide; MS, multiple sclerosis; NMOSD, neuromyelitis optica spectrum disorder; PBMC, peripheral blood mononuclear cell.
References
1. Mora JR, Iwata M, Von Andrian UH. Vitamin Effects on the Immune System: Vitamins A and D Take Centre Stage. Nat Rev Immunol (2008) 8(9):685–98. doi: 10.1038/nri2378
2. Jeffery LE, Wood AM, Qureshi OS, Hou TZ, Gardner D, Briggs Z, et al. Availability of 25-Hydroxyvitamin D3 to APCs Controls the Balance Between Regulatory and Inflammatory T Cell Responses. J Immunol (2012) 189(11):5155–64. doi: 10.4049/jimmunol.1200786
3. Kongsbak M, Levring TB, Geisler C, Von Essen MR. The Vitamin D Receptor and T Cell Function. Front Immunol (2013) 4:148. doi: 10.3389/fimmu.2013.00148
4. Rolf L, Muris AH, Hupperts R, Damoiseaux J. Vitamin D Effects on B Cell Function in Autoimmunity. Ann New York Acad Sci (2014) 1317(1):84–91. doi: 10.1111/nyas.12440
5. Royal IIIW, Mia Y, Li H, Naunton K. Peripheral Blood Regulatory T Cell Measurements Correlate With Serum Vitamin D Levels in Patients With Multiple Sclerosis. J Neuroimmunol (2009) 213(1–2):135–41. doi: 10.1016/j.jneuroim.2009.05.012
6. Chen S, Sims GP, Chen XX, Gu YY, Chen S, Lipsky PE. Modulatory Effects of 1, 25-Dihydroxyvitamin D3 on Human B Cell Differentiation. J Immunol (2007) 179(3):1634–47. doi: 10.4049/jimmunol.179.3.1634
7. Haas J, Schwarz A, Korporal-Kuhnke M, Faller S, Jarius S, Wildemann B. Hypovitaminosis D Upscales B-Cell Immunoreactivity in Multiple Sclerosis. J Neuroimmunol (2016) 294:18–26. doi: 10.1016/j.jneuroim.2016.03.011
8. Garcia-Carrasco M, Jiménez-Herrera EA, Gálvez-Romero JL, de Lara LV, Mendoza-Pinto C, Etchegaray-Morales I, et al. Vitamin D and Sjögren Syndrome. Autoimmun Rev (2017) 16(6):587–93. doi: 10.1016/j.autrev.2017.04.004
9. Iruretagoyena M, Hirigoyen D, Naves R, Burgos PI. Immune Response Modulation by Vitamin D: Role in Systemic Lupus Erythematosus. Front Immunol (2015) 6:513. doi: 10.3389/fimmu.2015.00513
10. Kim D. The Role of Vitamin D in Thyroid Diseases. Int J Mol Sci (2017) 18(9):1949. doi: 10.3390/ijms18091949
11. Min J-H, Waters P, Vincent A, Cho H-J, Joo B-E, Woo S-Y, et al. Low Levels of Vitamin D in Neuromyelitis Optica Spectrum Disorder: Association With Disease Disability. PloS One (2014) 9(9):e107274. doi: 10.1371/journal.pone.0107274
12. Sintzel MB, Rametta M, Reder AT. Vitamin D and Multiple Sclerosis: A Comprehensive Review. Neurol Ther (2018) 7(1):59–85. doi: 10.1007/s40120-017-0086-4
13. Wu Y, Cai Y, Liu M, Zhu D, Guan Y. The Potential Immunoregulatory Roles of Vitamin D in Neuromyelitis Optica Spectrum Disorder. Multiple Sclerosis Related Disord (2020) 43:102156. doi: 10.1016/j.msard.2020.102156
14. Segal BM. Th17 Cells in Autoimmune Demyelinating Disease. Seminars in Immunopathology. (2010) 32(1):71–7. doi: 10.1007/s00281-009-0186-z
15. Wingerchuk DM, Banwell B, Bennett JL, Cabre P, Carroll W, Chitnis T, et al. International Consensus Diagnostic Criteria for Neuromyelitis Optica Spectrum Disorders. Neurology (2015) 85(2):177–89. doi: 10.1212/WNL.0000000000001729
16. Kimura A, Kishimoto T. IL-6: Regulator of Treg/Th17 Balance. Eur J Immunol (2010) 40(7):1830–5. doi: 10.1002/eji.201040391
17. Hsu H-C, Yang P, Wang J, Wu Q, Myers R, Chen J, et al. Interleukin 17–Producing T Helper Cells and Interleukin 17 Orchestrate Autoreactive Germinal Center Development in Autoimmune BXD2 Mice. Nat Immunol (2008) 9(2):166–75. doi: 10.1038/ni1552
18. Rodney C, Rodney S, Millis RM. Vitamin D and Demyelinating Diseases: Neuromyelitis Optica (NMO) and Multiple Sclerosis (Ms). Autoimmune Dis (2020) 2020:8718736. doi: 10.1155/2020/8718736
19. Shan Y, Tan S, Zhang L, Huang J, Sun X, Wang Y, et al. Serum 25-Hydroxyvitamin D3 Is Associated With Disease Status in Patients With Neuromyelitis Optica Spectrum Disorders in South China. J Neuroimmunol (2016) 299:118–23. doi: 10.1016/j.jneuroim.2016.09.006
20. Thompson AJ, Banwell BL, Barkhof F, Carroll WM, Coetzee T, Comi G, et al. Diagnosis of Multiple Sclerosis: 2017 Revisions of the McDonald Criteria. Lancet Neurol (2018) 17(2):162–73. doi: 10.1016/S1474-4422(17)30470-2
21. Klein U, Rajewsky K, Küppers R. Human Immunoglobulin (Ig) M+ IgD+ Peripheral Blood B Cells Expressing the CD27 Cell Surface Antigen Carry Somatically Mutated Variable Region Genes: CD27 as a General Marker for Somatically Mutated (Memory) B Cells. J Exp Med (1998) 188(9):1679–89. doi: 10.1084/jem.188.9.1679
22. Hoepner R, Bagnoud M, Pistor M, Salmen A, Briner M, Synn H, et al. Vitamin D Increases Glucocorticoid Efficacy via Inhibition of Mtorc1 in Experimental Models of Multiple Sclerosis. Acta Neuropathol (2019) 138(3):443–56. doi: 10.1007/s00401-019-02018-8
23. Zhang Y, Leung DY, Goleva E. Anti-Inflammatory and Corticosteroid-Enhancing Actions of Vitamin D in Monocytes of Patients With Steroid-Resistant and Those With Steroid-Sensitive Asthma. J Allergy Clin Immunol (2014) 133(6):1744–52.e1. doi: 10.1016/j.jaci.2013.12.004
24. Gruver-Yates AL, Quinn MA, Cidlowski JA. Analysis of Glucocorticoid Receptors and Their Apoptotic Response to Dexamethasone in Male Murine B Cells During Development. Endocrinology (2014) 155(2):463–74. doi: 10.1210/en.2013-1473
25. Grayson J, Dooley N, Koski I, Blaese R. Immunoglobulin Production Induced In Vitro by Glucocorticoid Hormones: T Cell-Dependent Stimulation of Immunoglobulin Production Without B Cell Proliferation in Cultures of Human Peripheral Blood Lymphocytes. J Clin Invest (1981) 68(6):1539–47. doi: 10.1172/JCI110408
26. Quan C, ZhangBao J, Lu J, Zhao C, Cai T, Wang B, et al. The Immune Balance Between Memory and Regulatory B Cells in NMO and the Changes of the Balance After Methylprednisolone or Rituximab Therapy. J Neuroimmunol (2015) 282:45–53. doi: 10.1016/j.jneuroim.2015.03.016
27. Yamamoto EA, Nguyen JK, Liu J, Keller E, Campbell N, Zhang C-J, et al. Low Levels of Vitamin D Promote Memory B Cells in Lupus. Nutrients (2020) 12(2):291. doi: 10.3390/nu12020291
28. Duddy M, Niino M, Adatia F, Hebert S, Freedman M, Atkins H, et al. Distinct Effector Cytokine Profiles of Memory and Naive Human B Cell Subsets and Implication in Multiple Sclerosis. J Immunol (2007) 178(10):6092–9. doi: 10.4049/jimmunol.178.10.6092
29. Kim S-H, Huh S-Y, Lee SJ, Joung A, Kim HJ. A 5-Year Follow-Up of Rituximab Treatment in Patients With Neuromyelitis Optica Spectrum Disorder. JAMA Neurol (2013) 70(9):1110–7. doi: 10.1001/jamaneurol.2013.3071
30. McLaughlin L, Clarke L, Khalilidehkordi E, Butzkueven H, Taylor B, Broadley SA. Vitamin D for the Treatment of Multiple Sclerosis: A Meta-Analysis. J Neurol (2018) 265(12):2893–905. doi: 10.1007/s00415-018-9074-6
31. Van Etten E, Stoffels K, Gysemans C, Mathieu C, Overbergh L. Regulation of Vitamin D Homeostasis: Implications for the Immune System. Nutr Rev (2008) 66(suppl_2):S125–34. doi: 10.1111/j.1753-4887.2008.00096.x
32. Heine G, Niesner U, Chang HD, Steinmeyer A, Zügel U, Zuberbier T, et al. 1, 25-Dihydroxyvitamin D3 Promotes IL-10 Production in Human B Cells. Eur J Immunol (2008) 38(8):2210–8. doi: 10.1002/eji.200838216
33. Matilainen JM, Räsänen A, Gynther P, Väisänen S. The Genes Encoding Cytokines IL-2, IL-10 and IL-12B are Primary 1α, 25 (OH) 2D3 Target Genes. J Steroid Biochem Mol Biol (2010) 121(1–2):142–5. doi: 10.1016/j.jsbmb.2010.03.020
34. Agnello L, Scazzone C, Sasso BL, Ragonese P, Milano S, Salemi G, et al. CYP27A1, CYP24A1, and RXR-α Polymorphisms, Vitamin D, and Multiple Sclerosis: A Pilot Study. J Mol Neurosci (2018) 66(1):77–84. doi: 10.1007/s12031-018-1152-9
Keywords: vitamin D, lymphocytes, memory B cells, CYP24A1, multiple sclerosis, neuromyelitis optica spectrum disorder
Citation: Cho EB, Shin JH, Kwon S, Kim J, Seok JM, Kim BJ and Min J-H (2021) Effects of Vitamin D and Dexamethasone on Lymphocyte Proportions and Their Associations With Serum Concentrations of 25-Hydroxyvitamin D3In Vitro in Patients With Multiple Sclerosis or Neuromyelitis Optica Spectrum Disorder. Front. Immunol. 12:677041. doi: 10.3389/fimmu.2021.677041
Received: 07 March 2021; Accepted: 30 June 2021;
Published: 29 July 2021.
Edited by:
Carlo Perricone, Sapienza University of Rome, ItalyReviewed by:
Valeria Internò, University of Bari Aldo Moro, ItalyOmid Mirmosayyeb, Isfahan University of Medical Sciences, Iran
Copyright © 2021 Cho, Shin, Kwon, Kim, Seok, Kim and Min. This is an open-access article distributed under the terms of the Creative Commons Attribution License (CC BY). The use, distribution or reproduction in other forums is permitted, provided the original author(s) and the copyright owner(s) are credited and that the original publication in this journal is cited, in accordance with accepted academic practice. No use, distribution or reproduction is permitted which does not comply with these terms.
*Correspondence: Ju-Hong Min, anVob25nbUBza2t1LmVkdQ==