 Lihui Liu
 Chao Wang
 Sini Li1
 Yan Qu
 Pei Xue
 Zixiao Ma
 Xue Zhang
 Jie Wang
- 1National Cancer Center/National Clinical Research Center for Cancer/Cancer Hospital, Chinese Academy of Medical Sciences and Peking Union Medical College, Beijing, China
- 2Sleep Medicine Center, West China Hospital, Sichuan University, Chengdu, China
- 3State Key Laboratory of Molecular Oncology, Department of Medical Oncology, National Cancer Center/National Clinical Research Center for Cancer/Cancer Hospital, Chinese Academy of Medical Sciences and Peking Union Medical College, Beijing, China
Background: The endoplasmic reticulum oxidoreductin-1-like (ERO1L) gene encodes an endoplasmic reticulum luminal localized glycoprotein known to associated with hypoxia, however, the role of ERO1L in shaping the tumor immune microenvironment (TIME) is yet to be elucidated in lung adenocarcinoma (LUAD).
Methods: In this study, raw datasets (including RNA-seq, methylation, sgRNA-seq, phenotype, and survival data) were obtained from public databases. This data was analyzed and used to explore the biological landscape of ERO1L in immune infiltration. Expression data was used to characterize samples. Using gene signatures and cell quantification, stromal and immune infiltration was determined. These findings were used to predict sensitivity to immunotherapy.
Results: This study found that ERO1L was significantly overexpressed in LUAD in comparison to normal tissue. This overexpression was found to be a result of hypomethylation of the ERO1L promoter. Overexpression of ERO1L resulted in an immune-suppressive TIME via the recruitment of immune-suppressive cells including regulatory T cells (Tregs), cancer associated fibroblasts, M2-type macrophages, and myeloid-derived suppressor cells. Using the Tumor Immune Dysfunction and Exclusion (TIDE) framework, it was identified that patients in the ERO1Lhigh group possessed a significantly lower response rate to immunotherapy in comparison to the ERO1Llow group. Mechanistic analysis revealed that overexpression of ERO1L was associated with the upregulation of JAK-STAT and NF-κB signaling pathways, thus affecting chemokine and cytokine patterns in the TIME.
Conclusions: This study found that overexpression of ERO1L was associated with poor prognoses in patients with LUAD. Overexpression of ERO1L was indicative of a hypoxia-induced immune-suppressive TIME, which was shown to confer resistance to immunotherapy in patients with LUAD. Further studies are required to assess the potential role of ERO1L as a biomarker for immunotherapy efficacy in LUAD.
Introduction
Lung cancer is a leading cause of cancer-related mortality and lung adenocarcinoma (LUAD) accounts for approximately 50% of all reported cases (1). In recent years, as precision medicine is becoming a reality, LUAD treatments have gradually evolved from empirical chemotherapy to personalized therapies. Immunotherapies, which have the advantage of high efficiency, long duration, and low toxicity, have led to a paradigm shift in cancer treatment. Immunotherapy has become the standard of care for advanced LUAD. However, widespread usage of immunotherapy is limited and drug resistance is increasingly reported (2, 3). As a result, the identification of biomarkers to enable patient selection is urgently required.
There is a growing body of evidence supporting the theory that the tumor immune microenvironment (TIME) plays a crucial role in the response to immunotherapy. The TIME comprises a series of infiltrating cells, such as neoplastic cells, immune cells, endothelial cells, fibroblasts. Different infiltration components are associated with different clinical outcomes. Based on immune score, recent research has classified TIME into three subtypes: immune-inflamed (I-I TIME), immune-desert (I-D TIME), and immune-excluded (I-E TIME) (4). Patients with I-I TIME are frequently reported to be infiltrated with an abundance of inflammatory cells. This indicates that they will have a significant clinical response to immune checkpoint inhibitor (ICI) therapy. Contrastingly, I-D TIME and I-E TIME are both be considered noninflamed TIME. As such, these patients are rarely responsive to ICI therapy (5). The differential responses of these subtypes present the need to develop individualized treatment strategies. However, two key challenges remain. Firstly, determination of the threshold for an inflamed or noninflamed TIME. And secondly, the lack of appropriate biomarkers that are able to distinguish TIME subtypes (6).
The endoplasmic reticulum oxidoreductin-1-like (ERO1L) gene, which is located on chromosome 14 in humans, is considered to be the primary source of the endoplasmic reticulum. ERO1L is an endoplasmic reticulum luminal localized glycoprotein which favors disulfide bond formation via the selective oxidization from protein disulfide isomerases (7). Hypoxia is a hallmark of the tumor microenvironment and is reported in the majority of tumors overexpressing ERO1L (8). Hypoxic stress has been described to cause immunosuppression by controlling angiogenesis. This is predicted to result in resistance to ICI therapy (9). What’s more, ERO1L is known to promote programmed death-ligand 1 (PD-L1) expression by increasing the expression of hypoxia-inducible factor1α (HIF-1α) and subsequently facilitating oxidative protein folding within PD-L1. Ultimately, this results in immune escape (10). The role of ERO1L in the crafting of the tumor immunological microenvironment is yet to be elucidated.
In this study, the association between ERO1L expression and TIME was investigated in LUAD. Bioinformatics techniques including cell quantification algorithms and gene expression profiling were used. This study identified that the overexpression of ERO1L is a feature in an immune-suppressive TIME. This provided insight into the potential association between ERO1L and tumor-immune interactions.
Materials and Methods
mRNA and Protein Expression Analyses of ERO1L Using Public Databases
The ERO1L mRNA expression in pan-cancer was analyzed in the Oncomine database (www.oncomine.org) with the following thresholds: p-value of 0.001, a fold change of 1.5, and a top 10% gene ranking (11). The expression data belonging to four datasets (GSE7670, GSE31210, GSE32863, and GSE19188) were downloaded from the GEO database (https://www.ncbi.nlm.nih.gov/geo/). Expression profiles were normalized by z-scores of log2(count+1). Using the limma package in R-4.0.3, batch normalization was also completed. Protein expression levels were analyzed using the HPA database (http://www.proteinatlas.org). Antibodies used in the HPA database included HPA026653 (Sigma-Aldrich), HPA030053 (Sigma-Aldrich) and CAB034294 (Santa Cruz Biotechnology). These three antibodies were all validated by orthogonal method (antibody staining mainly consistent with RNA expression data across 41 tissues) and by independent antibodies (protein distribution across 45 tissues similar between the independent antibodies HPA026653 and HPA030053).
TCGA Database Analysis
TCGA LUAD data was downloaded from the UCSC Xena database (http://xena.ucsc.edu/). This data included information on: RNA-seq (HTSeq-FPKM), DNA methylation (Illumina Human Methylation 450), and clinical profiles (including both phenotype and survival data). Expression levels were normalized using the z-score of log2(FPKM+1) to exclude potential bias. Patients were assigned into ERO1L-high and ERO1L-low groups based on the median expression value according to the RNA sequencing data. In terms of methylation analysis, we included 18 methylation sites (Table S4). These sites were mapped to the ERO1L gene using the UCSC Genome Browser HG19 RefSeq database (http://genome.ucsc.edu). The methylation level of each CpG site was recorded as a β value. This value indicated the ratio of the methylated signal intensity over the sum of the methylated and unmethylated intensities at each locus. Each locus with an average β-value of less than 0.20 was considered a hypomethylation site. In addition, Kaplan-Meier survival curves were plotted to show differences in survival time. For this data, log-rank p-values reported in the survival package in R-4.0.3 were used to determine statistical significance. Path analysis was performed in the ggalluvial in R-4.0.3. Visualization was performed using the OriginPro 2019b software (version 9.6.5.169).
Organoid Culture
Mouse lung tissue was carefully dissected avoiding other tissue contamination, then minced with surgical scalpels and incubated in Trypsin (Gibco) at 37°C for 40-50 min. The digestion was terminated with 10% serum (Gibco), and digested tissues were filtered with a 70 μm cell strainer in order to filter out debris that had not been fully digested. Cells were resuspended with Matrigel (Corning) and plated in 48 well plates. Then the Matrigel was solidified in an incubator at 37°C for 15-20 min and overlaid with 150-200 μL medium. Organoid medium contains advanced DMEM/F12, FGF 100 ng/mL, EGF 10 ng/mL, B27 supplement (2 X final), N2 supplement (1 X final), Noggin 100 ng/mL, RSPO-1 (10% final), Wnt-3a (10% final), Y27632 10 μM,A83-01 10 μM, Glutamax (1 X final) and Penstrep (1 X final). Cultures were kept at 37°C, 5% CO2 in an incubator and the medium was exchanged every 4-8 days according to the number of spheres. For passaging, the Matrigel containing organoids was dissolved in 3-5 mL TrypLE at 37°C for 10 min, and pipetted vigorously (80-100 times) to dissociate organoids into single cells. Cells were filtered with 70 μm cell strainer, centrifuged at 1,500 rpm for 10 min and resuspended with Matrigel.
Organoid Infection
Organoids were dissociated into single cells as described above, resuspended with 200 μL medium ae well as 2-3 mL virus particles, and added polybrene to 1 X final. After being centrifuged at 2,000 rpm, 37°C for 1 hour, the cells were then incubated at 4°C, 5% CO2 for 2-3 hours. Finally, an organoid culture was performed as described above.
Co-Expression Module Identification and Pathway Analysis
Firstly, genes which were co-expressed were identified in the Oncomine and TCGA databases respectively. By overlapping the results from these two databases, we identified a co-expression module consisting of 17-genes. STRING (version 10.5) was used to construct a protein-protein interaction (PPI) network. The 17 genes within the module were subjected to pathway enrichment analysis using DAVID (https://david-d.ncifcrf.gov/) (12). Results were visualized using the Hmisc and ggplot2 packages in R-4.0.3. Gene set enrichment analysis (GSEA) was performed using the GSEA software (version 4.1.0) and Broad’s GSEA algorithm (13).
Immune Infiltration Analysis
The relationship between ERO1L expression levels and immune infiltration was initially determined using the TIMER2.0 database (http://timer.comp-genomics.org). The TIMER2.0 database utilizes immunedeconv, which is an R package integrating six state-of-the-art algorithms. These algorithms include: TIMER, xCell, MCP-counter, CIBERSORT, EPIC, and quanTIseq (14). These algorithms were systematically benchmarked, and each was found to have unique properties and strengths. ERO1L expression was analyzed in the presence of seven types of immune infiltrating cells, including B cells, CD4+ T cells, CD8+ T cells, NK cells, macrophages, CAFs, and MDSCs. During immune infiltration analysis, adjustments were also made for tumor purity. The online tool CIBERSORTx (https://cibersortx.stanford.edu) was used to estimate different immune cell proportions (15).
Correlation analysis between the expression of ERO1L, immune cell markers and cytokines as well as chemokines was also performed using the TIMER2.0 database, specifically using the Gene_Corr module. The functionality of this module allows users to uncover the co-expression pattern of genes across TCGA cancer types. When provided with one initial gene of interest and up to 20 other genes, the TIMER2.0 database generates a heatmap table of Spearman’s correlation of gene expression between the gene of interest and the other input genes. After adjustment for tumor purity, a Spearman’s ρ >0 with p-value <0.05 was considered as a positive correlation and a Spearman’s ρ <0 with p-value <0.05 was considered as a positive correlation. Secondary confirmation of correlation analysis was performed using GEPIA (http://gepia.cancer-pku.cn) (16). Tertiary confirmation of correlation analysis was performed using TCGA expression data from the GEPIA database (http://gepia.cancer-pku.cn/index.html).
Single-Cell Sequencing Analysis
Processed gene expression data was download from the GEO database (GSE99254). This project consists of deep single-cell transcriptome data with complete T cell receptor information, which identified multi-dimensional characteristics of infiltrating lymphocytes (17). Single-cell transcriptome data was analyzed based on t-SNE dimension reduction using the R package Rtsne. Additionally, the Tumor Immune Single-cell Hub (TISCH) database was used to analyze the correlations between ERO1L expression and infiltrating immune cells (18). TISCH is a scRNA-seq database focusing on the tumor microenvironment. This database includes 79 datasets and 2,045,746 cells. TISCH provides detailed cell-type annotation at the single-cell level, enabling detailed exploration of the tumor microenvironment across various different cancer types.
Immunotherapy Response Prediction
In the first instance, in order to estimate the presence of the various immune cell populations in the LUAD tissues, the R package ESTIMATE was used. Estimation of STromal and Immune cells in MAlignant Tumor tissues using Expression data (ESTIMATE) is a tool that predicts tumor purity via the use of gene signatures. The tool calculates three scores, including stromal score, which predicts the presence of stromal cells in tumor bulk; immune score, which infers the levels of immune cells infiltration in tumor tissue; and estimate score, which estimates tumor purity. Subsequently, the R package MCPcounter was used to develop a more detailed idea of the level of immune cell infiltration. Microenvironment Cell Populations-counter (MCPcounter) is a quantification method that determines the relative abundance of an immune cell in heterogeneous tissues. This method uses marker genes optimized for interrogating microarray data (19). In order to predict the response to immune checkpoint blockade, Tumor Immune Dysfunction and Exclusion (TIDE) score was employed. TIDE is a computational method used to model two primary mechanisms of tumor immune evasion. These mechanisms are: the induction of T cell dysfunction in tumors with high infiltration of cytotoxic T lymphocytes (CTL) and the prevention of T cell infiltration in tumors with low CTL level (20, 21). Using this framework and RNA-Seq tumor expression profiles, TIDE can predict the outcomes of non-small cell lung cancer (NSCLC) patients treated with first-line anti-PD1 or anti-CTLA4 more accurately than other biomarkers such as PD-L1 levels and mutational load.
Statistical Analysis
Chi-squared and Fisher’s exact tests were used to investigate the significance of the correlation of ERO1L expression with clinicopathological features in LUAD patients. Analysis was performed using SPSS (version 23.0). ANOVA was used to identify the ERO1L expression levels in different datasets (22). The correlation of gene expression was evaluated using Spearman’s correlation coefficient (23). A p value <0.05 was considered statistically significant.
Results
Quantification of ERO1L mRNA Expression in Pan-Cancer
In order to determine the mRNA expression profile of ERO1L in pan-cancer, expression levels of ERO1L in the Oncomine database were analyzed. Comparisons of mRNA expression levels of ERO1L in pan-cancers versus normal tissue identified nine types of cancer in which ERO1L mRNA expression levels were elevated. These types of cancer included bladder, brain, central nervous system, colorectal, gastric, kidney, lung, lymphoma, ovarian, and pancreatic cancer. In addition, three types of cancer in which ERO1L mRNA expression levels were diminished were identified. These types of cancer included esophageal cancer, head and neck cancer, and leukemia (Figure 1A). What’s more, lung cancer was found to be associated with a significantly higher expression level of ERO1L in comparison to normal tissue. The expression levels of ERO1L were increased in seven datasets while no dataset possessed decreased levels of ERO1L.
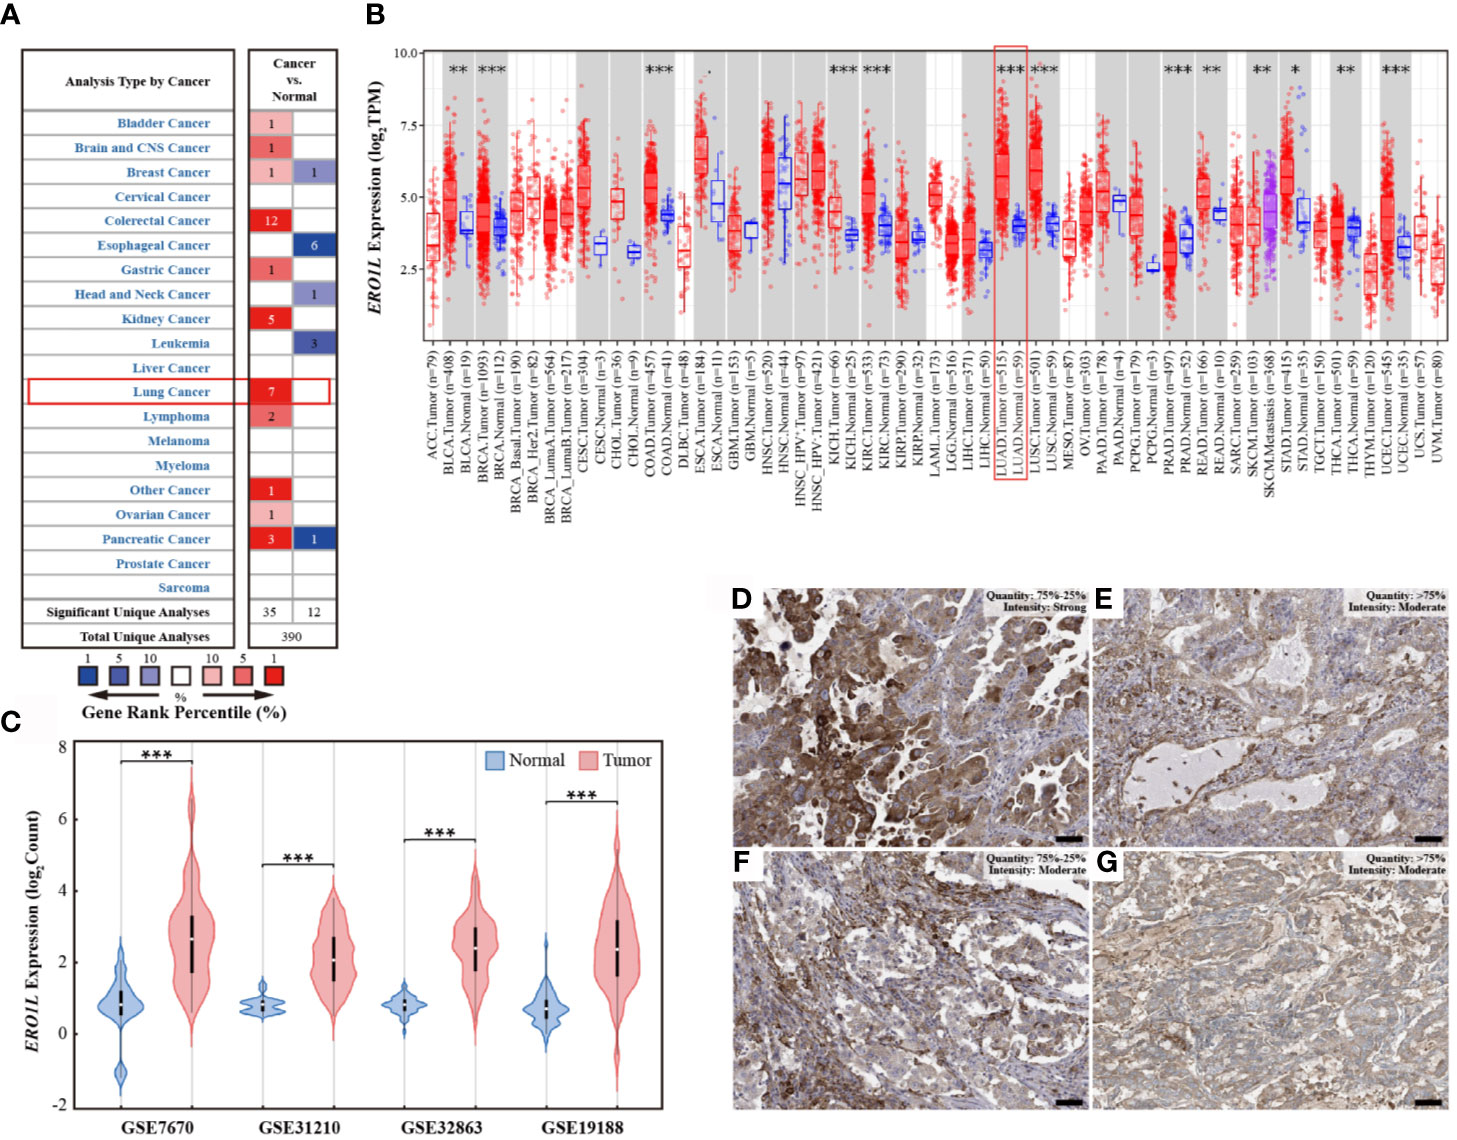
Figure 1 ERO1L expression levels in pan-cancer and LUAD. (A) Expression levels of ERO1L mRNA in pan-cancer, compared with normal tissues in the Oncomine database. The number in each cell denotes the number of datasets. (B) Expression levels of ERO1L mRNA in pan-cancer, compared with normal tissue from the TCGA database. (C) Expression levels of ERO1L mRNA in LUAD across four GEO datasets. (D-G) Expression levels of ERO1L protein in four patients with LUAD from the HPA database. Scale bar: 50 µm. *p < 0.05; **p < 0.01; ***p < 0.001.
To further investigate the mRNA expression levels of ERO1L in pan-cancers, RNA-sequencing data from The Cancer Genome Atlas (TCGA) program was analyzed. Interestingly, it was discovered that ERO1L mRNA expression levels were somewhat increased in pan-cancers in comparison to normal tissues (Figure 1B). This finding is consistent with our analysis of data from the Oncomine database, which revealed significantly elevated expression levels of ERO1L in lung adenocarcinoma (LUAD; p <0.001) and in lung squamous cell carcinoma (LUSC; p <0.001).
Expression Profiles of ERO1L mRNA and Protein in LUAD
In order to study the mRNA expression levels of ERO1L in LUAD, further analysis was performed on datasets from the Gene Expression Omnibus (GEO) database. In this analysis, four datasets (GSE7670, GSE31210, GSE32863, and GSE19188) comprising a total of 526 samples were included. This included 356 tumoral and 170 paired normal biopsies (Table S1). After normalizing the expression profile, it was identified that ERO1L mRNA expression levels in LUAD was significantly elevated in comparison to normal tissues. This was observed in all of the datasets analyzed. Interestingly, expression fold changes ranged from 2.8 to 4.1 times (Figures 1C and S1A). In addition, the mRNA expression of ERO1L in LUAD was investigated using the TCGA program. Similarly, significantly elevated expression levels of ERO1L mRNA were observed in LUAD in comparison to normal tissues. This was observed when the analysis was performed using both TCGA program and the Genotype-Tissue Expression (GTEx) program (Figure S1B).
These elevated ERO1L mRNA expression levels were confirmed in LUAD. As a logical next step, the protein expressions of ERO1L in LUAD were then investigated. Analysis using The Human Protein Atlas (HPA) program revealed that ERO1L was positively detected via immunohistochemistry (IHC) staining in patients with LUAD. Eleven patients with LUAD were identified in the HPA database, all of these patients possessed positive ERO1L protein expression (Figures 1D–G). Out of these patients, the intensity of IHC staining is as follows: three patients were associated with strong intensity, six with moderate, and two with weak intensities of IHC staining (Table S2).
Overexpression of ERO1L Is Associated With a Poorer Prognosis in LUAD
In order to study the correlation between ERO1L expression and prognosis in LUAD patients, six cohorts of patients were obtained from the PrognoScan database (Table S3). Via the analysis of hazard ratios (HR) and 95% confidence intervals (CI), four cohorts of LUAD patients (HLM, Nagoya, UM, and NCCRI) with high expression of ERO1L were identified. This high expression of ERO1L was associated with worsened prognoses in these patients as measured by overall survival (OS) and recurrent-free survival (RFS). Similarly, analysis was performed on survival data from the Kaplan-Meier plotter database. This is based on the Affymetrix microarrays with probe ID 218498_s_at for the ERO1L gene. These results showed consistently that overexpression of ERO1L was associated with worse prognoses in patients with LUAD in terms of OS (HR: 1.52, 95% CI: 1.27-1.82; Figure 2A) and RFS (HR: 1.93, 95% CI: 1.47-2.53; Figure 2B).
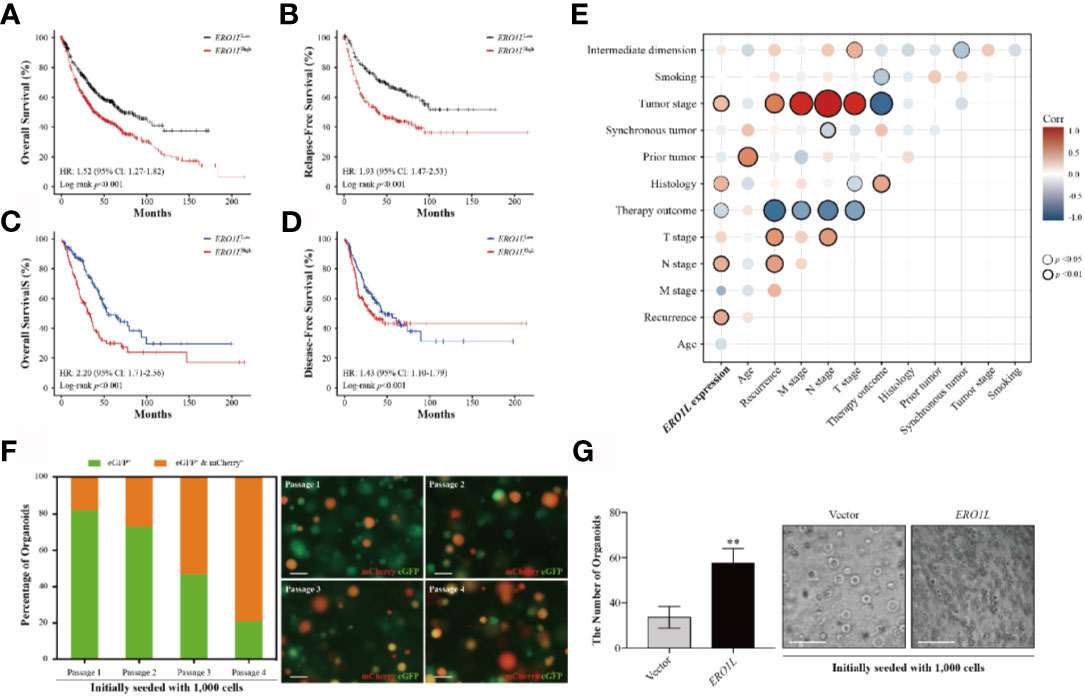
Figure 2 Overexpression of ERO1L predicts a poorer prognosis in LUAD. (A, B) Survival analysis comparing low and high expression levels of ERO1L in the Kaplan-Meier plotter database. Overexpression of ERO1L was correlated with significantly poorer overall survival (A) and relapse-free survival (B). Overexpression of ERO1L was correlated with significantly poorer overall survival (C) and disease-free survival (D). (E) Association between the expression of ERO1L and clinicopathological characteristics in patients with LUAD. (F) Fluorescence images of ERO1L-overexpressed organoids show an increase in the number of chimeric organoids over passaging. (G) Quantification of ERO1L upregulated organoids relative to the average number of organoid spheres in four random fields. **p < 0.01.
The following hypothesis was proposed: ERO1L is a potential biomarker in patients with LUAD. To investigate this hypothesis, survival analysis was applied to the RNA-sequencing data obtained from the TCGA program. This analysis revealed that there was a significant correlation between ERO1L overexpression, shorter overall survival (HR: 2.20, 95% CI: 1.71-2.56; Figure 2C) and disease-free survival (HR: 1.43, 95% CI: 1.10-1.79; Figure 2D). Interestingly, via correlation and multiple linear regression analysis, it was found that the expression level of ERO1L correlated with specific clinicopathological characteristics in LUAD patients (Figure 2E). As shown in Table 1, ERO1L overexpression was significantly correlated with tumor recurrence, pathologic N stage, primary treatment outcome, tumor histology, and tumor stage.
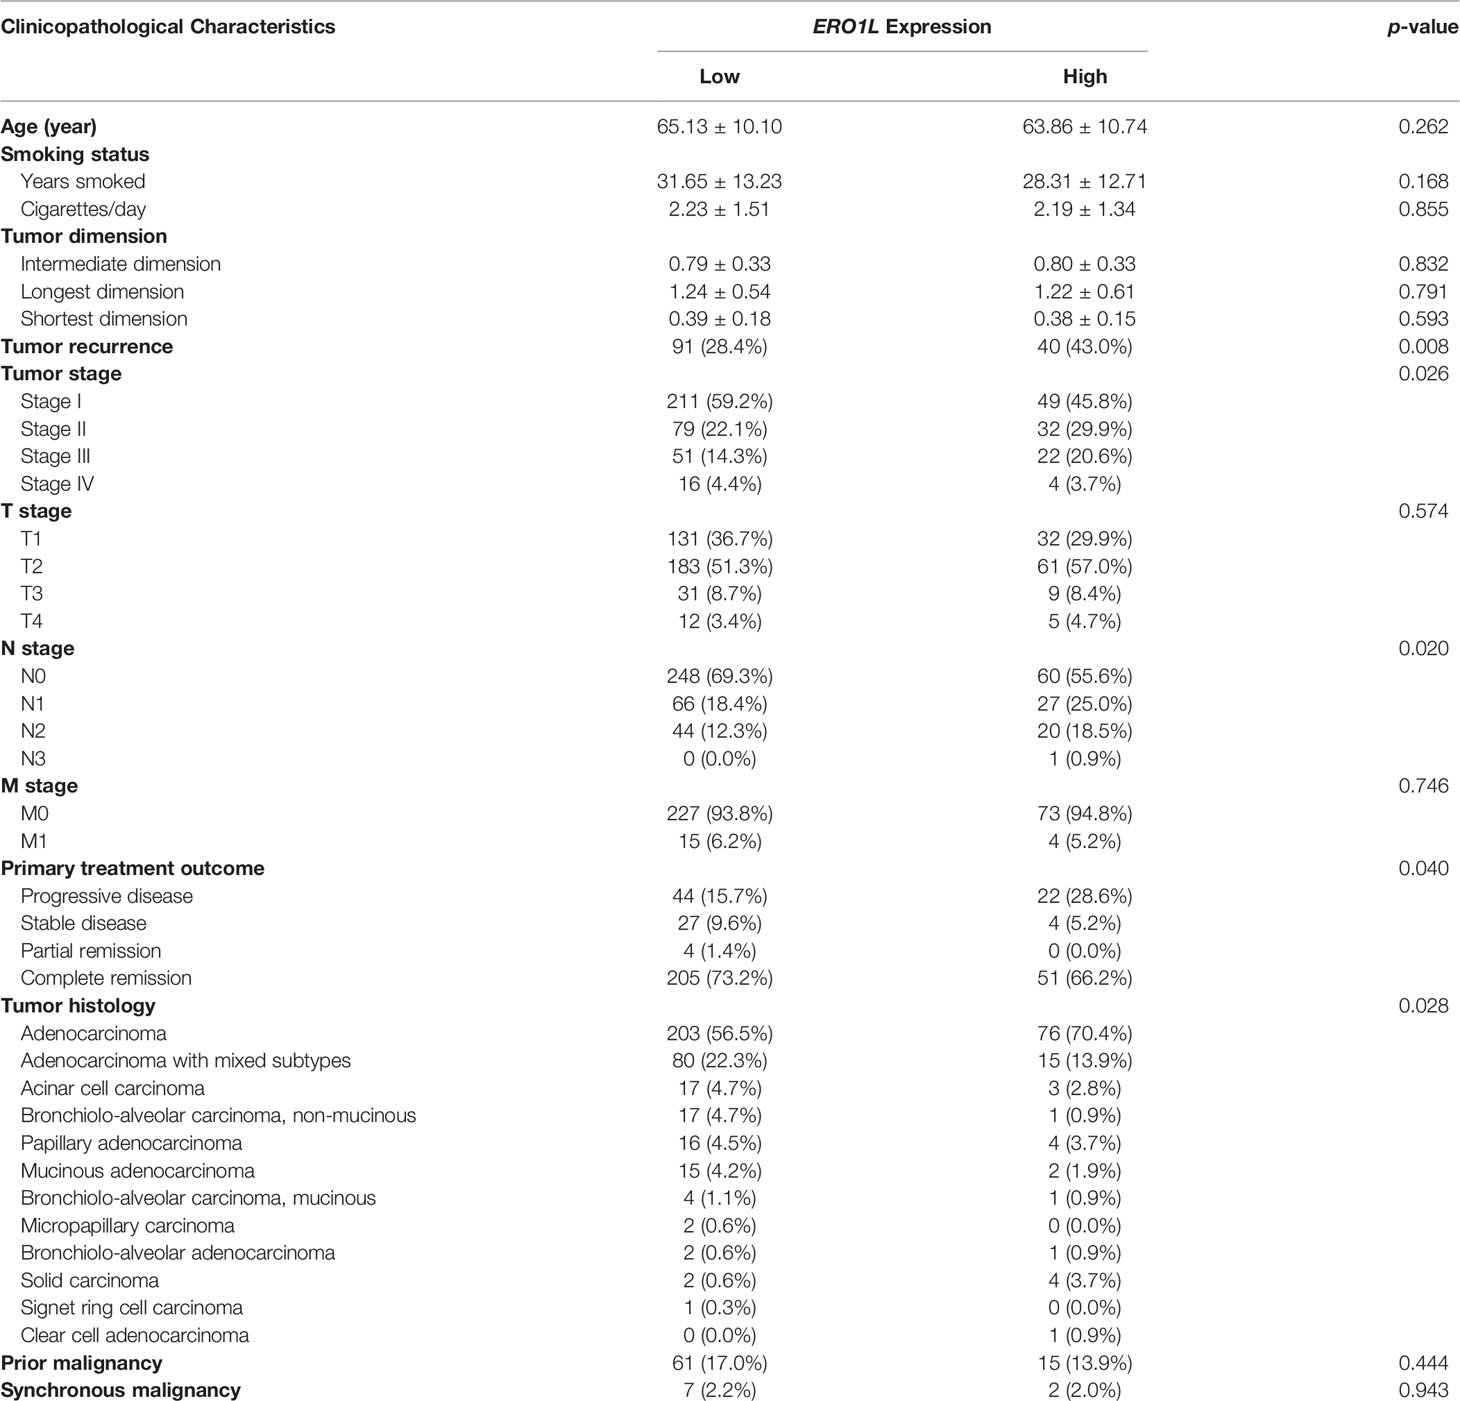
Table 1 Correlation between ERO1L and clinicopathological characteristics in patients with lung adenocarcinoma.
Furthermore, we applied an organoid model to study the biological function of ERO1L. We designed a protocol for organoid infection through dissociating organoid spheres into single cells and then co-culturing with virus particles. By introducing cDNA encoding ERO1L (labeled with mCherry) into organoids (labeled with eGFP), we obtained ERO1L-overexpressed organoids labeled in different colors. Organoids would turn red when transduced with cDNA, indicating the overexpression of ERO1L (Figure 2F). Using this, we detected infected organoids and calculated the ratios of chimeric organoids from passage 1 to 4. The initial percentage of chimeric organoids was about 16%, and it gradually increased to 75% after passaging three times (Figure 2F). Besides, the doubling time of organoid cells decreased from five to six days at passage 1 to two to two and a half days at passage 4. Transduction of cDNA of ERO1L in organoids was also performed. One thousand cells in each group were seeded and cultured for fourteen days (passage 2). Sphere formation was enhanced from cells overexpressing ERO1L compared with the control (Figure 2G). Hence, we concluded that organoids with ERO1L overexpression gradually gained an advantage in development, which could be extended over time.
Regulation of ERO1L mRNA Level via Promoter Methylation
In order to elucidate the mechanism underlying ERO1L expression, promoter methylation levels of ERO1L were investigated in 503 samples. This was performed via analysis of methylation profiles (Illumina Human Methylation 450) from the TCGA program (Table S4). A significant decrease in the methylation level of the ERO1L was identified in the promoter region in LUAD tissues in comparison to normal tissues (Figure 3A). Tumor stage subgroup analysis revealed that levels of ERO1L promoter methylation were most significantly decreased in stage IV patients (Figure 3B). In addition, correlation analysis revealed a significant negative correlation between mRNA levels and methylation levels of ERO1L (Spearman’s ρ: -0.25, p <0.001). This confirmed that ERO1L mRNA expression was regulated by promoter methylation in LUAD patients (Figure S1C).
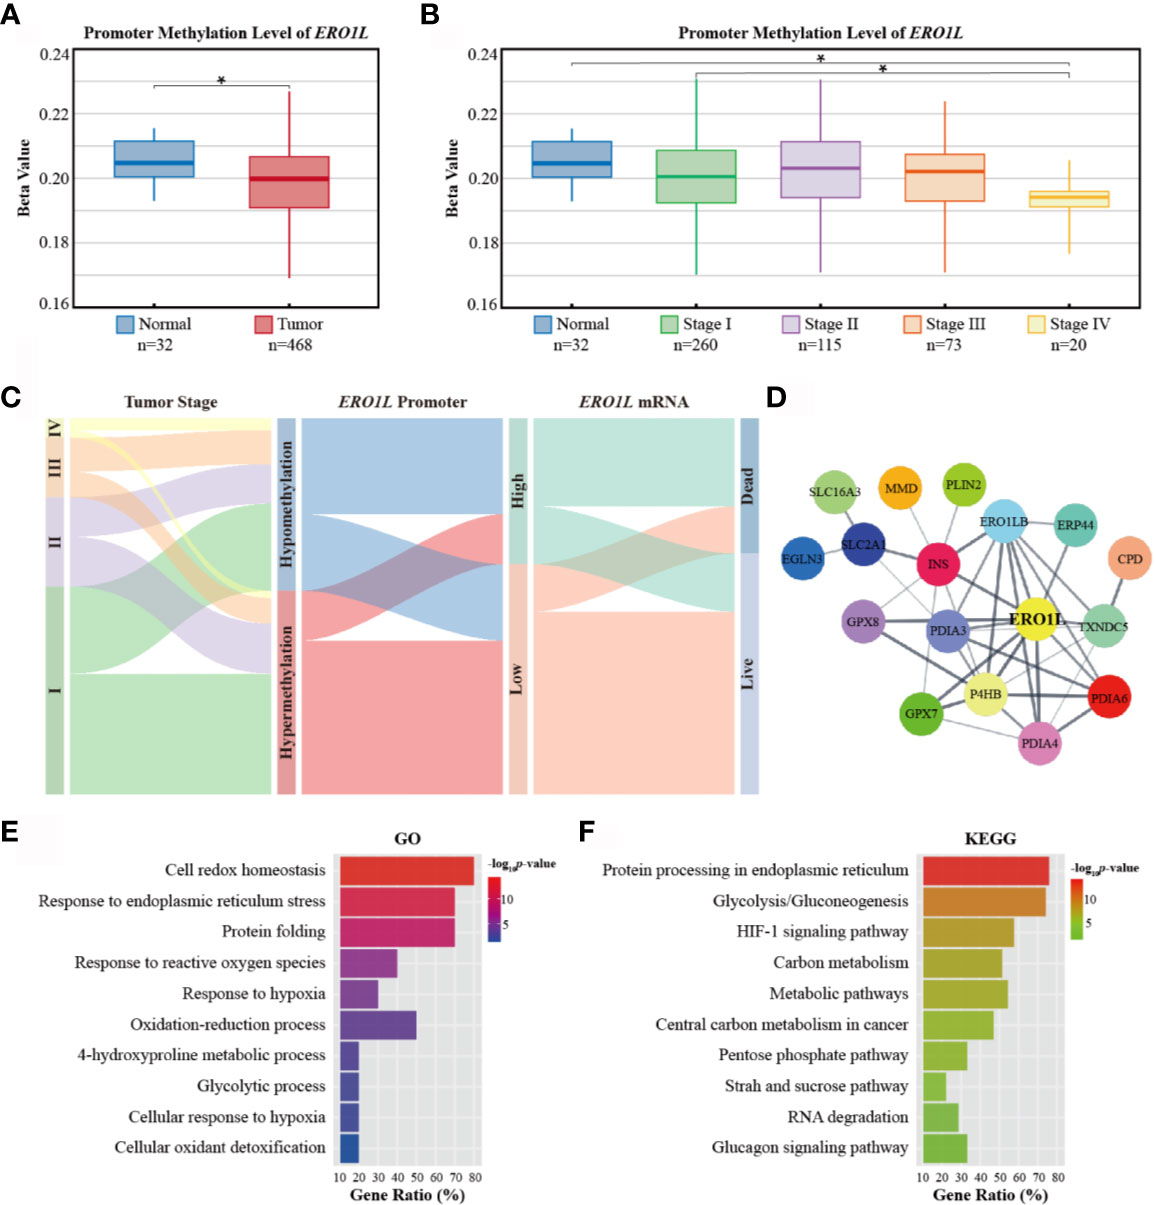
Figure 3 Promoter methylation of ERO1L and functional annotation of the ERO1L co-expression module. (A, B) Analysis of ERO1L methylation in the TCGA database. Promoter methylation levels of ERO1L in tumor and normal tissues (A) according to tumor stage (B). (C) Path analysis in patients with LUAD across tumor stage, promoter methylation, mRNA expression, and survival status. The line represents the group; the width of the lines represents the number of patients transferred from one state to another (n=468). (D) PPI networks of the ERO1L co-expression module. (E, F) Functional annotation and pathway enrichment of the ERO1L co-expression module. Top 10 terms of GO annotation (E) and KEGG pathway (F). *p < 0.05.
In order to analyze the clinical outcomes associated with methylation and expression of ERO1L, datasets of 468 patients in the TCGA database were analyzed. These datasets all contained data corresponding to methylation, expression, and survival profiles. Path analysis via a Sankey diagram was performed. This quantified and visualized the transitions with various lines and widths, and described paths and patterns across tumor stages, promoter methylation levels, ERO1L mRNA expression, and survival status (Figure 3C). As a result, it was determined that hypomethylation of the ERO1L promoter potentially induced overexpression of ERO1L mRNA and finally led to poor prognoses in individuals with LUAD. This pattern was observed more significantly in patients with advanced stages of cancer (Figure S2A). This data is consistent with the survival analysis based on ERO1L expression. This provides compelling evidence that ERO1L is associated with poor prognoses in patients with LUAD.
Co-Expression Module of ERO1L in LUAD
In order to investigate proteins that were in close relationship to ERO1L, a co-expression analysis of expression data from the TCGA program and Oncomine database was conducted. Via overlapping co-expression results and module mining, 29 proteins were found to be closely related to ERO1L (Figure S2B). This included ERO1LB, GPX7, GPX8, P4HB, INS, PDIA3, PDIA4, PDIA6, TXNDC5, and ERP44 among others. (Table S5). Based on these results, the protein-protein interaction (PPI) network of the ERO1L co-expression module was created (Figure 3D, Table S6). Furthermore, the biological functions of the module were investigated by Gene Otology (GO) analysis (Figure 3E) and Kyoto Encyclopedia of Genes and Genomes (KEGG) analysis (Figure 3F). Interestingly, it was found that these genes showed strong associations with significant processes such as response to endoplasmic reticulum stress, response to reactive oxygen species, oxidation-reduction process, and glycolytic process. Integrally, this module was shown to be closely related to hypoxia responses as well as the HIF-1 signaling pathway. These might also play a role in shaping the TIME.
Correlations Between ERO1L Expression and Immune Cell Markers
To first understand the relationship between ERO1L and infiltrating immune cells, a correlation analysis across ERO1L and markers for immune cells was performed. These biomarkers are widely used for the purpose of immune cell characterization (Table 2). ERO1L expression showed strong correlations with markers for infiltrating lymphocytes including regulatory T cells (Tregs), exhausted T cells, macrophages, tumor-associated macrophages (TAMs), myeloid-derived suppressor cells (MDSCs), and cancer-associated fibroblasts (CAFs), thus indicating infiltrations of immune-suppressive cells are mediated by ERO1L signaling (Figure 4A). Interestingly, ERO1L expression was shown to be positively correlated with the phenotype of M2-type macrophages while negatively correlated with the phenotype of M1-type macrophages. This implies that overexpression of ERO1L could indicate the polarization of M1-type to M2-type macrophage (Figure 4B).
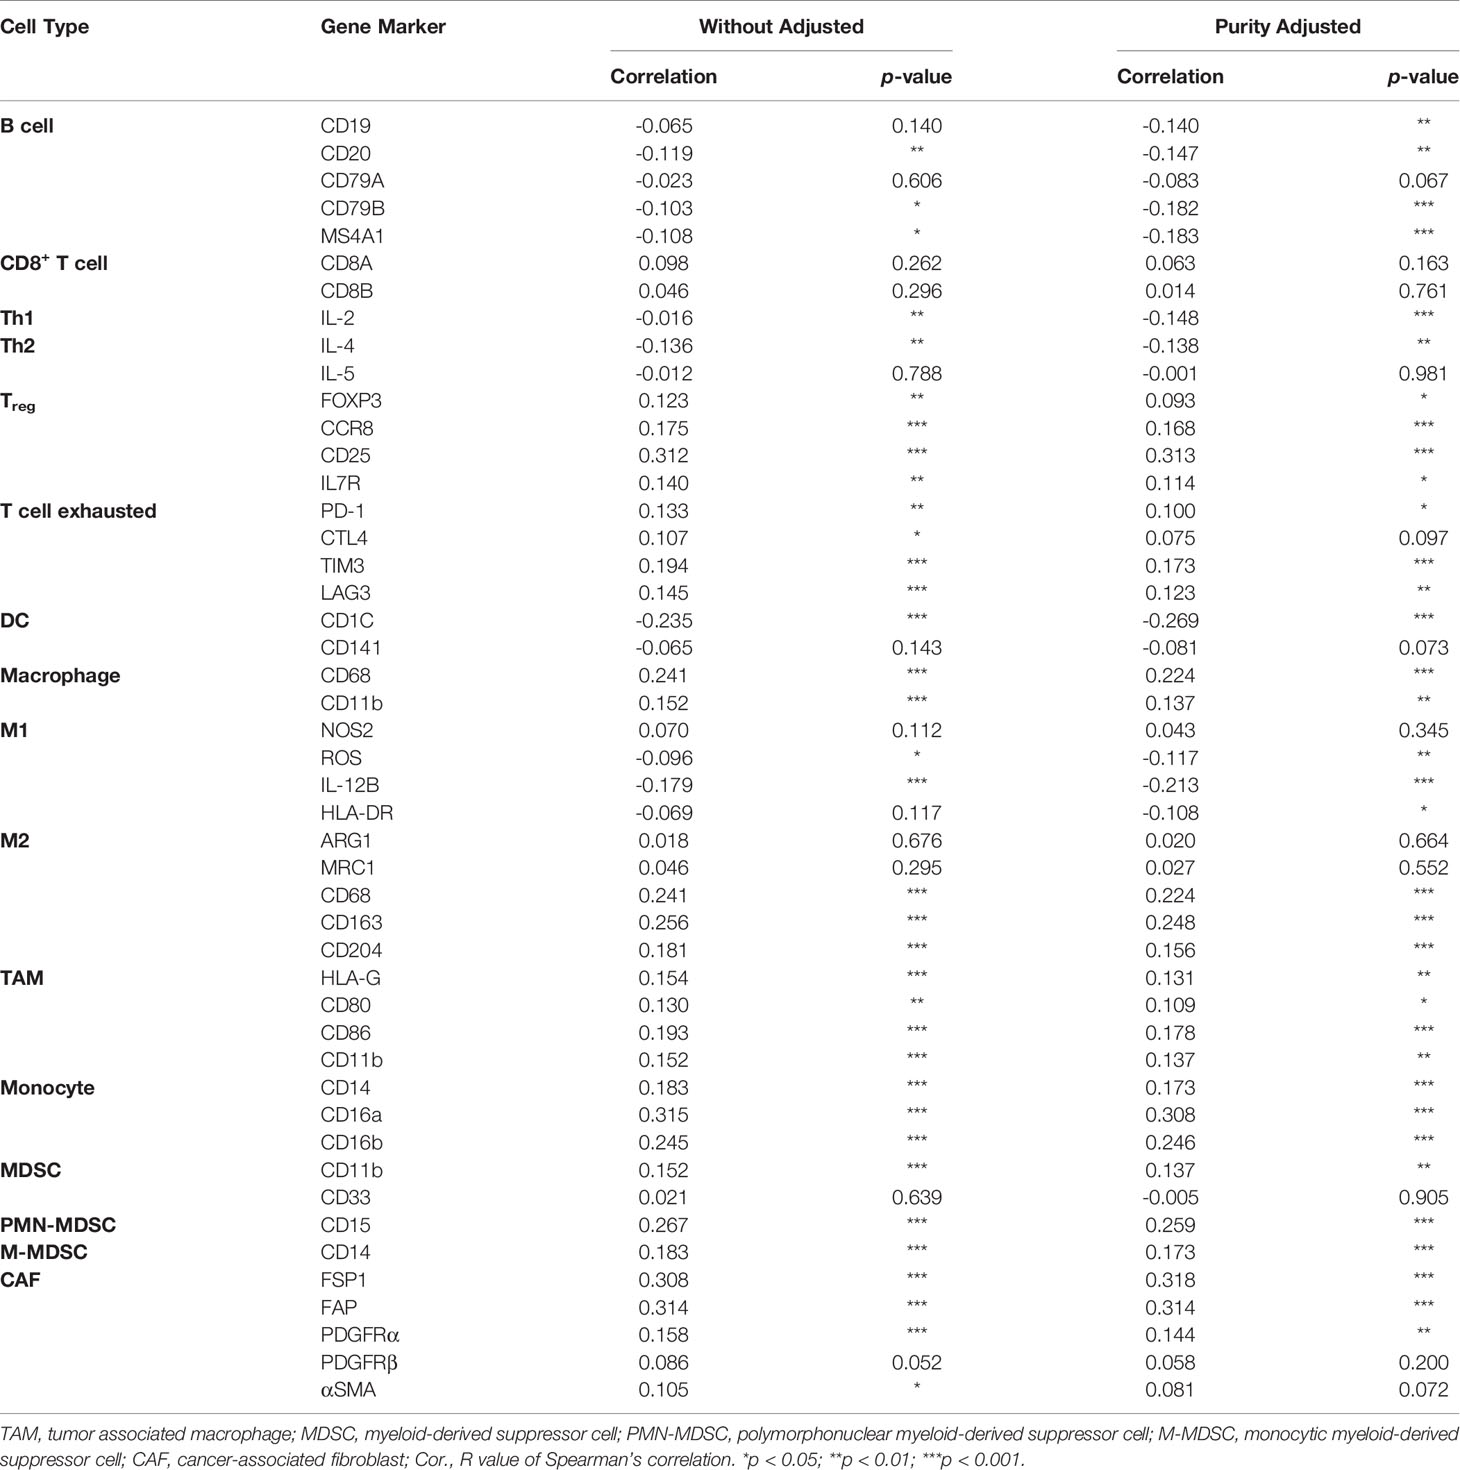
Table 2 Correlations between ERO1L and gene markers of infiltrating immune cells.
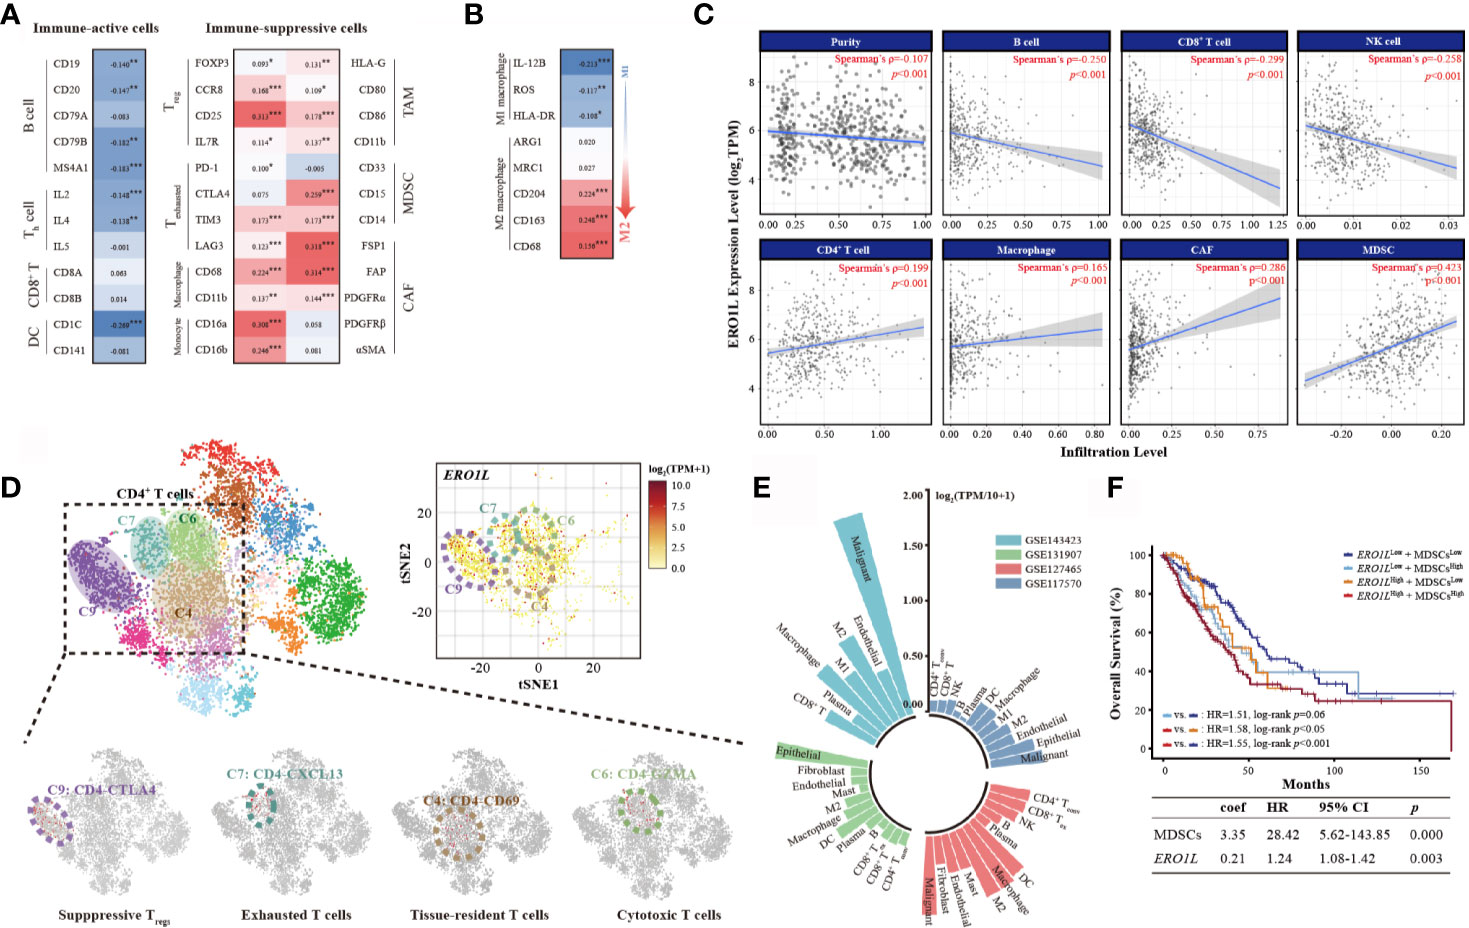
Figure 4 Overexpression of ERO1L shapes an immune-suppressive tumor microenvironment. (A) Correlations between ERO1L and the immune cell markers. (B) ERO1L expression correlates with macrophages polarization. (C) ERO1L expression was significantly negatively correlated with infiltrating levels of B cells, CD8+ T cells, and NK cells and significantly positively correlated with infiltrating levels of CD4+ T cells, macrophages, CAFs, and MDSCs. (D) The intrinsic heterogeneity of CD4+ T cells according to ERO1L expression as determined via single-cell sequencing data. Each dot corresponds to a single cell and is colored according to the cell cluster. The color density indicates the expression of ERO1L. (E) Summary of four single-cell sequencing datasets according to correlations with ERO1L. Different datasets are labeled in different colors. (F) The Cox proportional hazards model is constructed according to expressions of ERO1L and MDSC. *p < 0.05; **p < 0.01; ***p < 0.001.
ERO1L Mediated Immune-Suppressive Tumor Microenvironment Shaping
To confirm whether ERO1L expression impacts the TIME, the coefficients of ERO1L expression and TIME infiltrations were calculated in the Tumor IMune Estimation Resource 2.0 (TIMER 2.0) database. In relation to tumor-infiltrating lymphocytes, it was found that immune-active cells including B cells (Spearman’s ρ=-0.250, p <0.001), CD8+ T cells (Spearman’s ρ=-0.299, p <0.001), and NK cells (Spearman’s ρ=-0.258, p <0.001) correlated negatively with ERO1L expression. After adjustments to account for tumor purity, immune-suppressive cells CAFs (Spearman’s ρ=0.286, p <0.001) and MDSCs (Spearman’s ρ=0.423, p <0.001) were shown to be positively correlated with ERO1L expression (Figure 4C).
As a positive correlation was observed between ERO1L and CD4+ T cells (Spearman’s ρ=0.199, p <0.001), intrinsic CD4+ T cell heterogeneity was further investigated via analysis of single-cell sequencing data from dataset GSE99254. Dimensional reduction analysis (t-SNE) applied to the expression data showed that ERO1L was highly expressed in most CD4+ T cell clusters. This was consistent with our previous findings (Figure 4D). The clusters of CD4-CTLA4 (cluster C9) and CD4-CXCL13 (cluster C7), representing suppressive Tregs and exhausted T cells respectively, showed the highest ERO1L expression levels. To further confirm ERO1L expression across infiltrating cells in TIME, single-cell sequencing data from four projects (GSE7670, GSE31210, GSE32863, and GSE19188) was analyzed. Results showed that ERO1L expression closely correlated with infiltrating cell levels including B cells, T cells, NK cells, endothelial cells, macrophages, monocytes, MDSCs, and CAFs (Figure 4E, Figure S2C). ERO1L was more closely associated with the phenotype of a M2 macrophage than a M1 macrophage, which was consistent with our previous findings.
Of note, MDSCs are known to play a key role in immunosuppression in various cancer types. In recent years, increasing evidence has highlighted MDSCs as a major driver behind the immunosuppressive tumor microenvironment. As C/EBPβ and c-Rel have been implicated in MDSC expansion, C/EBPβ and c-Rel expressions were examined. Consistent with previous findings, it was identified that both C/EBPβ and c-Rel were significantly positively correlated with ERO1L expression (C/EBPβ: Spearman’s ρ=0.144, p <0.001; c-Rel: Spearman’s ρ=0.201, p <0.001). This supports the notion that ERO1L signaling potentially results in the accumulation of functional MDSCs (Figure S2D). Based on the strong correlation observed between ERO1L and MDSCs, a survival analysis was performed by constructing a Cox proportional hazards model according to expression profiles of ERO1L and MDSC (Figure 4F). Results revealed that patients exhibiting low levels of both ERO1L and MDSCs experienced a significantly better OS in comparison to those with simultaneously high levels of ERO1L and MDSCs (HR:1.55, 95% CI: 1.12-1.84, log-rank p <0.001). This indicates that the combination of high levels of ERO1L and MDSC expression can predict poor prognoses in patients with LUAD. In tumors where the high expression level of ERO1L was a result of copy number variations including gain and amplification compared with deletion or normal diploid, significant differences were also noted. In specific cases there a decrease in CD8+ T cells and an increase of CAFs and macrophages (Figures S2E, F). Taken together, these results indicate that ERO1L overexpression is closely related to infiltration of immune-suppressive cells and the deficiency of immune-active cells, thus shaping an immunosuppressive TIME.
ERO1L Overexpression Can Potentially Predict Immunotherapy Resistance
Based on the notion that ERO1L overexpression shaped an immune-suppressive TIME, it was hypothesized that high levels of ERO1L might also lead to immunotherapy resistance. Given that the MC-38 cell line was sensitive to ICI treatment while the LLC and A549 cell lines were relatively insensitive to ICI treatment, we first performed Western blotting to examine the expression levels of ERO1L protein across these cell lines. Results showed that ERO1L protein was overexpressed in the LLC and A549 cell lines while downregulated in the MC-38 cell line (Figure S3A), which was consistent with our hypothesis that overexpression of ERO1L might be associated with resistance to ICI treatment.
To further investigate this hypothesis, the stromal and immune cell infiltration levels were analyzed within ERO1Llow and ERO1Lhigh samples using ESTIMATE software. Low expression of ERO1L was accompanied with a higher abundance of stromal cells and immune cells in comparison to overexpression of ERO1L, which was associated with a significantly higher Estimate score. This suggested that an immune-inflamed TIME that may well be susceptible to immunotherapy (Figure 5A). To explore this issue in more detail, the Tumor Immune Dysfunction and Exclusion (TIDE) score was used. This score is a computational framework designed to evaluate the potential of tumor immune escape and is a surrogate biomarker to predict response to immunotherapy. TIDE scores showed that the ERO1Llow group had a significantly higher response rate (86.0%) in comparison to the ERO1Lhigh group (31.0%) (Figures 5B, C). It was also observed that the ERO1Lhigh group scored high in MDSCs (p <0.001) and immune dysfunction (p <0.001), while scored low in CD8+ T cells (p <0.001) in comparison with the ERO1Llow group (Figure 5D). To validate these results, the MCP counter was applied to quantify the different immune cell populations within the two groups. In agreement with our results, ERO1L overexpression scored low in NK cells (p <0.001), myeloid dendritic cells (p <0.001), neutrophils (p <0.001), and endothelial cells (p <0.001). ERO1L overexpression scored high in B lineage (p =0.004), monocyte lineage (p =0.020), and fibroblast (p <0.001; Figure S3B). These results suggest that ERO1L is in fact a biomarker with potential applications in the prediction of immunotherapy response in patients with LUAD.
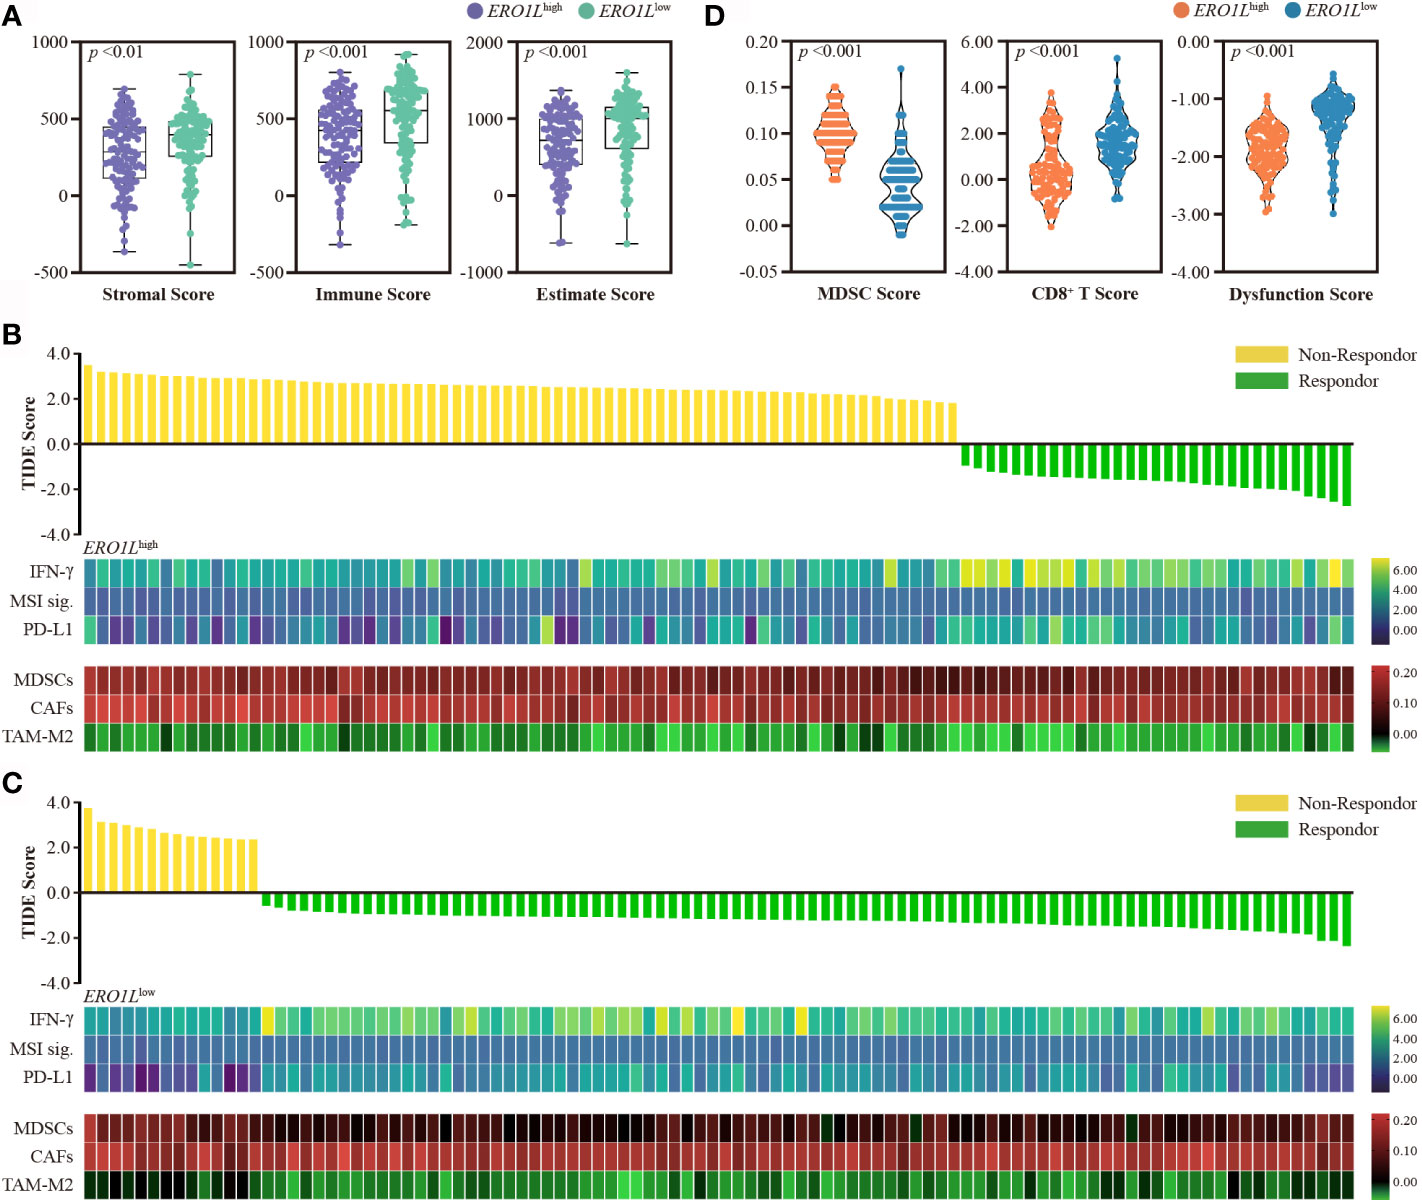
Figure 5 Overexpression of ERO1L predicts resistance to immunotherapy. (A) Boxplot showing stromal, immune, and Estimate scores within ERO1Lhigh and ERO1Llow groups. (B, C) Prediction of immunotherapy response using the TIDE computational framework. Other biomarkers for immunotherapy were also assessed. These included: IFN-γ, MSI signatures, PD-L1, MDSCs, CAFs, and TAM-M2. (D) Violin plot showing MDSCs, CD8+ T, and dysfunction scores within the ERO1Lhigh and ERO1Llow groups. Groups are labeled in different colors according to their level of ERO1L expression.
Mechanisms Underpinning an ERO1L-Induced Immune-Suppressive Tumor Microenvironment
Gene set enrichment analysis (GSEA) was performed in order determine whether the transcriptional signature produced by ERO1L overexpression was significantly related to other previously studied conditions. By using hallmark gene sets and all curated gene sets as references, GSEA was performed between the ERO1Llow group and ERO1Lhigh group in patients from the TCGA cohort. The global expression changes produced in LUAD patients were positively correlated with the signatures of hypoxia (NES =2.02; FDR q-value =0.0) and VEGF (NES =2.27; FDR q-value =0.0; Figure 6A). Moreover, GSEA also revealed that the gene signatures of the JAK-STAT (NES =1.65, FDR q-value =0.0) and NF-κB (NES =2.03, FDR q-value =0.0; Figure 6B) signaling pathways were commonly enriched when ERO1L signaling was upregulated. The expression levels of the components involved in the two pathways were examined, including JAK1, JAK2, STAT1, STAT2, STAT3, NF-κB1, NF-κB2, RelA, RelB, and c-Rel. Consistent with previous findings, there were significant correlations observed between ERO1L overexpression and the aforementioned components (Figure 6C).
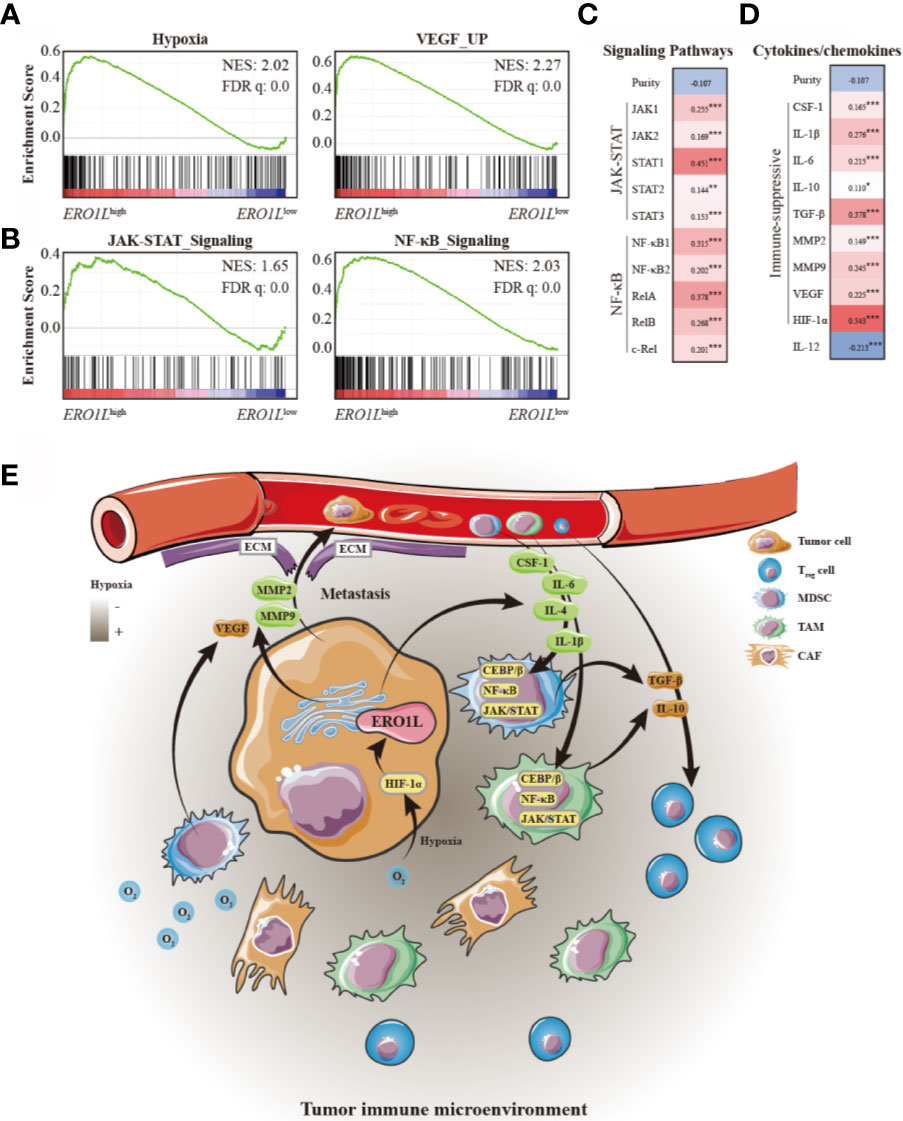
Figure 6 Mechanisms underlying an ERO1L-associated immune-suppressive tumor microenvironment. (A) GSEA of ERO1Lhigh expressing profiles using a hypoxia signature (NES =2.02, q =0.0) and a VEGF upregulated signature (NES =2.27, q =0.0). (B) GSEA of ERO1Lhigh expressing profiles using an upregulated JAK-STAT signature (NES =1.65, q =0.0) and an upregulated NF-κB signature (NES =2.03, q =0.0). (C) Confirmation of gene expression changes in the JAK-STAT and NF-κB signaling pathways. (D) Correlations between ERO1L overexpression, cytokines, and chemokines patterns in the tumor immune microenvironment. (E) Schematic showing the ERO1L-induced immune-suppressive tumor immune microenvironment. *p < 0.05; **p < 0.01; ***p < 0.001.
As the JAK-STAT and NF-κB pathways have previously been reported to play a role in increasing the secretion of immune-suppressive factors, we further explored whether ERO1L expression could affect the pattern of cytokines and chemokines secreted by tumor cells and infiltrating immune cells, which play a role in shaping TIME. Via TCGA expression profiling analysis, it was identified that cytokines and chemokines secreted by tumors (such as CSF-1, IL-1β, and IL-6), which have been reported to recruit immune-suppressive cells including MDSCs, TAMs, and CAFs, were positively correlated with overexpression of ERO1L (Figure 6D). Moreover, it was also identified that immune-suppressive cytokines and chemokines (including IL-10, TGF-β, MMP2, MMP9, and VEGF), which are known to be mostly secreted by immune-suppressive cells, were simultaneously in a positive correlation with overexpression of ERO1L. Taken together, these data suggest a potential mechanism for ERO1L-associated immune-suppressive TIME (Figure 6E).
Discussion
Here, we report a study depicting the biological landscape of ERO1L in LUAD. ERO1L expression is significantly higher in lung adenocarcinomas in comparison to adjacent normal tissues and is closely related to the prognoses of patients with LUAD. High expression levels of ERO1L are associated with a poor prognosis of patients with LUAD. Previous studies have reported that the overexpression of ERO1L promoted proliferation, migration, and invasion in pancreatic cancer as well as breast cancer by activating the Wnt/catenin pathway. In this study, overexpression of ERO1L was closely associated with infiltrating of immune-suppressive cells and deficiencies in immune-active cells. Therefore, we propose that ERO1L functions as an oncogenic factor by inducing an immune-suppressive TIME.
Although ERO1L is relatively poorly studied in immunology, molecular studies have investigated the biological functions of the ERO1L protein. This protein is an oxidase in the endoplasmic reticulum which regulates hypoxia-induced oxidative protein folding. Its expression can be induced by hypoxia, which is a common feature of cancers contributing to tumor metastasis, angiogenesis, expansion of tumor-initiating cell, chemoresistance, and genomic instability via the regulation of hypoxia-inducible factors such as HIF-1α and HIF-2α. Taking together, these results indicate that ERO1L may potentially regulate tumor progression through HIF signaling pathways. In this study, we found that the co-expression module of ERO1L took part in oxidation-reduction, glycolytic, and hypoxia. This finding is consistent with previous data. Moreover, hypoxia has also been shown to be an important barrier to effective cancer treatment. We propose that overexpression of ERO1L is indicative of a hypoxic TIME, which could potentially confer poor prognoses in patients with LUAD.
ERO1L overexpression is closely associated with the infiltration of immune-suppressive cells including MDSCs, TAMs, and CAFs. This leads to an immunosuppressive TIME. MDSCs are derived from bone marrow and have an inhibitory effect on the immune system. They play an important role in tumor immunosuppression, tumor angiogenesis, drug resistance, and tumor metastasis (24). What’s more, MDSCs can produce NO and ROS which can nitrate chemokines and block entry of CD8+ T cells to tumors (25). MDSCs have been reported to produce immune-suppressive cytokines including IL-10 and TGF-β, which induce Tregs and affecting NK cells (26, 27). Furthermore, MDSCs could eliminate the key nutrition factors needed for T cell proliferation via the depletion of L-arginine (28), sequestering L-cysteine (29), or reducing local tryptophan levels due to the activity of indoleamine 2,3 dioxygenase (30). What’s more, recent studies have demonstrated that MDSCs were highly significantly associated with poor OS and PFS in gastrointestinal cancer, hepatocellular carcinoma, lung cancer, and multiple myeloma (31).
TAMs generally display as M2 phenotype macrophages which are devoid of cytotoxic activity, produce growth factors for cancer cells, and have immune-suppressive activity (32). TAMs preferentially localize in the hypoxic areas of tumors, where they promote the expression of the transcription factor HIF-1α. This transcription factor induces the transcription of various elements including VEGF, basic fibroblast growth factor, platelet-derived growth factor, and prostaglandin E2, which is associated with angiogenesis (33). TAMs have potential to produce enzymes and proteases such as MMPs including MMP2 and MMP9 which regulate the degradation of the extracellular matrix (ECM). ECM disruption by TAMs facilitates tumor cell spreading and metastasis (34). What’s more, TAMs also contribute to immune-suppression in the TIME via inhibition of IL-12. On the contrary, TAMs promote the secretion of IL-10 and TGF-β, which block T cell proliferation, suppress cytotoxic T lymphocyte (CTL) responses, and activate Tregs (35). Clinical studies have demonstrated a strong association between poor survival and increased macrophage density in thyroid, lung, and hepatocellular cancers (36, 37). Similarly, our research proved that in tumors with high expression levels of ERO1L are positively associated with the secretion of cytokines and enzymes such as HIF-1α, MMPs, IL-10, TGF-β, and VEGF.
Recently, immune checkpoint inhibitors have led to a paradigm shift in treatment for patients with non-small cell lung cancer (NSCLC). However, the efficacy of these treatments is less than 50%. The clinical responses of ICI are reported to be unfavorable because of the low tumor mutation burden, low PD-L1 expression, and the noninflamed TIME. Based on the results presented in this study, we hypothesized that activation of ERO1L signaling could recruit immune-suppressive cells and shape an immune-suppressive TIME and thus conferring resistance to ICI treatment. We propose that ERO1L overexpression is an effective biomarker for noninflamed TIME. However, our conclusions were mainly summarized based on the public datasets; further studies based on grafted tumors and patients’ samples are highly needed.
Conclusion
In summary, our study provides clear insight into the potential role of ERO1L in tumor immunology. Our study also suggests the potential prognostic value of ERO1L in patients with LUAD. We described that overexpression of ERO1L, indicates a hypoxic environment and shapes an immune-suppressive TIME through the recruitment of immune-suppressive cells and inhibition of immune-active cells. High levels of ERO1L may be indicative of resistance to immunotherapy. ERO1L was shown to associated with cytokine and chemokine patterns in the TIME, which were resulted from activations of JAK-STAT and NF-κB signaling pathways. These findings suggest a potential immune-based anti-tumor strategy via the inhibition of ERO1L to clear tumor microenvironment infiltrates.
Data Availability Statement
The datasets presented in this study can be found in online repositories. The names of the repository/repositories and accession number(s) can be found in the article/Supplementary Material.
Author Contributions
JW and HB conceived, designed, and supervised the study. YQ, ZM and XZ collected and visualized the data. LL, CW, and SL performed organoid-related experiments. LL, CW, and PX analyzed the data. LL and CW interpreted findings and wrote the first draft of the manuscript. JW and HB revised and edited the manuscript. All authors approved the final version of the manuscript. JW is the guarantor of this study and accepts full responsibility for the work, had access to the data, and controlled the decision to publish. The corresponding authors attest that all listed authors meet authorship criteria and that no other person meeting the criteria has been omitted. All authors contributed to the article and approved the submitted version.
Funding
This work was supported by the National Natural Sciences Foundation Key Program [81630071].
Conflict of Interest
The authors declare that the research was conducted in the absence of any commercial or financial relationships that could be construed as a potential conflict of interest.
Supplementary Material
The Supplementary Material for this article can be found online at: https://www.frontiersin.org/articles/10.3389/fimmu.2021.677169/full#supplementary-material
References
1. Chen Z, Fillmore CM, Hammerman PS, Kim CF, Wong KK. Non-Small-Cell Lung Cancers: A Heterogeneous Set of Diseases. Nat Rev Cancer (2014) 14(8):535–46. doi: 10.1038/nrc3775
2. Remon J, Passiglia F, Ahn MJ, Barlesi F, Forde PM, Garon EB, et al. Immune Checkpoint Inhibitors in Thoracic Malignancies: Review of the Existing Evidence by an IASLC Expert Panel and Recommendations. J Thorac Oncol (2020) 15(6):914–47. doi: 10.1016/j.jtho.2020.03.006
3. Remon J, Ahn MJ, Girard N, Johnson M, Kim DW, Lopes G, et al. Advanced-Stage Non-Small Cell Lung Cancer: Advances in Thoracic Oncology 2018. J Thorac Oncol (2019) 14(7):1134–55. doi: 10.1016/j.jtho.2019.03.022
4. Galon J, Bruni D. Approaches to Treat Immune Hot, Altered and Cold Tumours With Combination Immunotherapies. Nat Rev Drug Discov (2019) 18(3):197–218. doi: 10.1038/s41573-018-0007-y
5. Chen DS, Mellman I. Elements of Cancer Immunity and the Cancer-Immune Set Point. Nature (2017) 541(7637):321–30. doi: 10.1038/nature21349
6. Hegde PS, Chen DS. Top 10 Challenges in Cancer Immunotherapy. Immunity (2020) 52(1):17–35. doi: 10.1016/j.immuni.2019.12.011
7. Cabibbo A, Pagani M, Fabbri M, Rocchi M, Farmery MR, Bulleid NJ, et al. ERO1-L, a Human Protein That Favors Disulfide Bond Formation in the Endoplasmic Reticulum. J Biol Chem (2000) 275(7):4827–33. doi: 10.1074/jbc.275.7.4827
8. May D, Itin A, Gal O, Kalinski H, Feinstein E, Keshet E. Ero1-L Alpha Plays a Key Role in a HIF-1-Mediated Pathway to Improve Disulfide Bond Formation and VEGF Secretion Under Hypoxia: Implication for Cancer. Oncogene (2005) 24(6):1011–20. doi: 10.1038/sj.onc.1208325
9. Jing X, Yang F, Shao C, Wei K, Xie M, Shen H, et al. Role of Hypoxia in Cancer Therapy by Regulating the Tumor Microenvironment. Mol Cancer (2019) 18(1):157. doi: 10.1186/s12943-019-1089-9
10. Kajiwara T, Tanaka T, Kukita K, Kutomi G, Saito K, Okuya K, et al. Hypoxia Augments MHC Class I Antigen Presentation via Facilitation of ERO1-Alpha-Mediated Oxidative Folding in Murine Tumor Cells. Eur J Immunol (2016) 46(12):2842–51. doi: 10.1002/eji.201646525
11. Rhodes DR, Yu J, Shanker K, Deshpande N, Varambally R, Ghosh D, et al. ONCOMINE: A Cancer Microarray Database and Integrated Data-Mining Platform. Neoplasia (2004) 6(1):1–6. doi: 10.1016/S1476-5586(04)80047-2
12. Huang da W, Sherman BT, Lempicki RA. Systematic and Integrative Analysis of Large Gene Lists Using DAVID Bioinformatics Resources. Nat Protoc (2009) 4(1):44–57. doi: 10.1038/nprot.2008.211
13. Subramanian A, Tamayo P, Mootha VK, Mukherjee S, Ebert BL, Gillette MA, et al. Gene Set Enrichment Analysis: A Knowledge-Based Approach for Interpreting Genome-Wide Expression Profiles. Proc Natl Acad Sci U.S.A. (2005) 102(43):15545–50. doi: 10.1073/pnas.0506580102
14. Li T, Fu J, Zeng Z, Cohen D, Li J, Chen Q, et al. TIMER2.0 for Analysis of Tumor-Infiltrating Immune Cells. Nucleic Acids Res (2020) 48(W1):W509–14. doi: 10.1093/nar/gkaa407
15. Newman AM, Steen CB, Liu CL, Gentles AJ, Chaudhuri AA, Scherer F, et al. Determining Cell Type Abundance and Expression From Bulk Tissues With Digital Cytometry. Nat Biotechnol (2019) 37(7):773–82. doi: 10.1038/s41587-019-0114-2
16. Tang Z, Li C, Kang B, Gao G, Li C, Zhang Z. GEPIA: A Web Server for Cancer and Normal Gene Expression Profiling and Interactive Analyses. Nucleic Acids Res (2017) 45(W1):W98–W102. doi: 10.1093/nar/gkx247
17. Guo X, Zhang Y, Zheng L, Zheng C, Song J, Zhang Q, et al. Global Characterization of T Cells in non-Small-Cell Lung Cancer by Single-Cell Sequencing. Nat Med (2018) 24(7):978–85. doi: 10.1038/s41591-018-0045-3
18. Sun D, Wang J, Han Y, Dong X, Ge J, Zheng R, et al. TISCH: A Comprehensive Web Resource Enabling Interactive Single-Cell Transcriptome Visualization of Tumor Microenvironment. Nucleic Acids Res (2021) 49(D1):D1420–30. doi: 10.1093/nar/gkaa1020
19. Becht E, Giraldo NA, Lacroix L, Buttard B, Elarouci N, Petitprez F, et al. Estimating the Population Abundance of Tissue-Infiltrating Immune and Stromal Cell Populations Using Gene Expression. Genome Biol (2016) 17(1):218. doi: 10.1186/s13059-016-1113-y
20. Fu J, Li K, Zhang W, Wan C, Zhang J, Jiang P, et al. Large-Scale Public Data Reuse to Model Immunotherapy Response and Resistance. Genome Med (2020) 12(1):21. doi: 10.1186/s13073-020-0721-z
21. Jiang P, Gu S, Pan D, Fu J, Sahu A, Hu X, et al. Signatures of T Cell Dysfunction and Exclusion Predict Cancer Immunotherapy Response. Nat Med (2018) 24(10):1550–8. doi: 10.1038/s41591-018-0136-1
22. Weissgerber TL, Garcia-Valencia O, Garovic VD, Milic NM, Winham SJ. Why We Need to Report More Than ‘Data Were Analyzed by T-Tests or ANOVA’. Elife (2018) 7:e36163. doi: 10.7554/eLife.36163
24. Gabrilovich DI. Myeloid-Derived Suppressor Cells. Cancer Immunol Res (2017) 5(1):3–8. doi: 10.1158/2326-6066.CIR-16-0297
25. Molon B, Ugel S, Del Pozzo F, Soldani C, Zilio S, Avella D, et al. Chemokine Nitration Prevents Intratumoral Infiltration of Antigen-Specific T Cells. J Exp Med (2011) 208(10):1949–62. doi: 10.1084/jem.20101956
26. Pan PY, Ma G, Weber KJ, Ozao-Choy J, Wang G, Yin B, et al. Immune Stimulatory Receptor CD40 is Required for T-Cell Suppression and T Regulatory Cell Activation Mediated by Myeloid-Derived Suppressor Cells in Cancer. Cancer Res (2010) 70(1):99–108. doi: 10.1158/0008-5472.CAN-09-1882
27. Mao Y, Sarhan D, Steven A, Seliger B, Kiessling R, Lundqvist A. Inhibition of Tumor-Derived Prostaglandin-E2 Blocks the Induction of Myeloid-Derived Suppressor Cells and Recovers Natural Killer Cell Activity. Clin Cancer Res (2014) 20(15):4096–106. doi: 10.1158/1078-0432.CCR-14-0635
28. Raber P, Ochoa AC, Rodriguez PC. Metabolism of L-Arginine by Myeloid-Derived Suppressor Cells in Cancer: Mechanisms of T Cell Suppression and Therapeutic Perspectives. Immunol Invest (2012) 41(6-7):614–34. doi: 10.3109/08820139.2012.680634
29. Srivastava MK, Sinha P, Clements VK, Rodriguez P, Ostrand-Rosenberg S. Myeloid-Derived Suppressor Cells Inhibit T-Cell Activation by Depleting Cystine and Cysteine. Cancer Res (2010) 70(1):68–77. doi: 10.1158/0008-5472.CAN-09-2587
30. Yu J, Du W, Yan F, Wang Y, Li H, Cao S, et al. Myeloid-Derived Suppressor Cells Suppress Antitumor Immune Responses Through IDO Expression and Correlate With Lymph Node Metastasis in Patients With Breast Cancer. J Immunol (2013) 190(7):3783–97. doi: 10.4049/jimmunol.1201449
31. Ramachandran IR, Condamine T, Lin C, Herlihy SE, Garfall A, Vogl DT, et al. Bone Marrow PMN-MDSCs and Neutrophils are Functionally Similar in Protection of Multiple Myeloma From Chemotherapy. Cancer Lett (2016) 371(1):117–24. doi: 10.1016/j.canlet.2015.10.040
32. Belgiovine C, D’Incalci M, Allavena P, Frapolli R. Tumor-Associated Macrophages and Anti-Tumor Therapies: Complex Links. Cell Mol Life Sci (2016) 73(13):2411–24. doi: 10.1007/s00018-016-2166-5
33. Jetten N, Verbruggen S, Gijbels MJ, Post MJ, De Winther MP, Donners MM. Anti-Inflammatory M2, But Not Pro-Inflammatory M1 Macrophages Promote Angiogenesis In Vivo. Angiogenesis (2014) 17(1):109–18. doi: 10.1007/s10456-013-9381-6
34. Wyckoff JB, Wang Y, Lin EY, Li JF, Goswami S, Stanley ER, et al. Direct Visualization of Macrophage-Assisted Tumor Cell Intravasation in Mammary Tumors. Cancer Res (2007) 67(6):2649–56. doi: 10.1158/0008-5472.CAN-06-1823
35. Ruffell B, Coussens LM. Macrophages and Therapeutic Resistance in Cancer. Cancer Cell (2015) 27(4):462–72. doi: 10.1016/j.ccell.2015.02.015
36. Chen JJ, Lin YC, Yao PL, Yuan A, Chen HY, Shun CT, et al. Tumor-Associated Macrophages: The Double-Edged Sword in Cancer Progression. J Clin Oncol (2005) 23(5):953–64. doi: 10.1200/JCO.2005.12.172
37. Zhu XD, Zhang JB, Zhuang PY, Zhu HG, Zhang W, Xiong YQ, et al. High Expression of Macrophage Colony-Stimulating Factor in Peritumoral Liver Tissue is Associated With Poor Survival After Curative Resection of Hepatocellular Carcinoma. J Clin Oncol (2008) 26(16):2707–16. doi: 10.1200/JCO.2007.15.6521
Keywords: ERO1L, tumor microenvironment, biomarker, immunotherapy, lung adenocarcinoma
Citation: Liu L, Wang C, Li S, Qu Y, Xue P, Ma Z, Zhang X, Bai H and Wang J (2021) ERO1L Is a Novel and Potential Biomarker in Lung Adenocarcinoma and Shapes the Immune-Suppressive Tumor Microenvironment. Front. Immunol. 12:677169. doi: 10.3389/fimmu.2021.677169
Received: 07 March 2021; Accepted: 01 July 2021;
Published: 20 July 2021.
Edited by:
Min Cheng, Weifang Medical University, ChinaCopyright © 2021 Liu, Wang, Li, Qu, Xue, Ma, Zhang, Bai and Wang. This is an open-access article distributed under the terms of the Creative Commons Attribution License (CC BY). The use, distribution or reproduction in other forums is permitted, provided the original author(s) and the copyright owner(s) are credited and that the original publication in this journal is cited, in accordance with accepted academic practice. No use, distribution or reproduction is permitted which does not comply with these terms.
*Correspondence: Jie Wang, emxodXhpQDE2My5jb20=; Hua Bai, aHVhYmFpaGJAc2luYS5jb20=
†These authors have contributed equally to this work