 Zhicheng Hu
 Shanqiang Qu
- 1Department of Burn Surgery, The First Affiliated Hospital, Sun Yat-sen University, Guangzhou, China
- 2Department of Neurosurgery, Nanfang Hospital, Southern Medical University, Guangzhou, China
Background: Immunotherapy is an effective therapeutic approach for multiple human cancer types. However, the correlations between EVA1C and patients’ prognosis as well as immune infiltration remain obscure. Herein, we employed transcriptomic and clinical data extracted from two independent databases to systematically investigate the role of EVA1C in the oncological context.
Methods: The differential expression of EVA1C was analyzed via TCGA and Oncomine databases. We evaluated the influence of EVA1C on clinical prognosis using Kaplan-Meier plotter. We then used the expression profiler to calculate stromal score, immune score, and ESTIMATE score based on the ESTIMATE algorithm. The abundance of infiltrating immune cells was calculated via TIMER. The correlations between EVA1C expression and immune infiltration levels were analyzed in two independent cohorts.
Results: In patients with World Health Organization (WHO) grade II/III glioma, high EVA1C expression was associated with malignant clinicopathological features and poor overall survival in both cohorts. EVA1C expression was positively associated with immune infiltration levels of B cell, CD4+ T cell, neutrophil, macrophage, and dendritic cells (DCs). Besides, EVA1C expression strongly correlated with diverse immune marker sets. And the predictive power of EVA1C was better than that of other indicators in predicting high immune infiltration levels in glioma.
Conclusions: For the first time, we identified the overexpression of EVA1C in glioma, which was tightly correlated with the high infiltration levels of multiple immune cells as well as poor prognosis. Meanwhile, EVA1C might be a potential biomarker for predicting high immune infiltration in WHO grade II/III gliomas.
Introduction
Human brain is derived from the neural ectoderm and accounts for about half of all intracranial tumor incidences (1). In China, there are 106,207 new cases and 59,120 glioma-related deaths each year (2). Diffuse WHOII/III glioma is a lethal threat to young adults, which tends to have a wide range of genetic and transcriptional heterogeneity (3). Compared with WHOIV gliomas, the course of WHOII/III gliomas is very slow. Recent studies have mainly classified gliomas based on two genetic markers, such as isocitrate dehydrogenase (IDH) mutation and codeletion of chromosome arms 1p and 19q (codeletion) (4). In the vast majority of WHOII/III gliomas, IDH mutation is present in 84% of cases, and 1p/19q codeletion is present in 35% of cases. IDH mutation tends to occur in the early stage of gliomas (3). Although adjuvant therapeutics have improved the prognosis of glioma to some extent, the overall survival (OS) of glioma patients remains poor (5, 6). Thus, novel strategies are in urgent need for the hope to improve the unpleasing outcomes.
Immunotherapy has emerged as one of the most important therapeutic means for tumor in the past decades (7, 8). Especially, approaches targeting recognized immune checkpoints, such as anti-PD-1 and anti-CTLA4, have been approved for clinical utilization and achieved encouraging outcomes (9, 10). However, there are still some limitations in existing T cell-based immunotherapies, which are attributed to the extremely complex immunosuppressive processes of tumor microenvironment (TME) and its regulatory networks (11). Importantly, many patients didn’t respond well or acquired rapid resistance to the immune checkpoint blockers in clinical practice. Therefore, it is necessary to further explore the immunosuppressive essence and the underlying mechanism within TME (12). Existing studies have confirmed that local TME is composed of various cell types, including tumor cells, infiltrating cells and stromal cells, as well as soluble factors that support tumor growth and progression (13). TME usually confers a high degree of immunosuppression, preventing the clearance of malignant cells by immune components, which negatively impacts cancer immunotherapy (14). Therefore, seeking novel immune checkpoints and overcoming immunosuppressive processes are very critical for the improvement of effective immunotherapies against tumors.
EVA1C (aliases C21orf63), first identified in 2001, is a membrane protein encoding-gene (15). EVA1C protein has been found in a variety of human tissues. Kanae Mitsunaga (16) identified EVA1C protein possessing two repeats of putative ‘galactose-binding lectin domains’ that bind heparin. Although the role of EVA1C has not been reported in tumor, Manas Kotepui et al. reported that ADGRL3 (LPHN3), an important paralog of EVA1C gene, was upregulated in breast cancer and was correlated with axillary lymph node metastasis (17). In addition, Inna M. Yasinska et al. found that the PKCa pathway could be activated by FLRT3 via LPHN1, LPHN2 and LPHN3 (18). Collectively, their findings indicated FLRT3-LPHN-Tim-3-galectin-9 pathway plays a key role in escaping systemic immunosurveillance across various cancer types. However, the specific expression and function of EVA1C, especially in the context of immuno-oncologic interactions, remain poorly understood.
Herein, our study was aimed to identify the EVA1C expression and its correlation with clinicopathological factors, and survival prognosis of patients with WHO grade II/III glioma. Meanwhile, we focused on the correlation between EVA1C expression and abundance of immune infiltrates by immune profiles, and further investigate whether EVA1C could act as a new immune marker for assessing immune microenvironment of glioma patients.
Materials and Methods
Data Extraction
The mRNA sequencing data and clinicopathological data of all cases in this study were extracted from the Chinese Glioma Genome Atlas (CGGA, http://www.cgga.org.cn/) and The Cancer Genome Atlas (TCGA, https://tcga-data.nci.nih.gov/tcga/) databases. Patients with incomplete follow-up data were excluded. Finally, a total of 182 patients with WHO grade II/III glioma were included from the CGGA (Dataset ID: mRNAseq_325) database as the CGGA cohort, and 457 patients with WHO grade II/III glioma from TCGA database were defined as validation cohort. The detailed demographics of enrolled glioma patients in both cohorts were included in Supplementary Tables 1 and 2, respectively. The Estimation of Stromal and Immune cells in gliomas using Expression data (ESTIMATE) and Tumor Immune Estimation Resource (TIMER) algorithms were used to explore the immune infiltration landscapes. Since all the data are from public databases, the Ethics Committee of Nanfang Hospital granted ethical approval for the study, but waived the requirement for informed consents.
Differential Expression of EVA1C in Tumors
The GEPIA (http://gepia.cancer-pku.cn/) is an online tool for dynamic analysis of gene expression profile data. GEPIA analyzed the RNA sequencing data of 9736 tumors and 8587 normal samples from TCGA and GTEx projects. The expression data of TCGA and GTEx were recalculated under the same pipeline, which can be used for very comprehensive expression analysis directly. Therefore, we employed the GEPIA webtool to examine the EVA1C expression profile and its correlation with patients’ prognosis. We further verified the differential expression of EVA1C at the mRNA level in glioma via the Oncomine database (www.oncomine.com). Normalized mRNA expression data for CCLE human cancer cell lines were extracted from the CCLE portal (https://portals.broadinstitute.org/ccle). The expression of EVA1C protein was obtained online from the Human Protein Atlas (HPA, www.proteinatlas.org).
GO and KEGG Pathway Enrichment Analyses
To understand the potential biological functions of EVA1C, including molecular function, biological processes, and cellular components, we employed the DAVID database (Version 6.8, http://david.abcc.ncifcrf.gov/) to perform the GO and KEGG enrichment analyses. At first, we used the co-expression scores to obtain the top 1000 genes (19) co-expressed with EVA1C, which were used for subsequent functional and pathway enrichment analyses including Kyoto Encyclopedia of Genes and Genomes (KEGG) pathway and Gene Ontology (GO) analyses (P < 0.05 and false discovery rate (FDR) < 0.05). And the potential protein-protein interaction (PPI) networks were developed using the STRING database (Version 11; https://string-db.org/), which is an online search database for protein interaction relationship. Additionally, GO analyses were further analyzed with Coexpdia (http://www.coexpedia.org/) that was based on GEO datasets.
Statistical Analysis
Statistical analysis was performed by SPSS (version 23.0, Corp., Armonk, NY, USA) and R programming language (Version 3.6.1). The ESTIMATE immune score and stromal score were computed by the ESTIMATE algorithm. Different immune cells infiltration levels were calculated by TIMER algorithm. The chi-square tests were performed to calculate the difference of categorical data. Spearman’s correlation analyses were used to gauge the degree of correlation between certain variables. And the survival plots were generated by the Kaplan-Meier method. Time-dependent receiver operating characteristic (ROC) curves were constructed using the R programming language. All tests were two-sided, and P value <0.05 was the significance threshold in this study.
Results
The mRNA and Protein Levels of EVA1C Were Upregulated in Glioma
Firstly, we compared the differences in EVA1C expression between glioma and normal brain tissues by GEPIA website, and found that the mRNA levels of EVA1C were upregulated in glioblastoma (GBM) (Figure 1A). Meanwhile, immunohistochemistry results showed that EVA1C protein was strongly over-expressed in GBM compared with normal brain tissues (Figure 1B). The upregulation of EVA1C mRNA in GBM was also verified in two independent cohorts (‘Sun Brain’ and ‘Murat Brain’) from the Oncomine database (Figures 1C, D). The EVA1C expression in different tumors cell lines was obtained from CCLE database, it was also confirmed that EVA1C was highly expression in glioma cell lines (Supplementary Figure 1A). Additionally, we also found that, compared with normal tissues, EVA1C mRNA levels were higher in other cancer types including kidney renal clear cell carcinoma (KIRC), acute myeloid leukemia (LAML), pancreatic adenocarcinoma (PAAD), and thymoma (THYM) (Supplementary Figure 1B), and EVA1C protein levels were upregulated in renal cancer and pancreatic cancer (Supplementary Figure 1C).
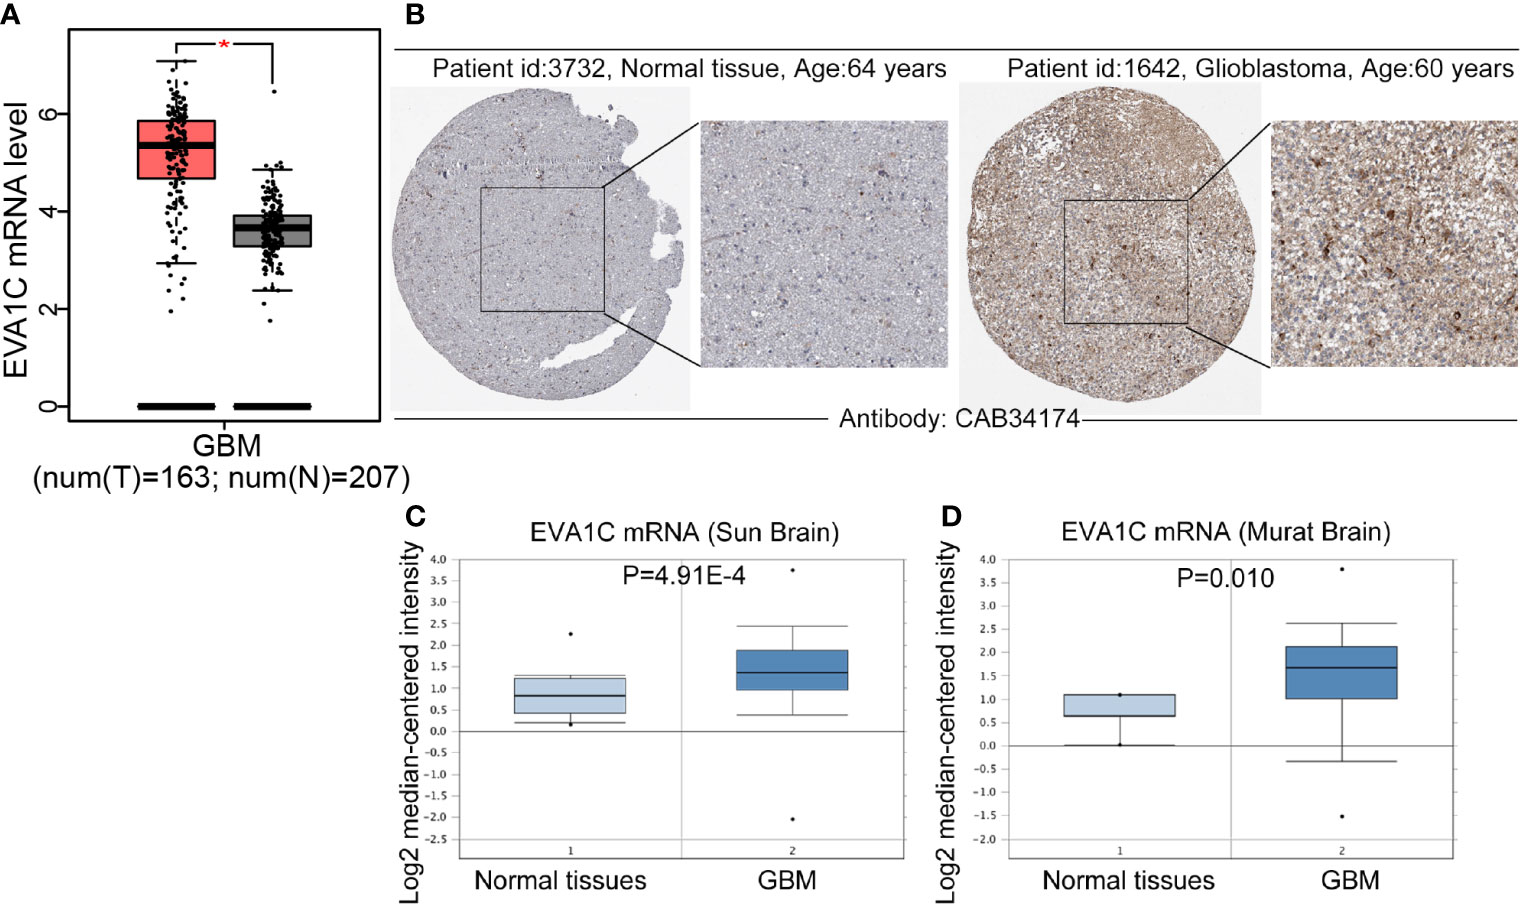
Figure 1 Compared with normal brain tissues, EVA1C expression was upregulated in glioma. (A, B) Compared with those in the normal brain tissues, the EVA1C mRNA and protein levels in GBM were upregulated. (C, D) The mRNA levels of EVA1C were upregulated in GBM (Oncomine database). T, Tumor tissues; N, Normal tissues.
Elevated EVA1C Expression Correlated With Malignant Clinicopathological Features and Poor Prognosis in Patients With WHO II/III Glioma
To identify the role of EVA1C in glioma, we statistically analyzed the correlation between EVA1C expression and clinicopathological features as well as prognosis in the CGGA cohort of 182 patients with WHO grade II/III glioma. The 182 patients were divided into low and high EVA1C expression groups based on the median value of EVA1C mRNA level. Results of chi-square tests revealed that high EVA1C expression was significantly correlated with several malignant features including WHO grade, histopathological type, IDH mutation status, and 1p/19q non-codeletion (Table 1, Supplementary Figure 2). However, the correlations were not significant between EVA1C expression and age, gender, history of radiotherapy or chemotherapy, MGMT promoter methylation, as well as tumor recurrence (Table 1). Critically, the expression level of EVA1C was significantly and positively correlated with that of vimentin (r = 0.51, P = 2.33e-13, Figure 2A). These results suggested that high EVA1C expression was positively associated with malignant properties of glioma. Furthermore, EVA1C was considered as a risk factor for glioma patients as Kaplan-Meier curves showed that the high EVA1C expression group presented poorer prognosis than the low expression group (Figure 2C).
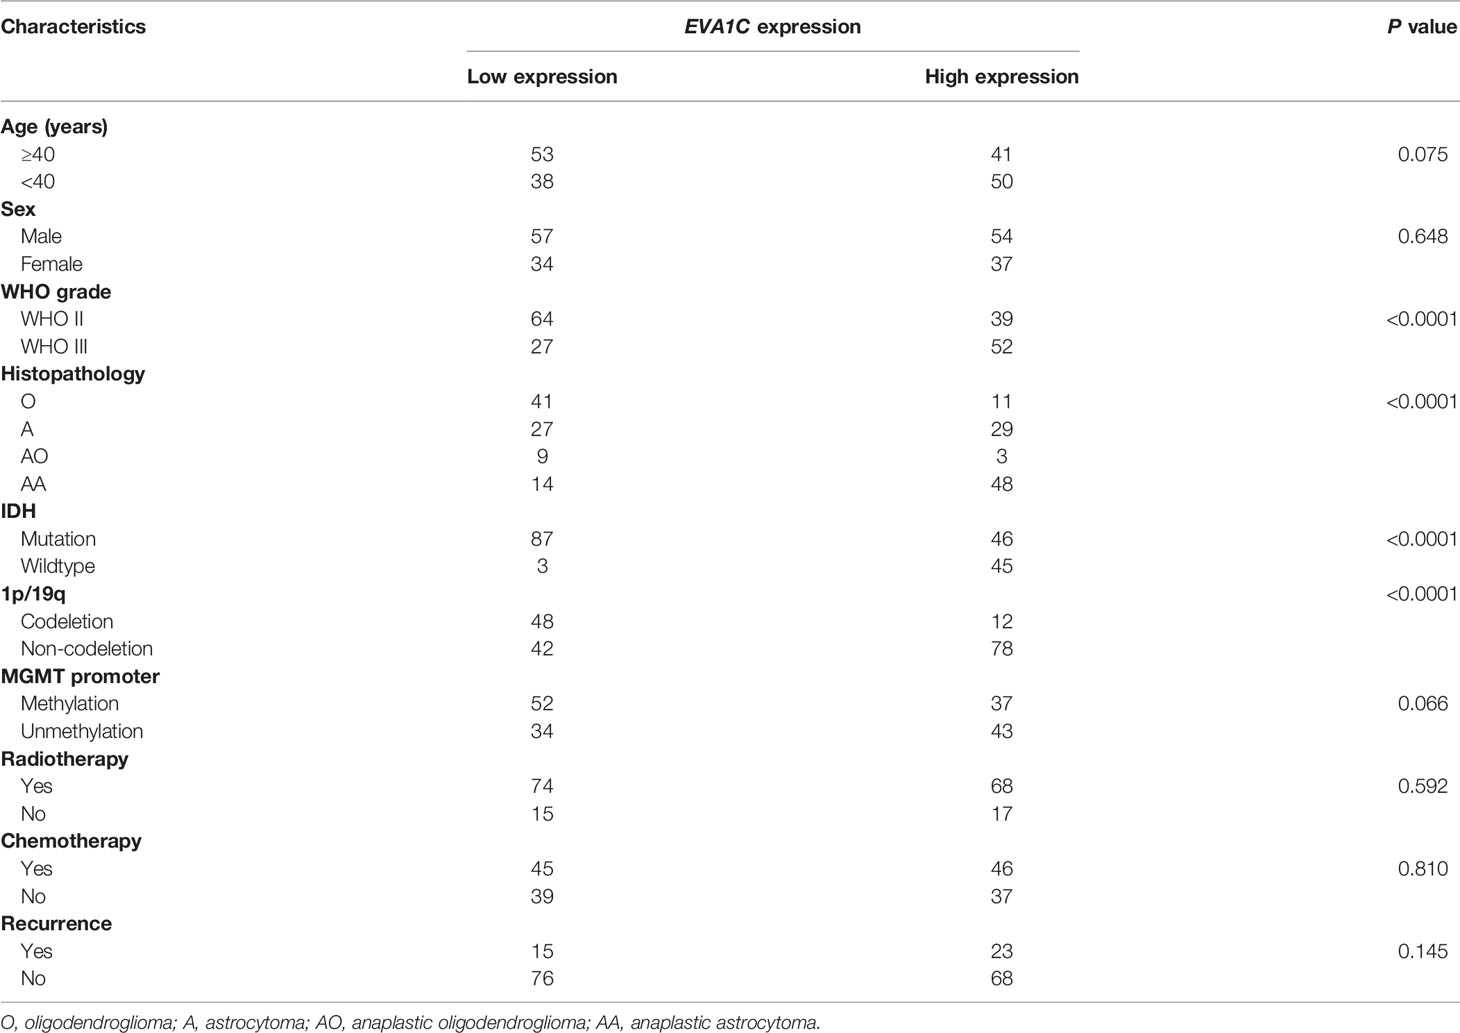
Table 1 The correlation between EVA1C expression level and clinicopathological features of patients in the CGGA cohort (n = 182).
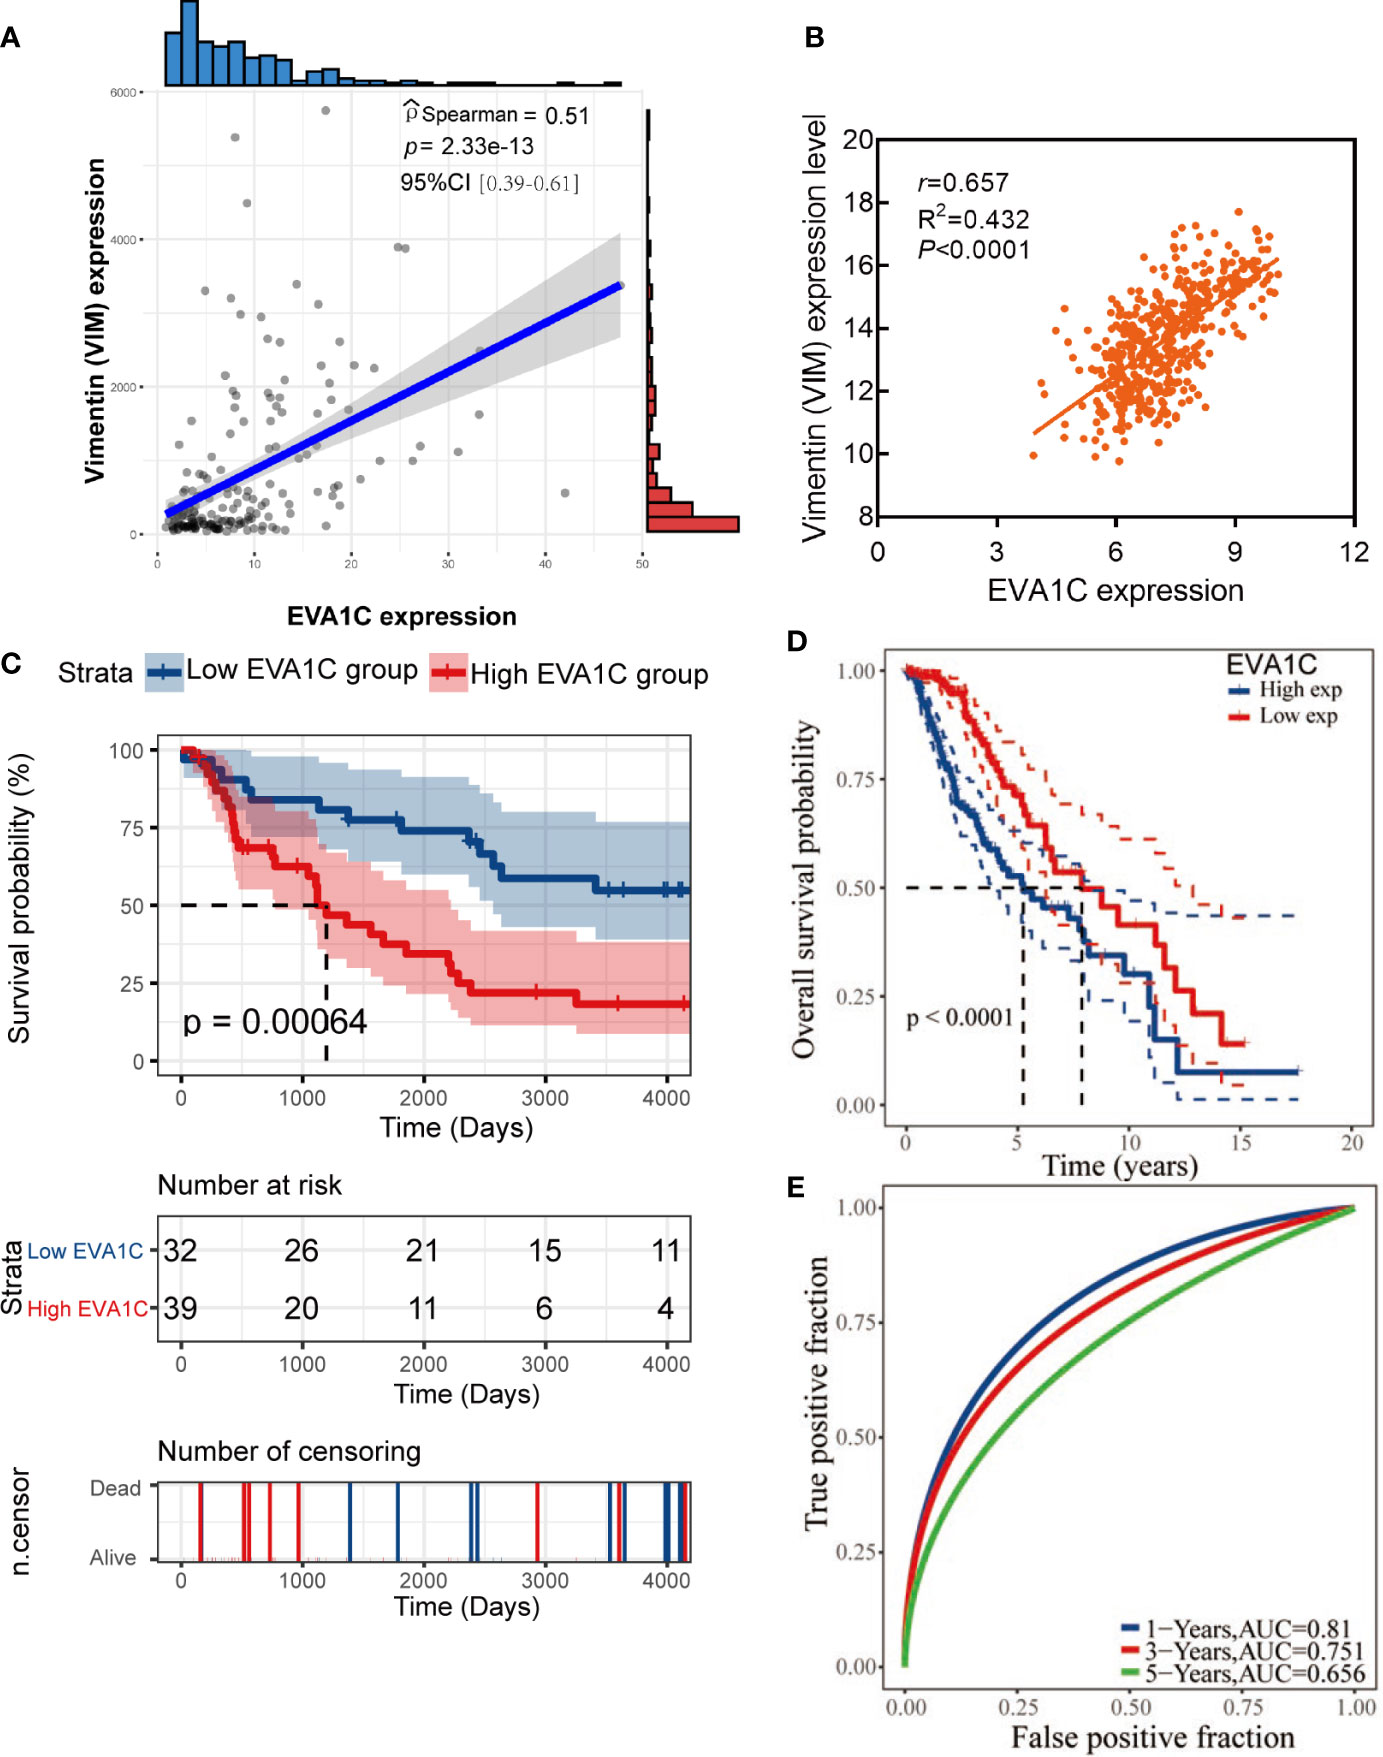
Figure 2 High EVA1C expression was associated with poor prognosis in WHO grade II/III glioma. (A, B) EVA1C expression was strongly correlated with vimentin expression in the CGGA and TCGA cohorts. (C, D) Patients with high EVA1C expression had a poor prognosis in the CGGA and TCGA cohorts. (E) The predictive power of EVA1C for predicting the 1-, 3-, and 5-year survival rate was relatively strong (TCGA cohort).
Next, a larger TCGA cohort of 457 glioma patients was used to validate the above results. Similarly, the analysis results indicated that EVA1C expression was correlated with WHO grade, histopathological type, IDH mutation status and 1p/19q codeletion (Supplementary Table 3). The robust correlation between EVA1C and vimentin was also confirmed in the validation cohort (r = 0.657, P < 0.0001, Figure 2B). Moreover, survival analysis verified the significant association between elevated EVA1C expression and poorer prognosis in the TCGA cohort (Figure 2D). Additionally, the ROC curves revealed that the AUCs of EVA1C for predicting the 1-, 3-, and 5-year survival were 0.810, 0.751, and 0.656, respectively (Figure 2E). Finally, we also analyzed the correlation between EVA1C expression and the prognosis of patients with other solid tumors, including KIRC, LAML, PAAD and THYM. However, the significant correlation between high EVA1C expression and poor prognosis was only observed in patients with LAML (Supplementary Figure 3).
EVA1C Was Associated With Immune-Related Biological Functions
To identify the potential functions of EVA1C in glioma, the top 1000 co-expressed genes of EVA1C were extracted and subsequently inputted for enrichment analysis. As shown in Figure 3A, genes that co-expressed with EVA1C were enriched in several immune-related GO terms, including “innate immune response”, “antigen processing and presentation”, “B cell activation”, and “platelet degranulation”. Meanwhile, the significantly enriched KEGG pathways included “staphylococcus aureus infection”, “viral myocarditis”, “intestinal immune network for IgA production”, “cell adhesion molecules”, “antigen processing and presentation”, and “allograft rejection” (Figure 3B). These findings suggested that EVA1C might regulate the immune microenvironment through various immune processes such as antigen processing and presentation, complement and coagulation cascades, and intestinal immune network for IgA production. Next, we also used the Coexpedia online website, which based on 384 human GEO datasets and 248 mouse GEO datasets, to analyze the biological functions of EVA1C gene. The results also showed that EVA1C gene was associated with the activation of NF-KB signaling pathway, macrophage activation involved in immune response, cellular response to interleukin-6 (Supplementary Figure 4). Previous study also showed that the activation NF-KB signaling pathway in breast cancer cells could upregulate interleukin-6 expression, and further promote cancer cell metastasis (20).
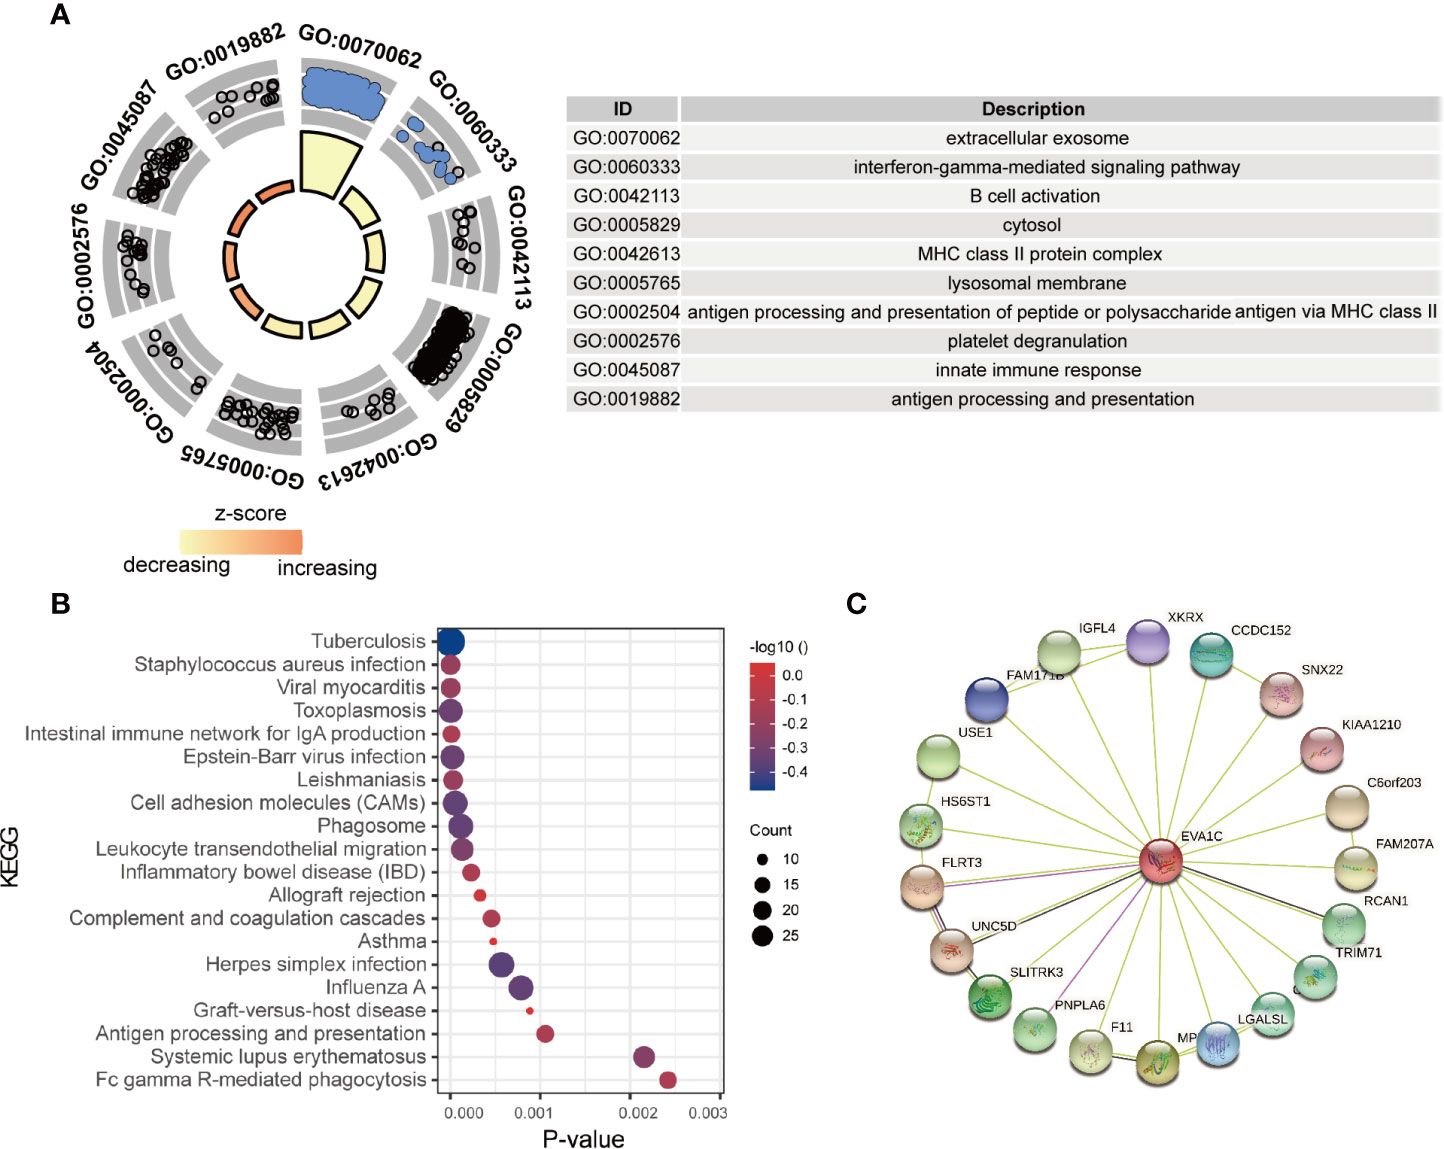
Figure 3 The enrichment analysis of EVA1C co-expression genes indicated EVA1C was involved in inflammatory and immune biological processes. (A) The top 10 GO enrichment terms. (B) The top 20 KEGG pathways enriched. (C) The protein-protein network was constructed via the STRING database.
In addition, the proteins interacting with EVA1C (Figure 3C) were enriched in terms including ‘complement and coagulation cascades’ and ‘thyroid hormone signaling pathway’, showing the potential role of EVA1C in affecting the processes of innate and acquired adaptive immune responses, which might impact tumor initiation and progression.
Association Between EVA1C Expression and Microenvironment of Glioma
We used the expression profiler to calculate stromal score, immune score and ESTIMATE score by the ESTIMATE algorithm, and calculate the infiltration abundance of immune cells. The immune landscape illustrated that various immune infiltration levels in the EVA1C high expression group were higher than those in the EVA1C low expression group (Figure 4A). Specifically, the immune score, stromal score, and ESTIMATE score were all significantly higher in the EVA1C high expression group (Figures 4B–D). Furthermore, we calculated the enrichment scores based on the TIMER algorithm and found that the scores of B cell, CD4+ T cell, neutrophil, macrophage, and DCs (except for CD8+ T cell) in the EVA1C high expression group were higher than those in the EVA1C low expression group (Figures 4E–J). The immune landscape illustrated the proportions of different immune cell subpopulations in CGGA and TCGA cohorts, and the findings were quite consistent (Figure 5A). Subsequent scatter plots showed the similar results that EVA1C expression had significant correlations with the infiltration levels of B cell (r = 0.262, P = 0.004), CD4+ T cell (r = 0.418, P < 0.0001), neutrophil (r = 0.335, P < 0.0001), macrophage (r = 0.608, P < 0.0001), and DCs (r = 0.645, P < 0.0001), except for CD8+ T cell (r = 0.037, P = 0.620) (Figures 5B–G).
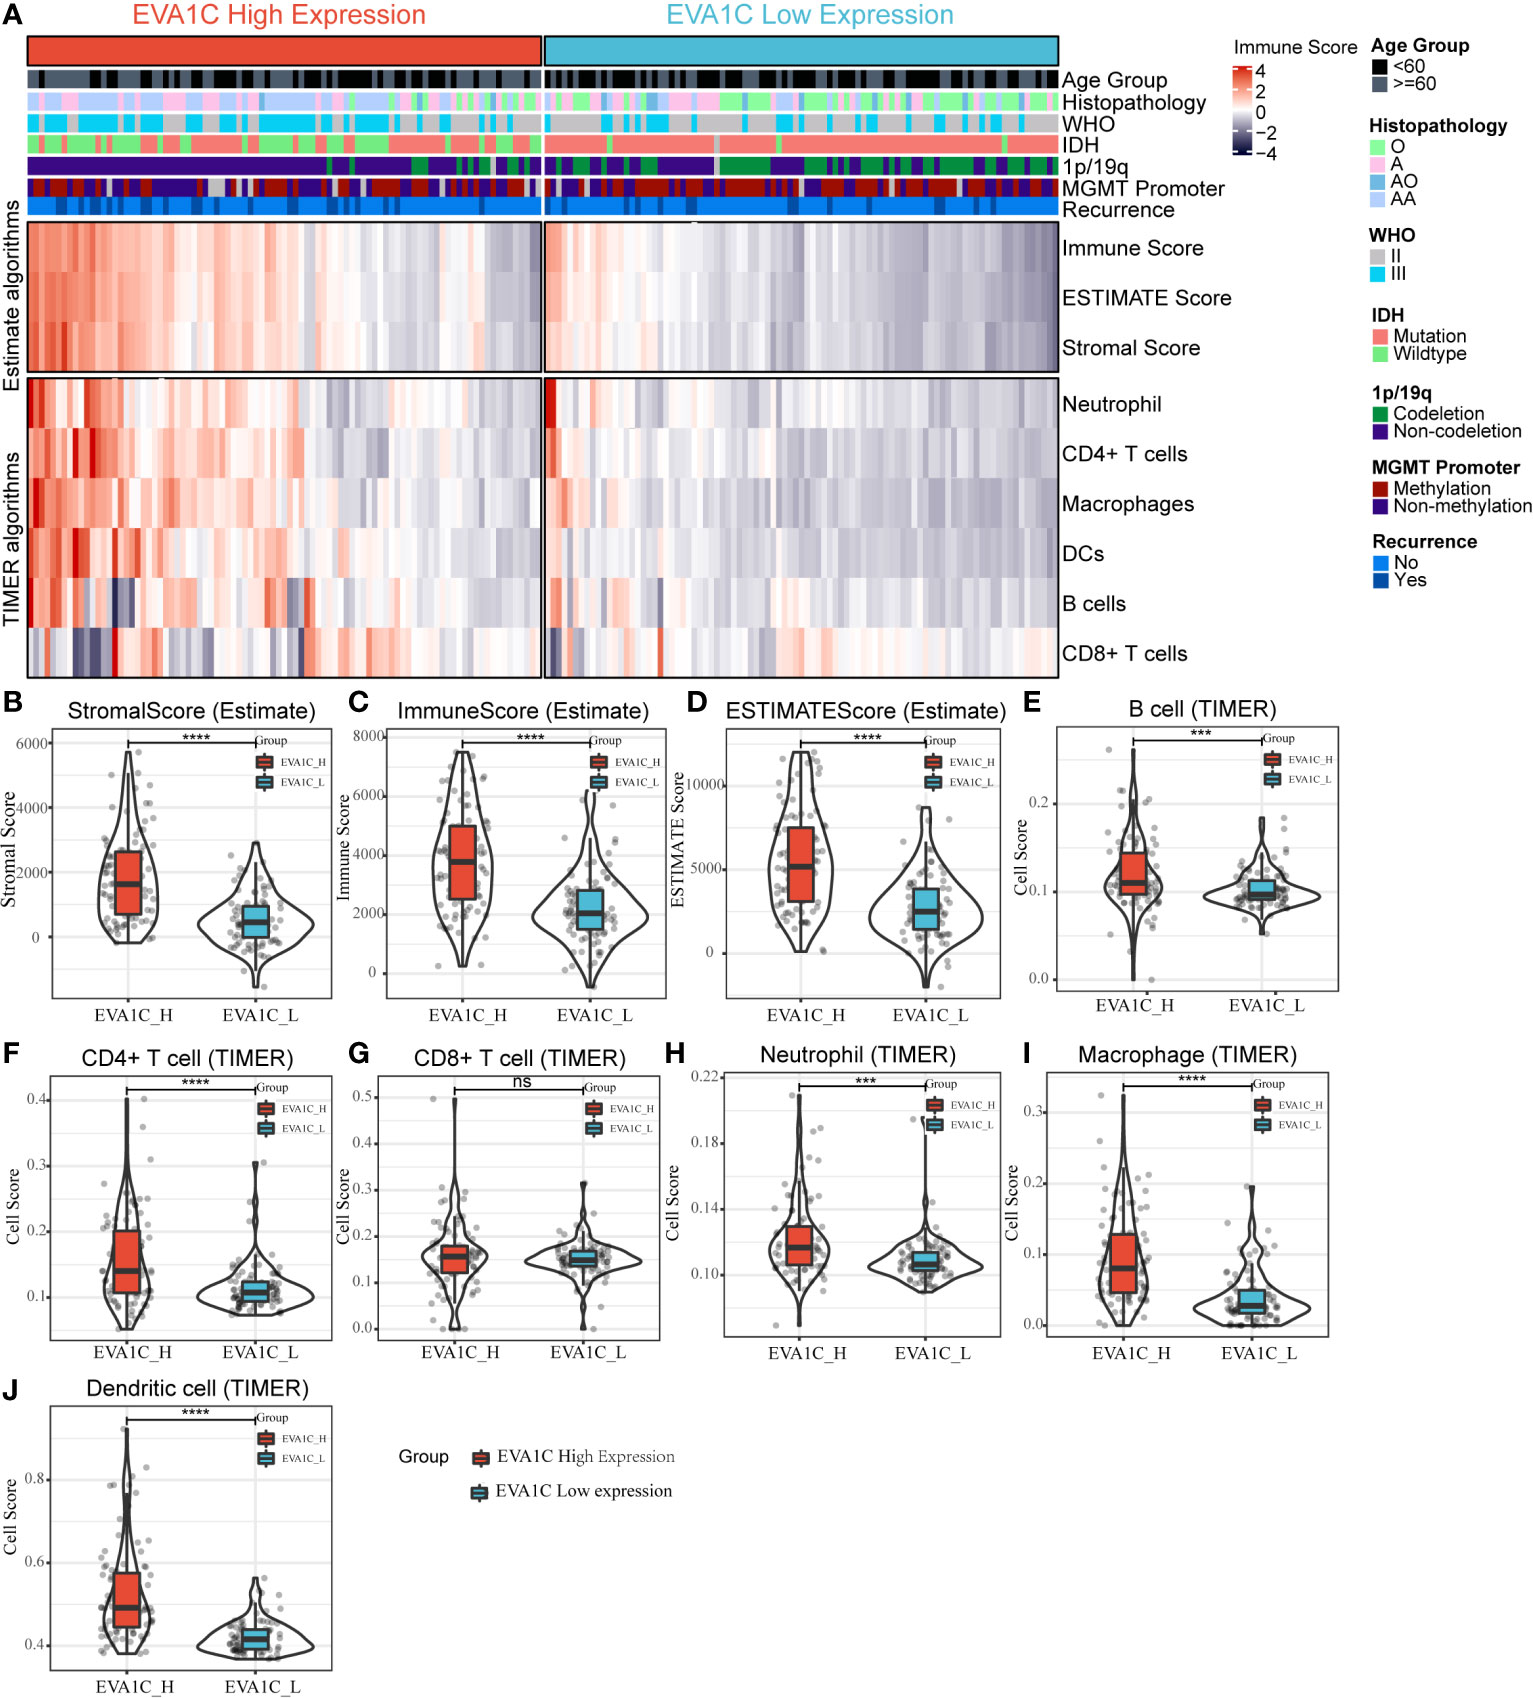
Figure 4 The relationship between EVA1C expression and immune infiltration in the CGGA cohort. (A) The heatmap represents cell type enrichment score of each immune cell type for the 182 samples. (B–D) The comparison of stromal score, immune score, and ESTIMATE score between the high and low EVA1C expression groups. (E–J) The comparison of the abundance of B cell, CD4+ T cell, CD8+ T cell, neutrophil, macrophage, and dendritic cell between the high and low EVA1C expression groups.
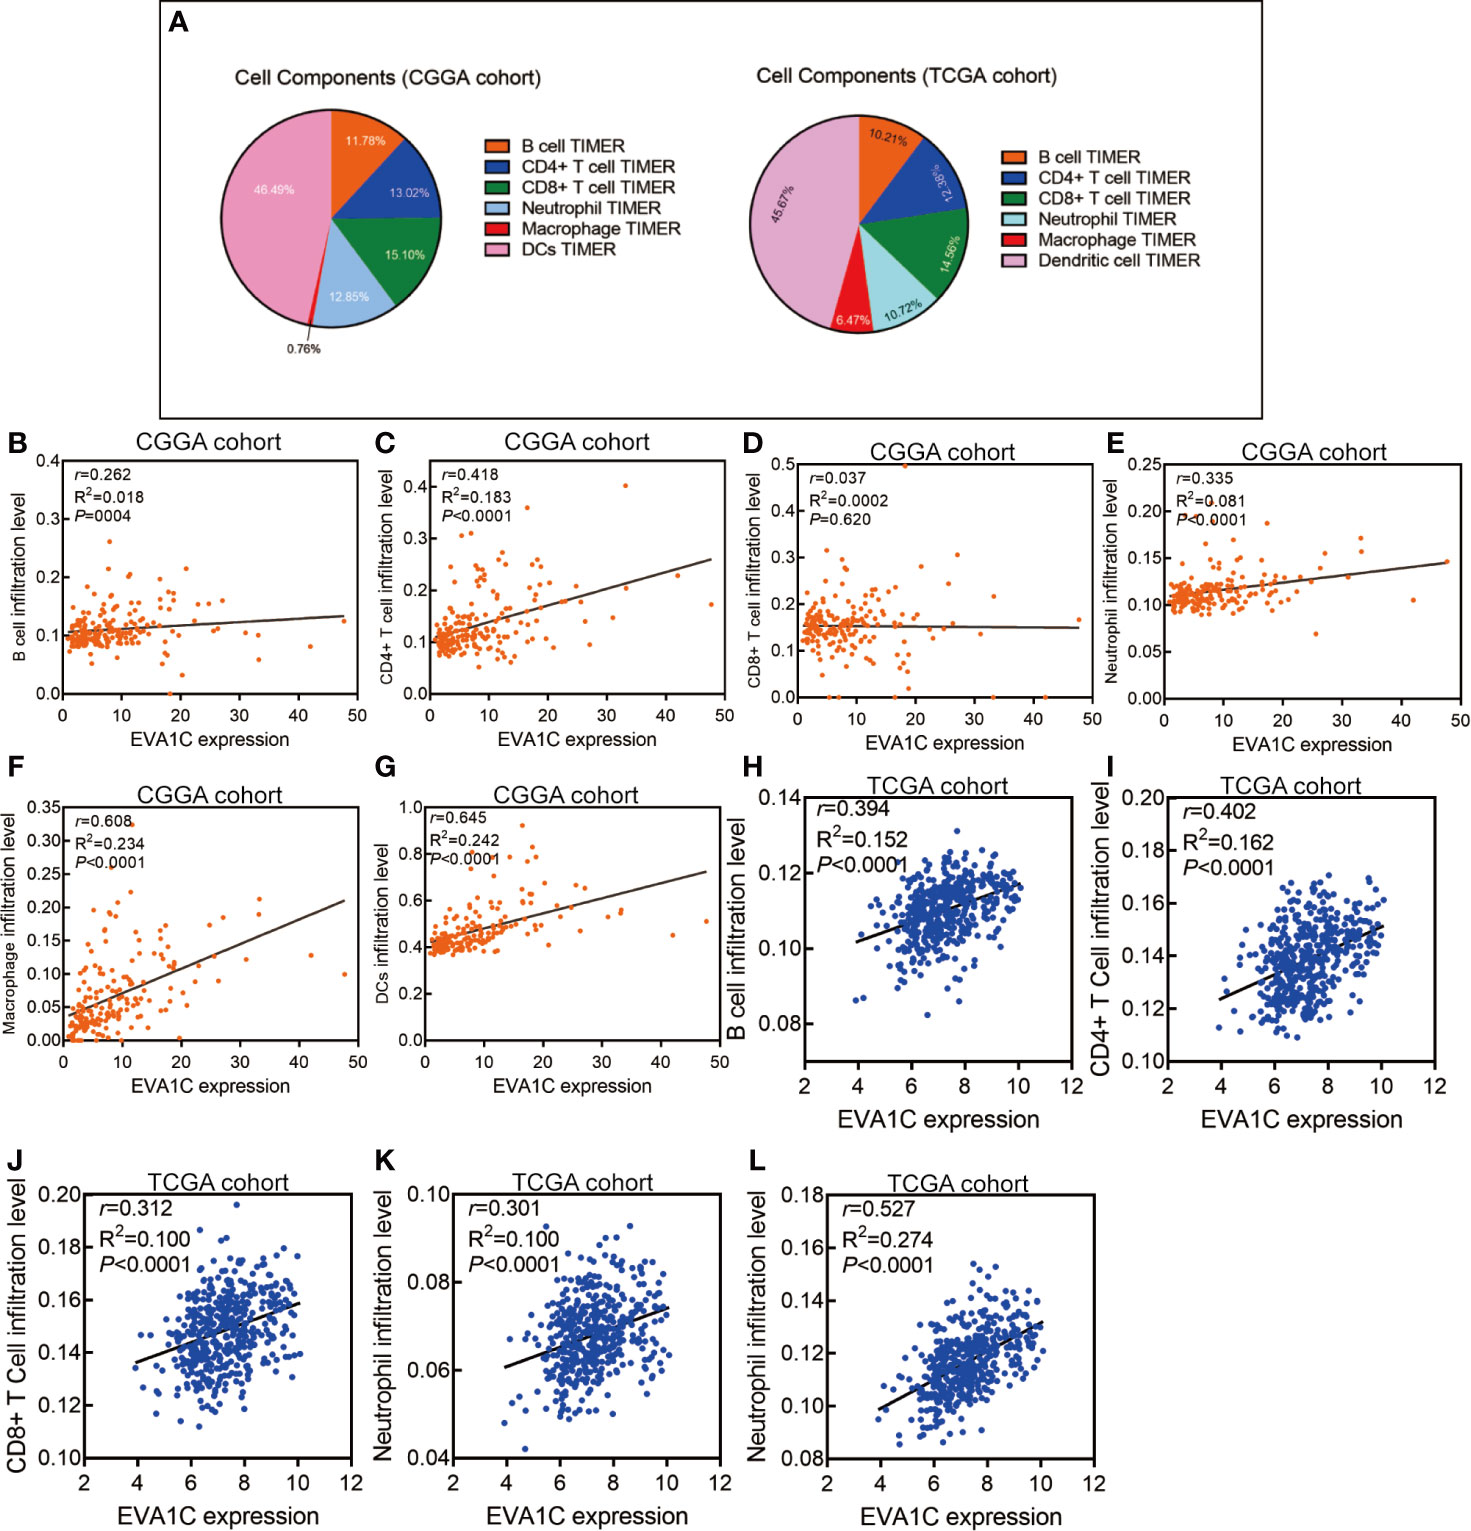
Figure 5 High EVA1C expression was positively correlated with immune infiltration levels. (A) The heatmap shows the proportions of different immune cell subpopulations in CGGA and TCGA cohorts. The scatter plots show correlations between EVA1C expression with the abundance of various immune infiltrates in the CGGA cohort (B–G) and the TCGA cohort (H–L).
We also used the TCGA validation cohort to verify the above positive correlations. Similar results were obtained that elevated EVA1C expression was associated with higher abundance of various immune infiltrates (Supplementary Figure 5). Likewise, significant correlations were observed between EVA1C expression and infiltration levels of B cell (r = 0.394, P < 0.0001), CD4+ T cell (r = 0.402, P < 0.0001), CD8+ T cell (r = 0.312, P < 0.0001), neutrophil (r = 0.301, P < 0.0001), and macrophage (r = 0.527, P < 0.0001) in the TCGA validation cohort (Figures 5H–L). These findings strongly indicated the important role EVA1C played in immune infiltrating processes in the context of WHO grade II/III glioma. Finally, the correlation between EVA1C expression and the mRNA levels of chemokines, interleukins, interferons and other important cytokines and their receptors in the microenvironment of WHO grade II/III glioma by GEPIA database (Figure 6). These results suggested that, in the microenvironment of glioma with high EVA1C expression, there were not only a variety of immune cells, but also high expression of many chemokines including CCR5, CCL5, CXCL10, and CXCL9, which have been shown to attract DCs, T cell.
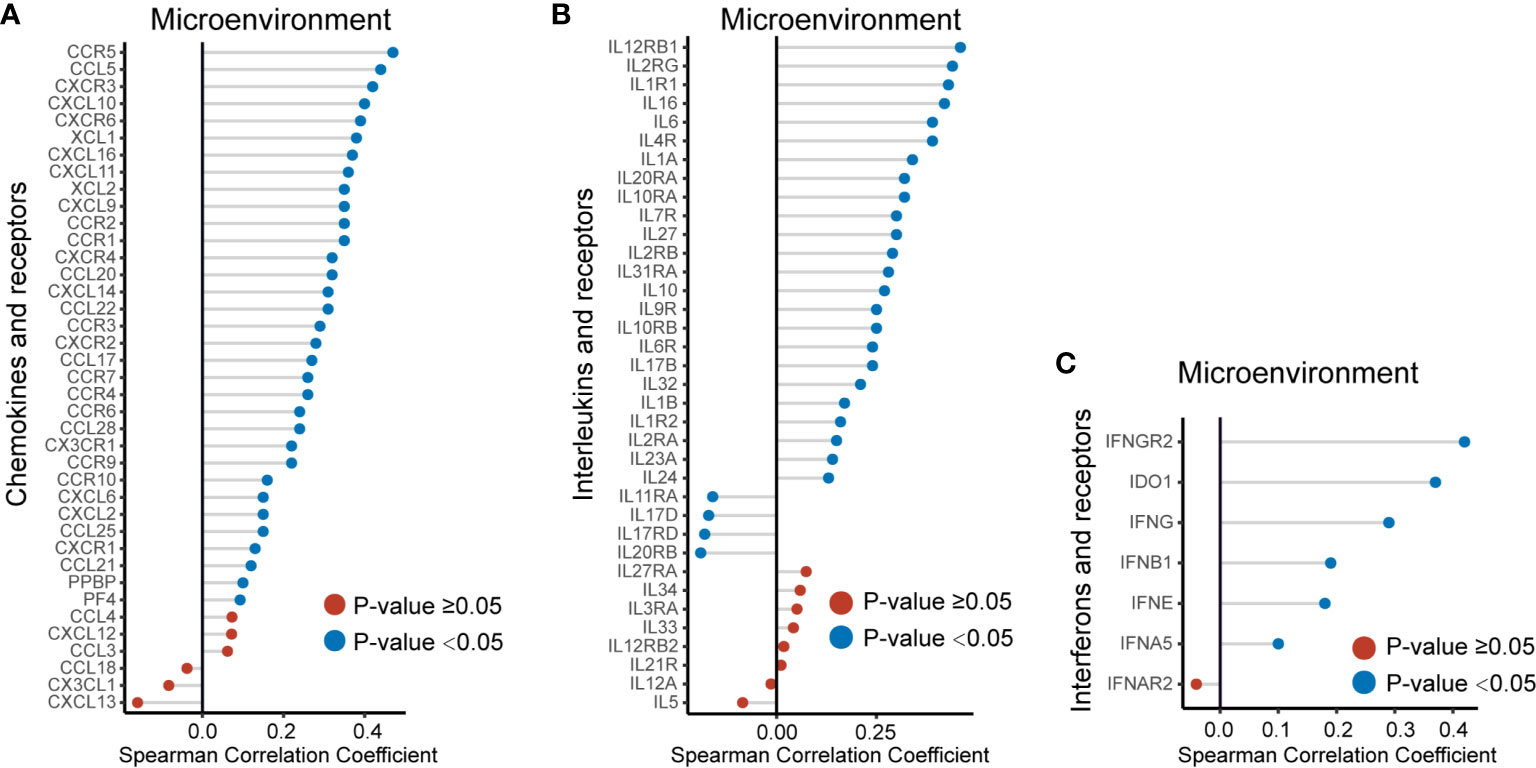
Figure 6 The EVA1C expression was correlated with the expression of cytokines, including chemokines (A), interleukins (B) and interferons (C), and their receptors in the microenvironment of WHO grade II/III glioma.
Correlation Analysis Between EVA1C Expression and Immune Marker Sets
Given the correlation between EVA1C expression and immune infiltration levels, we further analyzed the relationship between EVA1C expression and the marker genes of essential immune cells in glioma. Figure 7A shows the correlations between EVA1C expression and various immune markers in the CGGA cohort. Interestingly, EVA1C expression was associated with gene markers (21) of B cell, CD8+ T cell, M2 macrophage, DCs, Th2 cell, exhausted T cell, and neutrophil in WHO II/III glioma (Supplementary Table 4). These results suggested that EVA1C might play a specific role in regulating macrophage polarization in WHO II/III glioma. In addition, EVA1C expression was related to the markers of tumor associated macrophage (TAM), such as CCL2, CD68 and IL10. These findings further revealed a robust interaction between EVA1C and TAM infiltration. Furthermore, a significant relationship was detected between EVA1C expression and DCs markers (HLA-DPB1, HLA-DRA, HLA-DPA1, CD1C and ITGAX). In addition, significant correlations were found between EVA1C and TGFβ (TGFB1, marker of Treg cell), as well as TIM-3 (HAVCR2, T cell exhaustion) (Supplementary Table 4). These results were further confirmed in the TCGA validation cohort (Figure 7B), suggesting that EVA1C participated in immune escape within the tumor microenvironment of WHO II/III glioma.
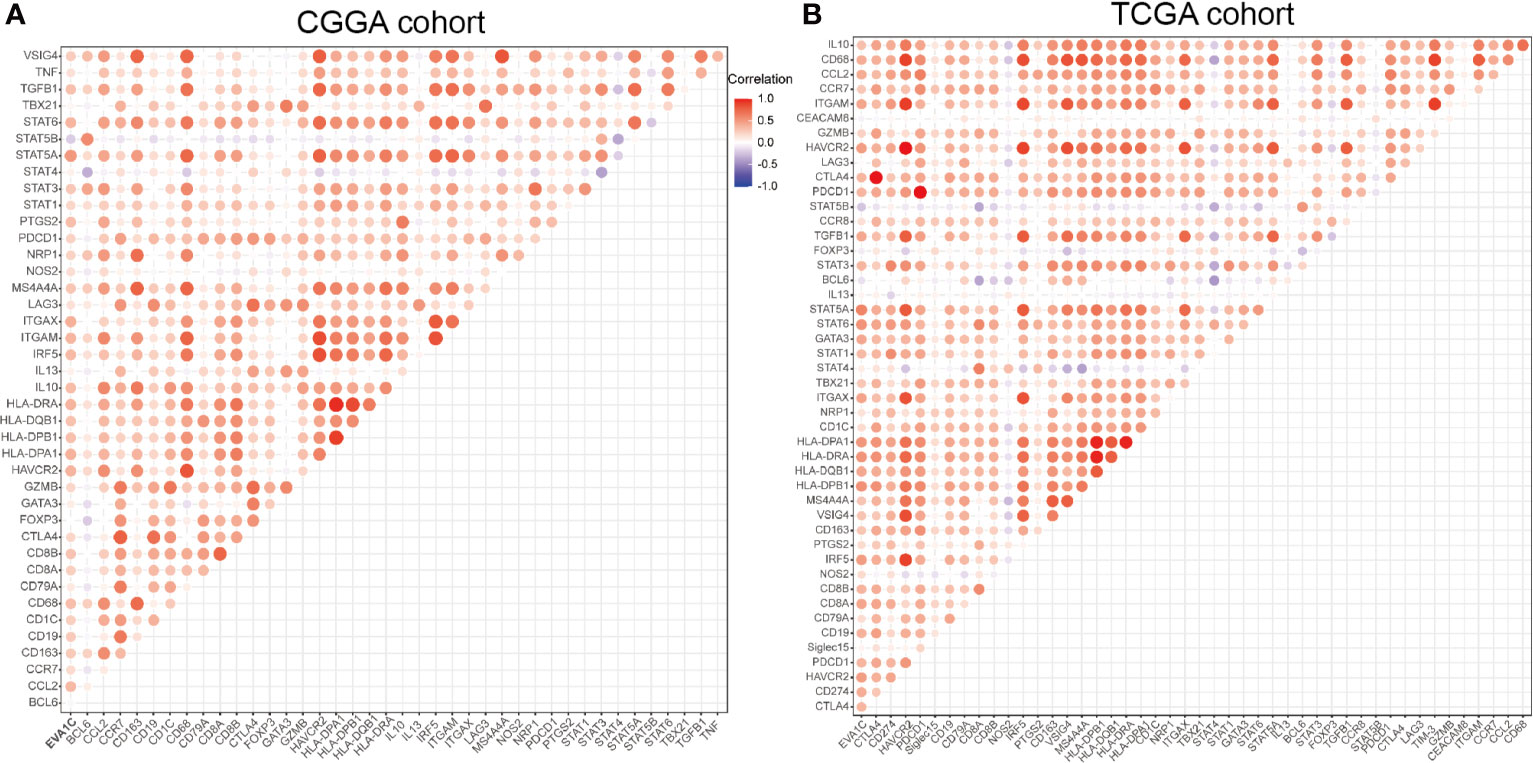
Figure 7 Correlation between EVA1C and marker gene sets of immune cells in the CGGA cohort (A) and the TCGA cohort (B).
The Performance of EVA1C in Predicting a High Immune Score in Glioma
To determine whether EVA1C could be considered as a potential biomarker to discriminate the immune infiltration levels in glioma, we applied the ROC curve to evaluate the ability of EVA1C in predicting a high immune score for glioma. As shown by Figure 8A, the sensitivity and specificity of EVA1C in predicting a high immune score in the CGGA cohort were 74.7% and 70.3%, respectively. The area under the curve (AUC) was 0.785. Additionally, we also compared the predictive performance between EVA1C and other commonly utilized indicators including PD-1, LAG3, CTLA-4 and Siglec15. In terms of AUC, EVA1C demonstrated the highest predictive performance in predicting a high immune score within glioma (Figure 8B). The consistent results were obtained in the TCGA cohort (Figures 8C, D).
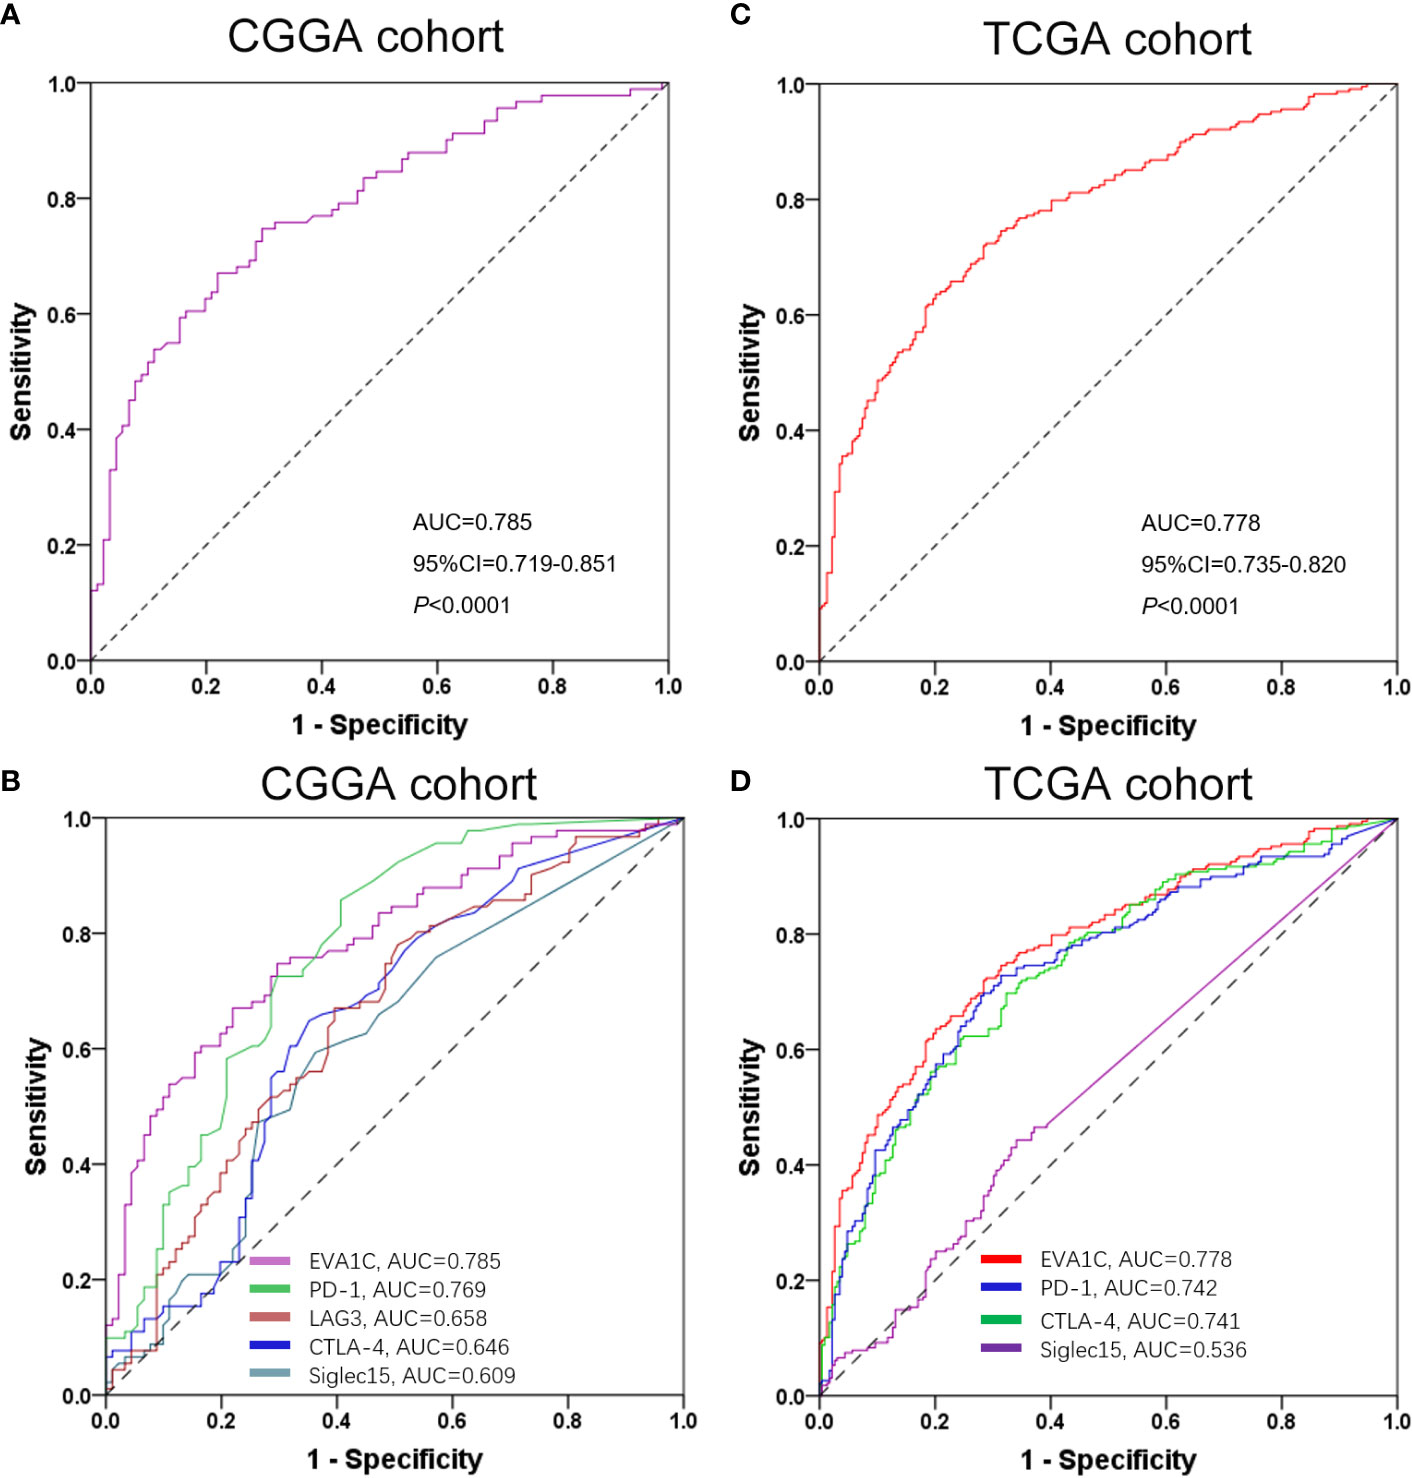
Figure 8 ROC curves of EVA1C gene for predicting high immune infiltration showed excellent power. ROC curves of EVA1C and other indicators in predicting high immune infiltration levels in the CGGA cohort (A, B) and the TCGA cohort (C, D).
Discussion
Nowadays, immune-oncological microenvironment has become the focus of cancer researches (22). Immunosuppressant began to be gradually applied to clinical patients. Although PD-1 and CTLA-4 antibodies have achieved a sustained response in some patients (23), most patients with glioma demonstrated poor responses to them. Such phenomena could be attributed to the essential and complicated immune escape processes in tumor microenvironment (24). There are multiple macrophages infiltrating in the glioma TME, which could prevent the immune system from eliminating malignant cells effectively (25). Thus, a deepening understanding of the interplay between TME and immunotherapy not only helps to explore the mechanism of immune escape, but also provides new approaches to improve the immunotherapeutic efficacy.
In this study, we observed for the first time that EVA1C was significantly overexpressed in glioma, and significantly correlated with malignant clinicopathological features. In this study, EVA1C high expression might be a potential poor prognostic factor. KEGG and GO enrichment analyses showed that EVA1C expression correlated with immune and inflammation related biological processes.
In mammals, the EVA1 family mainly includes three members: EVA1A, EVA1B and EVA1C. Previous studies showed that EVA1A (TMEM166) protein which was located in cell membrane could induce cell autophagy and apoptosis (26, 27). Ming Tao et al. found that, compared with normal pancreatic acinar cells, the EVA1C expression was remarkably higher in pancreatic acinar carcinoma, and it was mainly located in cell membrane and cytoplasm (28). Interestingly, Ziyi Wang et al. reported that EVA1A could inhibit NLRP3 activation to reduce liver hypoxia-reperfusion damage via inducing autophagy in Kupffer cells (29). On the other hand, Bang-Yi Lin et al. found that EVA1A promoted papillary thyroid cancer progression and EMT by the Hippo signaling pathway (30). As a core kinase of the Hippo signaling pathway in cancers, MST1/2 participates in the development and function of Treg and Th17 cells (31). The imbalance of these two cell types is a leading cause of multiple inflammatory and autoimmune diseases (32). The EVA1C is mainly mapped to critical region chromosome 21 (21q21-21q22.3) associated with Down syndrome. Intriguingly, Gregory James et al. found that the expression pattern of EVA1C was consistent with an axon guidance role in the mouse nervous system (33). However, what is the role of EVA1C plays in glioma is not reported. This is a subject that needs to be further explored.
A key finding in our study is that high EVA1C expression correlates with the high abundance of immune infiltrates including B cells, CD4+ T cells, neutrophils, macrophages and DCs in WHO grade II/III glioma. There is no statistical correlation between EVA1C and CD8+ T cell infiltration level in CGGA cohort. The possible reason is low statistical power due to small sample size, which need to further explore. Significant correlations between the EVA1C and the markers of TAMs as well as M2 macrophages suggest that EVA1C possesses the potential in regulating the polarization of TAMs, which is crucial for cancer development and metastasis (34). Adam Wu et al. found that cancer stem cells promote immunosuppression by M2 macrophages secreting many kinds of cytokines, such as TGF-β1 and IL-10 (35). IL-10 and TGF- β 1 has been shown to promote tumor cell immune escape by inhibiting T cell proliferation (36). Another intriguing finding in our study is the relationship between EVA1C and immune markers of DCs, Treg cells, and exhausted T cells. DCs can induce tumor cell metastasis by favoring Treg cells and reducing CD8+ T cell cytotoxicity (37). Additionally, TGF-β secreted by M2 macrophages could induce the shift from immature CD4+ T cells to Treg cells, and promote the proliferation of them (38). These outcomes reveal that EVA1C protein may increase the recruitment of immune cells in WHO grade II/III glioma. Notably, the predictive performance of EVA1C in predicting high immune infiltration levels was excellent, demonstrating its potential in predicting immune profiles in WHO II/III glioma. However, it is still unclear whether the expression of EVA1C is related to the efficacy of immunotherapy and chemotherapy for glioma, and there is no data in this regard at present.
Although we revealed an immune-related biomarker and target for the first time in the patients with glioma, this study has some limitations. Firstly, the aim of this study was to elaborate the findings from the perspective of genomics, and the analysis of gene transcription levels could only reflect some aspects of immune status, but not the overall changes. In this study, Estimate and Timer algorithms were adopted, and conventional statistical methods were used for analysis. Secondly, although the above results could be validated in TCGA cohort with 457 patients, they need to be verified by another retrospective single-center cohort. Thirdly, the functions and in-depth mechanisms of EVA1C were explored in vitro. This study is only an exploratory discovery, and lays a foundation for our next functional mechanism experiments.
In summary, we found that EVA1C expression was upregulated in glioma compared with normal brain tissues, and the elevated expression level was significantly associated with malignant features and poor prognosis of glioma patients. Importantly, high EVA1C expression correlated with high immune infiltration levels and chemokines, interleukins, interferons and their receptors in WHO grade II/III glioma. In addition, EVA1C expression was significantly correlated with gene expression of M2 macrophages, TAMs, DCs, exhausted T cells and Treg cells markers. These findings suggest that EVA1C may be not only a potential immune-related biomarker, but also a key modulator in governing tumor microenvironment.
Data Availability Statement
Publicly available datasets were analyzed in this study. This data can be found here: Chinese Glioma Genome Atlas (CGGA, http://www.cgga.org.cn/) and The Cancer Genome Atlas (TCGA, https://tcga-data.nci.nih.gov/tcga/) databases.
Ethics Statement
The studies involving human participants were reviewed and approved by the Ethics Committee of Nanfang Hospital. The ethics committee waived the requirement of written informed consent for participation.
Author Contributions
Conception and design: SQ and ZH. Data analysis: SQ. Writing and revising: ZH. All authors contributed to the article and approved the submitted version.
Conflict of Interest
The authors declare that the research was conducted in the absence of any commercial or financial relationships that could be construed as a potential conflict of interest.
Supplementary Material
The Supplementary Material for this article can be found online at: https://www.frontiersin.org/articles/10.3389/fimmu.2021.683572/full#supplementary-material
References
1. Counsell CE, Grant R. Incidence Studies of Primary and Secondary Intracranial Tumors: A Systematic Review of Their Methodology and Results. J Neurooncol (1998) 37:241–50. doi: 10.1023/a:1005861024679
2. Global, Regional, and National Burden of Brain and Other CNS Cancer, 1990-2016: A Systematic Analysis for the Global Burden of Disease Study 2016. Lancet Neurol (2019) 18:376–93. doi: 10.1016/s1474-4422(18)30468-x
3. Binder H, Willscher E, Loeffler-Wirth H, Hopp L, Jones DTW, Pfister SM, et al. DNA Methylation, Transcriptome and Genetic Copy Number Signatures of Diffuse Cerebral WHO Grade II/III Gliomas Resolve Cancer Heterogeneity and Development. Acta Neuropathol Commun (2019) 7:59. doi: 10.1186/s40478-019-0704-8
4. Suzuki H, Aoki K, Chiba K, Sato Y, Shiozawa Y, Shiraishi Y, et al. Mutational Landscape and Clonal Architecture in Grade II and III Gliomas. Nat Genet (2015) 47:458–68. doi: 10.1038/ng.3273
5. Qu S, Li S, Hu Z. Upregulation of Piezo1 is a Novel Prognostic Indicator in Glioma Patients. Cancer Manag Res (2020) 12:3527–36. doi: 10.2147/cmar.s251776
6. Qu S, Liu S, Qiu W, Liu H, Wang J. Screening of Autophagy Genes as Prognostic Indicators for Glioma Patients. Am J Transl Res (2020) 12:5320–31.
7. Zhao Q, Yu J, Meng X. A Good Start of Immunotherapy in Esophageal Cancer. Cancer Med (2019) 8:4519–26. doi: 10.1002/cam4.2336
8. Yuan Y, Zhao Q, Zhao S, Zhang P, Zhao H, Li Z, et al. Characterization of Transcriptome Profile and Clinical Features of a Novel Immunotherapy Target CD204 in Diffuse Glioma. Cancer Med (2019) 8:3811–21. doi: 10.1002/cam4.2312
9. Sadeqi Nezhad M, Seifalian A, Bagheri N, Yaghoubi S, Karimi and M. Adbollahpour-Alitappeh MH. Chimeric Antigen Receptor Based Therapy as a Potential Approach in Autoimmune Diseases: How Close are We to the Treatment? Front Immunol (2020) 11:603237. doi: 10.3389/fimmu.2020.603237
10. Gao Q, Dong X, Xu Q, Zhu L, Wang F, Hou Y, et al. Therapeutic Potential of CRISPR/Cas9 Gene Editing in Engineered T-Cell Therapy. Cancer Med (2019) 8:4254–64. doi: 10.1002/cam4.2257
11. Eckert F, Zwirner K, Boeke S, Thorwarth D, Zips D, Huber SM. Rationale for Combining Radiotherapy and Immune Checkpoint Inhibition for Patients With Hypoxic Tumors. Front Immunol (2019) 10:407. doi: 10.3389/fimmu.2019.00407
12. Gallo M, Guarnotta V, De Cicco F, Rubino M, Faggiano and A. Colao A. Immune Checkpoint Blockade for Merkel Cell Carcinoma: Actual Findings and Unanswered Questions. J Cancer Res Clin Oncol (2019) 145:429–43. doi: 10.1007/s00432-019-02839-w
13. Wang J, Li D, Cang B, Guo H. Crosstalk Between Cancer and Immune Cells: Role of Tumor-Associated Macrophages in the Tumor Microenvironment. Cancer Med (2019) 8:4709–21. doi: 10.1002/cam4.2327
14. Reul J, Frisch J, Engeland CE, Thalheimer FB, Hartmann J, Ungerechts G, et al. Tumor-Specific Delivery of Immune Checkpoint Inhibitors by Engineered AAV Vectors. Front Oncol (2019) 9:52. doi: 10.3389/fonc.2019.00052
15. Reymond A, Friedli M, Henrichsen CN, Chapot F, Deutsch S, Ucla C, et al. From Preds and Open Reading Frames to cDNA Isolation: Revisiting the Human Chromosome 21 Transcription Map. Genomics (2001) 78:46–54. doi: 10.1006/geno.2001.6640
16. Mitsunaga K, Harada-Itadani J, Shikanai T, Tateno H, Ikehara Y, Hirabayashi J, et al. Human C21orf63 Is a Heparin-Binding Protein. J Biochem (2009) 146:369–73. doi: 10.1093/jb/mvp079
17. Kotepui M, Thawornkuno C, Chavalitshewinkoon-Petmitr P, Punyarit and S. Petmitr P. Quantitative Real-Time RT-PCR of ITGA7, SVEP1, TNS1, LPHN3, SEMA3G, KLB and MMP13 mRNA Expression in Breast Cancer. Asian Pac J Cancer Prev (2012) 13:5879–82. doi: 10.7314/apjcp.2012.13.11.5879
18. Yasinska IM, Sakhnevych SS, Pavlova L, Teo Hansen Selnø A, Teuscher Abeleira AM, Benlaouer O, et al. The Tim-3-Galectin-9 Pathway and its Regulatory Mechanisms in Human Breast Cancer. Front Immunol (2019) 10:1594. doi: 10.3389/fimmu.2019.01594
19. Kiripolsky J, Romano RA, Kasperek EM, Yu G, Kramer JM. Activation of Myd88-Dependent Tlrs Mediates Local and Systemic Inflammation in a Mouse Model of Primary Sjögren’s Syndrome. Front Immunol (2019) 10:2963. doi: 10.3389/fimmu.2019.02963
20. Everly JJ, Walsh RC, Alloway RR, Woodle ES. Proteasome Inhibition for Antibody-Mediated Rejection. Curr Opin Organ Transplant (2009) 14:662–6. doi: 10.1097/MOT.0b013e328330f304
21. Qu S, Liu J, Wang H. EVA1B to Evaluate the Tumor Immune Microenvironment and Clinical Prognosis in Glioma. Front Immunol (2021) 12:648416. doi: 10.3389/fimmu.2021.648416
22. Chen Y, Chen H, Mao B, Zhou Y, Shi X, Tang L, et al. Transcriptional Characterization of the Tumor Immune Microenvironment and Its Prognostic Value for Locally Advanced Lung Adenocarcinoma in a Chinese Population. Cancer Manag Res (2019) 11:9165–73. doi: 10.2147/cmar.s209571
23. Tian Y, Zhai X, Yan W, Zhu J, Yu H. Clinical Outcomes of Immune Checkpoint Blockades and the Underlying Immune Escape Mechanisms in Squamous and Adenocarcinoma NSCLC. Cancer Med (2021) 10:3–14. doi: 10.1002/cam4.3590
24. Raychaudhuri D, Bhattacharya R, Sinha BP, Liu CSC, Ghosh AR, Rahaman O, et al. Lactate Induces Pro-Tumor Reprogramming in Intratumoral Plasmacytoid Dendritic Cells. Front Immunol (2019) 10:1878. doi: 10.3389/fimmu.2019.01878
25. Jiang Z, Jiang JX, Zhang GX. Macrophages: A Double-Edged Sword in Experimental Autoimmune Encephalomyelitis. Immunol Lett (2014) 160:17–22. doi: 10.1016/j.imlet.2014.03.006
26. Wang L, Yu C, Lu Y, He P, Guo J, Zhang C, et al. TMEM166, a Novel Transmembrane Protein, Regulates Cell Autophagy and Apoptosis. Apoptosis (2007) 12:1489–502. doi: 10.1007/s10495-007-0073-9
27. Shen X, Kan S, Liu Z, Lu G, Zhang X, Chen Y, et al. EVA1A Inhibits GBM Cell Proliferation by Inducing Autophagy and Apoptosis. Exp Cell Res (2017) 352:130–8. doi: 10.1016/j.yexcr.2017.02.003
28. Tao M, Shi XY, Yuan CH, Hu J, Ma ZL, Jiang B, et al. Expression Profile and Potential Roles of EVA1A in Normal and Neoplastic Pancreatic Tissues. Asian Pac J Cancer Prev (2015) 16:373–6. doi: 10.7314/apjcp.2015.16.1.373
29. Wang Z, Han S, Chen X, Li X, Xia L, Pu N. Eva1a Inhibits NLRP3 Activation to Reduce Liver Ischemia-Reperfusion Injury via Inducing Autophagy in Kupffer Cells. Mol Immunol (2021) 132:82–92. doi: 10.1016/j.molimm.2021.01.028
30. Lin BY, Wen JL, Zheng C, Lin LZ, Chen CZ, Qu JM. Eva-1 Homolog a Promotes Papillary Thyroid Cancer Progression and Epithelial-Mesenchymal Transition via the Hippo Signalling Pathway. J Cell Mol Med (2020) 24:13070–80. doi: 10.1111/jcmm.15909
31. Du X, Shi H, Li J, Dong Y, Liang J, Ye J, et al. Mst1/Mst2 Regulate Development and Function of Regulatory T Cells Through Modulation of Foxo1/Foxo3 Stability in Autoimmune Disease. J Immunol (2014) 192:1525–35. doi: 10.4049/jimmunol.1301060
32. Elshal MF, Aldahlawi AM, Saadah OI, McCoy JP. Reduced Dendritic Cells Expressing CD200R1 in Children With Inflammatory Bowel Disease: Correlation With Th17 and Regulatory T Cells. Int J Mol Sci (2015) 16:28998–9010. doi: 10.3390/ijms161226143
33. James G, Foster SR, Key A, Beverdam B. The Expression Pattern of EVA1C, a Novel Slit Receptor, Is Consistent With an Axon Guidance Role in the Mouse Nervous System. PloS One (2013) 8:e74115. doi: 10.1371/journal.pone.0074115
34. Aras S, Zaidi MR. Tameless Traitors: Macrophages in Cancer Progression and Metastasis. Br J Cancer (2017) 117:1583–91. doi: 10.1038/bjc.2017.356
35. Wu A, Wei J, Kong LY, Wang Y, Priebe W, Qiao W, et al. Glioma Cancer Stem Cells Induce Immunosuppressive Macrophages/Microglia. Neuro Oncol (2010) 12:1113–25. doi: 10.1093/neuonc/noq082
36. Takahashi H, Sakakura K, Kudo T, Toyoda M, Kaira K, Oyama T, et al. Cancer-Associated Fibroblasts Promote an Immunosuppressive Microenvironment Through the Induction and Accumulation of Protumoral Macrophages. Oncotarget (2017) 8:8633–47. doi: 10.18632/oncotarget.14374
37. Sawant A, Hensel JA, Chanda D, Harris BA, Siegal GP, Maheshwari A, et al. Depletion of Plasmacytoid Dendritic Cells Inhibits Tumor Growth and Prevents Bone Metastasis of Breast Cancer Cells. J Immunol (2012) 189:4258–65. doi: 10.4049/jimmunol.1101855
Keywords: EVA1C, immune infiltration, biomarker, glioma, microenvironment
Citation: Hu Z and Qu S (2021) EVA1C Is a Potential Prognostic Biomarker and Correlated With Immune Infiltration Levels in WHO Grade II/III Glioma. Front. Immunol. 12:683572. doi: 10.3389/fimmu.2021.683572
Received: 21 March 2021; Accepted: 14 June 2021;
Published: 29 June 2021.
Edited by:
Panagiota Economopoulou, University General Hospital Attikon, GreeceReviewed by:
Ali Bettaieb, Université de Sciences Lettres de Paris, FranceXiang Li, Henan Agricultural University, China
Liang Wang, Tangdu Hospital, China
Jianpeng Li, Lanzhou University Second Hospital, China
Copyright © 2021 Hu and Qu. This is an open-access article distributed under the terms of the Creative Commons Attribution License (CC BY). The use, distribution or reproduction in other forums is permitted, provided the original author(s) and the copyright owner(s) are credited and that the original publication in this journal is cited, in accordance with accepted academic practice. No use, distribution or reproduction is permitted which does not comply with these terms.
*Correspondence: Shanqiang Qu, cXVzaHEzQDE2My5jb20=, orcid.org/0000-0002-2709-0101