 Shan Cao
 Anne Schnelzer
 Nicole Hannemann1,2
 Georg Schett
 Didier Soulat
 Aline Bozec
- 1Department of Internal Medicine 3, Rheumatology and Immunology, Universitätsklinikum Erlangen, Friedrich-Alexander-Universität (FAU) Erlangen-Nürnberg, Erlangen, Germany
- 2Institute of Regenerative Medicine and Biotherapies (IRMB), University of Montpellier, INSERM U1183, Montpellier, France
- 3Mikrobiologisches Institut – Klinische Mikrobiologie, Immunologie und Hygiene, Universitätsklinikum Erlangen, Friedrich-Alexander-Universität (FAU) Erlangen-Nürnberg, Erlangen, Germany
Sepsis is a life-threatening condition characterized by excessive inflammation in its early phase. This is followed by an aberrant resolution phase associated to a prolonged period of immune suppression that can ultimately lead to multiple organ dysfunctions. This immunosuppression can be mediated by the functional reprogramming of gene transcription in monocytes/macrophages in response to prolonged lipopolysaccharide (LPS) exposure. Surprisingly, there is no report on the role of AP-1 transcription factors in this reprogramming process. Herein, we used the endotoxin tolerance model on murine bone marrow-derived macrophages in which tolerant cells stimulated twice with LPS were compared to naïve cells stimulated once. Out of all AP-1 transcription factors tested, Fosl1 gene stood out because of its unique regulation in tolerized cells. Moreover, we could correlate FRA-1 expression to the expression of an essential anti-inflammatory molecule involved in sepsis response, Lipocalin 2 aka NGAL. Identical results were obtained in human PBMC following the endotoxin tolerance model. When using FRA-1 deficient macrophages, we could confirm that FRA-1 regulates NGAL expression during the tolerant state. Interestingly, ChIP-seq and ChIP-qPCR revealed the binding of FRA-1 on Lcn2 promoter after LPS stimulation in these cells. Finally, we used an in vivo septic model of consecutive injection of LPS, in which the second stimulation is performed before the resolution of inflammation, in wild type and FRA-1 deficient mice. NGAL secretion was elevated in lung, spleen and serum of wild type tolerant mice, whereas it was significantly lower in tolerant FRA-1 deficient mice. Moreover, an increased inflammatory state likely dependent of the low level of NGAL was observed in these FRA-1 deficient mice. This was characterized by an increase of neutrophil infiltration in lung and an increase of apoptotic follicular cells in spleen. This suggests that FRA-1 expression supports resolution of inflammation in this model. Collectively, our data indicate that FRA-1 is involved in myeloid cell tolerance responses by mediating the functional reprogramming of Lcn2 transcription in response to prolonged LPS exposure. In conclusion, FRA-1 may have a protective role in the tolerance response of sepsis through the regulation of NGAL, leading to resolution of inflammation.
Introduction
Sepsis is a life-threatening condition, which represents the leading cause of death in intensive care units (ICUs) worldwide (1). In the last decades, numerous treatments to ameliorate sepsis outcome have failed in clinical trials. There is therefore a strong need to better understand the underlying sepsis mechanism to develop new therapeutic strategies (2). Sepsis is caused by a dysregulated host response to infection that consists of two dynamic phases. The initial and uncontrolled systemic inflammatory response (SIRS) is followed by an unchecked compensatory anti-inflammatory response (CARS). This latter phase often fails to adequately resolve the systemic inflammation and predisposes to immune dysfunction. The failure of resolution process can lead to collateral tissue destruction and multiple organ dysfunction often lethal (3).
The most prominent feature of sepsis-induced immunosuppression is the diminished capacity of innate immune cells, especially monocytes and macrophages, to release pro-inflammatory cytokines in response to pathogen associated molecular patterns (PAMP) (3). Ultimately, these deactivated macrophages adopt an immunosuppressive phenotype making them unresponsive to secondary infections, but prone to resolve inflammation and regenerate tissue. In the case of sepsis, this tolerization process can be studied in the context of endotoxin tolerance induced by consecutive LPS stimulations (4).
Two classes of genes have been categorized in tolerant macrophages in previous studies: genes not inducible described as ‘tolerizable’ genes and genes still inducible named ‘non-tolerizable’ genes (5). Interleukin-6 (Il6), known as a classical pro-inflammatory cytokine in sepsis, is a typical tolerizable gene. Despite being a TLR inducible gene, the induction of IL-6 expression by macrophages was abolished after a second LPS stimulation. On the other side, non-tolerizable genes such as lipocalin-2 (Lcn2) were found to be significantly elevated in tolerant macrophages (5). Also known as neutrophil gelatinase-associated lipocalin, NGAL is a mammalian protein expressed by myeloid and epithelial cells in response to TLR activation during infections. NGAL plays an anti-microbial role by inhibiting bacterial siderophores and therefore depriving bacteria of iron (6). In parallel to this anti-microbial function, NGAL expression is also important for the immune response. In a LPS-induced sepsis model, Lcn2 knockout mice showed a dysregulated iron metabolism that resulted in an increased apoptosis of leukocytes, an increased release of pro-inflammatory cytokines and a higher mortality (7). Similarly, NGAL has been shown to induce the production of the anti-inflammatory cytokine IL-10 in macrophages during Streptococcus pneumoniae infection, making NGAL not only a marker of macrophages deactivation but also a deactivator of macrophages (8). Interestingly, a feed forward regulation between IL-10 and NGAL has been suggested in another sepsis model, in which NGAL expression correlates with IL-10 level and a better outcome after polymicrobial sepsis (9). Collectively, these researches imply that NGAL plays a role in controlling inflammation and thereby contributes to the resolution of severe inflammation (7). However, its transcriptional regulation, especially in the tolerant cells remains to be defined since regulating the expression of NGAL may provide novel therapy for the resolution of sepsis.
Recent investigations have focused on the mechanisms underlying the functional reprogramming of the gene transcription in macrophages in response to prolonged LPS exposure. Up-regulation of hypoxia-inducible factor-α (HIF-1α) and subsequent elevation of the negative regulator of TLR signaling IRAKM have been involved in the establishment of an endotoxin-tolerant state in monocytes which interestingly possess anti-bacterial and wound-healing properties (10). At the transcriptional level, the cyclin-dependent kinase inhibitor p21 has been shown to tune NF-κB pathway that controls part of the macrophages reprogramming happening during endotoxin tolerance. A high level of p21 favors p50-p50 over p65-p50 for binding to NF-κB sites on DNA, resulting in lower IFN-β production and a hypo-responsive phenotype of macrophage (11). Surprisingly, no data has been reported on the role of AP-1 transcription factors in this reprogramming process. AP-1 family is mainly composed of c-Fos and c-Jun related transcription factors. Depending on stimuli and cell type, they can be activated by phosphorylation or methylation, promptly assembled into homodimers or heterodimers through their leucine-zipper domain and bound to AP-1 sites on target gene promoter, resulting in the promotion or inhibition of gene expression (12).
In the present work, we studied AP-1 transcription factors role using the endotoxin tolerance model in both murine bone marrow-derived macrophages (BMDM) and human peripheral blood mononuclear cell (PBMC). We found that the expression of FRA-1 and NGAL were positively correlated in response to LPS, both in tolerant murine and human cells in vitro. With the help of FRA-1 deficient BMDM, we showed that FRA-1 positively regulates NGAL expression especially in the tolerant state. Using ChIP-seq and ChIP-qPCR, FRA-1 was shown to bind Lcn2 promoter, especially in the tolerant state. Finally, in vivo septic model using consecutive injection of LPS showed a decreased resolution as well as an increased inflammation in FRA-1 depleted conditions, likely dependent on the low level of NGAL in these mice. Collectively, our results indicate that FRA-1 transcription factor is involved in myeloid cell tolerant responses by mediating the functional reprogramming of Lcn2 transcription in response to prolonged LPS exposure.
Methods and Materials
Animals
Wild type C57Bl/6NCrl mice were purchased from Charles River. The generation of Fosl1 floxed and Mx-Cre mice has been described before (13). Briefly, the Fosl1 gene knockout in Fosl1∆Mx mice was induced 2 weeks before the experiment by 3 consecutive injections of 250 μg poly(I:C) per mouse every other day. Littermate Fosl1fl/fl mice were used as controls and were treated with poly (I:C) like the deficient mice. Mice were bred and maintained on a 129/B6 mixed background. All experiments were performed with 8-12-week-old mice (both male and female). Animals were kept under standardized conditions. A 12-hour light/12-hour dark cycle was maintained, and standard diet and water were provided ad libitum. All animal experiments were discussed and approved by the University of Friedrich-Alexander-Universität Erlangen-Nürnberg ethics committee and carried out in accordance with protocols approved by the German law.
Cell Preparation
Bone marrow-derived macrophages (BMDM) were generated from total bone marrow cells flushed out from 8-12 weeks old mice. The total bone marrow cells were then incubated within 10 cm petri dishes in 5% CO2 at 37°C in DMEM and GlutaMAX (Gibco, Thermo Fisher Scientific) supplemented with 10% (v/v) FCS (Gibco, Thermo Fisher Scientific), 1% (v/v) penicillin/streptomycin (Gibco, Thermo Fisher Scientific), and 20% (v/v) supernatant from L929 fibroblast cultures [ATCC clone CCL-1] as a source of macrophage colony-stimulating factor (M-CSF) (14). After overnight incubation, the non-adherent cells were then harvested and reseeded into 10 cm petri dishes supplemented with the medium above at the concentration of 5x10⁶ cells/dish. 7 days later, BMDM were carefully harvested, counted and replated into 12-well plates at the concentration of 1x10⁶ cells/well in RPMI-1640 (Gibco, Thermo Fisher Scientific) supplemented with 10% (v/v) FCS (Gibco, Thermo Fisher Scientific) and 1% (v/v) penicillin/streptomycin (Gibco, Thermo Fisher Scientific). After overnight incubation, the adherent cells were stimulated with 10 ng/mL LPS (Naïve) or stimulated with 100 ng/mL LPS for 24 h, washed twice with warm PBS and stimulated again with 10 ng/mL LPS (Tolerant) as described in previous study (5).
Human peripheral blood mononuclear cells (PBMCs) were isolated from EDTA-blood of normal, healthy donors, using a Ficoll gradient (Lymphoflot, Bio-Rad). PBMCs were then incubated overnight in RPMI-1640 (Gibco, Thermo Fisher Scientific) supplemented with 10% (v/v) FCS (Gibco, Thermo Fisher Scientific) and 1% (v/v) penicillin/streptomycin (Gibco, Thermo Fisher Scientific) and adherent cells were stimulated with once or twice LPS as described above.
Isolation of CD11b+ Cells
The single cell suspensions from the organs were created by using gentleMACS dissociation tubes (Miltenyi Biotec). CD11b+ cells were then isolated via CD11b microbeads (Miltenyi Biotec) under the manufacturer’s instructions.
Real-Time PCR Analysis
A standard phenol-chloroform extraction was performed with Trizol reagent to isolate total RNA from cells. cDNA was synthesized from 1 μg of total RNA with a High-Capacity cDNA Reverse Transcription Kit (ThermoFisher). Real-time PCR analysis was then performed and analysed with a SYBR label (SYBR Select Mastermix, Applied Biosystems) in QuantStudio™ 6 Flex Real-Time PCR System. The real-time PCR primer sequences are listed in Supplementary Table 1. The relative expression of the gene of interest (GOI) was calculated with the ΔΔCt method using β-actin (Actb) expression as normalizer (norm) and the not-stimulated naïve control as calibrator: relative expression = 2-ΔΔCt where ΔΔCt = (CtGOI - Ctnorm)unknown - (CtGOI - Ctnorm)calibrator.
ELISA
The IL-6 and NGAL concentrations in the relevant supernatant or serum were quantified with the Mouse IL-6 DuoSet ELISA Kit and Mouse Lcn2 DuoSet ELISA Kit following the manufacturer’s instructions (R&D Systems).
Western Blot Analysis
Proteins from BMDM stimulated once or twice with LPS were collected at 0, 0.5, 1, 2 or 4 h with RIPA buffer supplied with protease inhibitors (Roche, cOmplete™ ULTRA Tablets, 05892970001). The protein extracts were then separated by SDS-PAGE electrophoresis and semi-dry transferred to a PVDF membrane. The membrane was incubated with antibodies against FRA-1 (sc-605, Santa-Cruz, 1: 200) and GAPDH (#2118, Cell Signalling, 1:1000) overnight at 4°C.
Chromatin Immunoprecipitation-seq and ChIP-qPCR
The ChIP-seq results have been deposited online in the GEO datatabase (GSE178865) along with our previous publication (13). The raw ChIP-seq data were re-analyzed with GALAXY (15) to explore the binding of FRA-1 on the promoter sites of Il6 and Lcn2, with or without stimulation with LPS. In brief, the data sets were firstly trimmed by Trimmomatic to remove adapters and trim reads to improve the overall quality. The sequenced reads were mapped using Bowtie2. The peak-calling step was then performed by MACS2 to identify significantly enriched loci in the genome. Finally, the output files were visualized with the help of Integrated Genome Browser (16).
For further promoter analysis, the 4.000 bp nucleotide sequences upstream of the transcription start sequence (TSS) of Il6 and Lcn2 genes were identified thanks to the NCBI Gene database. The putative AP-1 binding sites on Il6 and Lcn2 promoters were predicted via an online tool TFBIND (17) and relative primers to detect each site were designed accordingly.
ChIP-qPCR on peritoneal macrophages and BMDM was performed with the ChIP-IT High Sensitivity® (HS) Kit (Active Motif) following the manufacturer’s instructions. Briefly, thioglycollate-elicited macrophages were generated by injecting mice i.p. with 2.5 mL of 4% (w/v) Brewer’s thioglycolate medium (Sigma-Aldrich). FRA-1 deficient mice and littermates were sacrificed 72 hours after injection. Peritoneal cavity cells were harvested by lavage, and cells were washed and plated in RPMI-1640 (Gibco, Thermo Fisher Scientific) supplemented with 10% (v/v) FCS (Gibco, Thermo Fisher Scientific) and 1% (v/v) penicillin/streptomycin (Gibco, Thermo Fisher Scientific). BMDM were prepared as described above (Cell Preparation). After overnight incubation, adherent cells were stimulated with 10 ng/mL LPS for 1h (Naïve) or stimulated with 100 ng/mL LPS for 24 h, washed twice with warm PBS and stimulated again with 10 ng/mL LPS for 1h (Tolerant). The cells were fixed with 1% formaldehyde for 15 min to cross-link the proteins to the DNA and then washed for 3 times. The pellet was re-suspended in ChIP lysis buffer and lysate was sonicated to shear DNA to an average fragment size of 200–1000 bp. 30 µg chromatins were incubated with antibodies against FRA-1 (sc-605 from Santa-Cruz for peritoneal macrophages, since the production of this antibody has been discontinued by the company, we used PA5-81175 from Invitrogen for BMDM, 5µg/sample) or Normal Rabbit IgG (#2729, Cell Signalling, 5µg/sample) overnight at 4°C. On the second day, samples were incubated with protein A/G beads for 3 hours. DNA was then eluted, de-crosslinked overnight and purified. 25 µl starting chromatins without incubation with antibodies were also de-crosslinked and purified, named as Input. The enrichment of each binding site was evaluated by ChIP-qPCR. The data was normalized and calculated with Percent Input Method: Adjust Input=CtInput-log2(VChromatin/VInput), V means volume. % Input= 100*2(Adjusted Input - Ct Chromatin). The ChIP-qPCR primer sequences are listed in Supplementary Table 1.
In Vivo Endotoxin Tolerance Model
The in vivo endotoxin tolerance model was established by consecutive i.p. injection of LPS. Briefly, mice were rendered tolerant to LPS by an initial injection of 25 µg of LPS and stimulated 3 days later with another similar dose of LPS for 2 h. The naïve group injected only once with LPS and sacrificed 2h after (Figure 5A). PBS-injected mice served as control.
Histological Analysis
Mice were sacrificed with CO2 at indicated time point under respective treatment. The organs were then harvested and fixed in 4% formaldehyde for 12 h. Then, the samples were embedded in paraffin, cut to 1 μm thickness and mounted onto glass slides. For HE staining, the slides were stained with Hematoxylin and Eosin as common procedure. To quantify the LPS-induced changes in the spleen, the follicular areas were measured with ImageJ in 4-fold magnified images. For the evaluation of pulmonary inflammation in response to LPS, the categories “cellular infiltration” and “alveolar wall thickening” were used as described in previous study (18). Briefly, for cellular infiltration, 0 means no immune cell infiltration, 1 means moderate infiltration and 2 means massive infiltration. For alveolar wall thickening, 0 is normal, 1 represents thickening fewer than 50% while 2 is over 50%. Four representative images in 20-fold magnification per slide were analyzed and the respective values for each sample were summed up and then compared among diverse treatments.
TUNEL Staining
TUNEL staining of the spleen slides were performed with the In Situ Cell Death Detection-Kit (POD) following the manufacturer’s instructions. Four representative images in 20-fold magnification per slide were analyzed and the apoptotic splenocytes within the follicular area were counted and compared among diverse treatments.
Data Analysis
GraphPad Prism version 8.0 (GraphPad Software, San Diego, CA) was used for statistical treatment. Experimental data was shown as mean ± s.e.m. Two-tailed unpaired student’s t-test for two groups or ANOVA with multiple comparisons test were used as indicated in respective experiments. For kinetic expression of genes and proteins, repeated measures two-way ANOVA (two-way RM ANOVA) was used in which the time factors are matched, to account for the nestedness of the data.
Results
Fosl1 Expression Is Altered After Induction of Endotoxin Tolerance in Murine Macrophages
To evaluate the AP-1 expression within the two phases of sepsis, we first set up the endotoxin tolerance model in wild type murine bone marrow-derived macrophages (BMDM) by consecutive stimulation of LPS (Figure 1A) (5). The adherent BMDM were stimulated with 10 ng/mL LPS (Naïve) or stimulated with 100 ng/mL LPS for 24 h, washed twice with warm PBS and stimulated again with 10 ng/ml LPS (Tolerant). The cells were then harvested at 0, 0.5, 1, 2 or 4 h after the stimulation. The validity of our experimental model was confirmed by analyzing the kinetic expression of genes previously known as tolerizable or non-tolerizable (5) at the indicated time point in naïve and tolerant macrophages. The tolerizable genes (Il6, Il12b and Mmp13) were significantly up-regulated in the naïve cells, while significantly diminished in the tolerant cells compared to the naïve one. Meanwhile, the non-tolerizable genes (Saa3, Lcn2) were only weakly induced by LPS in naïve cells but showed a strong and sustained expression in stimulated tolerant cells (Figure 1B). The analysis of the protein secretion for IL-6 and NGAL (neutrophil gelatinase-associated lipocalin, protein name of Lcn2) in the supernatant of murine BMDM further confirmed the mRNA results (Figure 1C). IL-6 cytokine levels in the supernatant were significantly elevated after the first LPS stimulation, and abolished after the second stimulation, while the NGAL protein expression was still increased in the tolerant state. After this confirmation, we studied the expression kinetic of AP-1 transcription factor genes in murine BMDM in both naïve and tolerant state. The expression of Fosl2, Fos, Fosb, Junb and Jun peaked shortly (0.5-1h) after LPS stimulation in naïve cells, whereas the induction of these genes was strongly diminished in tolerant cells (Figure 1D). In this homogenous family picture, two AP-1 members stood out: Jund was unresponsive to LPS stimulation and was therefore not considered further, whereas Fosl1 response was more interesting. In naïve cells, Fosl1 responded alike the other AP-1 transcription factors. However, in tolerant cells, Fosl1 did not show the small expression peak observed for the other AP-1 members but an initial level of expression dramatically reduced (6% of the unstimulated naïve cells) that slowly and steadily increased after LPS re-stimulation. Therefore, our results in wild type BMDM suggested that the induction of AP-1 gene expression by LPS stimulation in naïve cells was strongly reduced in tolerant cells, and Fra-1 expression seemed unique compared to the other members.
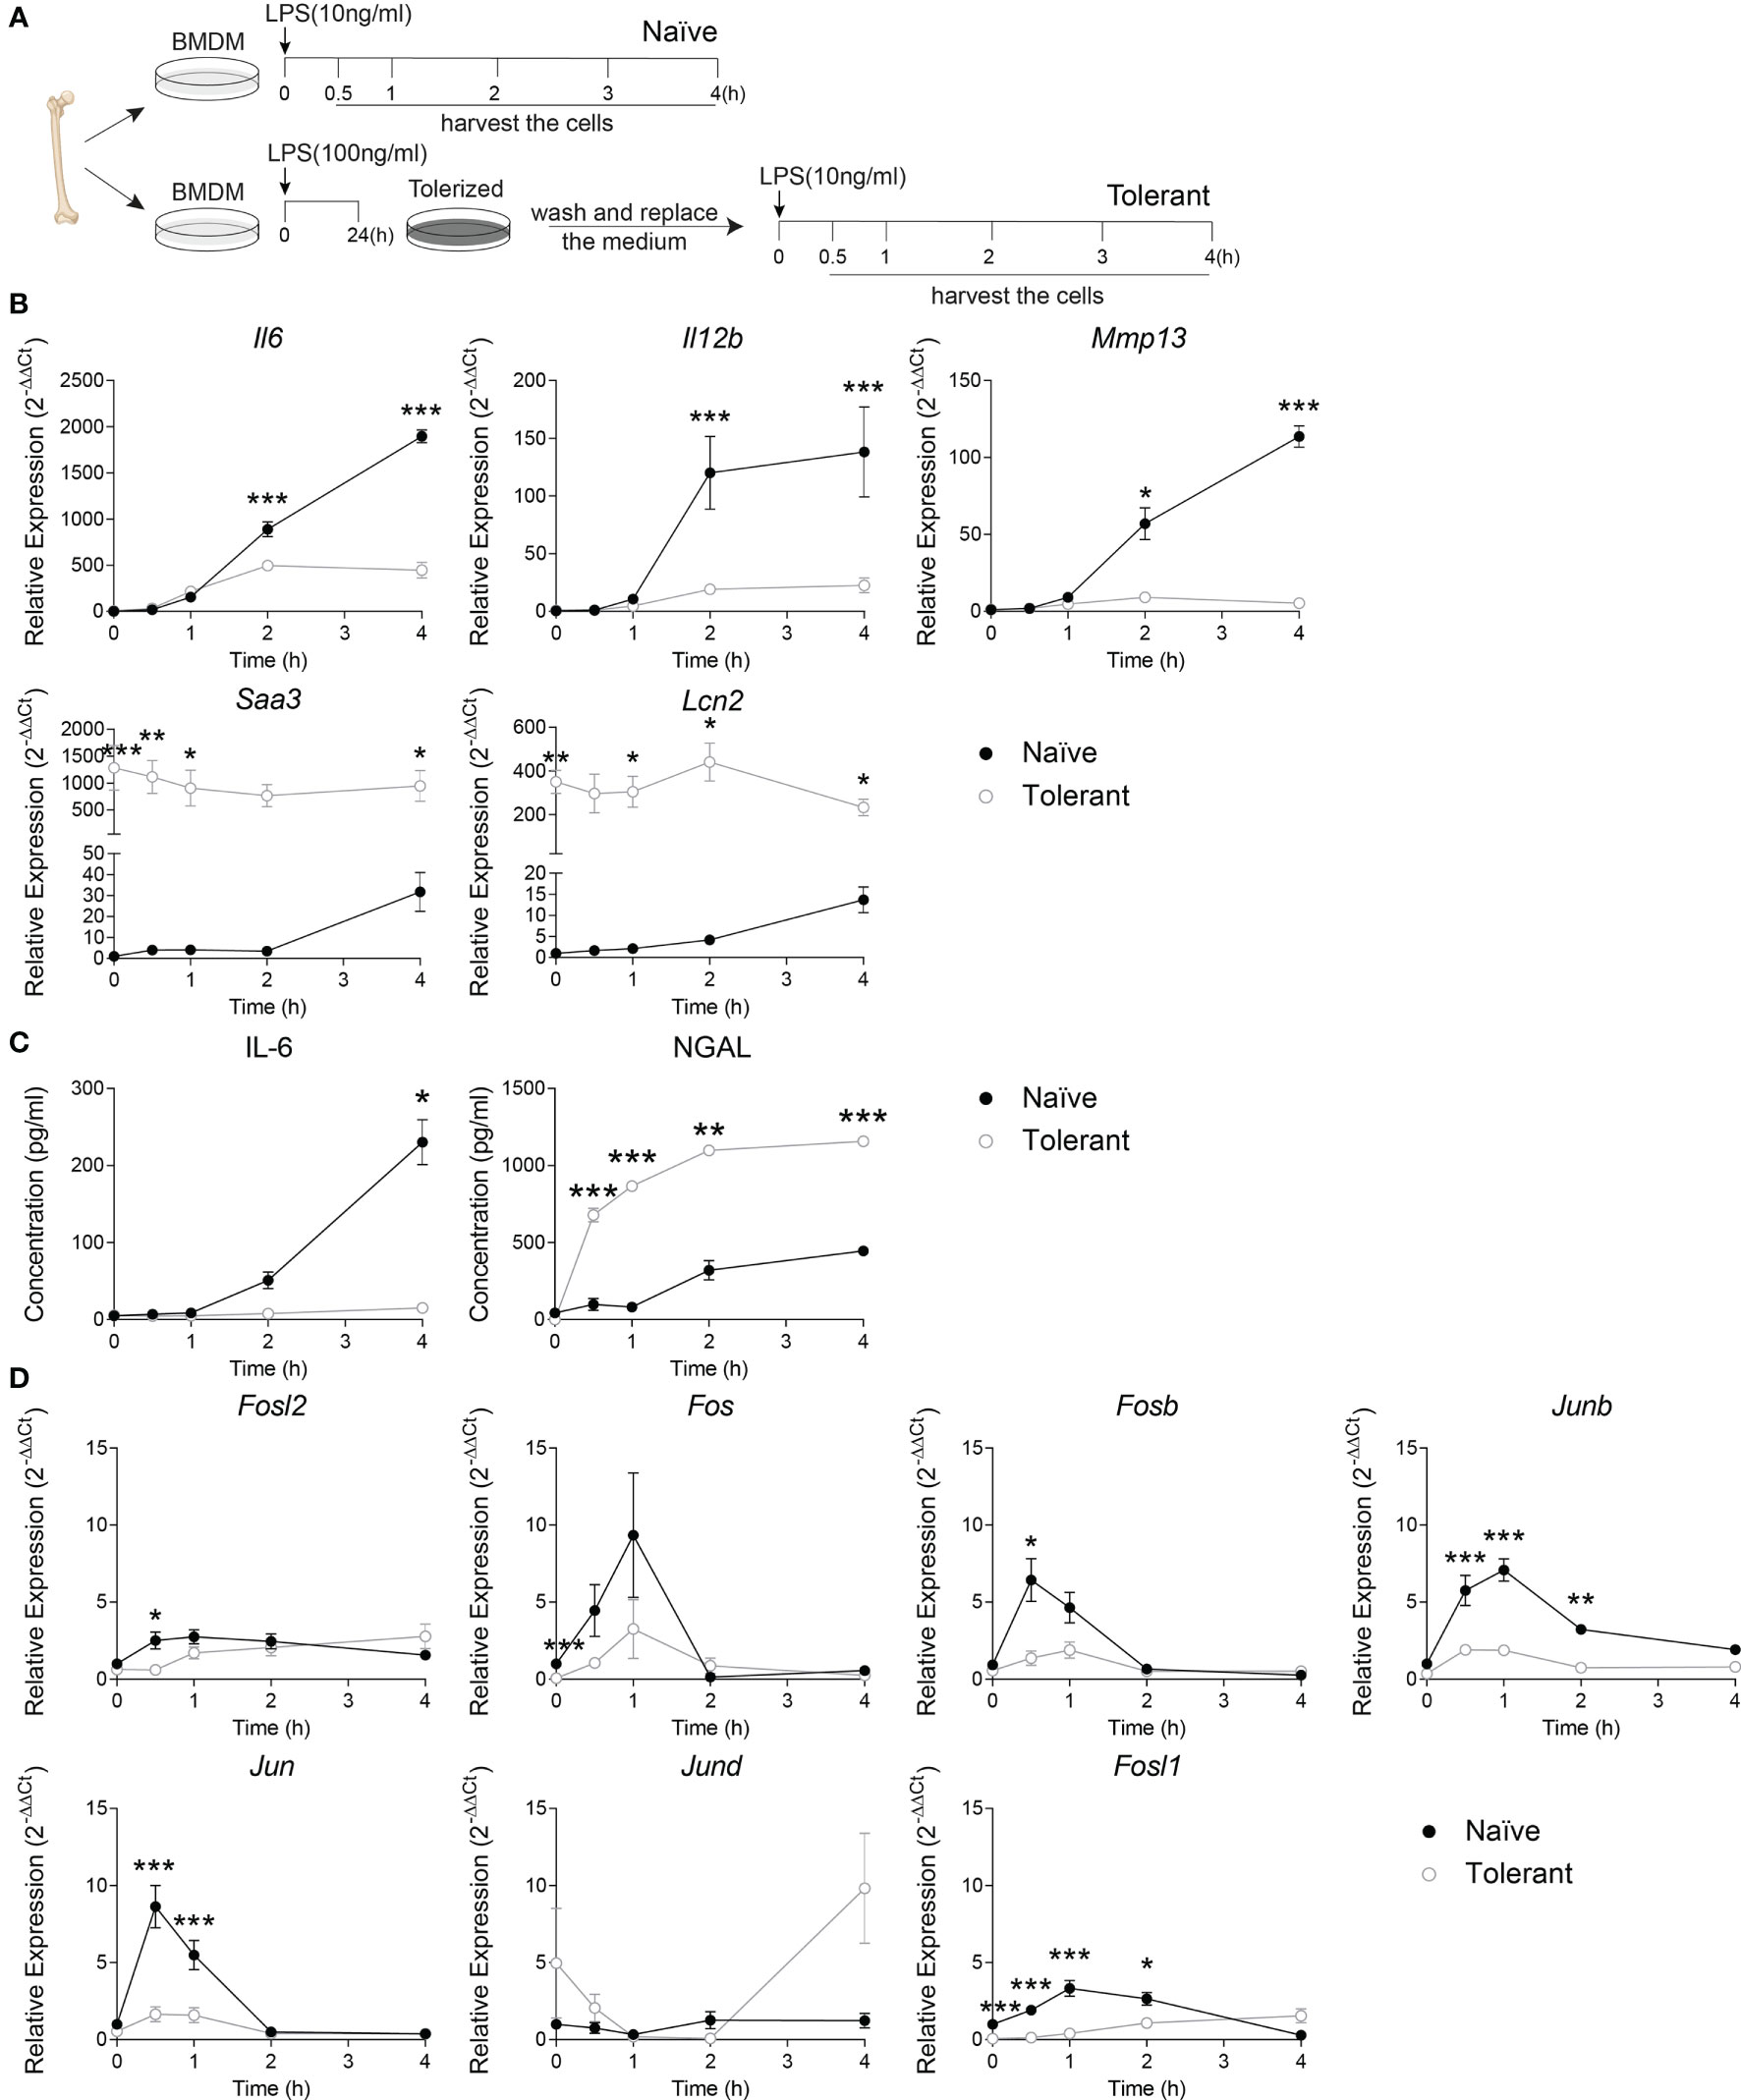
Figure 1 Fosl1 expression is altered after induction of endotoxin tolerance in murine macrophages. (A) Experimental scheme of the induction of endotoxin tolerance in wild type murine BMDM. A kinetic analysis of genes and proteins expression was performed at the indicated time point in macrophages harvested following one (Naïve) or two (Tolerant) LPS stimulations. (B) Quantitative RT-PCR analysis of the expression of tolerizable genes (Il6, Il12b Mmp13) and non-tolerizable genes (Saa3, Lcn2), normalized to the expression of Actb. (C) Quantification of IL-6 and NGAL protein secretion in cell culture supernatant. (D) Quantitative RT-PCR analysis of AP-1 transcription factor genes, normalized to the expression of Actb. Data are shown as mean ± s.e.m. *p < 0.05; **p < 0.01; ***p < 0.001 by two-way RM ANOVA with Tukey’s multiple comparisons test. The data shown are from one experiment representative of three independent biological replicates.
Fosl1 Expression Is Altered After Induction of Endotoxin Tolerance in PBMC
To verify whether our findings on AP-1 response in tolerant state can be transposed in human, the endotoxin tolerance was studied in isolated human PBMC (Figure 2A). Alike in murine cells, the tolerizable genes (TNF, IL6) were up-regulated by LPS stimulation in naïve cells, but could not be induced similarly in the tolerant cells. As expected, the expression of LCN2 was higher in the tolerant state compared to the naïve one (Figure 2B). These data demonstrate a response of human PBMC to endotoxin tolerance consistent with the one observed in mouse macrophages. Next, AP-1 gene transcriptions were analyzed. Alike in mouse cells, the peak expression of FOS, JUNB and JUN observed in naïve cells after 0.5-1 h of LPS stimulation diminished in stimulated tolerant cells. Here again, FOSL1 expression was initially strongly decreased in tolerant cells and could be gradually increased up to 8-fold (1.21/0.15) by LPS stimulation (Figure 2C). Despite that this pattern was reproduced by other AP-1 transcription factors gene like JUNB (4.6-fold, 1.94/0.43) and JUN (2.7-fold, 0.90/0.33), FOSL1 was the most LPS responsive AP-1 gene. Therefore, these results established that the data obtained with the mouse macrophages can be confidently transposed to human PBMC.
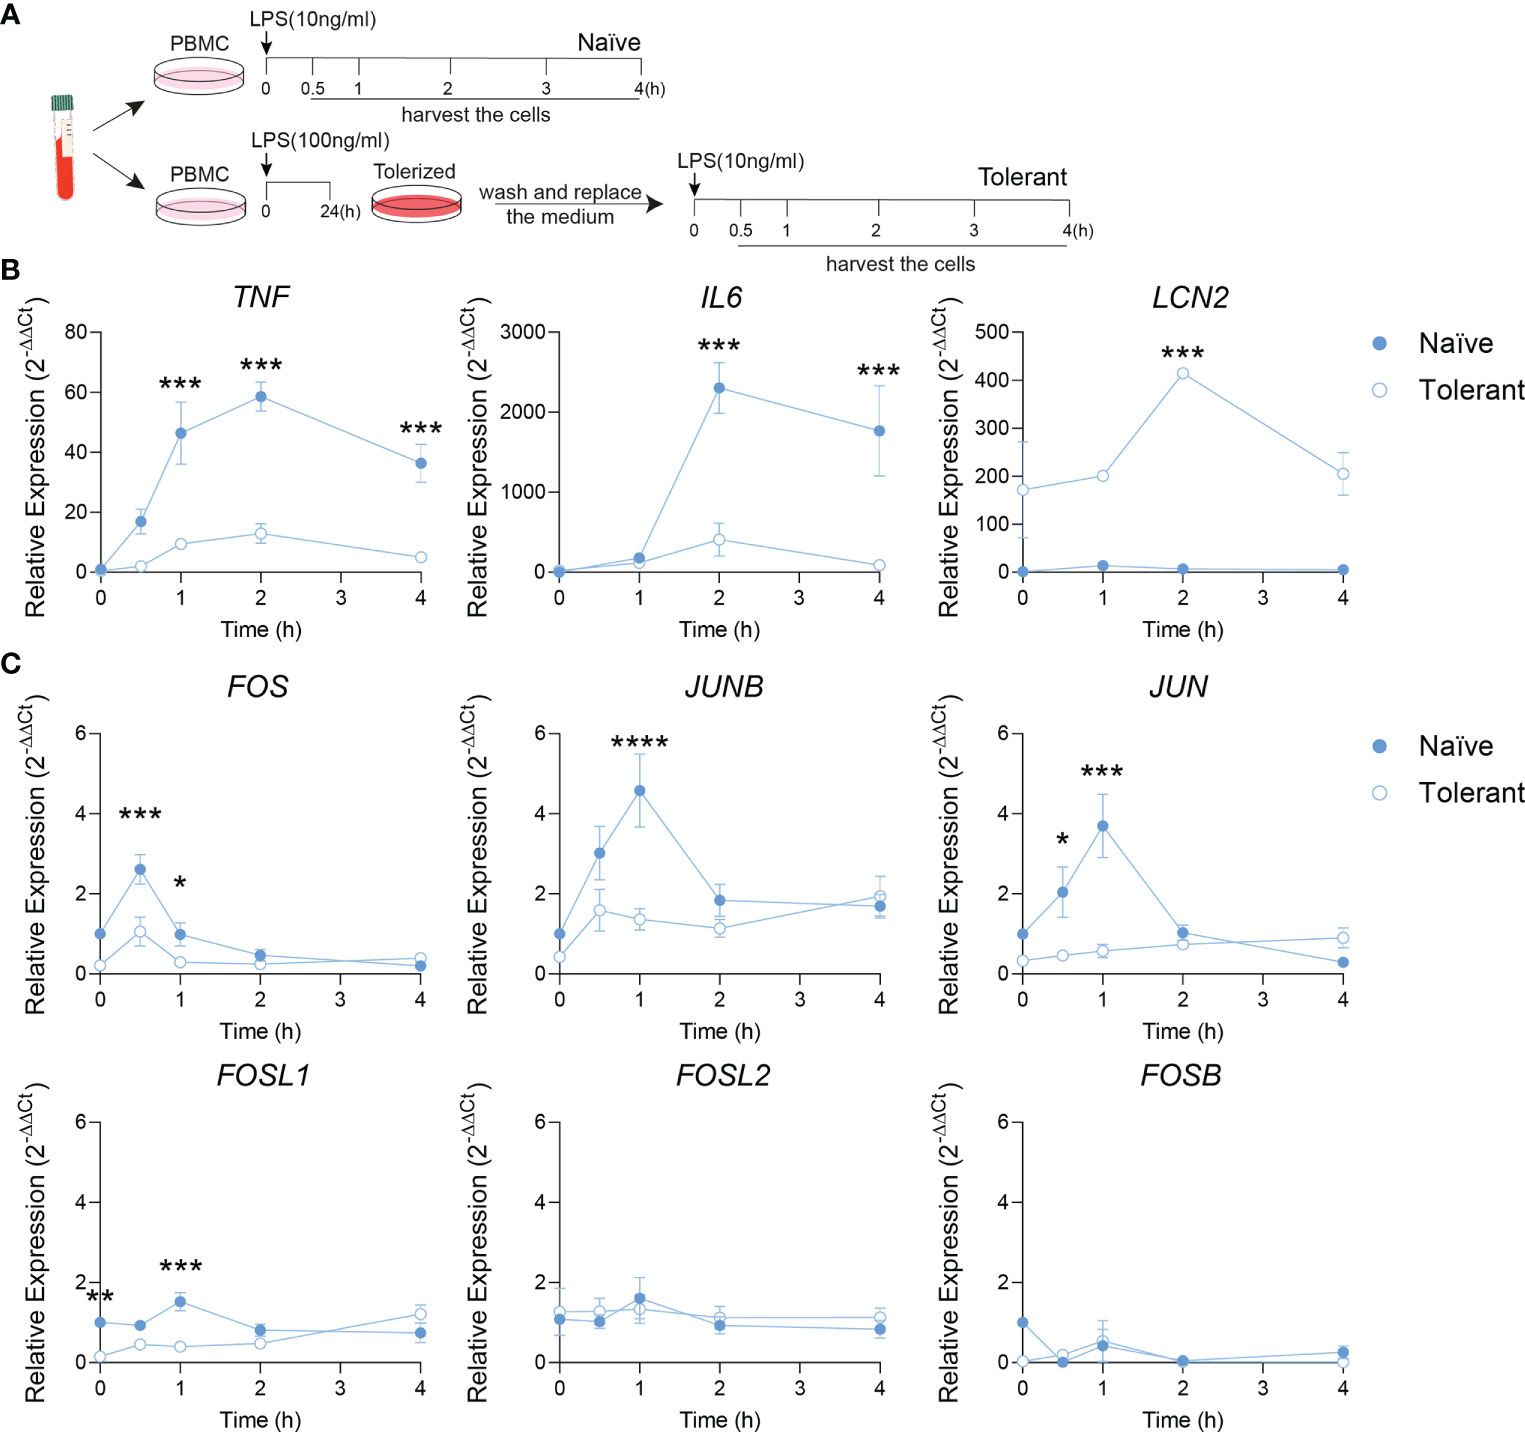
Figure 2 Fosl1 expression is altered after induction of endotoxin tolerance in human peripheral blood mononuclear cells. (A) Experimental scheme of the induction of endotoxin tolerance response in human PBMC. A kinetic analyses of gene expression was performed at the indicated time point in PBMC harvested following one (Naïve) or two (Tolerant) LPS stimulations. (B) Quantitative RT-PCR analysis of tolerizable genes (TNF, IL6) and non-tolerizable genes (LCN2), normalized to the expression of Actb. (C) Quantitative RT-PCR analysis of AP-1 transcription factor genes, normalized to the expression of Actb. Data are shown as mean ± s.e.m. *p < 0.05; **p < 0.01; ***p < 0.001; ****p < 0.0001 by two-way RM ANOVA with Tukey’s multiple comparisons test. The data shown are from one experiment representative of three independent biological replicates.
Increased Expression of NGAL in Tolerant Macrophages Depends on FRA-1 Expression
Considering the significantly different expression of Fosl1 in naïve and tolerant state in both murine and human phagocytes, we speculated that FRA-1 could play an important role in regulating the tolerance induced transcriptional reprogramming. To evaluate how FRA-1 influenced the inflammatory response in endotoxin tolerance, inducible FRA-1 deficient mice were generated by crossing Fosl1 lox mice to Mx-Cre mice. After the induction of FRA-1 deficiency by consecutive poly (I: C) injection, BMDM were isolated from the FRA-1 deficient mice and their littermates to study their response to the endotoxin tolerance model in vitro. After LPS stimulation, naïve macrophages from littermates induced Fosl1 expression following a similar pattern as wild type macrophages but to a higher extent. This slightly increased Fosl1 expression might be due to the heterogeneity of their genetic background. The up-regulation of Fosl1 by LPS was abolished in the naïve and tolerant FRA-1 deficient BMDM (Figure 3A). The mRNA expression profiles of other AP-1 members such as Fosb, Junb and Jun were not significantly altered by the absence of Fosl1 and responded similarly to the LPS stimulation (Figure 3A). This transcriptional data could be correlated at the translational level: FRA-1 expression after LPS stimulation is reduced in wild type cells after tolerance induction and is strongly diminished in FRA-1 deficient cells (Figure 3B).
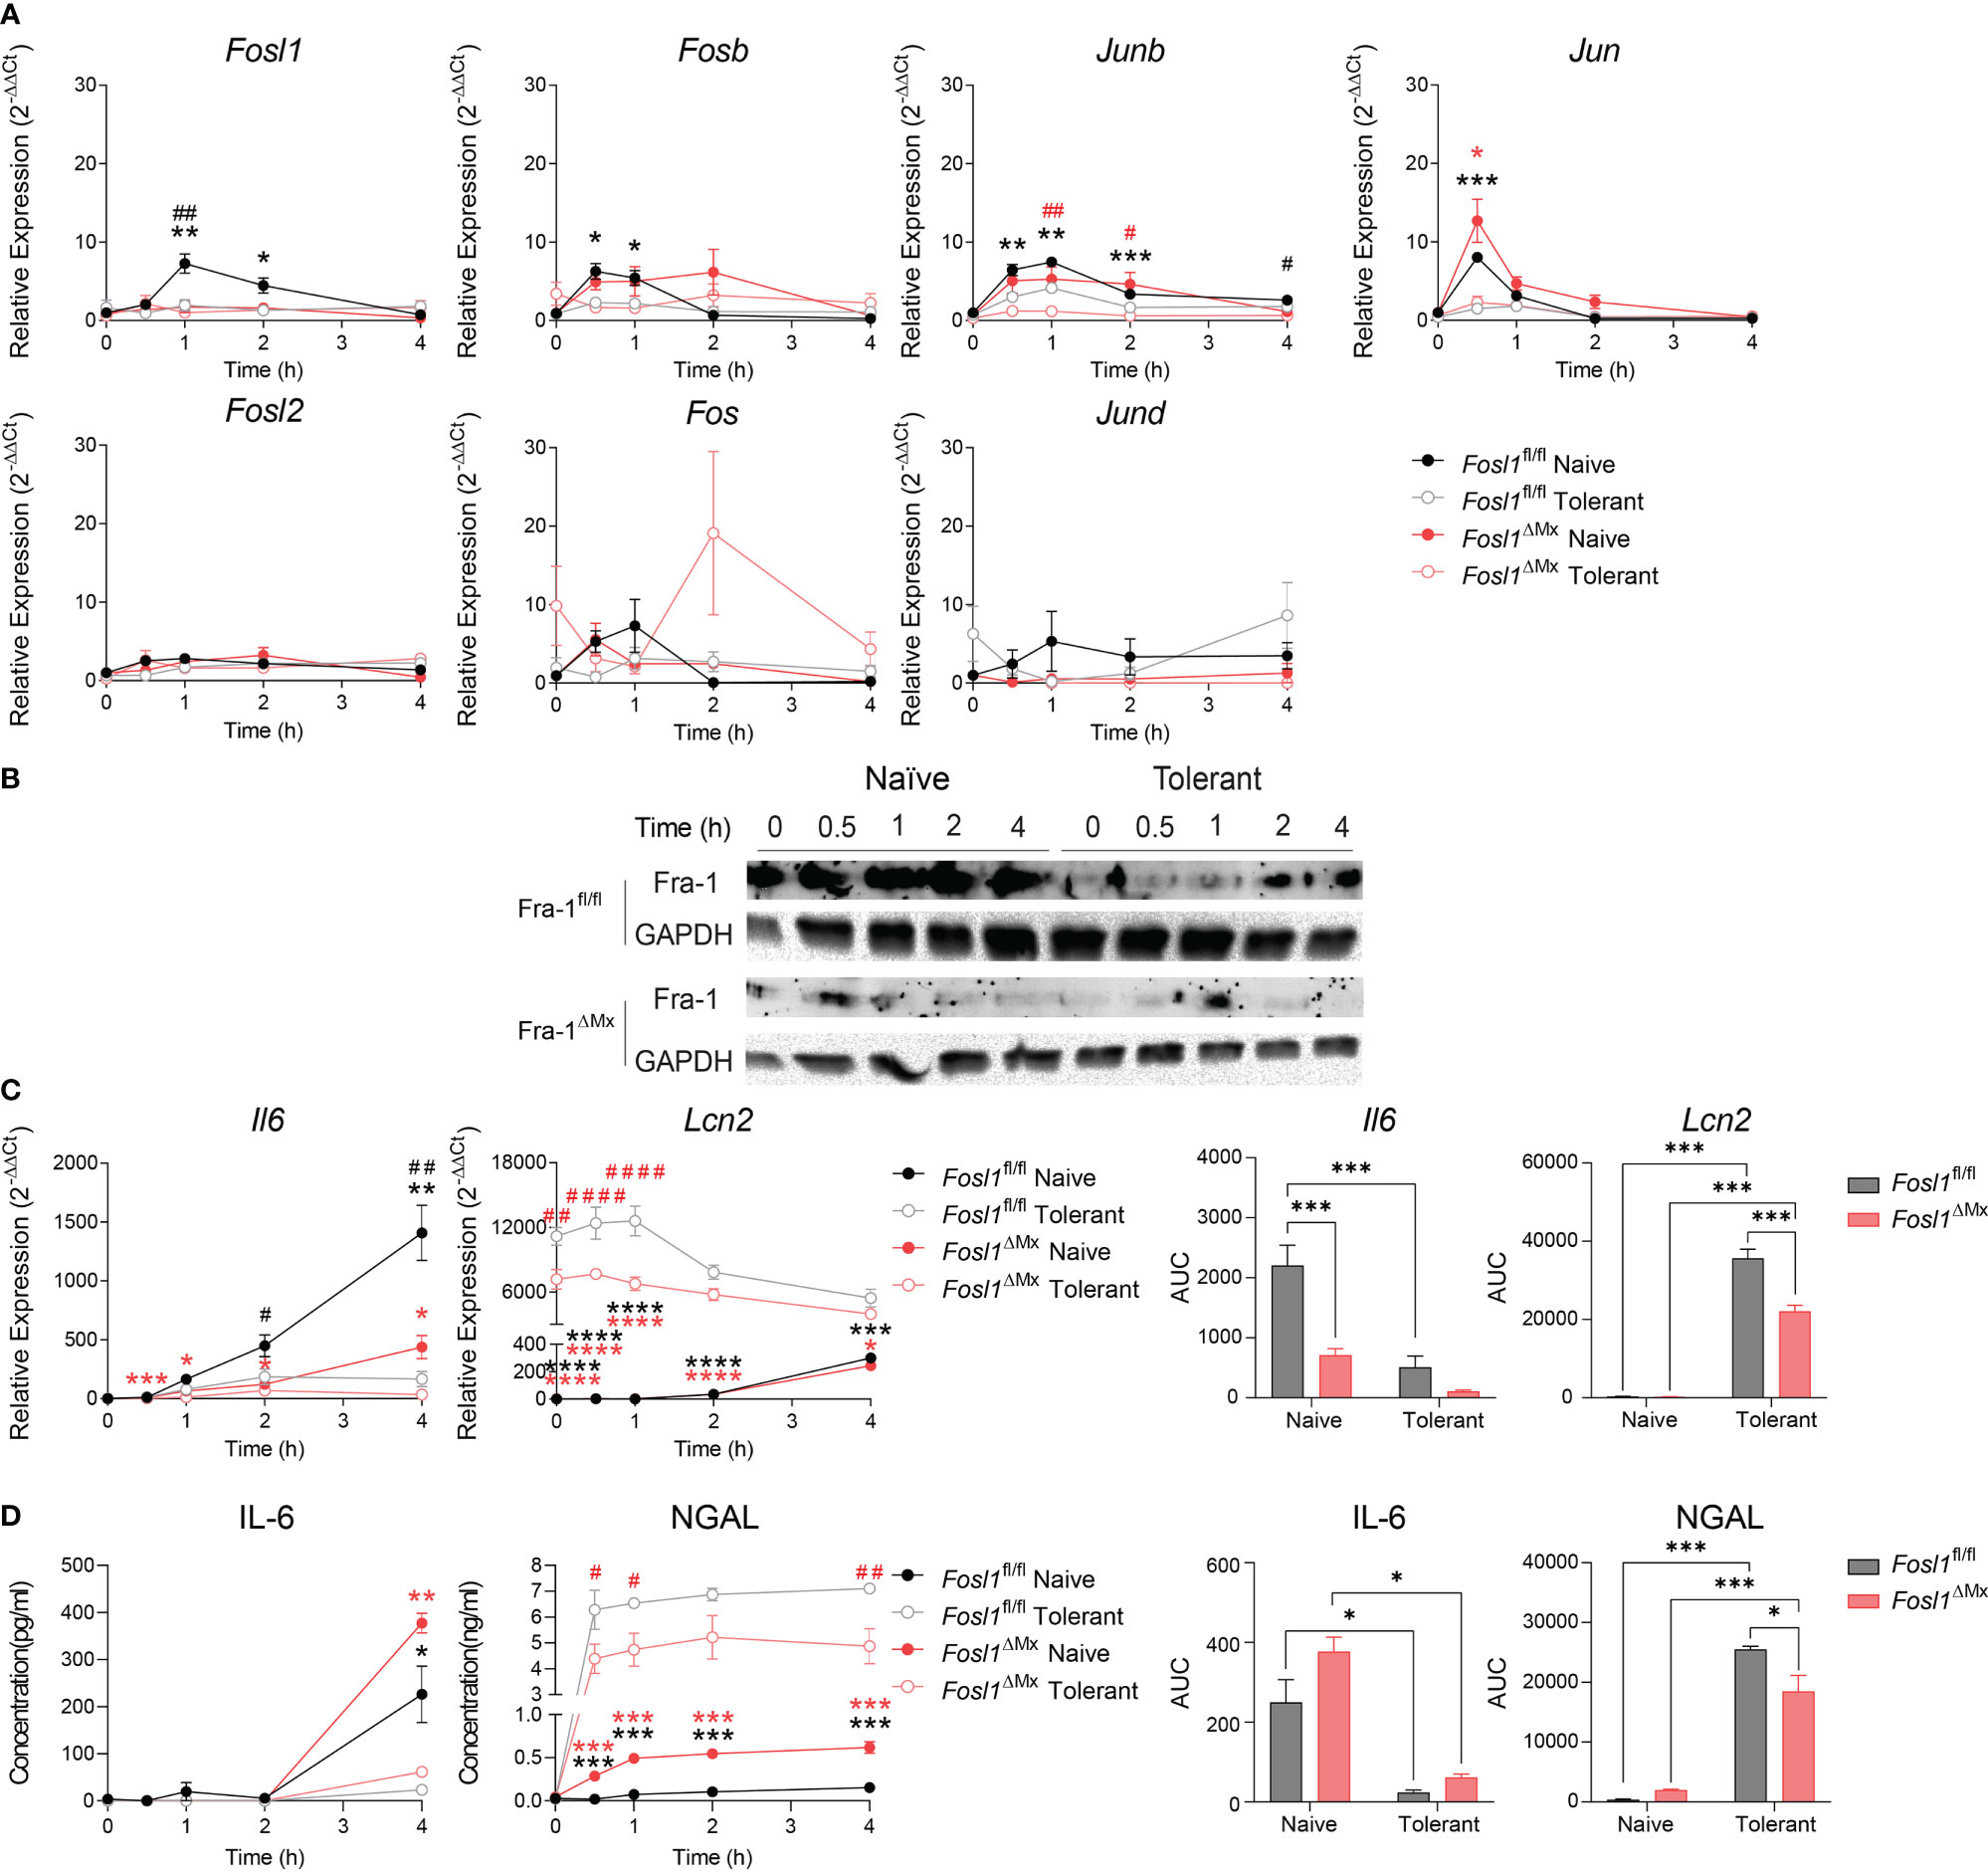
Figure 3 Increased expression of Lcn2 after induction of endotoxin tolerance is reduced in Fosl1 knockout murine macrophages. (A) Quantitative RT-PCR analysis of AP-1 transcription factor gene expression in littermate control and Fra-1 deficient BMDM after LPS stimulation in both naïve and tolerant state, normalized to the expression of Actb. (B) Western blot detection of FRA-1 protein after LPS stimulation in littermate control and FRA-1 deficient BMDM in both naïve and tolerant state. GAPDH was used as loading control. (C) Quantitative RT-PCR analysis of Il6 and Lcn2 in littermate control and FRA-1 deficient BMDM after LPS stimulation in both naïve and tolerant state. Left panels represent the kinetic of gene expression normalized to the expression of Actb and right panels represent the area under curve (AUC) for the respective genes. (D) IL-6 and NGAL protein levels in the supernatant of wild type and FRA-1 deficient BMDM after LPS stimulation in both naïve and tolerant state. Left panels represent the kinetic of protein secretion and right panels represent the area under curve (AUC) for the respective protein. The data shown are from one experiment representative of three independent biological replicates and they are shown as mean ± s.e.m. *p < 0.05; **p < 0.01; ***p < 0.001; ****p < 0.0001 by two-way RM ANOVA with Tukey’s multiple comparisons test. Black asterisks indicated significant difference between naïve (n=6) versus tolerant (n=9) state in littermate control mice; red asterisk indicated significant difference between naïve (n=3) versus tolerant (n=9) state in FRA-1 deficient mice; #p < 0.05; ##p < 0.01; ####p < 0.0001 by two-way RM ANOVA with Tukey’s multiple comparisons test. Black hash sign indicated significant difference between FRA-1 deficient and littermate cells in naïve state; red hash sign indicated significant difference between FRA-1 deficient and littermate cells in tolerant state.
To determine the influence of FRA-1 on the regulation of the tolerizable and non-tolerizable genes, we next investigated the expression pattern of Il6 and Lcn2 in FRA-1 deficient cells. In absence of Fosl1, expression of Il6 mRNA was strongly decreased, especially in naïve state (Figure 3C, black hash sign), without significantly altering the early secretion of IL-6 protein (Figure 3D). Interestingly, the elevated expression of Lcn2 in the tolerant cells was significantly reduced in FRA-1 knockout macrophages both at mRNA and protein levels (Figures 3C, D). This data suggested that expression of FRA-1 and NGAL are positively correlated, especially in tolerant cells.
FRA-1 Transcriptionally Regulates Il6 and Lcn2 at the Promoter Level
Considering the fundamental role of FRA-1 as a transcription factor, we hypothesized that FRA-1 can regulate directly the transcription of Il6 and/or Lcn2 in the context of endotoxin tolerance. Using our previously published ChIP-seq analyses performed in peritoneal macrophages with or without LPS stimulation (13), we discovered that FRA-1 can bind to the promoter sites of Il6 and Lcn2, especially after LPS stimulation. For further analysis of these promoters, we considered the 4.000 bp upstream of their transcription start (TSS) (gray area depicted in Supplementary Figures 1A, B). The putative AP-1 binding sites on Il6 and Lcn2 promoters were predicted in silico (Figures 4A, B) (17). To confirm this analysis, ChIP-qPCR were then performed with anti-FRA-1 antibody in BMDM from FRA-1 deficient mice and littermates under naïve or tolerant conditioning and compared to not stimulated cells. In this experiment, Fosl1∆Mx BMDMs expressing minimal amount of FRA-1 were used as control for the anti-FRA-1 antibody specificity. ChIP-seq data were partly confirmed by our new ChIP-qPCR experiment: FRA-1 could be detected on the promoter of Il6 at the loci 1, 4, 5 and 6 in all conditions including non-stimulated cells. Upon LPS stimulation, naïve cells showed an increase of FRA-1 binding on most of the Il6 promoter locus (all but 1). A similar pattern was observed upon re-stimulation of tolerant cells and diminished in FRA-1 deficient tolerant cells (Figure 4C). Interestingly, FRA-1 could not be detected on most of the loci of Lcn2 promoter in resting cells. However, LPS stimulation strongly mobilized FRA-1 loci 1 to 8 on this promoter in naive cells. Moreover, this binding could be increased for loci 7 and 8 in tolerant cells (Figure 4D). This FRA-1 binding pattern on Il6 and Lcn2 promoter was confirmed by performing a similar analysis in peritoneal macrophages (Supplementary Figures 1C, D). Therefore, our data implies important transcriptional regulation of the Lcn2 promoter by FRA-1 especially in the tolerant state.
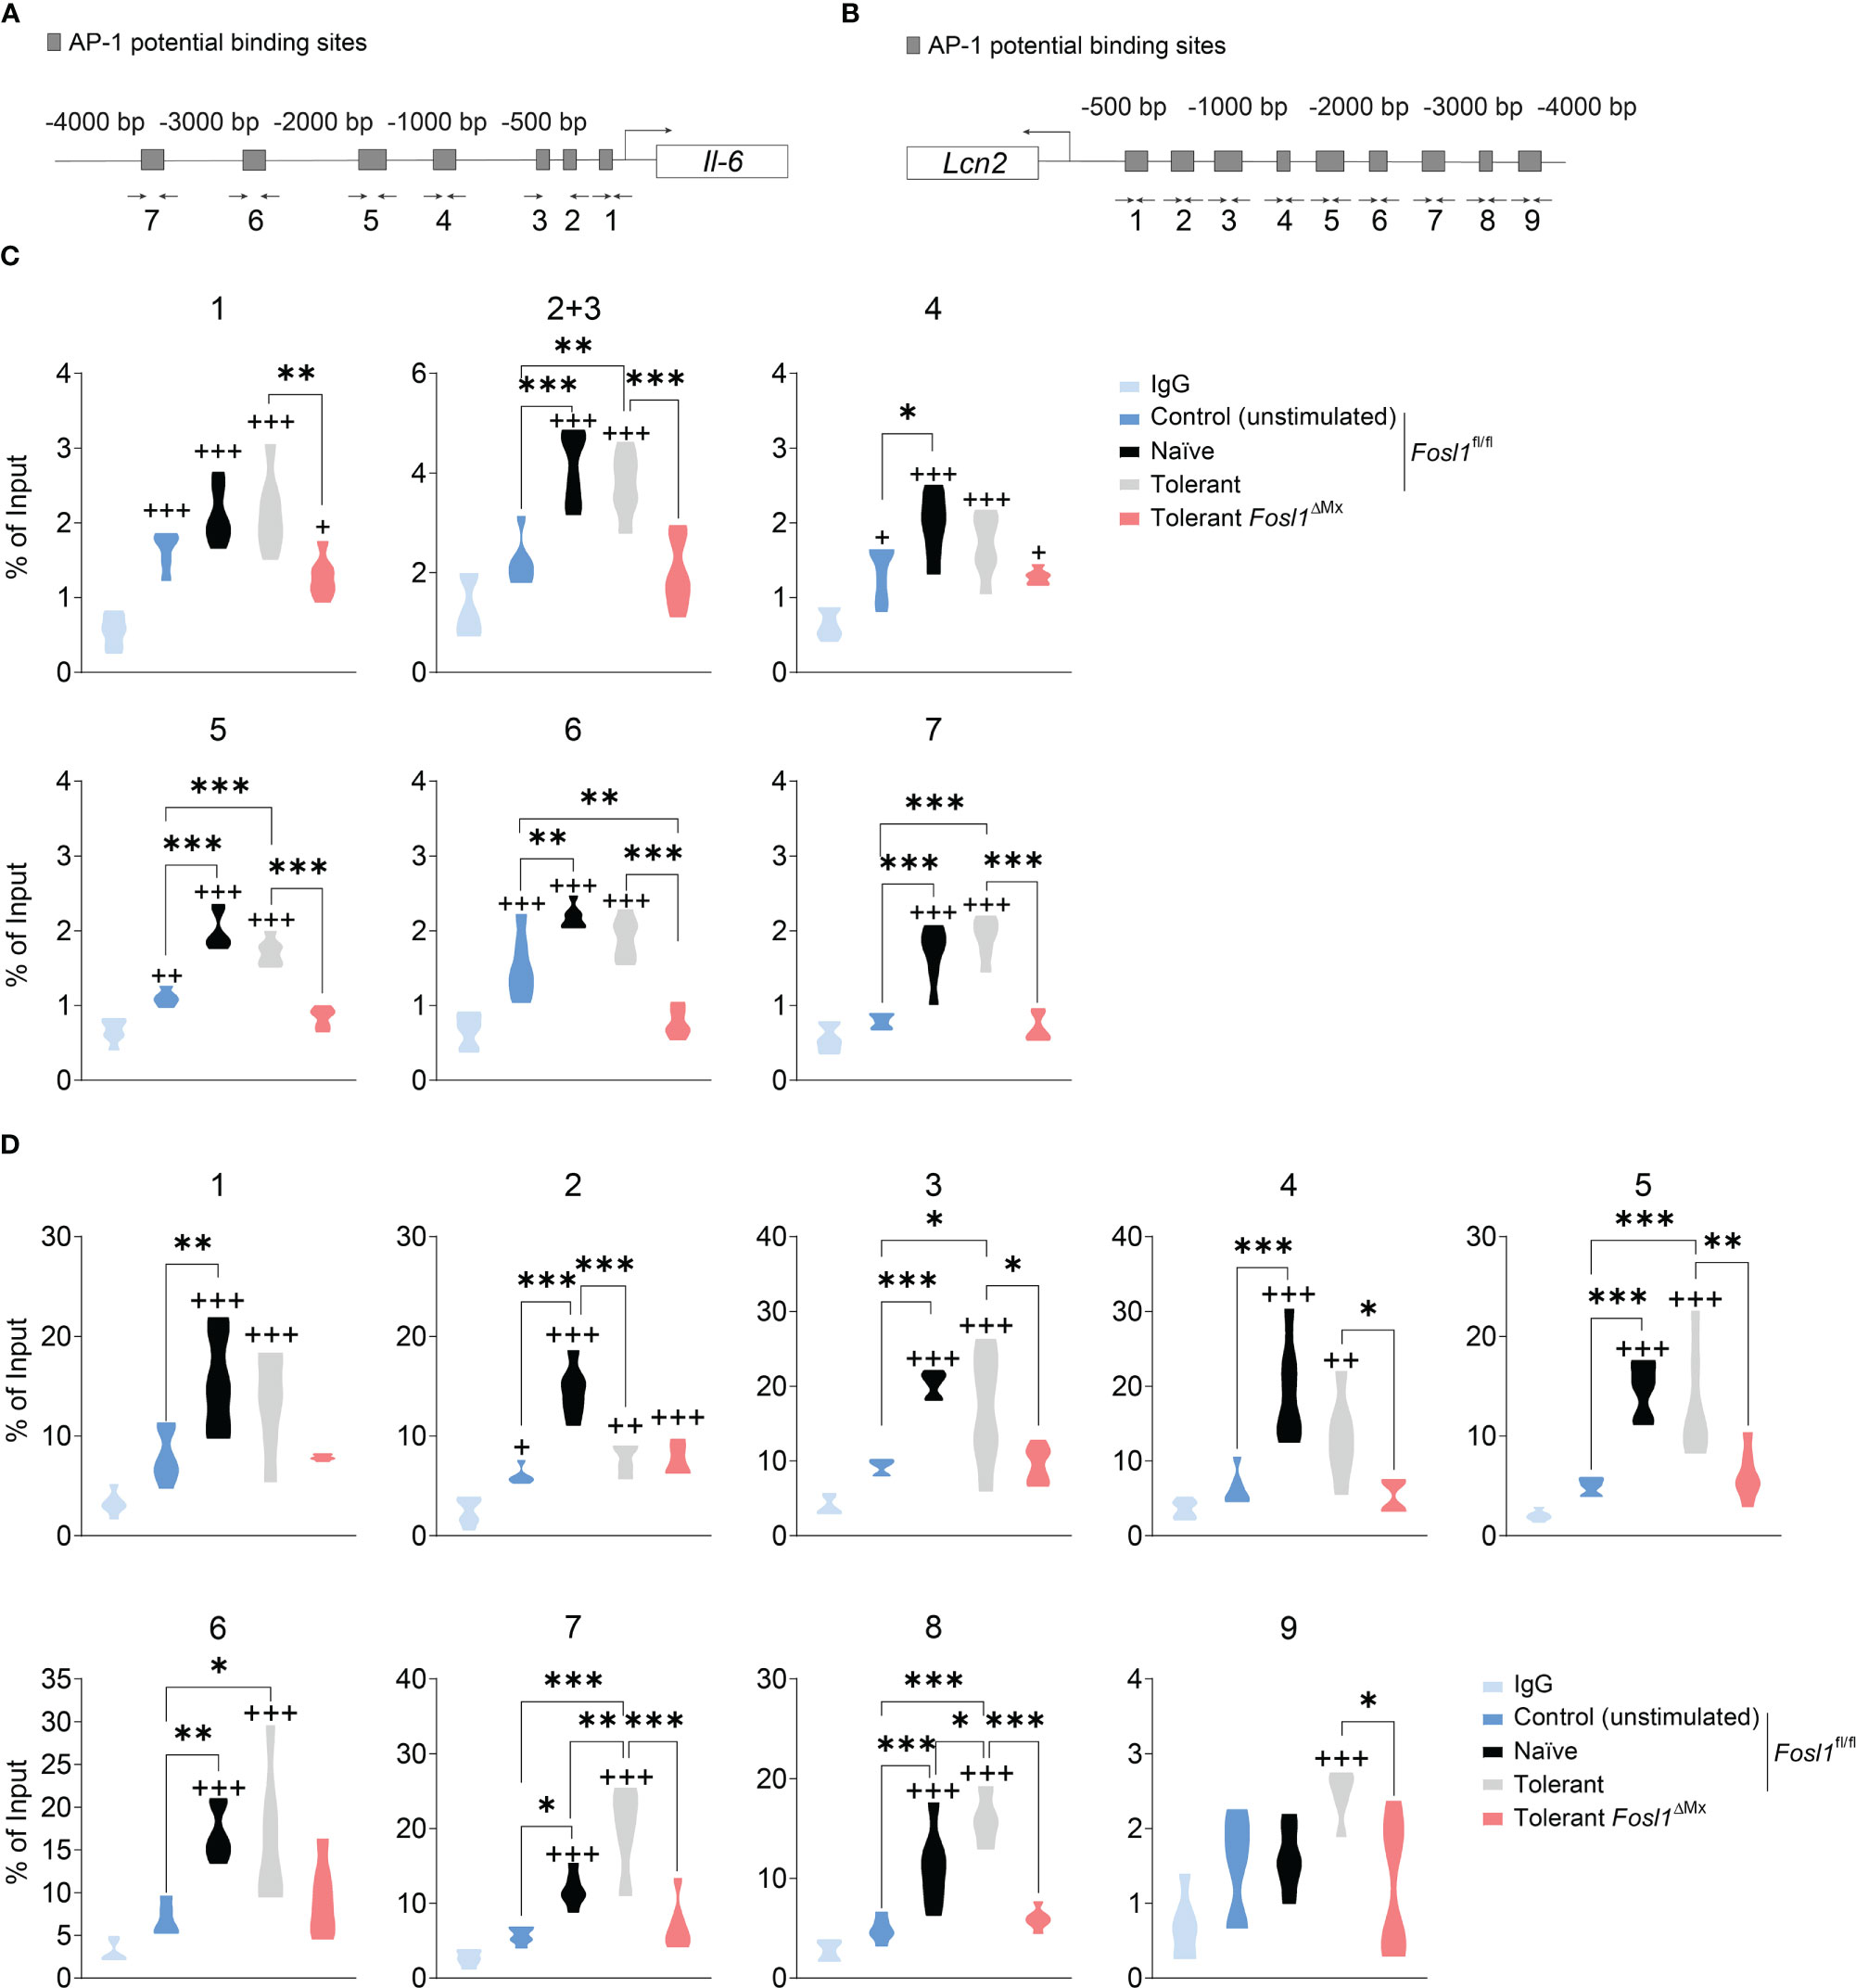
Figure 4 FRA-1 binds stronger to the promoter of Lcn2 after induction of endotoxin tolerance in murine BMDM. (A, B) Prediction of the AP-1 binding sites by the online tool TFBIND and the locations of the primers for each site on Il6 (A) and Lcn2 (B) promoters. (C, D) ChIP assays showing the recruitment of the endogenous FRA-1 on the AP-1 binding sequence of Il6 (C) and Lcn2 (D) promoters after one (naïve) or two (tolerant) stimulations with LPS in bone marrow-derived macrophages isolated from Fosl1ΔMx or littermate mice. +p < 0.05; ++p < 0.01; +++p < 0.001 by one-way ANOVA with Sidak’s multiple comparisons test. + means compared to the IgG group. *p < 0.05; **p < 0.01; ***p < 0.001 by one-way ANOVA with Sidak’s multiple comparisons test.
Increased Inflammation in the Immunosuppressive Phase of Sepsis in Fosl1∆Mx Mice Compared to Littermates
Once established the role of FRA-1 in endotoxin tolerance in vitro, we decided to investigate if this finding could be transposed in vivo in a model mimicking the induction of endotoxin tolerance observed during sepsis. To do so, we applied consecutive injection of LPS to Fosl1∆Mx and the littermate control mice (Figure 5A). Mice were rendered tolerant to LPS by an initial i.p. injection of 25 µg of LPS and stimulated 3 days later with another similar dose of LPS for 2 h. These mice were compared to naive mice injected only once with LPS. PBS-injected mice served as control. Lungs and spleens were then harvested to quantify the inflammation induced by LPS in these organs. In vivo injection of LPS in mice is characterized by a recruitment of immune cells to the lung and an increase of the thickness of the alveolar walls. In littermate control mice, LPS injection significantly thickens the lung alveolar walls of naïve mice. Interestingly, this thickening was decreased in tolerant mice despite a similar immune cell infiltration in the lung when compared to naïve mice (Figure 5B). This acute inflammatory response could also be observed in Fosl1∆Mx mice but to a lower extend. Tolerant FRA-1 deficient mice showed thickening of their alveolar walls similar to the tolerant littermate control mice but a significantly decreased infiltration of their lung by immune cells (Figure 5C). We further investigated the inflammatory conditions in the spleen of these mice. Even though the follicular area of the spleen was significantly increased by LPS injection in the naïve wild type mice, it appears that this criterion went back to normal and became unresponsive to LPS in tolerant wild type mice. No significant difference was observed between the Fosl1∆Mx mice and the littermates in the tolerant state (Supplementary Figure 2). Another consequence of systemic inflammatory response induced by LPS is the induction of apoptosis in leukocyte (7). Our TUNEL staining confirmed that LPS injection increased the number of apoptotic cells in the splenic follicular area of naïve mice (control vs naïve, p=0.0224). Interestingly, this induction of apoptosis by LPS was not observed in tolerant mice (control vs tolerant, p=0.7671). This tolerance seems to be dependent on Fosl1 expression as tolerant FRA-1 deficient mice showed a higher number of apoptotic leukocytes compared to littermate control tolerant mice (tolerant vs tolerant FRA-1 deficient mice, p=0.0005) (Figures 5D, E). Altogether, our data suggested that a more severe inflammation as well as a weaker resolution in lung and spleen occurred in tolerant FRA-1 deficient mice compared to their wild type littermates.
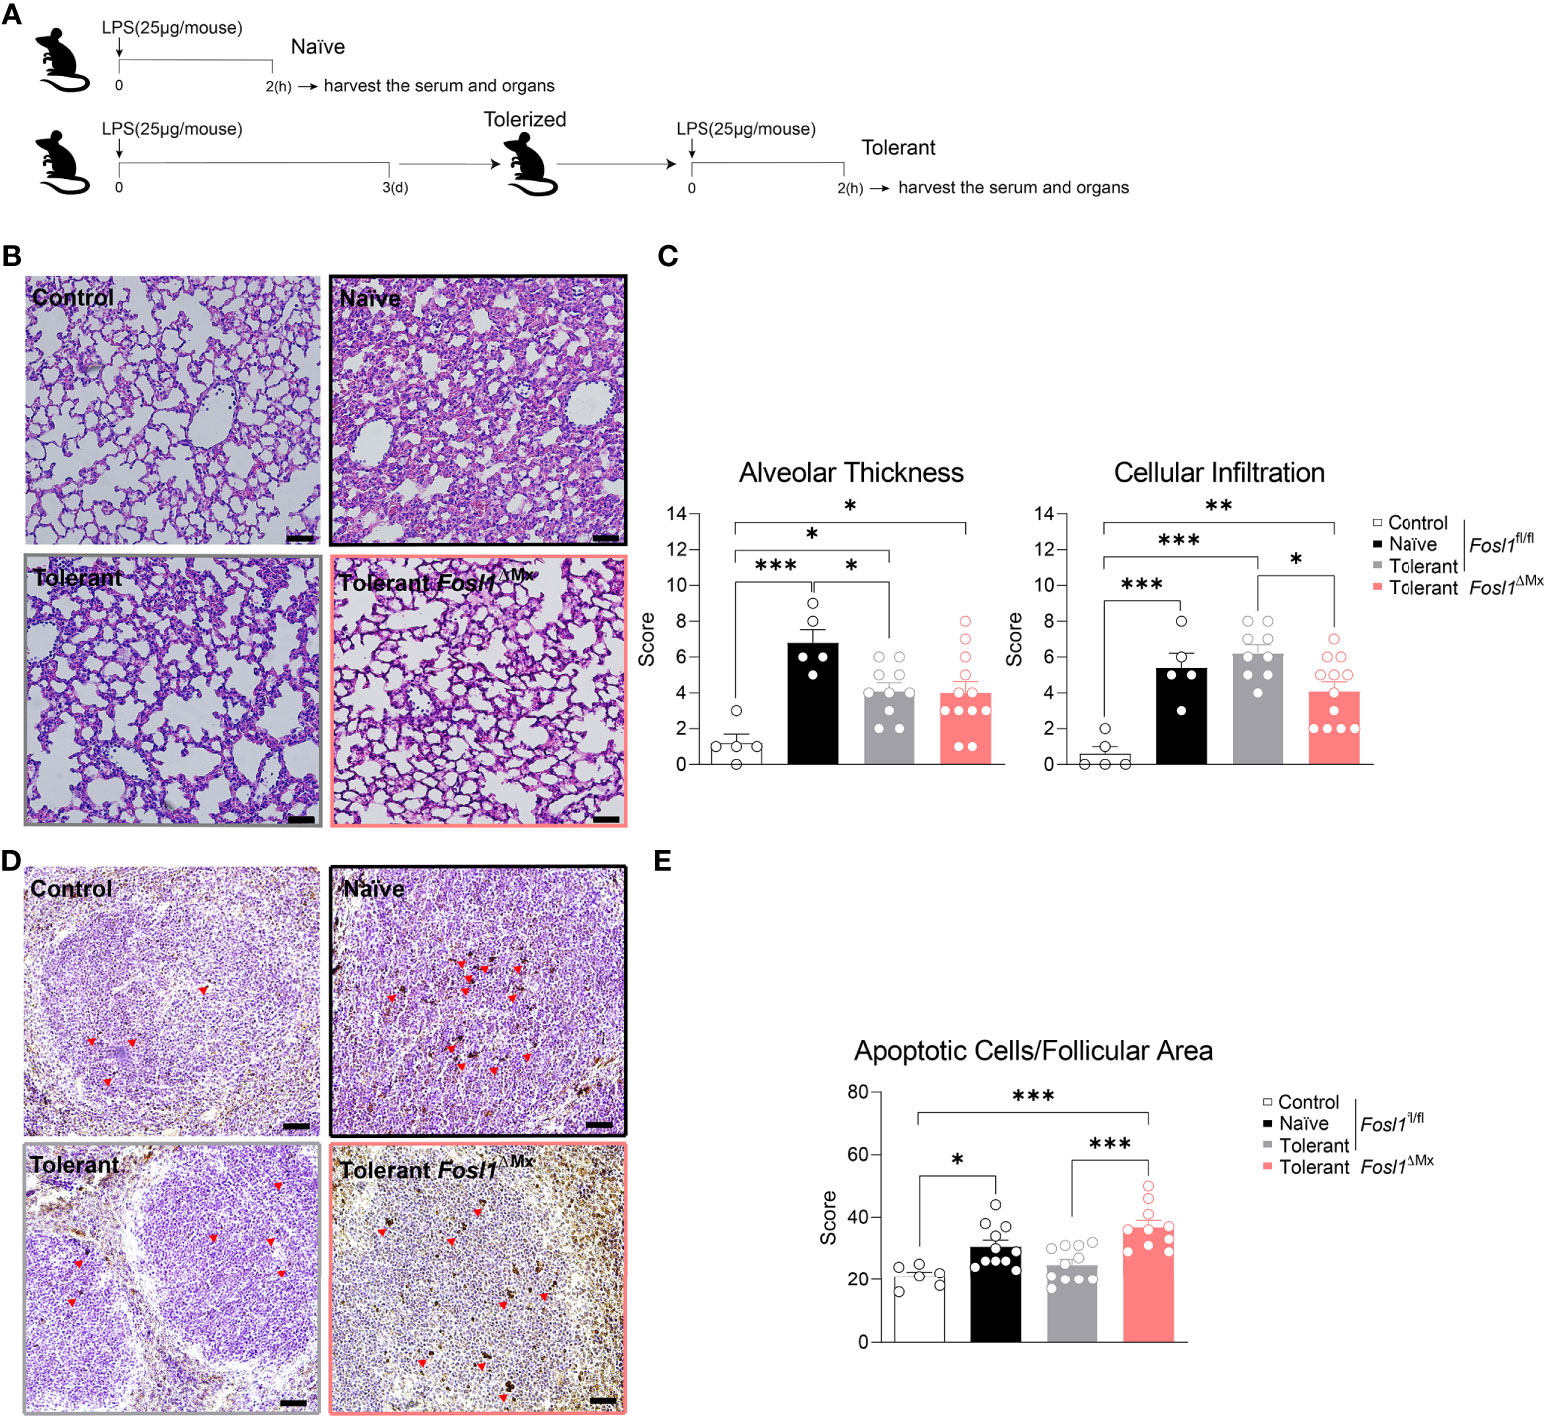
Figure 5 Increased inflammation in the immunosuppressive phase of sepsis is observed in Fosl1∆Mx mice compared to littermates. (A) Experimental scheme of the induction of endotoxin tolerance response in vivo. (B, C) Representative H&E microscopy images and quantification of alveolar thickness and immune cell infiltration in the lung of Fosl1∆Mx and the littermate mice 2 h after once (Naïve) or twice (Tolerant) LPS stimulation. Scale bar = 200μm. (D, E) Representative TUNEL staining images and quantification of apoptotic cells adjusted to follicular area in the spleen of Fosl1∆Mx and the littermate mice after once (Naïve) or twice (Tolerant) LPS stimulation. Scale bar = 40μm. Graph points indicate individual mice. Data are shown as mean ± s.e.m. *p < 0.05; **p < 0.01; ***p < 0.001 by one-way ANOVA with Sidak’s multiple comparisons test.
Increased Expression of NGAL in the Immunosuppressive Phase of Sepsis Is Reduced in Fosl1∆Mx Mice
To understand how AP-1 transcription factors and particularly FRA-1 are involved in our endotoxin tolerance model, we investigated their gene expression profile in murine sepsis model. Fosl1, Junb and Jun were significantly increased by LPS in both lung and spleen of naïve mice. However, establishment of endotoxin tolerance in wild type mice strongly reduced the increased of Fosl1 and Junb in lung and of Jun in spleen by LPS (Figure 6A). In the same line, we measured the expression of Il6 and Lcn2 as standard tolerizable and non-tolerizable genes respectively, in lung and spleen of the control, naïve and tolerant mice. As expected, Il6 was strongly induced only in naïve mice whereas Lcn2 was induced in naive and even more in tolerant mice. For these two genes, protein secretion in the serum fully matched the mRNA data obtained in lung and spleen (Figures 6B, C). For the Fosl1∆Mx and littermate control mice, we first quantified the knockout efficiency within the organs and found that Fosl1 expressions were significantly decreased in lung and spleen in the tolerant state, especially in CD11b+ cells (Figures 6D, E). Alongside, we could confirm the influence of FRA-1 on the cytokine secretion as FRA-1 deficient mice have a lower level of circulating IL-6 and NGAL (Figure 6F). Altogether, our in vivo experiments confirm that NGAL expression is controlled by FRA-1 during tolerance induction.
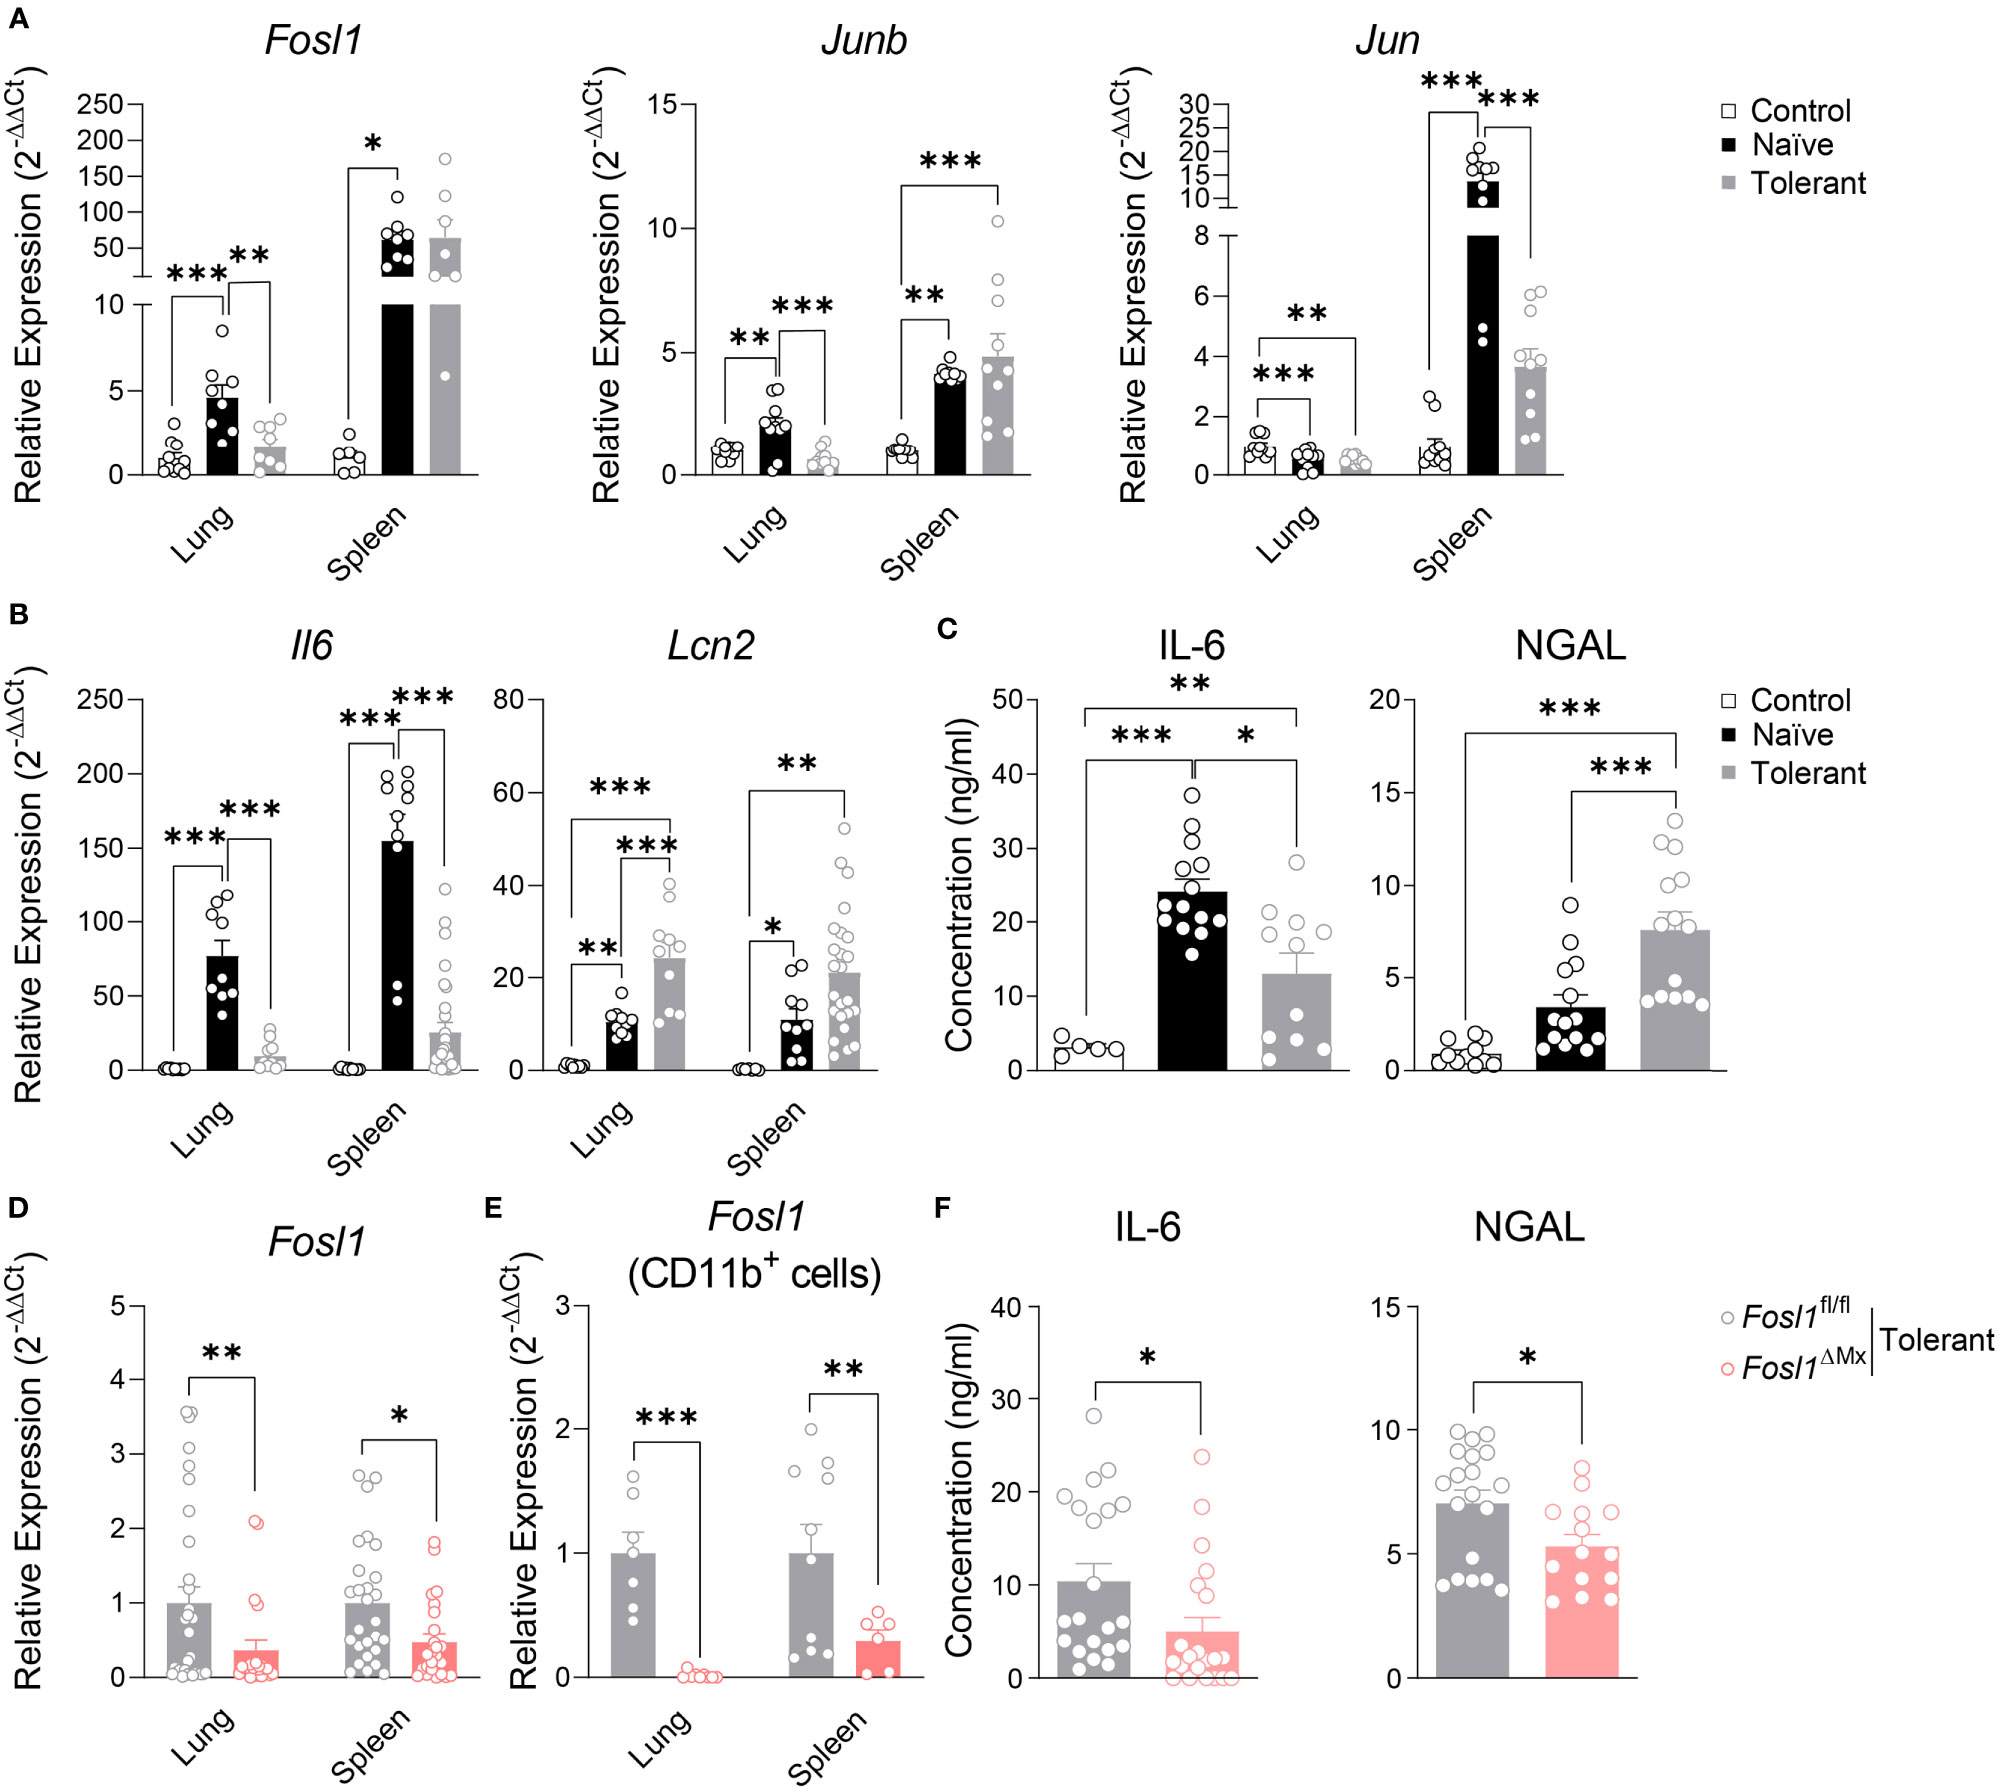
Figure 6 Increased expression of Lcn2 in the immunosuppressive phase of sepsis is reduced in Fosl1∆Mx mice. (A, B) Quantitative RT-PCR analysis of AP-1 transcription factors (A) and Il6 and lcn2 genes (B) in lung and spleen of control, naïve or tolerant wild type mice 2 h after LPS infection. (C) IL-6 and NGAL levels in serum of control, naïve or tolerant wild type mice 2 h after LPS infection. (D, E) Quantitative RT-PCR analysis of Fosl1 transcription factor genes in total organ (D) or CD11b+ cells (E) from lungs and spleens of Fosl1∆Mx and the littermate mice in tolerant state, normalized to the expression of Actb. (F) IL-6 and NGAL levels in serum of Fosl1∆Mx and the littermate mice in tolerant state. Graph points indicate individual mice. Data are shown as mean ± s.e.m. *p < 0.05; **p < 0.01; ***p < 0.001 by one-way ANOVA with Tukey’s multiple comparisons in (A–C) and student t test in (D–F).
Discussion
In the present study, we delineated the expressions of the AP-1 transcription factor family in vitro with an endotoxin tolerance model applied to murine BMDM and human PBMC and in vivo with a murine LPS induced sepsis model. These experiments revealed that the AP-1 transcription factor FRA-1 regulates NGAL expression during the establishment of tolerance in myeloid cells. Interestingly, ChIP-qPCR data further demonstrated a direct regulation on Lcn2 expression by FRA-1, through its binding on Lcn2 promoter in tolerant macrophages. This observation could be transposed in the in vivo septic model of consecutive injection of LPS. FRA-1 deficient mice showed a decreased resolution of inflammation likely dependent on their low level of circulating NGAL. Thus, our data indicates that FRA-1 is involved in myeloid cell tolerance responses by mediating the functional reprogramming of Lcn2 transcription in response to prolonged LPS exposure. In addition, FRA-1 may have a protective role in the tolerance response and resolution of inflammation in sepsis through the regulation of NGAL.
Sepsis is a lethal systemic inflammatory response. Due to the high mortality rate and the lack of efficient therapy, the main mechanisms sustaining this disease are still under investigation. Although initially not appreciated, the rapid display of profound immunosuppression in most patients with sepsis is now a well-established phenomenon (4, 19). However, the immunological and molecular mechanism of the immunosuppression is still poorly understood. Here, we used the endotoxin tolerance model as described previously (5) in vitro and in vivo to mimic the prolonged LPS stimulation that can induce immunosuppression during sepsis. Endotoxin tolerance model is a convenient model for analyzing macrophage hyporesponsiveness. It is induced after exposure of macrophages or mice to a non-lethal low dose of LPS that induces hyperinflammation and then with a second exposure to LPS deactivates the macrophages, resulting in the establishment of immunosuppression (20). With endotoxin tolerance model, we could observe an increase of pro-inflammatory genes upon the first LPS stimulation, and diminished significantly after the second LPS stimulation as shown by Simmie L. Foster and her colleagues (5). We also observed in vivo a significantly increased alveolar wall thickness and neutrophil infiltration in the lung and more follicular apoptotic cells in the spleen in the naïve state, while this phenotype was ameliorated in the tolerant state as shown by Frank M. Davis et al. (21), vividly illustrating the whole process of sepsis..
After the tolerance induction, macrophages undergo functional reprogramming and change to an anti-inflammatory phenotype that activates resolution and regeneration programs, promoting a return to tissue homeostasis (11). Scientific advances have highlighted the role of transcriptional regulation in this functional reprogramming process underlying the immunosuppressive phase (10, 11, 22). The AP-1 transcription factor family is involved in numerous processes such as cell proliferation, differentiation and death, depending on the stimulus, the microenvironment and the cell type (12). The wide range of possible combinations and the occurrence of post-translational modifications explain the great functional heterogeneity of AP-1 transcription factors (12, 23). The function of FRA-1 is clearly established in bone and tumor biology (24, 25). There, FRA-1 needs to heterodimerize with another AP-1 transcription to function. This peculiarity makes FRA-1 an interesting transcription factor as its deletion alters the functions of its partners on their shared target genes. Nonetheless, the role of FRA-1 in the context of inflammation, especially concerning Il6 expression, is still controversial. Mimicking the tumor microenvironment in vitro, the 4T1 mammary carcinoma cells promoted de novo overexpression of Fosl1 in RAW264. 7 cells, and the subsequent binding of FRA-1 on the Il6 promoter and an increase of IL-6 production in response to LPS (26). On the contrary, Morishita et al. reported that IL-6 production after LPS stimulation could be inhibited in RAW264.7 macrophages by overexpressing FRA-1 thanks to a lentiviral vector. This phenotype could be reversed by knockdown of Fosl1 in this cell line (27). In parallel, no significant difference was observed on Il6 expression in FRA-1 deficient alveolar macrophages in a LPS triggered acute lung injury model, even though the KO mice exhibited lower mortality rates compared to the control (28). Thus, the function of FRA-1 on IL-6 expression upon inflammation appears to vary depending on the stimulating strategy, the initial intracellular concentration of FRA-1 and the cell type. This multi-factorial context probably influences the non–AP1 transcription factors and the nature of the partner of FRA-1 in the AP-1 heterodimer binding to the Il6 promoter. This ambivalent function of FRA-1 should rely on opposite regulatory mechanisms. Indeed, FRA-1 has been described as a positive regulator of transcription for genes involved in innate immunity (13) as well as a mediator to repress gene expression in related context (29). In the present study, we could first confirm that Il6 was a strongly tolerizable gene. In addition, we showed that Il6 mRNA expression upon LPS stimulation was dependent on the de novo expression of Fra-1 in naïve macrophages. If our limited kinetic could not illustrate this FRA-1 dependency for the IL-6 protein secretion in vitro, we observed in vivo that circulating IL-6 level were decreased in tolerant mice subjected to our sepsis model.
The role of FRA-1 on Lcn2 expression has yet to be reported. NGAL has been described as a marker of deactivated macrophages and was initially characterized as an anti-microbial protein targeting bacterial siderophore (6, 8). In addition, NGAL supports the establishment of hypoferremia during inflammation to restrict iron availability for the pathogens and thus contributes to the resolution of sepsis (7). Therefore, expression of NGAL promotes microbicidal activities of the immune system and would ultimately contribute to the resolution of sepsis. In our results, the elevated expression of Lcn2 in the tolerant state was significantly reduced in the Fosl1 knockout macrophages, at both mRNA and protein level. This correlation between FRA-1 and Lcn2 expression suggest that this transcription factor offers an additional layer of regulation to the already tightly controlled Lcn2 promoter. Indeed, transcription factors classically activated under inflammatory conditions such as STAT1 or NF-kB have been previously linked to the regulation of Lcn2 expression (30, 31). Strikingly, we also observed this correlation in vivo. FRA-1 deficient mice subjected to endotoxin tolerance had a significantly decreased level of circulating NGAL. These mice also showed less neutrophil infiltration in the lung and more apoptotic cells in the spleen, implying a higher level of inflammation. Altogether, we propose that FRA-1 have a protective role in response endotoxin induced sepsis through the regulation of NGAL.
Therefore, a better understanding of how AP-1, especially FRA-1, expression and functions in tolerant macrophages can provide valuable insights into the fundamental mechanisms underlying sepsis. Characterizing the regulation of the downstream targets of these transcription factors could open new avenue for the development of therapeutic options against sepsis.
Data Availability Statement
The datasets presented in this study can be found in online repositories. The names of the repository/repositories and accession number(s) can be found below: https://www.ncbi.nlm.nih.gov/geo/, GSE178865.
Ethics Statement
The animal study was reviewed and approved by University of Friedrich-Alexander-Universität Erlangen-Nürnberg ethics committee.
Author Contributions
SC, NH, and AB designed the study. SC, DS, and AB wrote the manuscript. NH contributed to the ChIP-sequencing analysis. SC and AS performed the in vitro and in vivo experiments. GS supervised the study and edited the manuscript. All authors contributed to the article and approved the submitted version.
Funding
This work was supported by the Deutsche Forschungsgemeinschaft: BO-3811/5-1; BO-3811/6-1; FOR 2886-TP02; CRC 1181 project A01; SPP2084 µBone; Erlangen-Nuremberg University ELAN-Program P044; Interdisciplinary Centre for Clinical Research (IZKF) grant F1-04; European Research Council (ERC) Synergy Grant 4D Nanoscope and ERC consolidator - ODE.
Conflict of Interest
The authors declare that the research was conducted in the absence of any commercial or financial relationships that could be construed as a potential conflict of interest.
Publisher’s Note
All claims expressed in this article are solely those of the authors and do not necessarily represent those of their affiliated organizations, or those of the publisher, the editors and the reviewers. Any product that may be evaluated in this article, or claim that may be made by its manufacturer, is not guaranteed or endorsed by the publisher.
Supplementary Material
The Supplementary Material for this article can be found online at: https://www.frontiersin.org/articles/10.3389/fimmu.2021.701675/full#supplementary-material
Supplementary Figure 1 | FRA-1 binds to the promoters of Il6 and Lcn2. (A, B) ChIP-seq data (13) of thioglycollate-elicited macrophages from wild type mice, unstimulated or stimulated with LPS were used to identify FRA-1 target genes. Bindings of FRA-1 on the Il6 (A) and Lcn2 (B) promoter are indicated (C, D) ChIP assays showing the recruitment of the endogenous FRA-1 on the AP-1 binding sequence of Il6 (C) and Lcn2 (D) promoters in thioglycollate-elicited macrophages isolated from Fosl1ΔMx or littermate mice after once (naïve) or twice (tolerant) stimulation of LPS. Data are shown as mean ± s.e.m. *p < 0.05; **p < 0.01; ***p < 0.001 by one-way ANOVA with Tukey’s multiple comparisons test.
Supplementary Figure 2 | Follicular area is not significantly altered in the immunosuppressive phase of sepsis in Fosl1∆Mx mice compared to littermates. Representative H&E microscopy images and quantification of follicular area in the spleen of Fosl1∆Mx and the littermate mice after once (naïve) or twice (tolerant) stimulation of LPS. Scale bar = 200μm. Graph points indicate individual mice. Data are shown as mean ± s.e.m. *p < 0.05 by one-way ANOVA with Sidak’s multiple comparisons test.
Supplementary Figure 3 | Uncropped blots results of (Figure 3B) Western blot detection of FRA-1 protein after LPS stimulation in littermate control and FRA-1 deficient BMDM in both naïve and tolerant state. GAPDH was used as loading control.
Supplementary Table 1 | Primers sequences used for Real-Time PCR and ChIP-qPCR.
References
1. Singer M, Deutschman CS, Seymour CW, Shankar-Hari M, Annane D, Bauer M, et al. The Third International Consensus Definitions for Sepsis and Septic Shock (Sepsis-3). Jama (2016) 315(8):801–10. doi: 10.1001/jama.2016.0287
2. Cavaillon JM, Singer M, Skirecki T. Sepsis Therapies: Learning From 30 Years of Failure of Translational Research to Propose New Leads. EMBO Mol Med (2020) 12(4):e10128. doi: 10.15252/emmm.201810128
3. Venet F, Monneret G. Advances in the Understanding and Treatment of Sepsis-Induced Immunosuppression. Nat Rev Nephrol (2018) 14(2):121. doi: 10.1038/nrneph.2017.165
4. Hotchkiss RS, Monneret G, Payen D. Sepsis-Induced Immunosuppression: From Cellular Dysfunctions to Immunotherapy. Nat Rev Immunol (2013) 13(12):862–74. doi: 10.1038/nri3552
5. Foster SL, Hargreaves DC, Medzhitov R. Gene-Specific Control of Inflammation by TLR-Induced Chromatin Modifications. Nature (2007) 447(7147):972–8. doi: 10.1038/nature05836
6. Moschen AR, Gerner RR, Wang J, Klepsch V, Adolph TE, Reider SJ, et al. Lipocalin 2 Protects From Inflammation and Tumorigenesis Associated With Gut Microbiota Alterations. Cell Host Microbe (2016) 19(4):455–69. doi: 10.1016/j.chom.2016.03.007
7. Srinivasan G, Aitken JD, Zhang B, Carvalho FA, Chassaing B, Shashidharamurthy R, et al. Lipocalin 2 Deficiency Dysregulates Iron Homeostasis and Exacerbates Endotoxin-Induced Sepsis. J Immunol (2012) 189(4):1911–9. doi: 10.4049/jimmunol.1200892
8. Warszawska JM, Gawish R, Sharif O, Sigel S, Doninger B, Lakovits K, et al. Lipocalin 2 Deactivates Macrophages and Worsens Pneumococcal Pneumonia Outcomes. J Clin Invest (2013) 123(8):3363–72. doi: 10.1172/JCI67911
9. Vazquez DE, Nino DF, De Maio A, Cauvi DM. Sustained Expression of Lipocalin-2 During Polymicrobial Sepsis. Innate Immun (2015) 21(5):477–89. doi: 10.1177/1753425914548491
10. Shalova IN, Lim JY, Chittezhath M, Zinkernagel AS, Beasley F, Hernández-Jiménez E, et al. Human Monocytes Undergo Functional Re-Programming During Sepsis Mediated by Hypoxia-Inducible Factor-1α. Immunity (2015) 42(3):484–98. doi: 10.1016/j.immuni.2015.02.001
11. Rackov G, Hernández-Jiménez E, Shokri R, Carmona-Rodríguez L, Mañes S, Álvarez-Mon M, et al. P21 Mediates Macrophage Reprogramming Through Regulation of P50-P50 NF-κb and IFN-β. J Clin Invest (2016) 126(8):3089–103. doi: 10.1172/JCI83404
12. Hess J, Angel P, Schorpp-Kistner M. AP-1 Subunits: Quarrel and Harmony Among Siblings. J Cell Sci (2004) 117(25):5965–73. doi: 10.1242/jcs.01589
13. Hannemann N, Cao S, Eriksson D, Schnelzer A, Jordan J, Eberhardt M, et al. Transcription Factor Fra-1 Targets Arginase-1 to Enhance Macrophage-Mediated Inflammation in Arthritis. J Clin Invest (2019) 129(7):2669–84. doi: 10.1172/JCI96832
14. Schleicher U, Bogdan C. Generation, Culture and Flow-Cytometric Characterization of Primary Mouse Macrophages. Methods Mol Biol (2009) 531:203–24. doi: 10.1007/978-1-59745-396-7_14
15. Afgan E, Baker D, Batut B, Van Den Beek M, Bouvier D, Čech M, et al. The Galaxy Platform for Accessible, Reproducible and Collaborative Biomedical Analyses: 2018 Update. Nucleic Acids Res (2018) 46(W1):W537–44. doi: 10.1093/nar/gky379
16. Freese NH, Norris DC, Loraine AE. Integrated Genome Browser: Visual Analytics Platform for Genomics. Bioinformatics (2016) 32(14):2089–95. doi: 10.1093/bioinformatics/btw069
17. Tsunoda T. And Takagi, T. Estimating Transcription Factor Bindability on DNA. Bioinformatics (Oxford England) (1999) 15(7):622–30. doi: 10.1093/bioinformatics/15.7.622
18. Madtes DK, Elston AL, Hackman RC, Dunn AR, Clark J. G. Transforming Growth Factor-α Deficiency Reduces Pulmonary Fibrosis in Transgenic Mice. Am J Respir Cell Mol Biol (1999) 20(5):924–34. doi: 10.1165/ajrcmb.20.5.3526
19. Hotchkiss RS, Monneret G, Payen D. Immunosuppression in Sepsis: A Novel Understanding of the Disorder and a New Therapeutic Approach. Lancet Infect Dis (2013) 13(3):260–8. doi: 10.1016/S1473-3099(13)70001-X
20. West MA, Heagy W. Endotoxin Tolerance: A Review. Crit Care Med (2002) 30(1):S64–73. doi: 10.1097/00003246-200201001-00009
21. Davis FM, Schaller MA, Dendekker A, Joshi AD, Kimball AS, Evanoff H, et al. Sepsis Induces Prolonged Epigenetic Modifications in Bone Marrow and Peripheral Macrophages Impairing Inflammation and Wound Healing. Arteriosclerosis Thrombosis Vasc Biol (2019) 39(11):2353–66. doi: 10.1161/ATVBAHA.119.312754
22. Rackov G, Shokri R, De Mon MÁ, Balomenos D. The Role of IFN-β During the Course of Sepsis Progression and Its Therapeutic Potential. Front Immunol (2017) 8:493. doi: 10.3389/fimmu.2017.00493
23. Zenz R, Eferl R, Scheinecker C, Redlich K, Smolen J, Schonthaler HB, et al. Activator Protein 1 (Fos/Jun) Functions in Inflammatory Bone and Skin Disease. Arthritis Res Ther (2008) 10(1):1–10. doi: 10.1186/ar2338
24. Jochum W, David J-P, Elliott C, Wutz A, Plenk H, Matsuo K, et al. Increased Bone Formation and Osteosclerosis in Mice Overexpressing the Transcription Factor Fra-1. Nat Med (2000) 6(9):980–4. doi: 10.1038/79676
25. Belguise K, Kersual N, Galtier F, Chalbos D. FRA-1 Expression Level Regulates Proliferation and Invasiveness of Breast Cancer Cells. Oncogene (2005) 24(8):1434–44. doi: 10.1038/sj.onc.1208312
26. Wang Q, Ni H, Lan L, Wei X, Xiang R, Wang Y. Fra-1 Protooncogene Regulates IL-6 Expression in Macrophages and Promotes the Generation of M2d Macrophages. Cell Res (2010) 20(6):701–12. doi: 10.1038/cr.2010.52
27. Morishita H, Saito F, Kayama H, Atarashi K, Kuwata H, Yamamoto M, et al. Fra-1 Negatively Regulates Lipopolysaccharide-Mediated Inflammatory Responses. Int Immunol (2009) 21(4):457–65. doi: 10.1093/intimm/dxp015
28. Mishra RK, Potteti HR, Tamatam CR, Elangovan I, Reddy SP. C-Jun Is Required for Nuclear Factor-κb–Dependent, LPS-Stimulated Fos-Related Antigen-1 Transcription in Alveolar Macrophages. Am J Respir Cell Mol Biol (2016) 55(5):667–74. doi: 10.1165/rcmb.2016-0028OC
29. Mittelstadt ML, Patel RC. AP-1 Mediated Transcriptional Repression of Matrix Metalloproteinase-9 by Recruitment of Histone Deacetylase 1 in Response to Interferon β. PLoS One (2012) 7(8):e42152. doi: 10.1371/journal.pone.0042152
30. Zhao P, Elks CM, Stephens JM. The Induction of Lipocalin-2 Protein Expression In Vivo and In Vitro. J Biol Chem (2014) 289(9):5960–9. doi: 10.1074/jbc.M113.532234
Keywords: sepsis, transcription factor, AP-1/Fra-1, lipocalin-2, macrophage, endotoxin tolerance
Citation: Cao S, Schnelzer A, Hannemann N, Schett G, Soulat D and Bozec A (2021) The Transcription Factor FRA-1/AP-1 Controls Lipocalin-2 Expression and Inflammation in Sepsis Model. Front. Immunol. 12:701675. doi: 10.3389/fimmu.2021.701675
Received: 28 April 2021; Accepted: 24 September 2021;
Published: 12 October 2021.
Edited by:
Amiram Ariel, University of Haifa, IsraelReviewed by:
Esther G. Meyron-Holtz, Technion Israel Institute of Technology, IsraelVerena Link, National Institutes of Health (NIH), United States
Copyright © 2021 Cao, Schnelzer, Hannemann, Schett, Soulat and Bozec. This is an open-access article distributed under the terms of the Creative Commons Attribution License (CC BY). The use, distribution or reproduction in other forums is permitted, provided the original author(s) and the copyright owner(s) are credited and that the original publication in this journal is cited, in accordance with accepted academic practice. No use, distribution or reproduction is permitted which does not comply with these terms.
*Correspondence: Didier Soulat, RGlkaWVyLlNvdWxhdEB1ay1lcmxhbmdlbi5kZQ==; Aline Bozec, QWxpbmUuQm96ZWNAdWstZXJsYW5nZW4uZGU=
†These authors have contributed equally to this work
‡These authors have contributed equally to this work