 Eros Di Giorgio1,2†
 Liqing Wang1†
 Yan Xiong1,3Lanette M. Christensen1Tatiana Akimova1Rongxiang Han1Arabinda Samanta1Matteo Trevisanut1
 Claudio Brancolini2Ulf H. Beier4
 Wayne W. Hancock1*
- 1Division of Transplant Immunology, Department of Pathology and Laboratory Medicine, Children’s Hospital of Philadelphia and Perelman School of Medicine, University of Pennsylvania, Philadelphia, PA, United States
- 2Department of Medicine, University of Udine, Udine, Italy
- 3Institute of Hepatobiliary Diseases of Wuhan University, Transplant Centre of Wuhan University, Zhongnan Hospital of Wuhan University, Wuhan University, Wuhan, China
- 4Division of Nephrology, Department of Pediatrics, Children’s Hospital of Philadelphia and Perelman School of Medicine, University of Pennsylvania, Philadelphia, PA, United States
The Mads/Mef2 (Mef2a/b/c/d) family of transcription factors (TFs) regulates differentiation of muscle cells, neurons and hematopoietic cells. By functioning in physiological feedback loops, Mef2 TFs promote the transcription of their repressor, Hdac9, thereby providing temporal control of Mef2-driven differentiation. Disruption of this feedback is associated with the development of various pathologic states, including cancer. Beside their direct involvement in oncogenesis, Mef2 TFs indirectly control tumor progression by regulating antitumor immunity. We recently reported that in CD4+CD25+Foxp3+ T-regulatory (Treg) cells, Mef2d is required for the acquisition of an effector Treg (eTreg) phenotype and for the activation of an epigenetic program that suppresses the anti-tumor immune responses of conventional T and B cells. We now report that as with Mef2d, the deletion of Mef2c in Tregs switches off the expression of Il10 and Icos and leads to enhanced antitumor immunity in syngeneic models of lung cancer. Mechanistically, Mef2c does not directly bind the regulatory elements of Icos and Il10, but its loss-of-function in Tregs induces the expression of the transcriptional repressor, Hdac9. As a consequence, Mef2d, the more abundant member of the Mef2 family, is converted by Hdac9 into a transcriptional repressor on these loci. This leads to the impairment of Treg suppressive properties in vivo and to enhanced anti-cancer immunity. These data further highlight the central role played by the Mef2/Hdac9 axis in the regulation of CD4+Foxp3+ Treg function and adds a new level of complexity to the analysis and study of Treg biology.
Introduction
The role played by Treg cells in restraining anti-tumor immunity (1) and in limiting transplant rejection (2) is well established and has made the study of Treg differentiation, stability, subpopulations and homeostasis a major focus of immunology (3). Foxp3 is the master transcription factor (TF) involved in sustaining Treg suppressive identity and mutations leading to Foxp3 loss-of-function are associated clinically with the severe autoimmunity that presents as IPEX syndrome (Immune dysregulation, Polyendocrinopathy, Enteropathy, X-linked) (4–6). However, Foxp3 has been demonstrated to be necessary, but not sufficient, for triggering and maintaining the Treg phenotype (7). The exceptional interest in Treg biology has made Foxp3 one of the most studied TFs so far (8). Foxp3 transcriptional activities are finely modulated through four main mechanisms: i) the transcriptional and post-translational regulation of its expression (9); ii) the heterogeneity of Foxp3 partners involved in sustaining (9), but also positively or negatively modulating its transcriptional functions (10); iii) the large number of epigenetic regulators that act as pioneering factors (11, 12) or plastically modulate Foxp3 activities (13, 14); and iv) the protein-protein complexes and transcription factors that antagonistically or agonistically integrate Foxp3 responses (15–17).
We recently identified Mef2d as a TF that supports and integrates the transcriptional responses of Foxp3, allowing Tregs to acquire the phenotype of effector Tregs (eTregs) (18). Similarly to Foxp3, the four Mef2 paralogues (Mef2a, b, c, d) assemble into multi-protein complexes which modulate the resulting transcriptional responses to control various and complex differentiative and adaptive programs (19, 20). The dynamic nature of Mef2 protein complexes has been little investigated in T effector cells and is completely unexplored in Treg cell. Here, by exploring the roles of Mef2c in CD4+ Foxp3+ Treg cells, we discovered the existence of a feed-back circuit involving Mef2c, Mef2d and Hdac9. Interference in this circuit decreases the immunosuppressive properties of Foxp3+ Tregs in vivo. Our results stress the need to deepen the study of this signaling pathway so as to more fully understand the transcriptional dynamics of Treg cells.
Materials and Methods
Mice
BALB/c and C57BL/6 mice were purchased from The Jackson Laboratory. Foxp3YFP-cre mice (21) and Mef2cflox/flox mice (22) were previously described and backcrossed on the C57BL/6 background at least 8 times. Mice with conditional deletion of Mef2c within their Foxp3+ Treg cells (Foxp3YFP-creMef2cflox/flox) are hereafter listed as Mef2c-/- mice. Foxp3YFP-cre mice were used as wild-type controls.
Co-Immunoprecipitation and Western Blotting
Teff and Treg cells were lysed with hypotonic buffer (20 mM Tris-HCl, pH 7.5; 2 mM EDTA; 10 mM KCl; 1% Triton X-100), supplemented with protease and phosphatase inhibitors; 1 μg of antibody (Ab) was used for immunoprecipitation, and Protein-G agarose (Invitrogen, #15920-010) was used to collect Ab-antigen complexes. Cell lysates were separated by SDS-PAGE, transferred to nitrocellulose membranes and immunoblotted with the following Abs: Mef2d (Becton-Dickinson, #610774), Foxp3 (Invitrogen, #700914), β-actin (Cell Signaling Technology, #3700), and Hdac9 (23). Secondary HRP-conjugated Abs to mouse (#7076), rat (#7077) and rabbit (#7074) IgG were purchased from Cell Signaling Technology. Unconjugated CD3 (clone 145-2C11, #553057) and CD28 (clone 37.51, #553294) mAbs used for cell activation were purchased from Becton-Dickinson.
Flow Cytometry
Single-cell suspensions from secondary lymphoid tissues or tumors were prepared as previously described (15) and stained with fluorochrome-conjugated mAbs directed against CD4 (Pacific blue, Invitrogen, #MHCD0428), CD8 (Super Bright 645, eBioscience, clone 53-6.7, #64-0081-82), Foxp3 (eFluor 450, eBioscience, clone FJK-16s, #48-5773-82 and PE-Cy5 #15-5773-82), CD62L (PE-Cy7, clone MEL-14, #25-0621-82), IFN-γ (APC, clone XMG1.2, #554413; PE # 554412), CD44 (PE-Cy5, eBioscience, clone IM7, #15-0441-83), Ctla4 (APC, #17-1522-82), Icos (PE, # 12-9949-81), CD25 (APC, eBioscience, clone PC61.5, #17-0251-82), and CD8a (FITC, #53-6.7), and acquired on a Cytoflex (Beckman Coulter) flow cytometer.
Treg Suppression Assays
5×10⁴ CD4+CD25- conventional T cells and CD4+CD25+Tregs from Foxp3YFP-Cre and Mef2c-/-mice were isolated using CD4+CD25+Treg isolation kits (Miltenyi Biotec, #130-091-041) and seeded into 96-well plates. Equal numbers of CFSE-labeled CD4+CD25- T cells and γ-irradiated antigen-presenting cells (CD90.2–, Miltenyi Biotec, #130-049-101), plus CD3 mAb (1 μg/ml), were cultured for 72 h with different concentrations of Tregs. After 72 h, proliferation of conventional T cells was determined by flow cytometry and analysis of CFSE dilution.
Cardiac Transplantation
We undertook heterotopic cardiac allografting using BALB/c mice as donors and WT or Mef2c-/- C57BL/6 mice as recipients. On the day of engraftment, recipients were treated i.v. with CD154 mAb (Bio X Cell, clone MR-1, #BE0017-1, 200 µg) plus 5×10⁶ donor splenocytes (DST) (24). Allograft survival was monitored by palpation of ventricular contractions and subsequently confirmed by histological evaluation.
ChIP Assays
Each ChIP was performed using 3×10⁶ Tregs. After 15’ of fixation with 1% formaldehyde and 30 cycles of sonication (30 sec ON and 30 sec OFF, Bioruptor, Diagenode), the resulting chromatin was immunoprecipitated using Abs against H3K27ac (2µg, Abcam #ab4729), Mef2d (5 µg, BD, # 610774), Mef2c (5 µg) (25), and Hdac9 (5 µg) (23). The immunoprecipitated DNA was purified and analyzed by qPCR (SYBR green, KAPA).
RNA-Seq and Real-Time qPCR
RNeasy kits (QIAGEN) were used to isolate mRNA. mRNA with a RIN>7 were used to prepare libraries and perform RNA-sequencing by Novogene (Sacramento, CA) on the Illumina Platform PE150. The edgeR package was used to identify the differentially expressed genes (p-value <0.05 and fold change >1.3). GSEA (26) was performed to interrogate datasets with defined genesets, as described (27). The expression levels of individual genes were verified by qPCR. For this purpose, RNA was reverse transcribed to cDNA (Applied Biosystems) and Taqman primers and probe sets were used to perform RT-qPCR. Data were normalized to endogenous 18s and relative expression was determined by the formula 2–ΔCT.
Cell Lines and Tumor Models
The murine lung adenocarcinoma cell line, TC1 (28), was provided by Dr. Yvonne Patterson (UPenn, Philadelphia, PA). Lung cancer cells were grown in RPMI supplemented with 10% fetal bovine serum (FBS), 2 mM glutamine, and 5 μg/ml penicillin & streptomycin. For lung tumor cells, each mouse was injected s.c. with 1.2×10⁶ TC1 tumor cells. Tumor volume was determined by the formula: ((short diameter)2 × long diameter)/2.
Statistical analysis
Data were analyzed using GraphPad Prism 8.0 and Excel. Data are presented as mean ± standard error. Statistical comparisons between two groups were done with a 2-tailed Student’s t test. Comparisons between multiple samples were performed by using a 1-way ANOVA test with corresponding Tukey’s multiple comparison test. Graft survival was evaluated with Kaplan-Meier followed by log-rank test. We marked with *p<0.05, **p<0.01, ***p<0.005.
Study Approval
Animal studies were approved by the Institutional Animal Care and Use Committee of the Children’s Hospital of Philadelphia (protocols 17-001047 and 19-000561).
Primers
The following primers were used for ChIP-qPCR analysis: Itk FW: GTGCGACTGAAGGAGAGGAG, Itk RV: CATCAGAGGAGGGAGCTCAG, Hdac9 FW: CTCCAGAGGGTGTCCTCCTA, Hdac9 RV: GGCTTTGGTGGGGTATTTTT, Icos 1 FW: CCTCAGTCAGAAGGGTCGTC, Icos 1 RV: CAGAAATTCCTGGTCATGTTTT, Icos 2 FW: AGTCTGCCATAGGGTTGGTG, Icos 2 RV: TCAGTCATTTTCTCCCCCTTT, Il10 FW: TCTTTAGCGCTTACAATGCAAA, Il10 RV: CTGTTCTTGGTCCCCCTTTT.
Results
Mef2c Deletion in Tregs Only Partially Represses Their Suppressive Properties In Vitro
As noted in the literature, the various paralogues of MEF2 can play redundant (29, 30) or differentiative and adaptive roles (31, 32). Despite its low expression in murine Tregs (Figure 1A), we deleted Mef2c expression in Foxp3+ Treg cells by crossing Mef2cfl/fl mice and Foxp3YFP/Cre mice so as to investigate the existence of alternative, supplementary or redundant transcriptional programs with respect to those controlled by Mef2d, its more abundant paralogue. Mef2cfl/fl Foxp3YFP/Cre (hereafter Mef2c-/-) mice were born at expected Mendelian ratios and were characterized by normal numbers of Tregs in secondary lymphoid tissues, though CD4+Foxp3+ Tregs were increased in the thymus of Mef2c-/- mice (Figures 1B, C). Whether this was due to increased generation, stability or re-circulation to the thymus is presently unknown, but was previously also observed in Mef2dfl/flFoxp3YFP/Cre mice (18). The in vitro suppressive functions of Mef2c-/- Tregs were increased, as shown by cell-sorting (Figure 1D) and testing of the ability of purified Tregs to inhibit the proliferation of conventional T cells. Area-under-curve data are shown in Figure 1E and a triplicate assay, representative of 2 such assays, is shown in Figure 1F. Assessment of suppressive activity again CD4 and CD8 T cell subsets is shown in Supplementary Figure 1. Hence, while Mef2d deletion in Tregs led to decreased suppressive function in vitro (18), Mef2c deletion had an opposite effect.
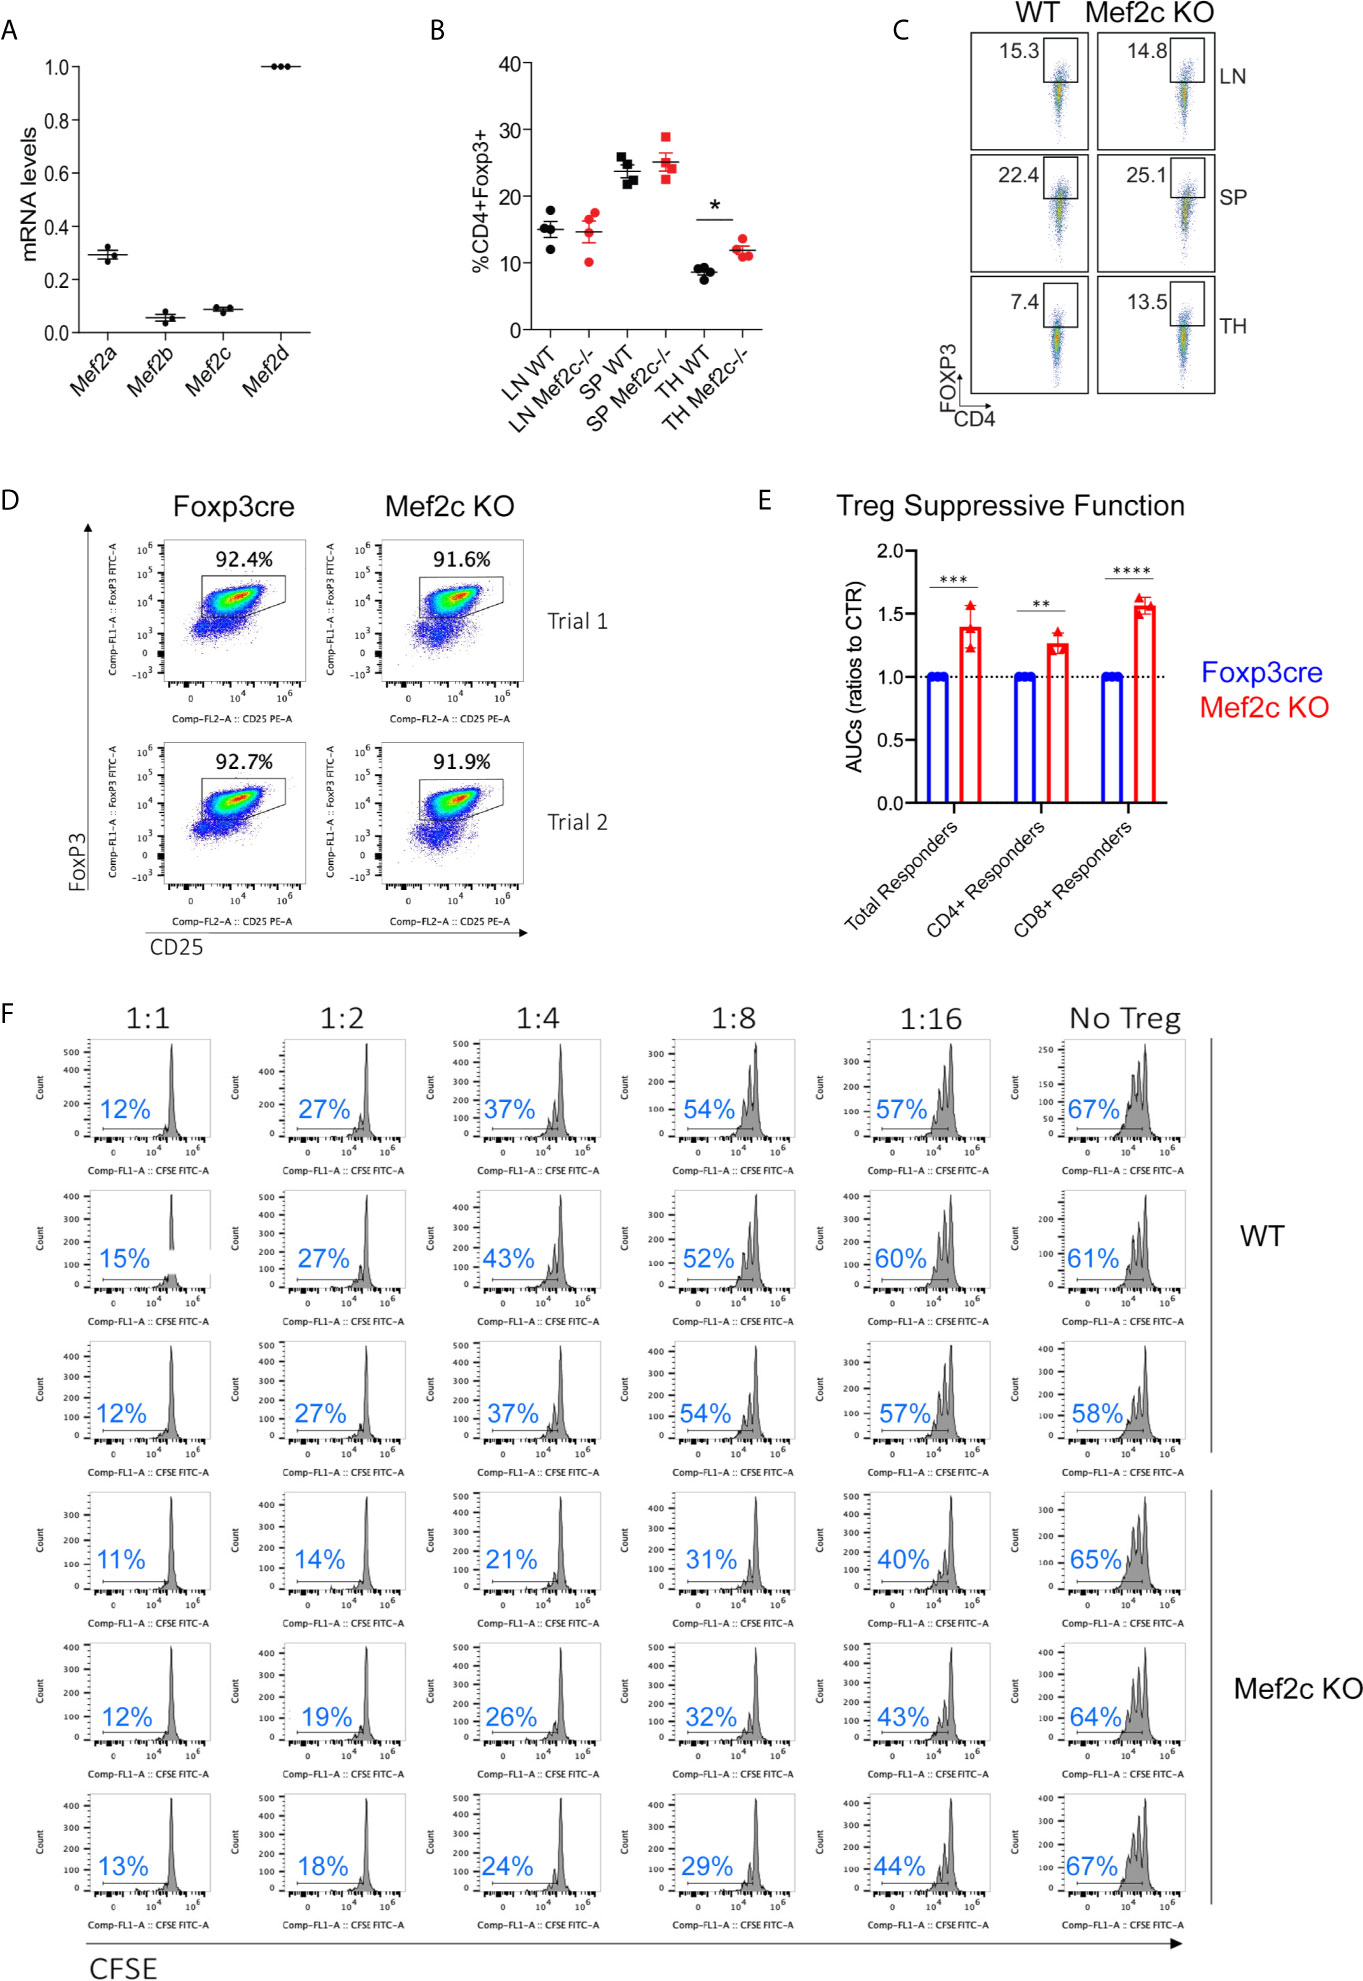
Figure 1 Mef2c deletion in Tregs increases their suppressive properties in vitro. (A) mRNA absolute levels of the indicated Mef2 paralogues in Tregs, expressed as RPKM levels relative to Mef2d levels. (B, C) Analysis of CD4+Foxp3+ in lymph nodes (LN), spleens (SP) and thymii (TH) tissues from Mef2c-/- or WT mice (n = 4, *p < 0.05, t-test). (D) Purity of CD4+CD25+Foxp3+ Tregs used for Treg assays (representative of 3 mice/group) and performed twice (Trial 1 and Trial 2). (E) AUC data from Treg suppression assays performed twice and in triplicate (**p < 0.01, ***p < 0.005, ***p < 0.001). (F) Examples of Treg suppression assays performed in triplicate and using all T cells as proliferating cells (separate CD4 and CD8 T cells responses are shown in Supplementary Figure 1); the proportion of proliferating T cells within each panel is shown in blue.
General Mef2 Signatures but Also Treg-Specific Signatures Are Altered in Mef2c-/- Tregs
Despite the low expression levels of Mef2c in murine Tregs, the impact of Mef2c deletion on the Treg transcriptome was very similar to what we observed upon Mef2d deletion (18). That is, Mef2d deletion caused the up-regulation of 795 transcripts and the repression of 700 genes (18), while Mef2c deletion caused the up-regulation of 801 genes and the repression of 729 genes (>1.3-fold, p<0.05) (Figure 2A). Gene set enrichment analysis (GSEA) showed that in Tregs, Mef2c controls general transcriptional responses previously associated with Mef2 TFs in different cell types, like E2F and peroxisome proliferator-activated receptor-γ agonists/retinoic acid signaling (Figure 2B). Alongside the perturbation of these signaling pathways, we found that Mef2c controls the expression of more specific signatures related to the activation of Tregs and the execution of their immunosuppressive properties (Figure 2B). This analysis suggests that Mef2c is required to sustain the activation of Tregs and the transcriptional program activated by Blimp1 (Figure 2B). We validated the RNA-seq data by means of qRT-PCR on a selected pool of transcripts found to be dysregulated after Mef2c depletion; in each case there was agreement with the high-throughput data (Figure 2C).
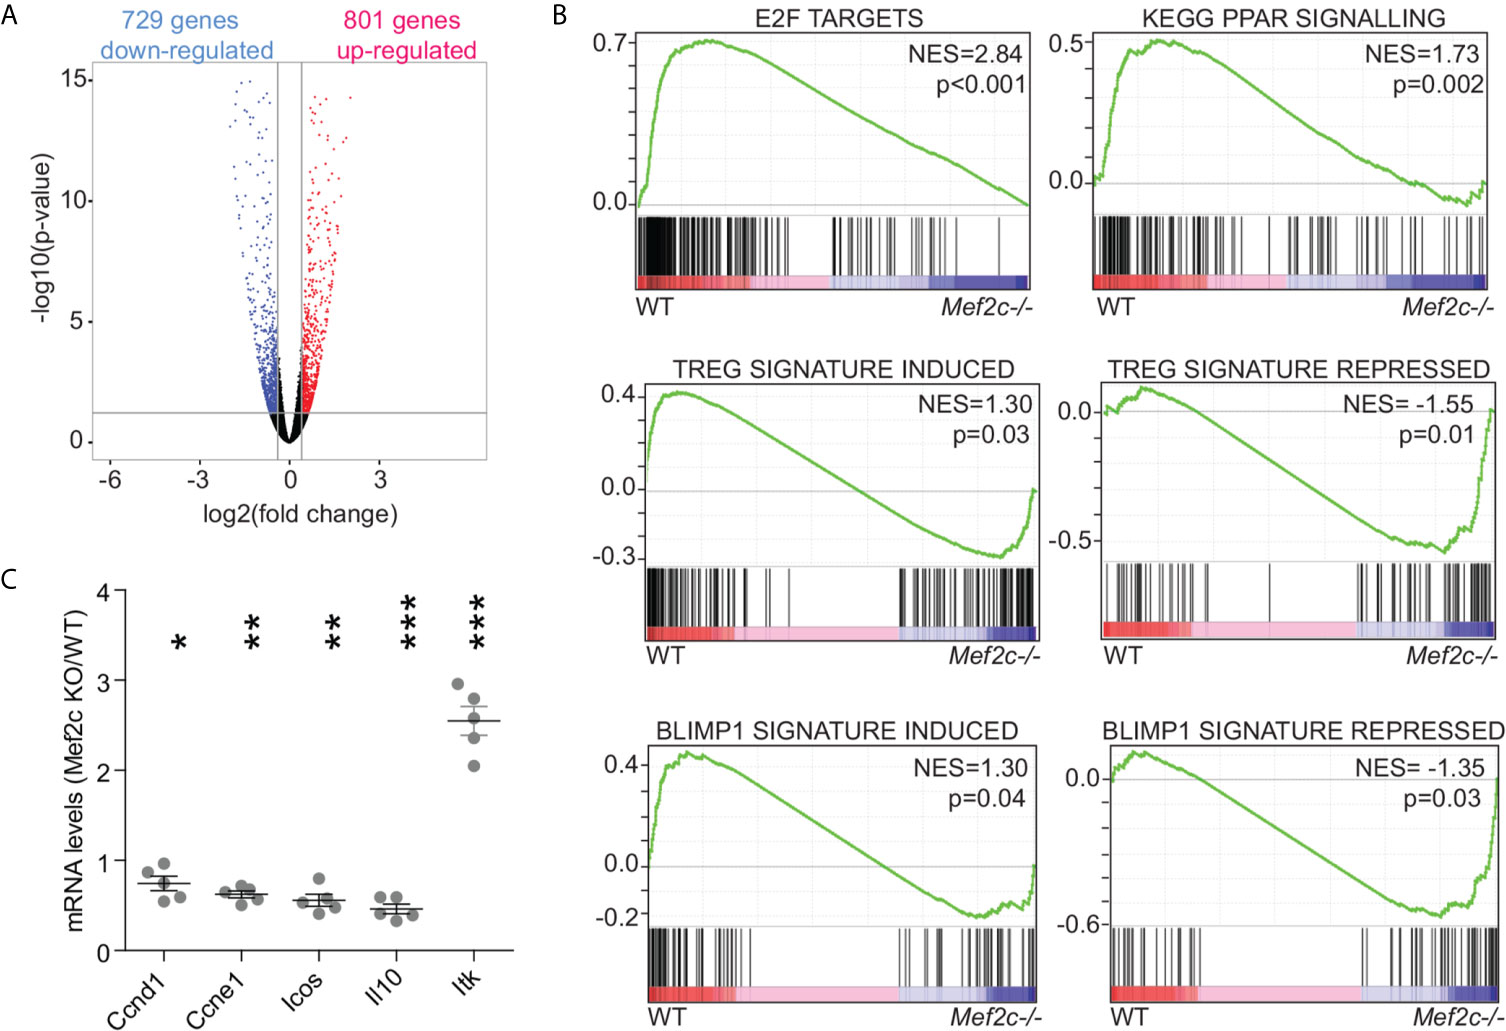
Figure 2 General Mef2 signatures but also Treg-specific signatures are altered in Mef2c-/- Tregs. (A) Volcano plot illustrating the statistical significance and the fold change for genes differentially expressed in Mef2c-/- Foxp3+ Tregs in respect to WT Treg cells. (B) GSEA plots obtained by using the indicated gene-sets and as dataset the transcriptome of WT or Mef2c-/- Tregs. (C) mRNA expression levels of the indicated genes, expressed as a ratio between Mef2c-/- and WT Tregs (t-test between the two groups for each gene, *p < 0.05, **p<0.01, ***p<0.005).
Mef2c Depletion Switches on Hdac9 Transcription and Triggers a Feedback Response That Limits the Transcriptional Activity of Mef2d
GSEA analysis showed that many aspects of the transcriptional perturbation obtained after the depletion of Mef2c in Tregs are superimposable to that obtained by depleting Mef2d (Figure 3A). We hypothesized that this could be due to the re-organization of Mef2d transcriptional complexes achieved as a consequence of Mef2c KO. Though suggested many times in the literature (23, 27, 31, 34–37), the stoichiometry as well as the dynamic composition of MEF2 heterodimeric complexes in living cells have never been investigated in detail. We approached this issue by looking at the perturbations of mRNA abundance of the privileged partners of MEF2 TFs observed after Mef2c or Mef2d depletion (Figure 3B). Among the partners analyzed, only Hdac9 displayed differences between the two KOs, being induced after Mef2c deletion (Figure 3B). We confirmed this upregulation in Mef2c-/- Tregs both at the RNA (Figure 3C) and protein (Figure 3D) levels, and that upregulation was likely to be due to increased transcription as a consequence of the establishment of a proficient chromatin environment at the promoter level (Figure 3E).
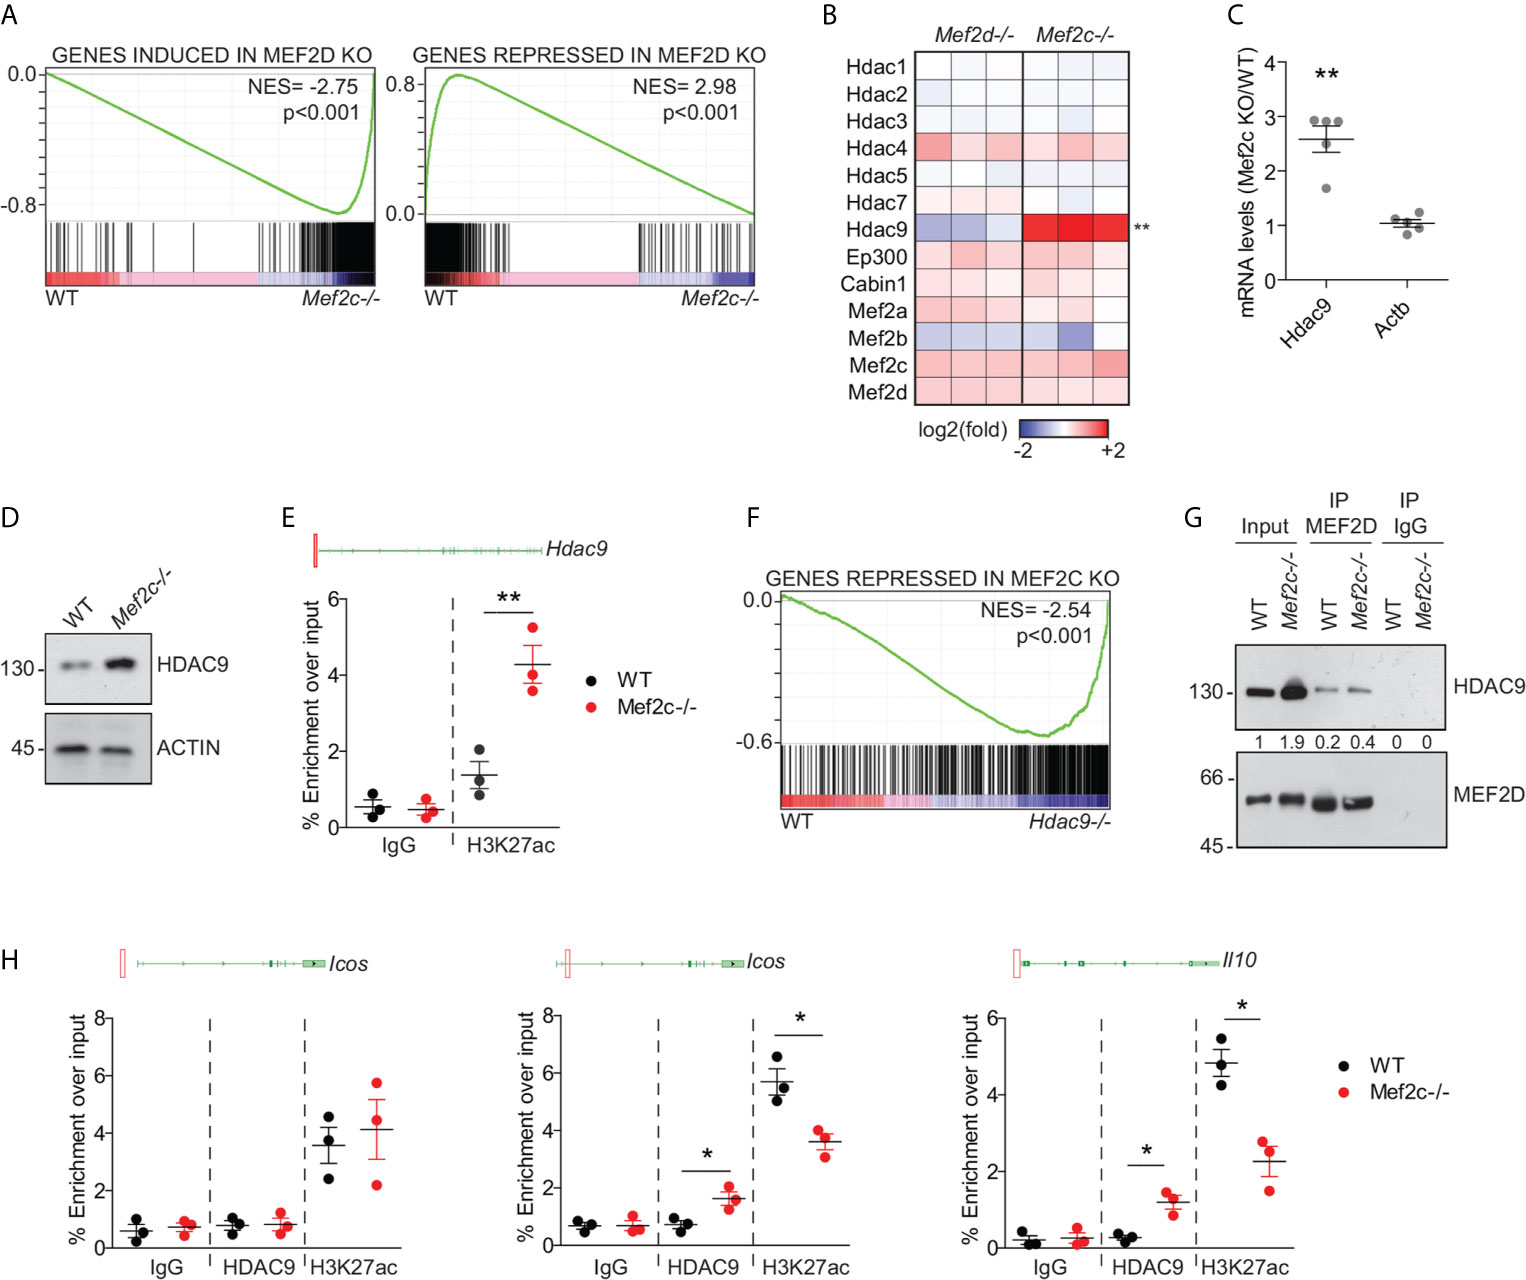
Figure 3 Mef2c depletion switches on Hdac9 transcription and triggers a feedback response that limits the transcriptional activity of Mef2d. (A) GSEA plots obtained by using the transcripts significantly induced (left) or repressed (right) in Mef2d-/- Tregs (18) as gene-sets and the transcriptome of WT or Mef2c-/- Tregs as dataset. (B) Heat-map representing the z-scores of the indicated transcripts in Mef2d-/- and Mef2c-/- Tregs in respect to WT Tregs. (C) mRNA expression levels of the indicated genes, expressed as a ratio between Mef2c-/- and WT Tregs (t-test between the two groups for each gene, n = 5, **p < 0.01). (D) Immunoblot analysis of HDAC9 in WT and Mef2c-/- Tregs, as indicated. Actin was used as loading control. (E) Histogram representing the qPCR results obtained in freshly isolated WT and Mef2c-/- Tregs after the ChIP with H3K27ac or IgG antibodies. Above the histogram we included the representation of the genomic locus of Hdac9. The red square indicates the position of the amplified region in respect to the leading TSS (n = 3, **p < 0.01). (F) GSEA plot obtained by using the transcripts significantly repressed in Mef2c-/- Tregs as gene-set and the transcriptome of WT or Hdac9-/- Tregs (33) as dataset. (G) Lysates from freshly isolated WT or Mef2c-/- Tregs were pulled down with anti-Mef2or IgG Ab (1μg). 1/50 total lysates have been included and marked as input. (H) Histogram representing the qPCR results obtained in freshly isolated WT and Mef2c-/- Tregs after the ChIP with the indicated antibodies. For each gene analyzed, we included the illustration of the genomic locus in which the red squares point to the position of the amplified region in respect to the leading TSS (n = 3, *p < 0.05).
Increased levels of Hdac9 can flip the balance of protein complexes assembled on Mef2d, thus altering its transcriptional effects (23, 38, 39). Indeed, most of the transcripts repressed in Mef2c-/- Tregs (Figure 3F) were upregulated in Hdac9-/- Tregs (33, 40). Levels of Mef2d engaged in protein complexes with Hdac9 in Mef2c-/- Tregs were almost double that of WT Tregs (Figure 3G). In Mef2c-/- Tregs, this resulted in the establishment of a repressive chromatin at the level of the Mef2d-bound (18) regulative elements of Icos and IL-10 (Figure 3H). The co-occurrence of Hdac9 binding suggests, but does not directly prove, its involvement in decreasing the acetylation of H3K27 on these loci (Figure 3H). These data suggest that the release of Hdac9 transcription achieved after Mef2c KO could be involved in the establishment of repressive complexes on Mef2d, thus leading to the perturbation of eTreg properties, similarly to what we reported for Mef2d-/- Tregs (18).
Mef2c Deletion Dampens Treg Function In Vivo
We used two animal models to assess the effects of Mef2c deletion on Treg suppressive functions in vivo.
First, we performed cardiac allografting using BALB/c donors and WT or Mef2c-/- C57BL/6 recipients in the presence of co-stimulation blockade with CD154 mAb/DST (Figure 4A) (24). While co-stimulation blockade induced long-term allograft survival (>100 d) in WT recipients, acute rejection was observed in Mef2c-/- recipients (p<0.01) (Figure 4B). This was unexpected, given that Mef2c deletion had led to increased Treg suppressive function in vitro (Figure 1). Nevertheless, histologic comparison of grafts harvested from the 2 groups at 21 days post-transplant showed only focal interstitial infiltrates in WT recipients but dense mononuclear infiltrates with multifocal myocyte necrosis and vascular injury in conditionally deleted Mef2c-/- recipients (Figure 4C); such Mef2c-associated pathology is very similar to that seen previously following Mef2d deletion in Foxp3+ Treg cells (18). Using real-time qPCR, we compared intragraft gene expression at the 21 days post-transplant time-point in WT vs. Mef2c-/- recipients. The levels of CD4, CD8, CD19 and Foxp3 were comparable between groups, as was IL-2 expression, but Mef2c-/- recipients had increased intragraft expression of IFN-γ, granzyme-B and Ctla4 (Figure 4D). Hence our in vivo allograft studies are consistent with conditional deletion of Mef2c leading to impaired Treg function.
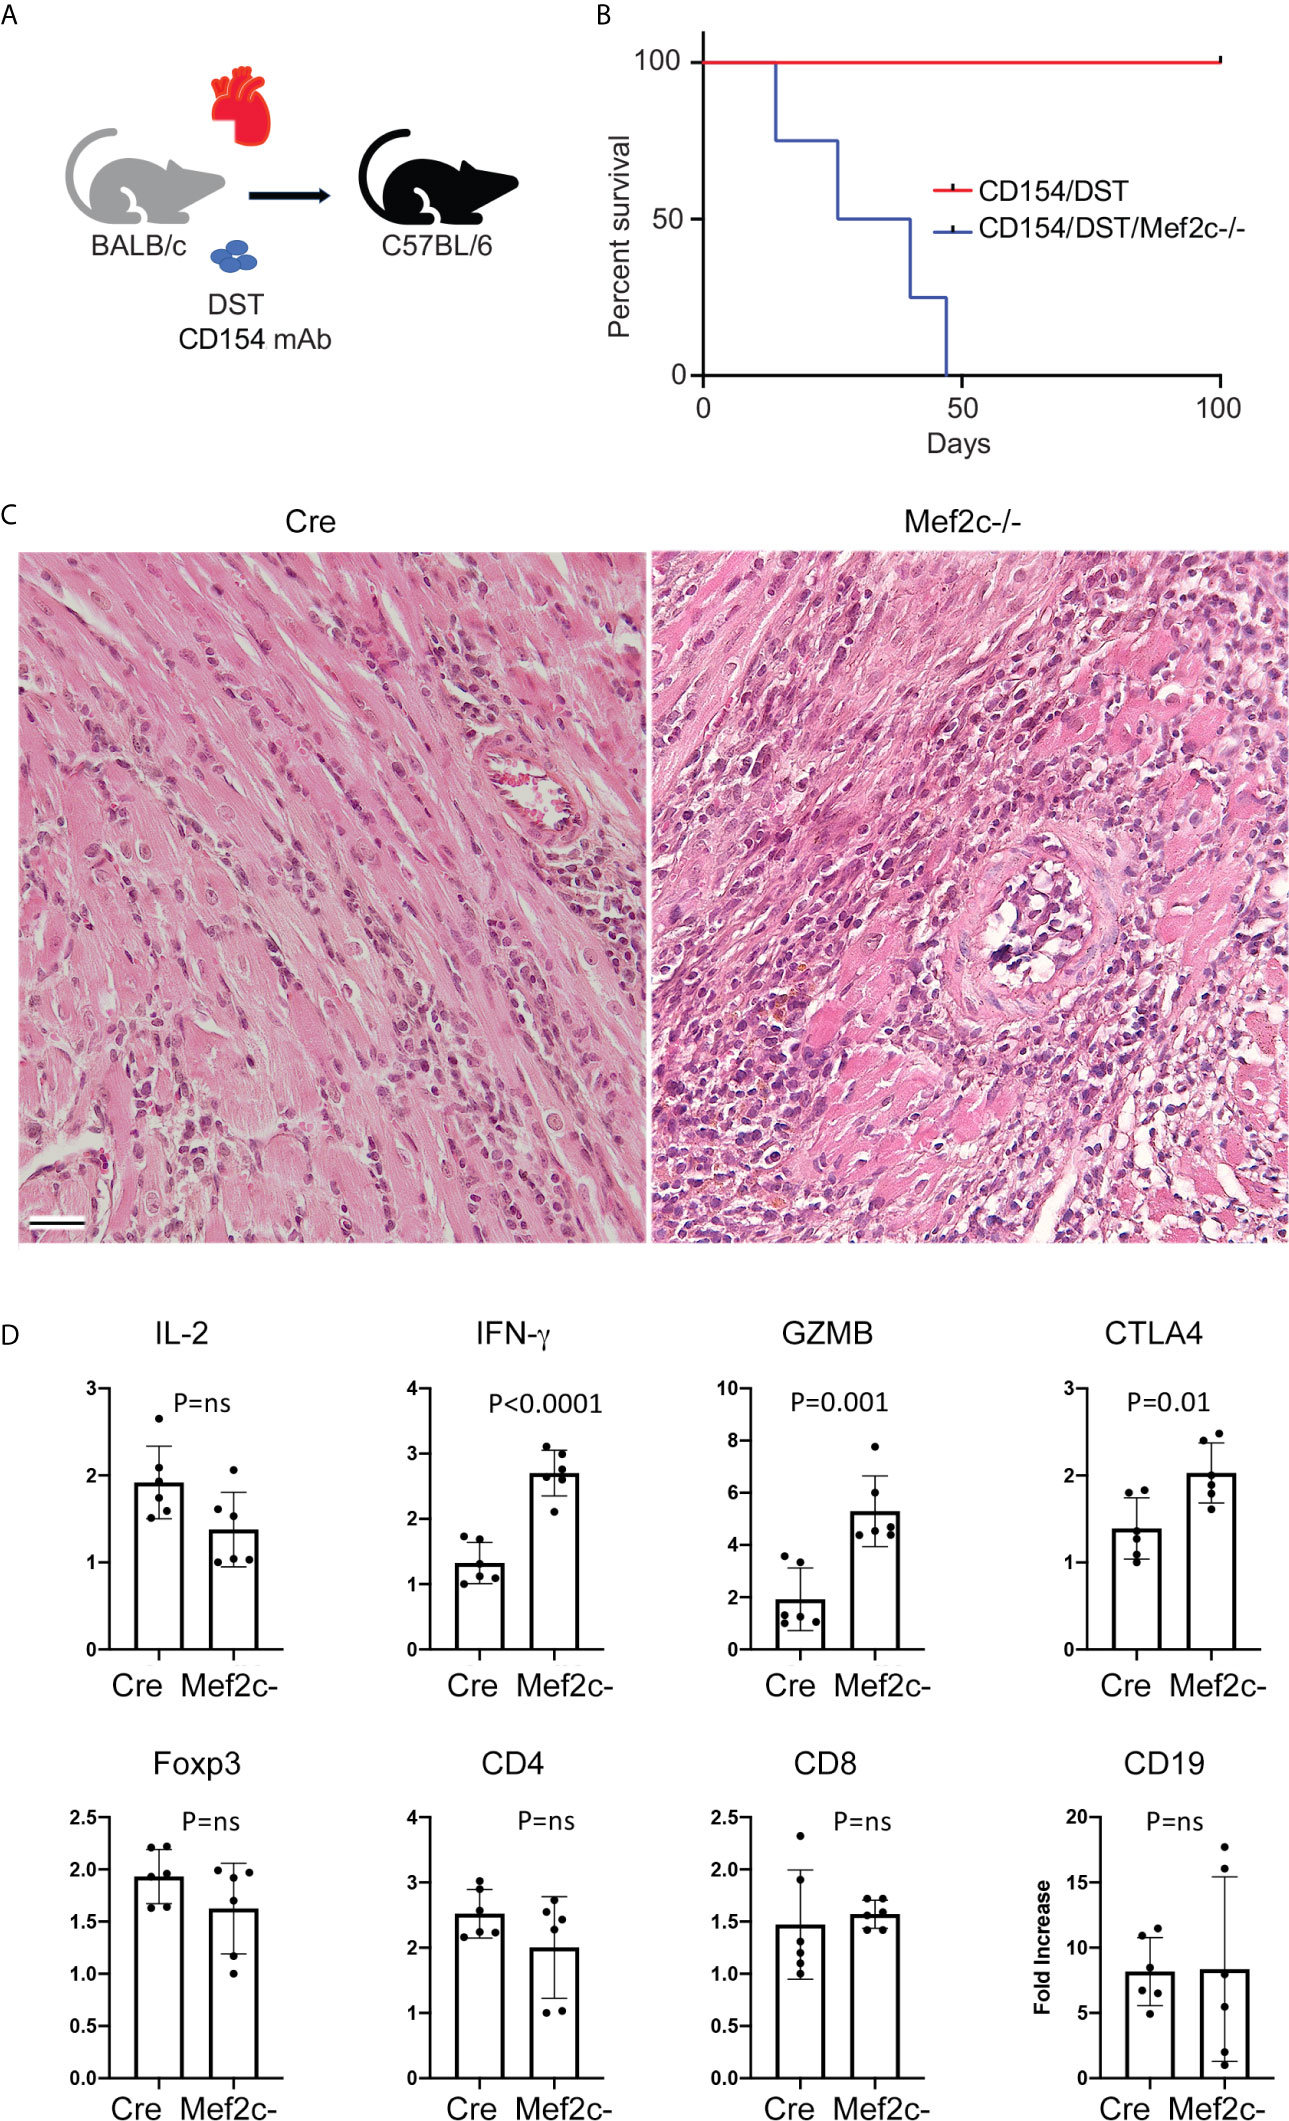
Figure 4 Mef2c deletion dampens Treg function in vivo. (A) Schematic illustrating cardiac allografting procedure. (B) Differently from WT recipients, Mef2c-/- mice acutely rejected cardiac allografts (BALB/c->C57BL/6) despite costimulation blockade with CD154 mAb/DST; n = 5/group (Tukey’s multiple comparison test, p < 0.01). The cardiac allografting was repeated twice with similar results. (C) Histology of transplanted hearts show focal interstitial infiltrates in WT recipients (Cre) and dense mononuclear infiltrates with multifocal myocyte necrosis and vascular injury in conditionally deleted Mef2c-/- recipients (bar = 100 µM). (D) qPCR results of the expression of the indicated genes in samples collected 21 days after cardiac allografting in WT (Cre) and Mef2c–/– mice (n = 6/group). ns, not significant.
Second, we studied the effects of Mef2c deletion on anti-tumor immunity, by using syngeneic models of lung cancer (TC1 tumor cells injected subcutaneously). After the successful engraftment and an initial proliferative phase, the growth of TC1 cells was impaired in Mef2c-/- mice and the tumors were completely cleared in all of the 10 Mef2c-/- mice evaluated (Figure 5A, with individual growth curves shown in Supplementary Figure 2). Equal proportions of CD4+Foxp3+ and CD4+Foxp3+Ctla4+ cells were observed in the draining lymph nodes and spleens of WT and Mef2c-/- mice (Figures 5B, C), while Mef2c-/- Tregs showed impaired production of IL-10 (Figures 5B, C). The fast kinetics of tumor rejection did not allow us to quantify the tumor infiltration of CD4+ and CD8+ cells in Mef2c-/- mice, but we observed higher activation (CD44high/CD62Llow) and greater IFN-γ production by CD4 and CD8 (Figures 5D, E) T cells in the tumor-draining lymph nodes and spleens of Mef2c-/- mice versus WT tumor-bearing mice. As with the allograft data (Figure 4), these tumor studies indicated impaired Treg function in vivo after conditional Mef2c deletion. Together, these data are indicative of a marked impairment of Mef2c-/- Tregs in vivo with characteristics and a magnitude of responses very similar to those described for the conditional deletion of Mef2d (18).
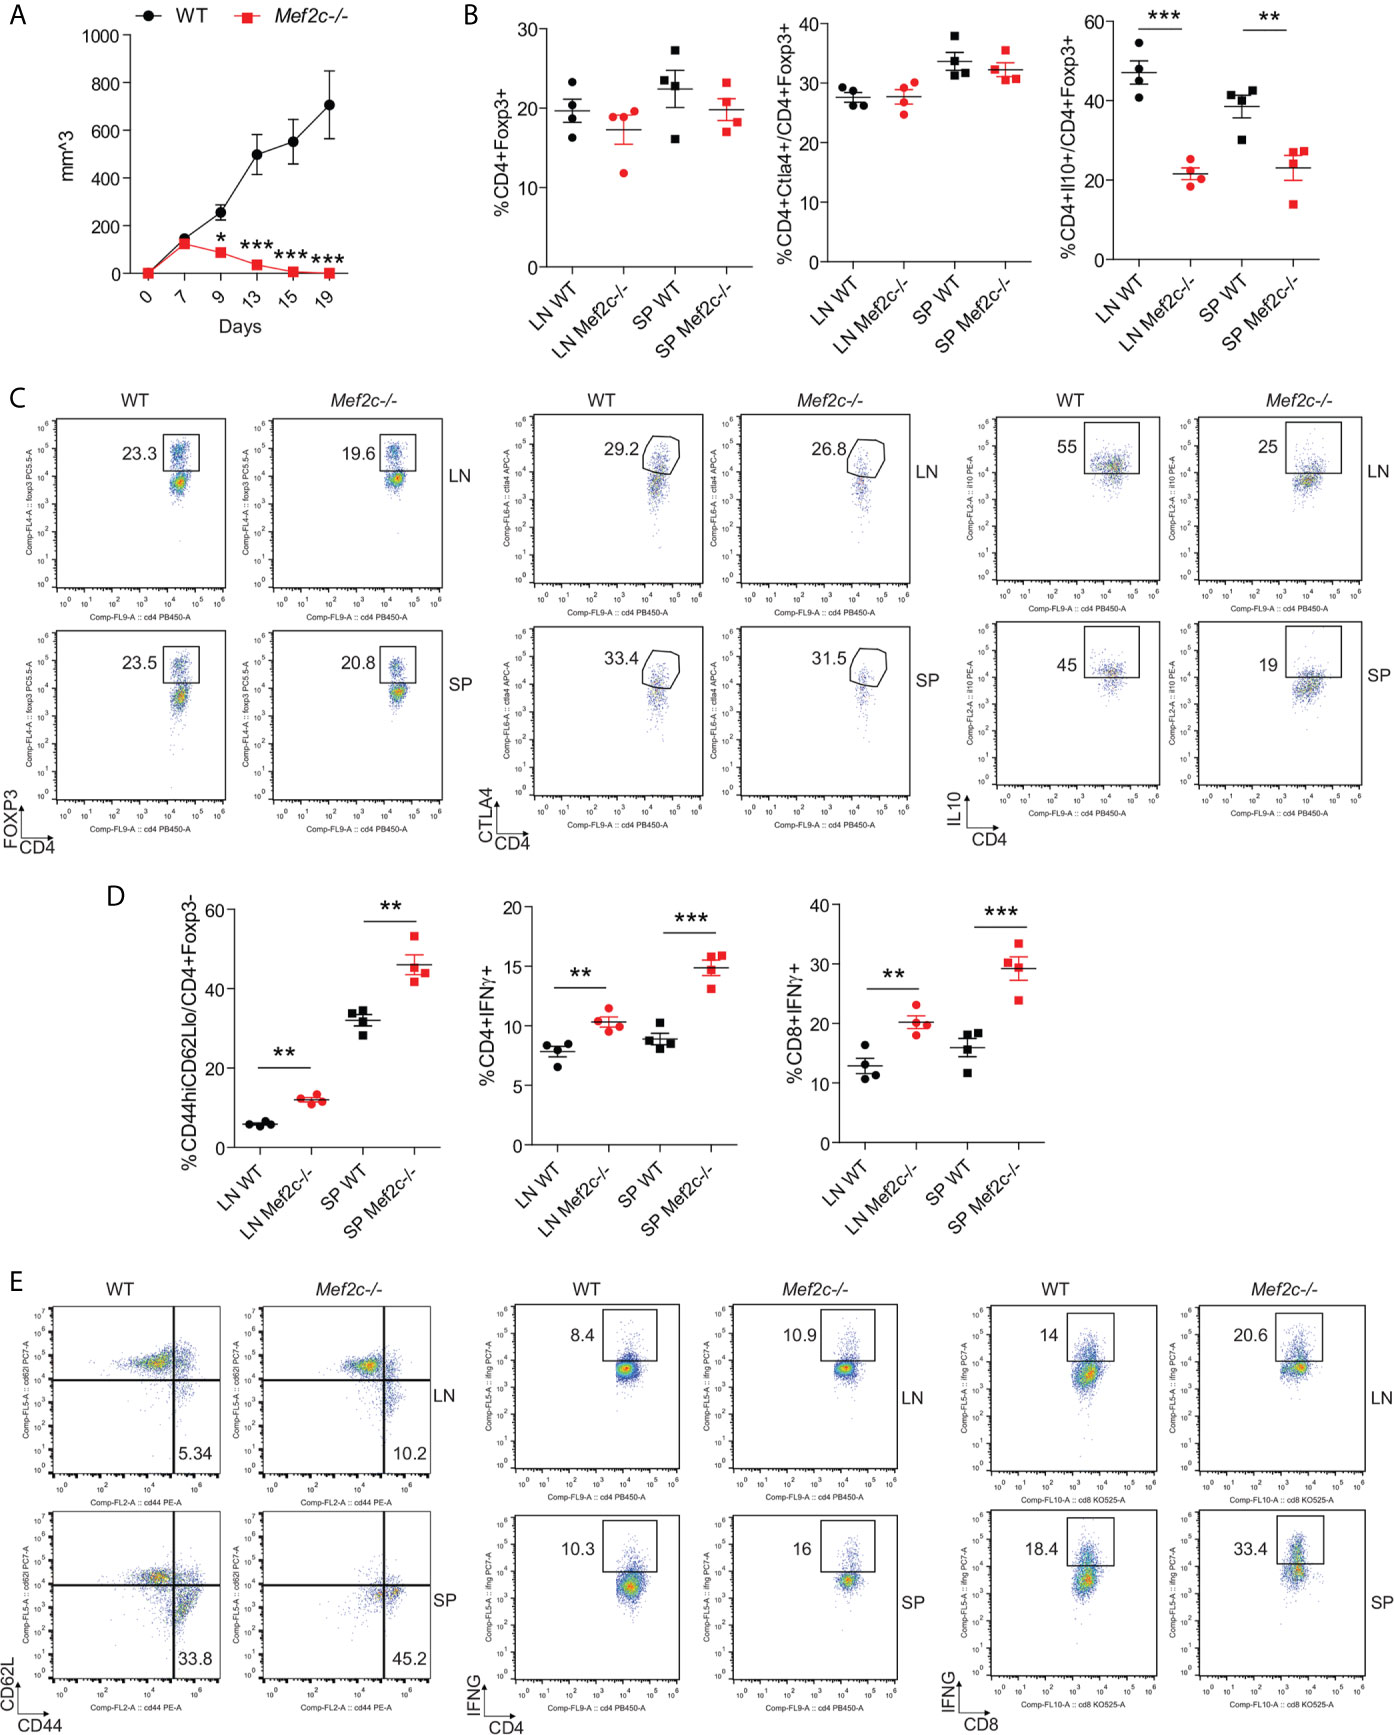
Figure 5 Mef2c deletion in Foxp3+ Tregs promotes anti-cancer immunity. (A) Graphs representing the tumor growth in 10 WT and 10 Mef2c-/- mice during a 19-day-long observation period after the subcutaneous injection of 1.2x10⁶ TC1 cells. The experiment was repeated twice with similar results (t-test between the two groups for each time point, *p < 0.05, ***p < 0.005). (B, C) Analysis of CD4+Foxp3+, CD4+Foxp3+Ctla4+ and CD4+Foxp3+IL-10+ populations in single-cell suspensions obtained from the draining lymph node and spleen harvested from four representative mice injected as in Figure 5. In the case of IL-10 production, isolated cells were stimulated for 4 h with PMA/ionomycin before the staining. (n = 4, t-test between the two groups, **p < 0.01, ***p < 0.005). (D, E) Analysis of the activation status and IFN-γ production in conventional CD4+ T cells and CD8+ T cells in single-cell suspensions obtained from the draining lymph node and spleen harvested from four representative mice injected as in (A). (n = 4, t-test between the two groups, **p < 0.01, ***p < 0.005).
Discussion
While our in vitro analysis suggested Mef2c-/- Tregs have enhanced suppressive function, our molecular, biochemical and in vivo data all clearly point to disruption of normal Treg function upon deletion of Mef2c. Such a disconnect has been reported by us (15) and others (41–43) and is thought to reflect the limitations of the standard in vitro Treg suppression assay. Indeed, the originator of the in vitro Treg suppression assay has reviewed this topic (44), concluding that there are dozens of examples of genes whose deletion in Tregs has differing effects in vitro and in vivo, and that there is major need for improvements to the in vitro assay so as to better predict likely in vivo effects. We conclude that Mef2c is another example of this disconnect and going forward have chosen to focus on the molecular, biochemical and in vivo effects of Mef2c deletion on Treg biology.
The complex and dynamic nature of the protein complexes that dictate Treg identity obey biological, biochemical and epigenetic features that similarly control many other differentiative and adaptive processes (11). Similarly to Foxp3, Mef2 TFs assemble and disassemble dynamically with co-activators and co-repressors to pursue the plastic control of the transcriptional program (19). In Treg cells, Mef2d is required to sustain and integrate the Foxp3 transcriptional repertoire (18); Mef2d deletion in Foxp3+ cells impairs the acquisition of an eTreg phenotype and leads to an increase in anti-cancer immunity and transplant rejection (18). Although Mef2c is expressed at very low levels in Tregs, Mef2c-/- mice rapidly reject heart allografts and restrain cancer growth in syngeneic models, similarly to Mef2d-/- mice. The de-repression of Hdac9 achieved after Mef2c KO plays a central key role in blocking Mef2d responses and Treg immune suppressive functions. Hdac9 is transcribed by Mef2d as part of a physiological feedback aimed at switching-off Mef2d transcriptional program (23, 45). This feedback mechanism is active in Tregs (18) and Hdac9-/- Tregs have increased suppressive functions (33, 46). Interestingly, the strength of this feedback mechanism is altered in some pathological conditions, such as cardiac hypertrophy (47) and cancer (23, 48). However, the genetic and epigenetic factors that regulate this feedback mechanism are not yet known.
Here we have added a new level of complexity to the well-known molecular circuit involving Mef2 TFs and their strongest repressors, the class IIa HDACs. We report the existence of an alternative mechanism through which two different paralogues of Mef2 family, Mef2c and Mef2d, respectively repress and promote Hdac9 transcription. Although we have not yet clarified the detailed mechanism by which Mef2c maintains the repression of Hdac9, a suggestive hypothesis that is corroborated by the first ChIP data is that two antagonist complexes are assembled on Hdac9 promoter: an activator complex bound to Mef2d and a repressive one complexed to Mef2c. The presence of such delicate balances underlines the central role played by Mef2 TFs in supporting Treg identity and encourages further studies to clarify the molecular details of these interactions.
Data Availability Statement
The datasets presented in this study can be found in online repositories. The names of the repository/repositories and accession number(s) can be found below: https://www.ncbi.nlm.nih.gov/, GSE139480.
Ethics Statement
Animal studies were approved by the Institutional Animal Care and Use Committee of the Children’s Hospital of Philadelphia (protocols 17-001047 and 19-000561).
Author Contributions
EG designed and performed experiments, analyzed data and drafted the manuscript. LW performed cardiac allografts, performed experiments, and analyzed data. YX performed experiments and analyzed data. LC performed experiments and analyzed data. TA performed experiments and analyzed data. RH provided technical assistance. AB performed experiments. MT provided technical support. CB analyzed data. UB provided assistance with RNA-seq studies. WH analyzed data and oversaw the experimental design and writing of the manuscript. All authors contributed to the article and approved the submitted version.
Funding
This work was supported by NIH grants R01 AI12324 and R01 CA177852 (to WH). EG received a “Fondazione Umberto Veronesi Fellowship”.
Conflict of Interest
The authors declare that the research was conducted in the absence of any commercial or financial relationships that could be construed as a potential conflict of interest.
Supplementary Material
The Supplementary Material for this article can be found online at: https://www.frontiersin.org/articles/10.3389/fimmu.2021.703632/full#supplementary-material
Supplementary Figure 1 | Treg suppression assays showing proliferation of CD4 T cell responders (upper panel) and CD8 T cell responders (low panel). These are from the same experiment performed in triplicate (Trial 2) as shown in Figure 1F (total T cell responders). These experiments were repeated two times by using three mice per group.
Supplementary Figure 2 | Mef2c deletion promotes anti-cancer immunity. Graphs representing the detailed tumor growth data for each of the 10 WT and 10 Mef2c-/- mice during a 19-day-long observation period after the subcutaneous injection of 1.2x10⁶ TC1 cells. The experiment was repeated twice with comparable results.
References
1. Takeuchi Y, Nishikawa H. Roles of Regulatory T Cells in Cancer Immunity. Int Immunol (2016) 28(8):401–9. doi: 10.1093/Intimm/Dxw025
2. Romano M, Fanelli G, Albany CJ, Giganti G, Lombardi G. Past, Present, and Future of Regulatory T Cell Therapy in Transplantation and Autoimmunity. Front Immunol (2019) 10:43. doi: 10.3389/Fimmu.2019.00043
3. Shevyrev D, Tereshchenko V. Treg Heterogeneity, Function, and Homeostasis. Front Immunol (2019) 10:3100. doi: 10.3389/Fimmu.2019.03100
4. Brunkow ME, Jeffery EW, Hjerrild KA, Paeper B, Clark LB, Yasayko SA, et al. Disruption of a New Forkhead/Winged-Helix Protein, Scurfin, Results in the Fatal Lymphoproliferative Disorder of the Scurfy Mouse. Nat Genet (2001) 27(1):68–73. doi: 10.1038/83784
5. Bennett CL, Christie J, Ramsdell F, Brunkow ME, Ferguson PJ, Whitesell L, et al. The Immune Dysregulation, Polyendocrinopathy, Enteropathy, X-Linked Syndrome (Ipex) is Caused by Mutations of Foxp3. Nat Genet (2001) 27(1):20–1. doi: 10.1038/83713
6. Khattri R, Kasprowicz D, Cox T, Mortrud M, Appleby MW, Brunkow ME, et al. The Amount of Scurfin Protein Determines Peripheral T Cell Number and Responsiveness. J Immunol (2001) 167(11):6312–20. doi: 10.4049/jimmunol.167.11.6312
7. Ohkura N, Kitagawa Y, Sakaguchi S. Development and Maintenance of Regulatory T Cells. Immunity (2013) 38(3):414–23. doi: 10.1016/J.Immuni.2013.03.002
8. Bluestone JA. Foxp3, the Transcription Factor at the Heart of the Rebirth of Immune Tolerance. J Immunol (2017) 198(3):979–80. doi: 10.4049/Jimmunol.1602060
9. Colamatteo A, Carbone F, Bruzzaniti S, Galgani M, Fusco C, Maniscalco GT, et al. Molecular Mechanisms Controlling Foxp3 Expression in Health and Autoimmunity: From Epigenetic to Post-Translational Regulation. Front Immunol (2019) 10:3136. doi: 10.3389/Fimmu.2019.03136
10. Rudra D, Deroos P, Chaudhry A, Niec RE, Arvey A, Samstein RM, et al. Transcription Factor Foxp3 and its Protein Partners Form a Complex Regulatory Network. Nat Immunol (2012) 13(10):1010–9. doi: 10.1038/Ni.2402
11. Kwon HK, Chen HM, Mathis D, Benoist C. Different Molecular Complexes That Mediate Transcriptional Induction and Repression by Foxp3. Nat Immunol (2017) 18(11):1238–48. doi: 10.1038/Ni.3835
12. Samstein RM, Arvey A, Josefowicz SZ, Peng X, Reynolds A, Sandstrom R, et al. Foxp3 Exploits a Pre-Existent Enhancer Landscape for Regulatory T Cell Lineage Specification. Cell (2012) 151(1):153–66. doi: 10.1016/J.Cell.2012.06.053
13. Samanta A, Li B, Song X, Bembas K, Zhang G, Katsumata M, et al. Tgf-Beta and Il-6 Signals Modulate Chromatin Binding and Promoter Occupancy by Acetylated Foxp3. Proc Natl Acad Sci USA (2008) 105(37):14023–7. doi: 10.1073/Pnas.0806726105
14. Ren J, Han L, Tang J, Liu Y, Deng X, Liu Q, et al. Foxp1 is Critical for the Maintenance of Regulatory T-Cell Homeostasis and Suppressive Function. PloS Biol (2019) 17(5):E3000270. doi: 10.1371/Journal.Pbio.3000270
15. Xiong Y, Wang L, Di Giorgio E, Akimova T, Beier UH, Han R, et al. Inhibiting the Coregulator Corest Impairs Foxp3+ Treg Function and Promotes Antitumor Immunity. J Clin Invest (2020) 130(4):1830–42. doi: 10.1172/Jci131375
16. Alvisi G, Brummelman J, Puccio S, Mazza EM, Tomada EP, Losurdo A, et al. Irf4 Instructs Effector Treg Differentiation and Immune Suppression in Human Cancer. J Clin Invest (2020) 130(6):3137–50. doi: 10.1172/Jci130426
17. Sidwell T, Liao Y, Garnham AL, Vasanthakumar A, Gloury R, Blume J, et al. Attenuation of Tcr-Induced Transcription by Bach2 Controls Regulatory T Cell Differentiation and Homeostasis. Nat Commun (2020) 11(1):252. doi: 10.1038/S41467-019-14112-2
18. Di Giorgio E, Wang L, Xiong Y, Akimova T, Christensen LM, Han R, et al. Mef2d Sustains Activation of Effector Foxp3+ Tregs During Transplant Survival and Anticancer Immunity. J Clin Invest (2020) 130(12):6242–60. doi: 10.1172/Jci135486130
19. Potthoff MJ, Olson EN. Mef2: A Central Regulator of Diverse Developmental Programs. Development (2007) 134(23):4131–40. doi: 10.1242/Dev.008367
20. Di Giorgio E, Hancock WW, Brancolini C. Mef2 and the Tumorigenic Process, Hic Sunt Leones. Biochim Biophys Acta Rev Cancer (2018) 1870(2):261–73. doi: 10.1016/J.Bbcan.2018.05.007
21. Rubtsov YP, Rasmussen JP, Chi EY, Fontenot J, Castelli L, Ye X, et al. Regulatory T Cell-Derived Interleukin-10 Limits Inflammation at Environmental Interfaces. Immunity (2008) 28(4):546–58. doi: 10.1016/J.Immuni.2008.02.017
22. Arnold MA, Kim Y, Czubryt MP, Phan D, Mcanally J, Qi X, et al. Mef2c Transcription Factor Controls Chondrocyte Hypertrophy and Bone Development. Dev Cell (2007) 12(3):377–89. doi: 10.1016/J.Devcel.2007.02.004
23. Di Giorgio E, Dalla E, Franforte E, Paluvai H, Minisini M, Trevisanut M, et al. Different Class Iia Hdacs Repressive Complexes Regulate Specific Epigenetic Responses Related to Cell Survival in Leiomyosarcoma Cells. Nucleic Acids Res (2020) 48(2):646–64. doi: 10.1093/Nar/Gkz1120
24. Hancock WW, Sayegh MH, Zheng XG, Peach R, Linsley PS, Turka LA. Costimulatory Function and Expression of Cd40 Ligand, Cd80, and Cd86 in Vascularized Murine Cardiac Allograft Rejection. Proc Natl Acad Sci USA (1996) 93(24):13967–72. doi: 10.1073/pnas.93.24.13967
25. Di Giorgio E, Gagliostro E, Clocchiatti A, Brancolini C. The Control Operated by the Cell Cycle Machinery on Mef2 Stability Contributes to the Downregulation of Cdkn1a and Entry Into s Phase. Mol Cell Biol (2015) 35(9):1633–47. doi: 10.1128/Mcb.01461-14
26. Subramanian A, Tamayo P, Mootha VK, Mukherjee S, Ebert BL, Gillette MA, et al. Gene Set Enrichment Analysis: A Knowledge-Based Approach for Interpreting Genome-Wide Expression Profiles. Proc Natl Acad Sci USA (2005) 102(43):15545–50. doi: 10.1073/Pnas.0506580102
27. Di Giorgio E, Franforte E, Cefalu S, Rossi S, Dei Tos AP, Brenca M, et al. The Co-Existence of Transcriptional Activator and Transcriptional Repressor Mef2 Complexes Influences Tumor Aggressiveness. PloS Genet (2017) 13(4):E1006752. doi: 10.1371/Journal.Pgen.1006752
28. Lin KY, Guarnieri FG, Staveley-O’carroll KF, Levitsky HI, August JT, Pardoll DM, et al. Treatment of Established Tumors With a Novel Vaccine That Enhances Major Histocompatibility Class Ii Presentation of Tumor Antigen. Cancer Res (1996) 56(1):21–6.
29. Majidi SP, Reddy NC, Moore MJ, Chen H, Yamada T, Andzelm MM, et al. Chromatin Environment and Cellular Context Specify Compensatory Activity of Paralogous Mef2 Transcription Factors. Cell Rep (2019) 29(7):2001–2015 E5. doi: 10.1016/J.Celrep.2019.10.033
30. Lu YW, Martino N, Gerlach BD, Lamar JM, Vincent PA, Adam AP, et al. Mef2 (Myocyte Enhancer Factor 2) Is Essential for Endothelial Homeostasis and the Atheroprotective Gene Expression Program. Arterioscler Thromb Vasc Biol (2021) 41(3):1105–23. doi: 10.1161/Atvbaha.120.314978
31. Estrella NL, Desjardins CA, Nocco SE, Clark AL, Maksimenko Y, Naya FJ. Mef2 Transcription Factors Regulate Distinct Gene Programs in Mammalian Skeletal Muscle Differentiation. J Biol Chem (2015) 290(2):1256–68. doi: 10.1074/Jbc.M114.589838
32. Desjardins CA, Naya FJ. Antagonistic Regulation of Cell-Cycle and Differentiation Gene Programs in Neonatal Cardiomyocytes by Homologous Mef2 Transcription Factors. J Biol Chem (2017) 292(25):10613–29. doi: 10.1074/Jbc.M117.776153
33. De Zoeten EF, Wang L, Sai H, Dillmann WH, Hancock WW. Inhibition of Hdac9 Increases T Regulatory Cell Function and Prevents Colitis in Mice. Gastroenterology (2010) 138:583–94. doi: 10.1053/j.gastro.2009.10.037
34. Kong NR, Davis M, Chai L, Winoto A, Tjian R. Mef2c and Ebf1 Co-Regulate B Cell-Specific Transcription. PloS Genet (2016) 12(2):E1005845. doi: 10.1371/Journal.Pgen.1005845
35. Herglotz J, Unrau L, Hauschildt F, Fischer M, Kriebitzsch N, Alawi M, et al. Essential Control of Early B-Cell Development by Mef2 Transcription Factors. Blood (2016) 127(5):572–81. doi: 10.1182/Blood-2015-04-643270
36. Brescia P, Schneider C, Holmes AB, Shen Q, Hussein S, Pasqualucci L, et al. Mef2b Instructs Germinal Center Development and Acts as an Oncogene in B Cell Lymphomagenesis. Cancer Cell (2018) 34(3):453–65.E9. doi: 10.1016/J.Ccell.2018.08.006
37. Sebastian S, Faralli H, Yao Z, Rakopoulos P, Palii C, Cao Y, et al. Tissue-Specific Splicing of a Ubiquitously Expressed Transcription Factor is Essential for Muscle Differentiation. Genes Dev (2013) 27(11):1247–59. doi: 10.1101/Gad.215400.113
38. Rastogi B, Raut SK, Panda NK, Rattan V, Radotra BD, Khullar M. Overexpression of Hdac9 Promotes Oral Squamous Cell Carcinoma Growth, Regulates Cell Cycle Progression, and Inhibits Apoptosis. Mol Cell Biochem (2016) 415(1-2):183–96. doi: 10.1007/S11010-016-2690-5
39. Zhang CL, Mckinsey TA, Chang S, Antos CL, Hill JA, Olson EN. Class Ii Histone Deacetylases Act as Signal-Responsive Repressors of Cardiac Hypertrophy. Cell (2002) 110(4):479–88. doi: 10.1016/s0092-8674(02)00861-9.
40. Beier UH, Angelin A, Akimova T, Wang L, Liu Y, Xiao H, et al. Essential Role of Mitochondrial Energy Metabolism in Foxp3(+) T-Regulatory Cell Function and Allograft Survival. FASEB J (2015) 29(6):2315–26. doi: 10.1096/Fj.14-268409
41. Schmidt A, Oberle N, Krammer PH. Molecular Mechanisms of Treg-Mediated T Cell Suppression. Front Immunol (2012) 3:51. doi: 10.3389/Fimmu.2012.00051
42. Han S, Toker A, Liu ZQ, Ohashi PS. Turning the Tide Against Regulatory T Cells. Front Oncol (2019) 9:279. doi: 10.3389/Fonc.2019.00279
43. Gokhale AS, Gangaplara A, Lopez-Occasio M, Thornton AM, Shevach EM. Selective Deletion of Eos (Ikzf4) in T-Regulatory Cells Leads to Loss of Suppressive Function and Development of Systemic Autoimmunity. J Autoimmun (2019) 105:102300. doi: 10.1016/J.Jaut.2019.06.011
44. Shevach EM. Foxp3(+) T Regulatory Cells: Still Many Unanswered Questions-a Perspective After 20 Years of Study. Front Immunol (2018) 9:1048. doi: 10.3389/Fimmu.2018.01048
45. Haberland M, Arnold MA, Mcanally J, Phan D, Kim Y, Olson EN. Regulation of Hdac9 Gene Expression by Mef2 Establishes a Negative-Feedback Loop in the Transcriptional Circuitry of Muscle Differentiation. Mol Cell Biol (2007) 27(2):518–25. doi: 10.1128/Mcb.01415-06
46. Tao R, De Zoeten EF, Ozkaynak E, Chen C, Wang L, Porrett PM, et al. Deacetylase Inhibition Promotes the Generation and Function of Regulatory T Cells. Nat Med (2007) 13(11):1299–307. doi: 10.1038/Nm1652
47. Zhang J, Liang Y, Huang X, Guo X, Liu Y, Zhong J, et al. Stat3-Induced Upregulation of Lncrna Meg3 Regulates the Growth of Cardiac Hypertrophy Through Mir-361-5p/Hdac9 Axis. Sci Rep (2019) 9(1):460. doi: 10.1038/S41598-018-36369-1
Keywords: Mef2c, Mef2d, IL-10, Icos, anti-cancer immunity, Treg
Citation: Di Giorgio E, Wang L, Xiong Y, Christensen LM, Akimova T, Han R, Samanta A, Trevisanut M, Brancolini C, Beier UH and Hancock WW (2021) A Biological Circuit Involving Mef2c, Mef2d, and Hdac9 Controls the Immunosuppressive Functions of CD4+Foxp3+ T-Regulatory Cells. Front. Immunol. 12:703632. doi: 10.3389/fimmu.2021.703632
Received: 30 April 2021; Accepted: 09 June 2021;
Published: 05 July 2021.
Edited by:
José Manuel González-Navajas, Hospital General Universitario de Alicante, SpainReviewed by:
Buka Samten, The University of Texas Health Science Center at Tyler, United StatesNoelia Casares, University of Navarre, Spain
Copyright © 2021 Di Giorgio, Wang, Xiong, Christensen, Akimova, Han, Samanta, Trevisanut, Brancolini, Beier and Hancock. This is an open-access article distributed under the terms of the Creative Commons Attribution License (CC BY). The use, distribution or reproduction in other forums is permitted, provided the original author(s) and the copyright owner(s) are credited and that the original publication in this journal is cited, in accordance with accepted academic practice. No use, distribution or reproduction is permitted which does not comply with these terms.
*Correspondence: Wayne W. Hancock, d2hhbmNvY2tAcGVubm1lZGljaW5lLnVwZW5uLmVkdQ==
†These authors have contributed equally to this work and share first authorship