 Ye Liu1
 Huiming Zhang2
 Tian-Xiang Zhang1Meng Yuan1Chen Du1Pei Zeng1Zhenning Huang1Dongmei Jia1Guili Yang1
 Fu-Dong Shi1,3
 Chao Zhang1,3*
- 1Department of Neurology, Tianjin Medical University General Hospital, Tianjin Neurological Institute, Key Laboratory of Post-Trauma Neuro-Repair and Regeneration in Central Nervous System, Ministry of Education, Tianjin Key Laboratory of Injuries, Variations and Regeneration of Nervous System, Tianjin, China
- 2Department of Neurology, The Third People’s Hospital of Datong, Datong, China
- 3Jing-Jin Center for Neuroinflammation, China National Clinical Research Center for Neurological Diseases, Beijing Key Laboratory of Translational Medicine for Cerebrovascular Disease, Beijing Tiantan Hospital, Capital Medical University, Beijing, China
Tocilizumab, a humanized anti-IL-6 receptor monoclonal antibody, showed its therapeutic efficacy on neuromyelitis optica spectrum disorder (NMOSD). To assess the immunological effects of this drug on B cells, follicular T helper (Tfh) cells, and peripheral T helper (Tph) cells in patients with NMOSD, peripheral B cell and Tfh cell phenotypes were evaluated in 26 patients with NMOSD before and after tocilizumab treatment by nine-color flow cytometry, as well as the expression of costimulatory and co-inhibitory molecules on B cells. Results showed that the frequency of CD27+IgD− switched memory B cells, CD27-IgD- double-negative B cells, and CD27highCD38high antibody-secreting cells was increased in patients with NMOSD. Tocilizumab treatment led to a significant shift of B cells to naïve B cells from memory B cells after 3 months. Three markers on B cells associated with T-cell activation (i.e., CD86 CD69, and HLA-DR) were downregulated after tocilizumab treatment. The frequencies of total Tfh and Tph cells were decreased, whereas that of follicular regulatory T cells tended to increase. Intrinsic increased PD-L1 and PD-L2 expression was characteristic of B cells in patients with NMOSD. Tocilizumab selectively restored PD-L1 on B-cell subsets. These results provided evidence that tocilizumab enhanced B- and T-cell homoeostasis by regulating B-cell differentiation and inhibiting lymphocyte activation in patients with NMOSD.
Introduction
Neuromyelitis optica spectrum disorder (NMOSD) is an autoimmune inflammatory disease of the central nervous system involving pathogenic autoantibodies against aquaporin-4 (AQP4-IgG) (1, 2). Imbalances in B- and T-cell homoeostasis have been investigated. Among these, autoreactive B-cell subsets and loss of anergic maintenance may affect disease activity (3–5). The function of B cells is involved in antigen presentation, pro-inflammatory and anti-inflammatory cytokine production and immunoglobulin production. Circulating B cell subtypes include naïve B cells (CD19+CD27-IgD+) and 3 kinds of memory B cells, namely unswitched memory B cells (USW, CD19+CD27+IgD+IgM+), switched memory B (SWM, CD19+CD27+IgD-IgM-), double-negative (DN, CD19+CD27-IgD-) (3). Follicular T helper (Tfh) cells are critical in promoting B-cell autoimmunity and autoantibody production (6). In addition, peripheral helper T (Tph) cells was first defined with the markers of CD4+PD-1highCXCR5-. These cells expressed indispensable cytokines that enable B-cell help, including IL-21, CXCL13, ICOS, and MAF. Like Tfh cells, Tph cells can also induce plasma cell differentiation in vitro through IL-21 secretion and SLAMF5 interaction. Different from Tfh cells, Tph cells have unique expression of chemokine receptors (such as CCR2, CX3CR1, and CCR5) that direct migration to inflamed sites (7). However, the dynamics of Tph cells in NMOSD remain unclear. Specifically, AQP4-specific T cells are expanded in patients with NMOSD and exhibit pro-inflammatory Th17 polarization (8, 9).
Co-inhibitory signals characteristic of programmed cell death 1 (PD-1) are expressed on T cells as feedback for activated responses (10, 11). Engagement of PD-1 ligand 1 (PD-L1) and 2 (PD-L2) also plays important regulatory roles in immune responses (12). However, little is known about the kinetics of PD-1, PD-L1, and PD-L2 expression on B cells from patients with NMOSD.
Pleiotropic pro-inflammatory interleukin (IL)-6 drives disease activity and may contribute to abnormalities in B and T cells (13). Therapeutic agents targeting the IL-6 axis are effective in settings of acute and chronic inflammation (14). Recently, we reported a phase 2 randomized controlled trial showing that tocilizumab, a humanized anti-IL-6 receptor monoclonal antibody (mAb), significantly reduced the risk of relapse compared to azathioprine in NMOSD. Tocilizumab also decreases serum AQP4-IgG titers in patients with highly active NMOSD (15). However, the underlying effects of tocilizumab treatment on circulating B and T cells are unclear. Accordingly, in this study, we performed a detailed analysis of immunological phenotypes in B and T cells before and after tocilizumab treatment in patients with NMOSD.
Material and Methods
Recruitment and Enrollment of Patients and Controls
Patients with NMOSD were diagnosed according to 2015 International Panel for Neuromyelitis Optica Diagnosis criteria. Patients who received tocilizumab treatment at Tianjin Medical University General Hospital between November 2017 and May 2019 were enrolled. The inclusion criteria in this study were as follows: those who received routine infusion of tocilizumab at a dose of 8 mg/kg every 4 weeks for at least 3 months. At study entry, patients were permitted to continue the baseline treatment of corticosteroids. The exclusion criteria were as follows: 1) patients who were concomitantly treated with oral immunosuppressants, such as azathioprine, mycophenolate mofetil, and tacrolimus; and 2) patients who received rituximab treatment for less than 6 months from initial tocilizumab infusion. We also included 20 age- and sex-matched healthy controls (HCs) who had no malignancy or autoimmune disorder and did not receive immunosuppressive therapy. The Institutional Review Board of Tianjin Medical University General Hospital reviewed and approved this study. Each participant provided written informed consent.
Flow Cytometry Analysis
All patients who received routine tocilizumab treatment were registered for immunophenotyping analysis. Peripheral blood was collected at baseline, 1 month, and 3 months after initiation of treatment. All fresh samples were immediately processed. Briefly, peripheral blood mononuclear cells (PBMCs) were prepared by density-gradient centrifugation, resuspended in phosphate-buffered saline (PBS)/3% human IgG (Bax International Inc., Vienna, Austria) to block Fc receptors and prevent nonspecific antibody binding, and then incubated for 15 min at 4°C in the dark. Subsequently, the cells were washed with PBS containing 1% bovine serum albumin. Background fluorescence was assessed using appropriate isotype- and fluorochrome-matched control mAbs.
To analyze the frequency of B-cell subpopulations, PBMCs were stained with allophycocyanin (APC) anti-human CD19 antibodies (clone HIB19), phycoerythrin (PE)/cyanine7 anti-human IgD antibodies (clone IA6-2), Alexa Fluor 488 anti-human CD38 antibodies (clone HIT2), Brilliant Violet 421 anti-human CD27 antibodies (clone M-T271), Alexa Fluor 488 anti-human HLA-DR antibodies (clone L243), APC anti-human CD86 antibodies (clone IT2.2), Brilliant Violet 421 anti-human CD69 antibodies (clone FN50), PE anti-human CD279 (PD-1) antibodies (clone EH12.2H7), APC anti-human CD274 (B7-H1, PD-L1) antibodies (clone 29E.2A3), and PE anti-human CD273 (B7-DC, PD-L2) antibodies (clone 24F.10C12). To characterize T-cell phenotypes, PBMCs were stained with fluorescein isothiocyanate anti-human CD4 antibodies (clone A161A1), Brilliant Violet 421 anti-human CD183 (CXCR3) antibodies (clone G025H7), PE/cyanine7 anti-human CD185 (CXCR5) antibodies (clone J252D4), APC/cyanine7 anti-human CD196 (CCR6) antibodies (clone G034E3), PE anti-human CD25 antibodies (clone BC96), and Brilliant Violet 421 anti-human CD127 (IL-7Rα) antibodies (clone A019D5). All the antibodies were purchased from Biolegend (San Diego, CA, USA).
Prior to the measurements, 1 μL of 300 nM 4′,6-diamidino-2-phenylindole (Invitrogen, Carlsbad, CA, USA) was added to exclude dead cells. The stained samples were assessed by flow cytometry using a FACS Aria III flow cytometer (BD Biosciences, San Jose, CA, USA). The results were analyzed using FlowJo software (version 10).
Statistical Analysis
All statistical analyses were performed using GraphPad Prism v8 and R software. Continuous and ordinal variables are presented with medians (interquartile ranges [IQRs]) or means (standard deviations [SDs] or standard errors of the means [SEMs]). Shapiro-Wilk tests were used to determine whether the variables had a normal distribution. For comparisons between patients and HCs, unpaired, two-tailed Student’s t tests or Mann-Whitney U tests were used. Paired Student’s t tests (parametric) or Wilcoxon matched pairs tests (nonparametric) were used to compare baseline and post-treatment results in patients with NMOSD. For multiple comparisons, the Bonferroni-Dunn adjustment was used for analysis of repeated-measures. P values less than 0.05 were considered significant.
Results
Baseline Characteristics
The baseline characteristics of patients with NMOSD and HCs are described in Table 1. The median age of patients with NMOSD was 49.5 (IQR: 36.5–58.0) years. Additionally, 25 (96.3%) patients were women, and 24 (92.3%) patients were AQP4-IgG seropositive. The median duration of NMOSD was 2.59 (IQR: 0.63–4.10) years, and the median Expanded Disability Status Scale at baseline was 2.5 (IQR: 2.0–3.9). At baseline, 20 (76.9%) patients were being treated with oral corticosteroids (10mg/day, QD). They were permitted to receive corticosteroids for the first 12 weeks; thereafter, tocilizumab was used as monotherapy.
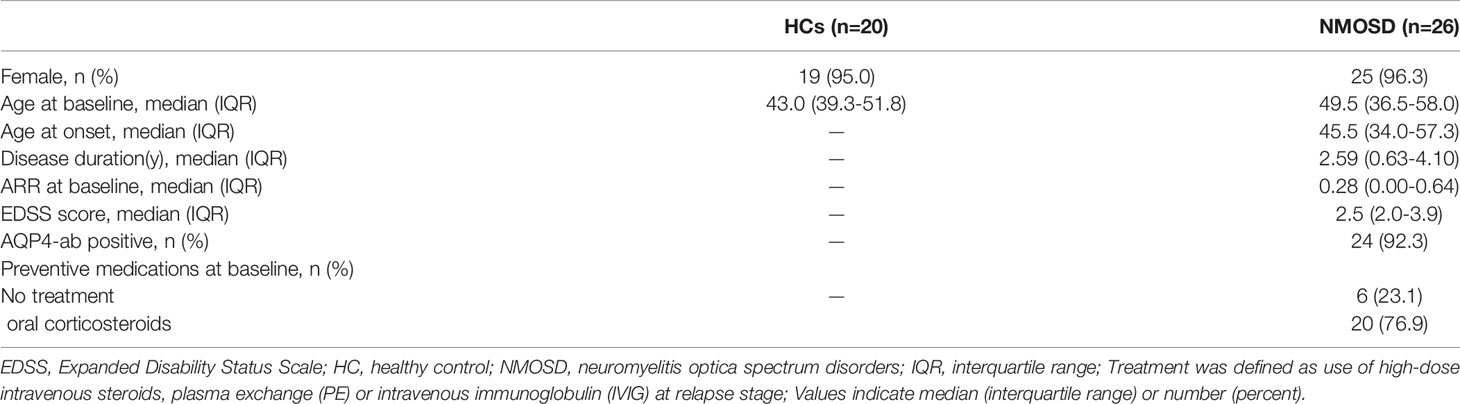
Table 1 Demographics of participants in the study.
Relapse was defined as new onset of neurological symptoms or worsening of existing neurological symptoms with an objective change on neurological examination that persisted for more than 24 h, with signs and symptoms attributable solely to NMOSD, and preceded by at least 30 days of clinical stability. By the end of the study, three (11%) of 26 patients in the tocilizumab group had a relapse.
Tocilizumab Treatment Restored the Distribution of B-Cell Subsets
As shown in Figure 1, compared with HCs, patients with NMOSD exhibited significantly higher proportions of CD27+IgD- switched memory (SWM) B cells (HC versus NMOSD:21.54% ± 1.69% versus 31.16% ± 3.53%, respectively; P = 0.0291), CD27-IgD- double negative (DN) B cells (HC versus NMOSD: 5.41% ± 0.76% versus 8.80% ± 1.16%, respectively; P = 0.0193), and CD27highCD38high antibody-secreting cells (ASCs) (HC versus NMOSD: 0.98% ± 0.12% versus 2.29% ± 0.30%, respectively; P = 0.0003), but statistical analysis showed no significant differences between HCs and NMOSD patients in the proportion of CD27-IgD+ naïve B cells (HC versus NMOSD: 62.80% ± 2.83% versus 57.05% ± 4.35%, respectively; P = 0.2742) and CD27+IgD+ unswitched memory (USM) B cells (HC versus NMOSD: 12.23% ± 1.03% versus 10.24% ± 1.14%, respectively; P = 0.2015). That is to say, the distribution of B-cell subsets was different from that of HCs, with an elevated proportion of DN, SWM cells, and ASCs.
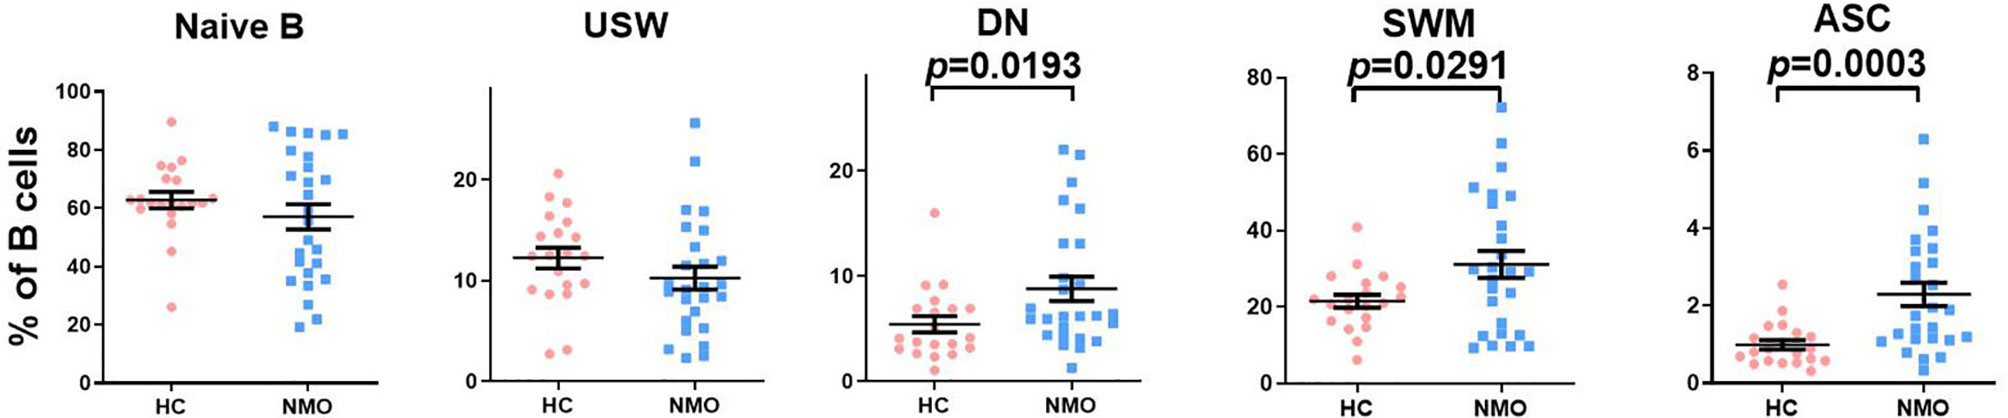
Figure 1 The comparison of B cell subsets distribution in healthy controls and patients with NMOSD. Proportions of CD27-IgD+ naïve B cell, CD27+IgD+ unswitched memory B (USW), CD27-IgD- double negative B cell (DN), CD27+IgD− switched memory B (SWM) cells and CD27highCD38high autoantibodies secreted cells (ASC) among total B cells in patients with NMOSD and healthy controls (HC). Unpaired, two-tailed Student’s t tests were used. HC: n=20; NMOSD: n=26.
There were no significant differences in the proportions of total B cells in lymphocyte cells at 1 or 3 months after tocilizumab treatment compared with those at baseline (1 month versus 0 month: 9.98% ± 1.19% versus 10.19% ± 1.32%, respectively, P = 0.8027; 3 months versus 0 month: 10.14% ± 1.03% versus 10.19% ± 1.32%, respectively, P = 0.9332) (Figures 2A, B). When come to the B cell subtypes, it was found that the frequencies of DN (1 month versus 0 month: 6.86% ± 0.93% versus 9.86% ± 1.21%, respectively, P = 0.0091) and SWM B cells (1 month versus 0 month: 24.58% ± 2.83% versus 33.74% ± 3.52%, respectively, P = 0.0011) were significantly decreased compared with those at the baseline after 1 month of tocilizumab treatment in patients with NMOSD. In contrast, the frequency of naïve B cells was significantly increased (1 month versus 0 month: 65.91% ± 3.92% versus 52.54% ± 4.25%, P = 0.0107). We did not find a significant decrease in the frequencies of ASCs (1 month versus 0 month: 2.28% ± 0.33% versus 3.06% ± 0.46%, P = 0.0863) or unswitched memory (USM) B cells (1 month versus 0 month: 5.38% ± 0.72% versus 6.32% ± 0.86%, P = 0.1147). After 3 months of treatment, tocilizumab led to a significant shift to a more naïve B-cell phenotype from mature memory B cells, as demonstrated by an increase in naïve B cell numbers (3 month versus 0 month: 70.43% ± 3.76% versus 52.54% ± 4.25%, P = 0.0005) and decreases in SWM (3 month versus 0 month: 20.71% ± 2.10% versus 33.74% ± 3.52%, P = 0.0008) and DN B cell numbers (3 month versus 0 month: 5.62% ± 0.80% versus 9.86% ± 1.21%, P = 0.0003) compared with those at baseline, After 3 months of treatment, the proportion of abnormally elevated ASCs also decreased (3 month versus 0 month:1.47% ± 0.26% versus 3.06% ± 0.46%, P = 0.0406) (Figures 2C-F). Although not significant, tocilizumab tended to decrease the proportions of USM B cells at 3 months (3 month versus 0 month:5.90% ± 0.60% versus 6.32% ± 0.86%, P = 0.0791). We did not find any significant differences between the proportions of naïve B cells (1 month versus 3 month: 65.91% ± 3.92% versus 70.43% ± 3.76%, P=0.0943), DN B cells(1 month versus 3 month: 6.86% ± 0.93% versus 5.62% ± 0.80%, P=0.0610), SWM B cells (1 month versus 3 month: 24.58% ± 2.83% versus 20.71% ± 2.10%, P=0.1023), USM B cells(1 month versus 3 month: 5.38% ± 0.72% versus 5.90% ± 0.60%, P=0.4315) and ASC (1 month versus 3 month: 2.28% ± 0.33% versus 1.47% ± 0.26%, P=0.0989) at 1 month of tocilizumab treatment and those at 3 months.
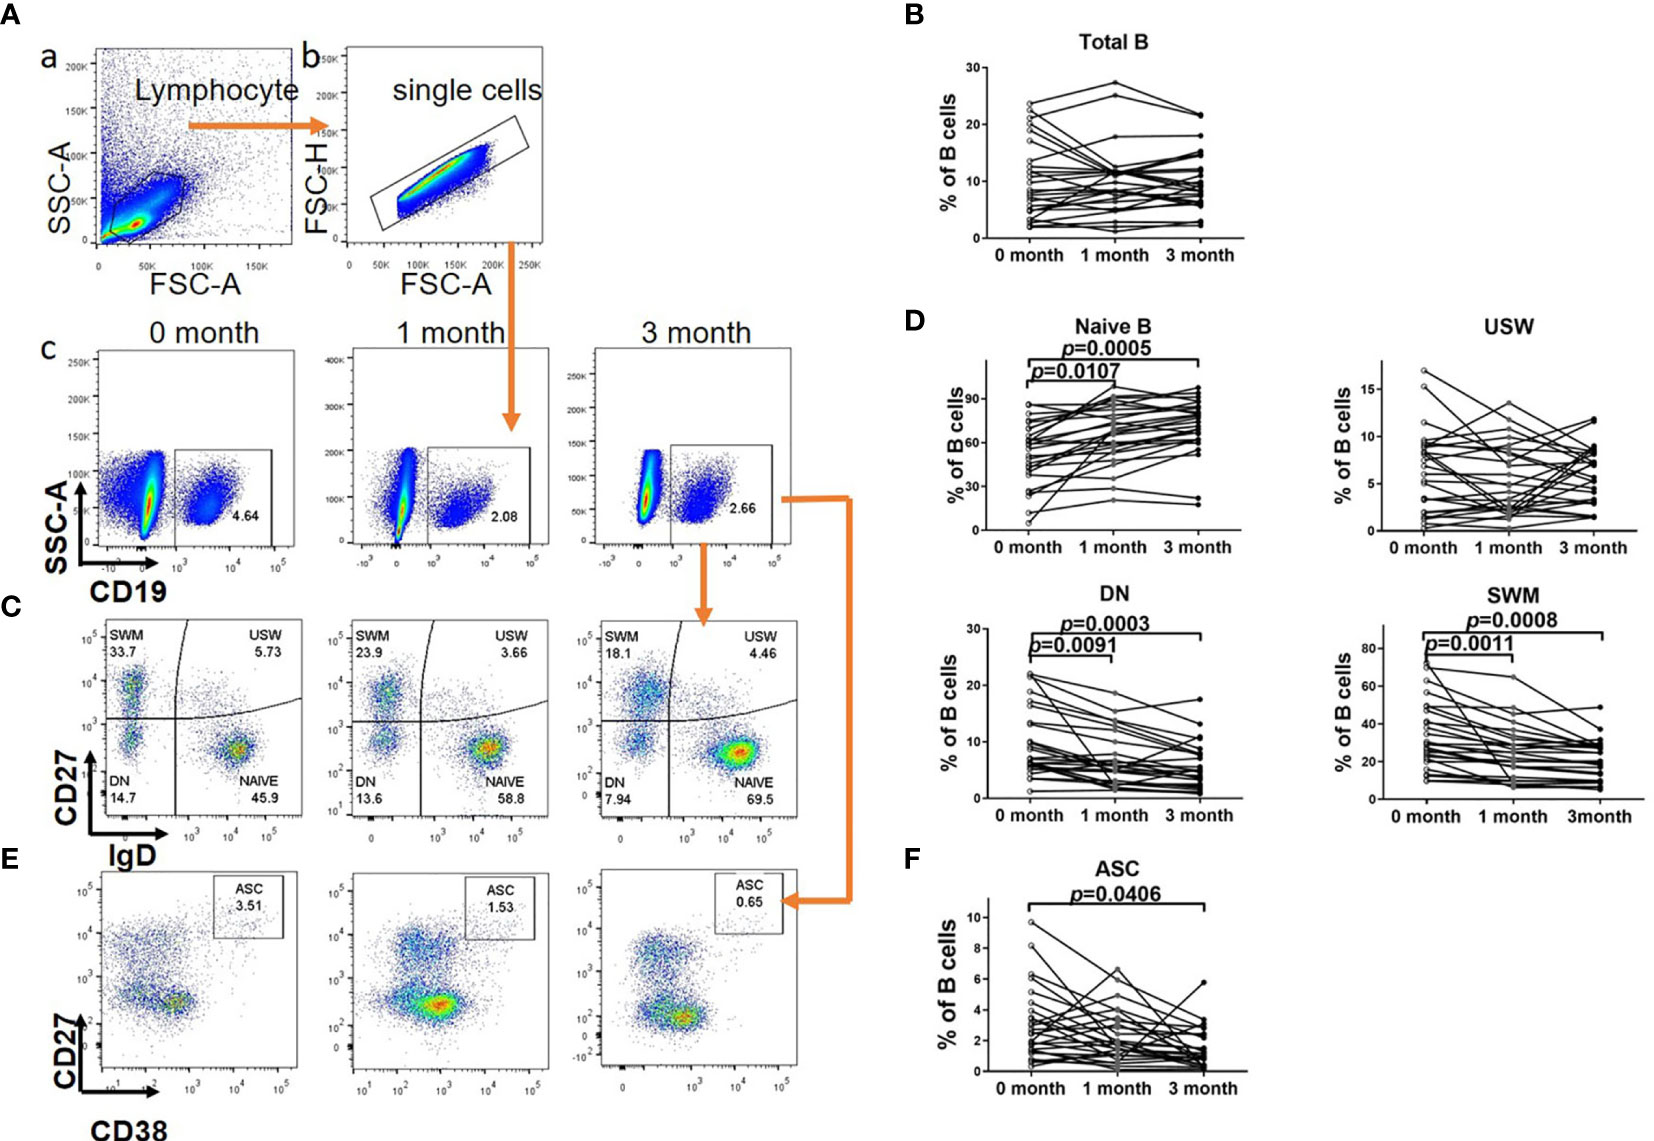
Figure 2 B cell subsets distribution in NMOSD patients before and after tocilizumab. (A) Gating strategy for B subsets. (a) Sideward scatter-A (SSC-A) and Forward scatter-A (FSC-A) were used for lymphocytes gating. (b) FSC-H and FSC-A were used to gate single cells. (c) B cells was charactered by CD19+. (B) Quantitative analysis of proportion of total B cells. The effect of tocilizumab treatment on these circulating B cell subsets was also assessed in NMOSD patients at baseline and after 1 month/3 months of treatment. (C, E) Representative flow cytometry of CD19+CD27–IgD+ (naive), CD19+CD27–IgD– (double-negative, DN), CD19+CD27+IgD+ (unswitched memory, USW), CD19+CD27+IgD– (switched memory, SWM) and CD19+CD27high CD38high ASC (Autoantibodies secreted cells) from NMOSD patients before and after tocilizumab. (D, F) Quantitative analysis of proportion of B cell subsets and ASC. Significance was tested by repeated measures of analysis of variance and the Bonferroni–Dunn adjustment for multiple comparisons. Paired, two-tailed Student’s t tests (if the distribution is normal) or Wilcoxon matched pairs tests (If it does not conform to the normal distribution) were used to compare baseline and post-treatment results, n=26.
In a word, tocilizumab treatment restored the distribution of B-cell subsets, to be detailed, the elevated proportion of DN, SWM cells and ASCs was partial recovered, otherwise the proportion of naïve B cells increased.
Tfh, Peripheral T Helper, and Follicular Regulatory T Cells Were Differentially Affected in Tocilizumab-Treated Patients With NMOSD
First, we examined the proportions of Tph (CD4+CXCR5-PD-1high) and Tfh (CD4+CXCR5+PD-1high) cells in the peripheral blood of patients with NMOSD at baseline. We found that the proportions of both phenotypes were significantly higher in the patients with NMOSD than those in HCs (Tfh cells: 0.76% ± 0.11% versus 2.69% ± 0.23%, respectively, P= 0.0008; Tph cells: 3.08% ± 0.45% versus 6.59% ± 0.43%, respectively, P = 0.0009). Moreover, proportions of the Tfh cell subsets Tfh1 (0.12% ± 0.04% versus 1.23% ± 0.14%, respectively; P = 0.0006), Tfh17 (0.05% ± 0.01% versus 0.41% ± 0.05%, respectively; P = 0.0003), and Tfh2 (0.52% ± 0.06% versus 0.79% ± 0.10%, respectively; P = 0.0212) were significantly increased in patients with NMOSD. Additionally, proportions of the Tph cell subsets Tph1 (0.27% ± 0.08% versus 2.12% ± 0.22%, respectively; P = 0.0004) and Tph17 (0.22% ± 0.03% versus 0.80% ± 0.12%, respectively; P = 0.0002) were increased, whereas the proportion of Tph2 cells (2.58% ± 0.43% versus 3.25% ± 0.29%, respectively; P = 0.1836) was not significantly decreased (Figures 3A, B).
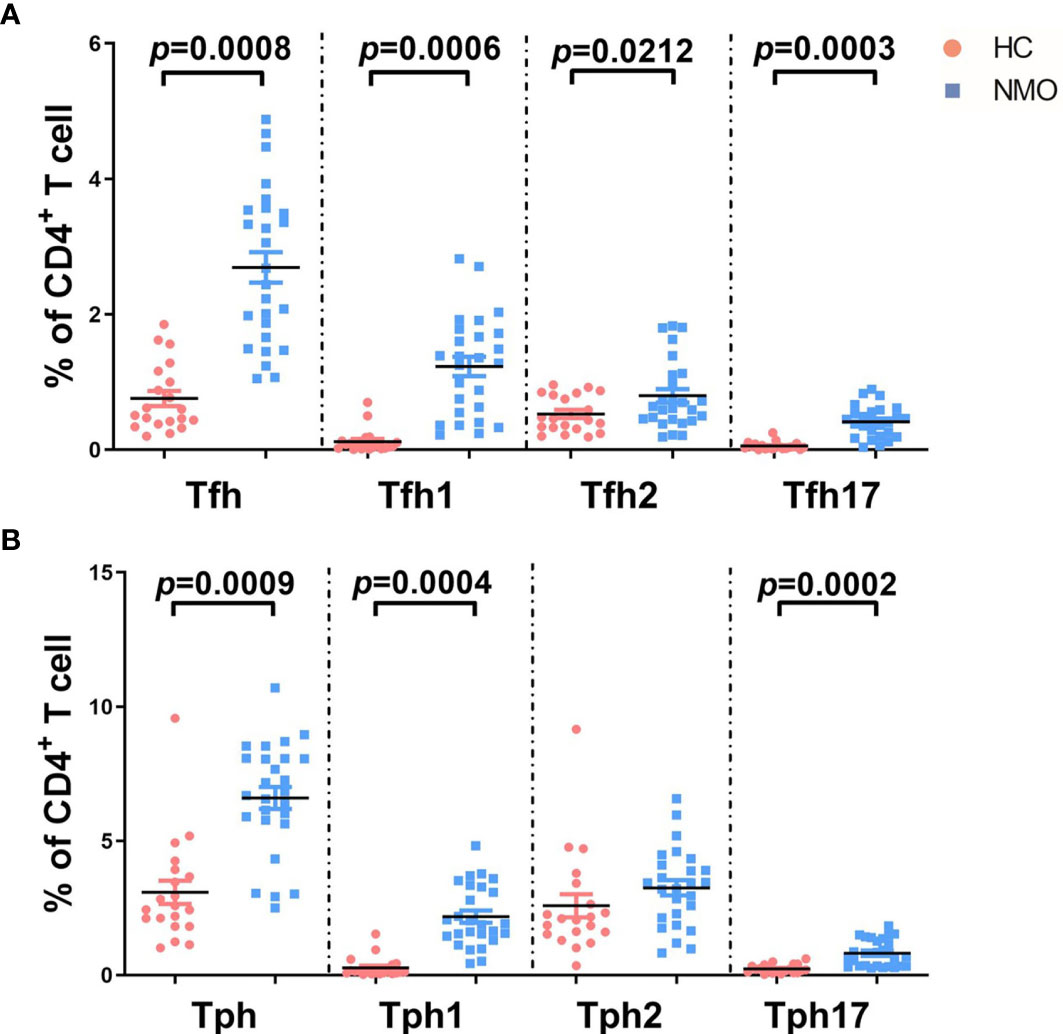
Figure 3 The comparison of T cell subsets distribution in healthy controls and patients with NMOSD. (A) Proportions of T follicular helper (Tfh: CD4+CXCR5+PD-1high) and subsets among total CD4+ cells in patients with NMOSD and healthy controls (HC); (B) Proportions of peripheral T helper (Tph: CD4+CXCR5-PD-1high) and subsets. Tfh1 (CXCR3+CCR6–), Tfh2 (CXCR3–CCR6–), and Tfh17 (CXCR3–CCR6+), Tph1 (CXCR3+CCR6–), Tph2 (CXCR3–CCR6–), and Tph17 (CXCR3–CCR6+). Unpaired, two-tailed Student’s t tests were used. HC: n=20; NMOSD: n=26.
No significant differences were found in the proportions of CD4+CD45RA-CXCR5+CD25+CD127- Tfr cells in patients with NMOSD compared to those in HCs (5.49% ± 0.41% versus 5.77% ± 0.39%, respectively; P = 0.6273; Figure 4I).
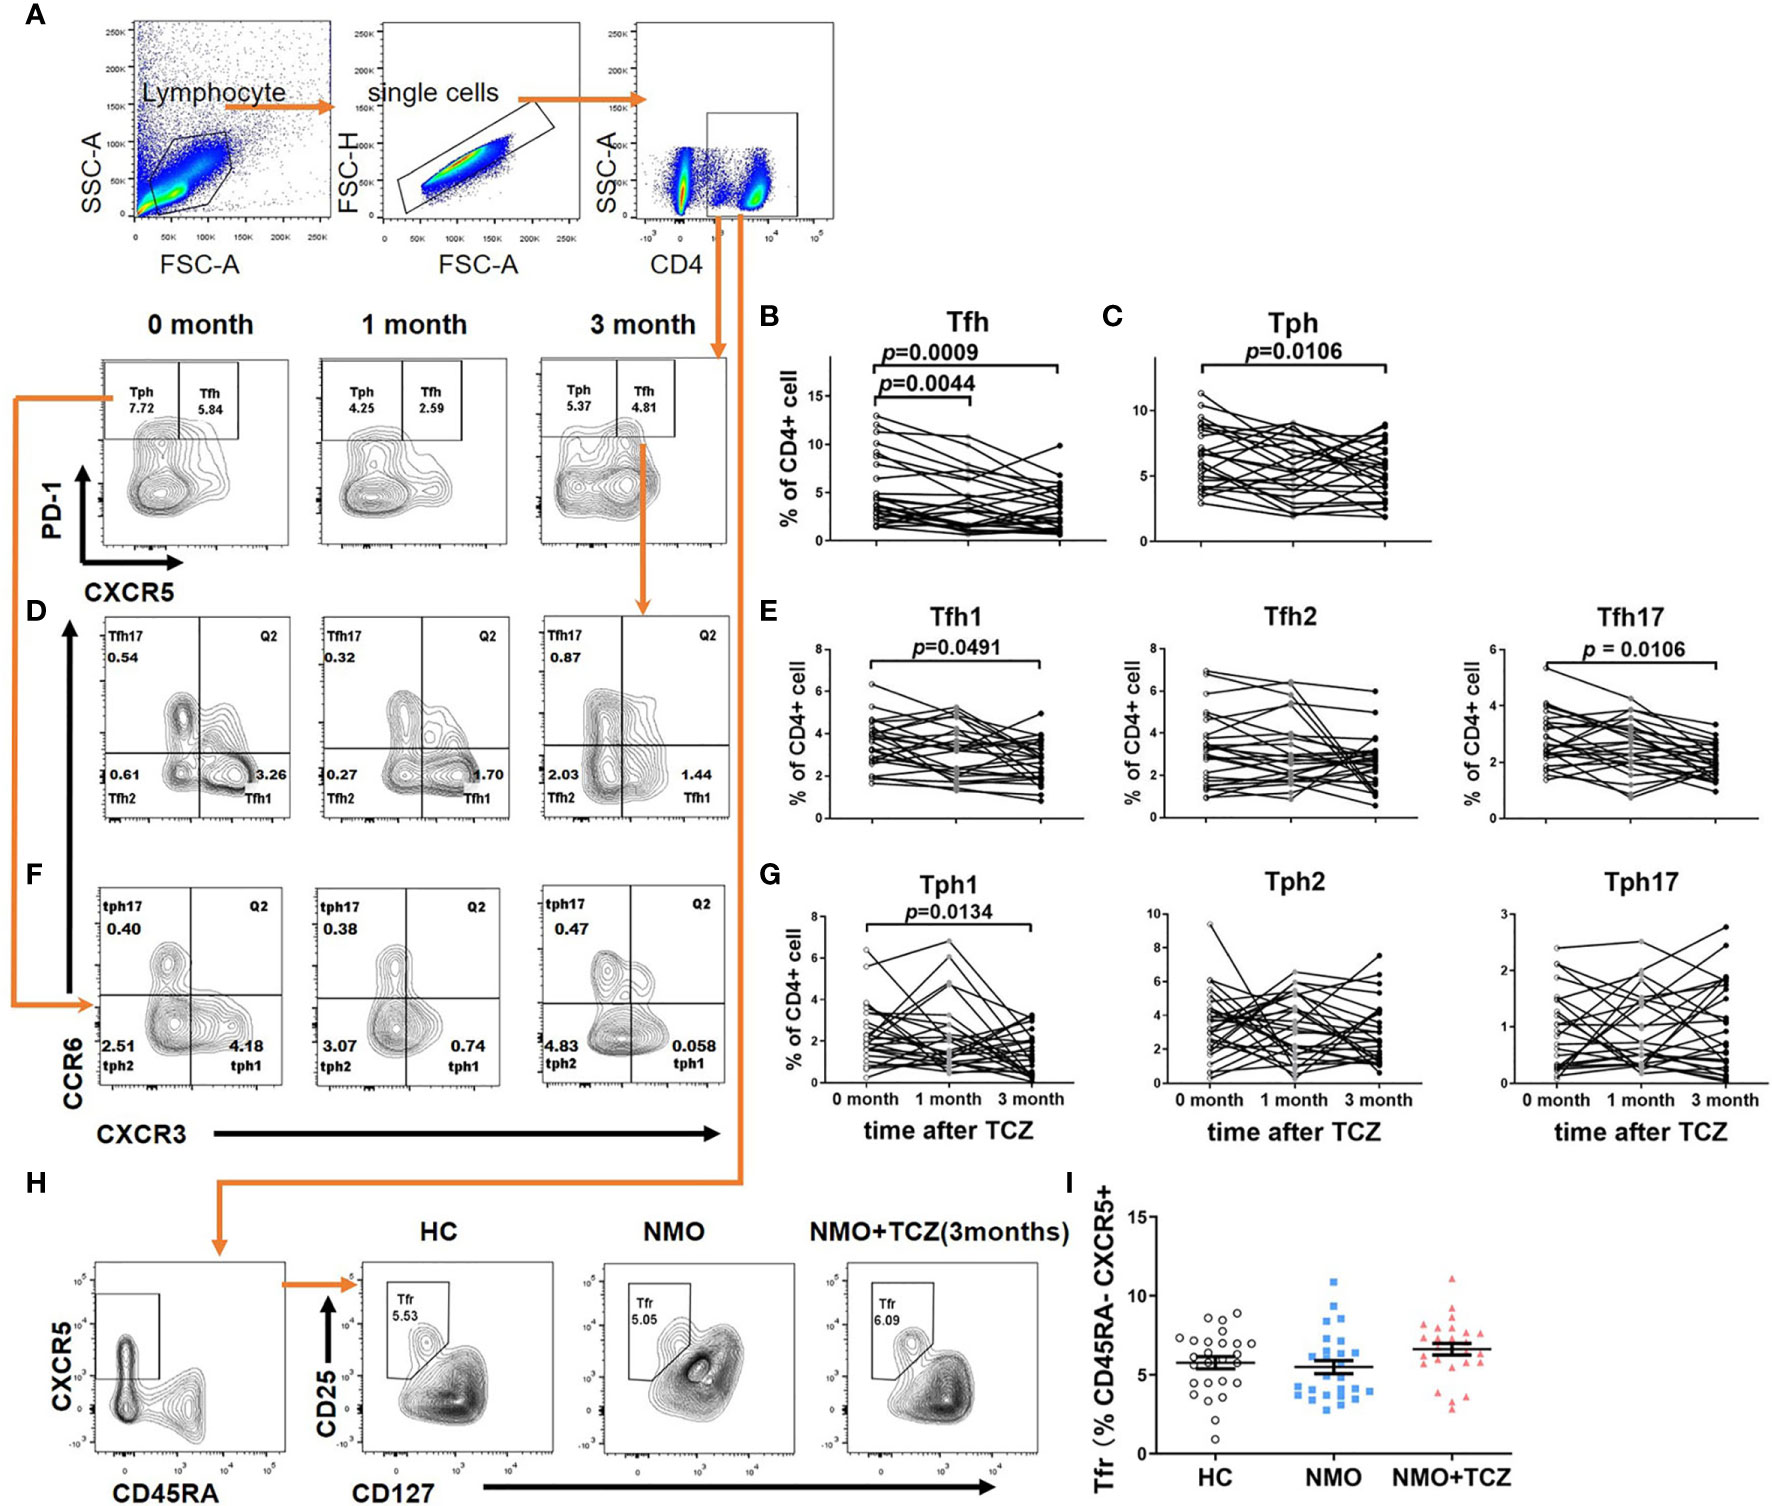
Figure 4 T cells subsets distribution in NMOSD patients before and after tocilizumab. (A, D, F) showed gating strategy for subsets of T Follicular Helper Cell (Tfh) & peripheral T helper cells (Tph) and representative flow cytometry plot at baseline and after treatment for 1month or 3 months. (B, C, E, G) Quantitative analysis of proportion of total Tfh and its subsets: Tfh1 (CD4+CXCR5+PD-1highCXCR3+CCR6–), Tfh2 (CD4+CXCR5+PD-1highCXCR3–CCR6–) and Tfh17 (CD4+CXCR5+PD-1highCXCR3–CCR6+), total Tph and its subsets: Tph1 (CD4+CXCR5-PD-1highCXCR3+CCR6–), Tph2 (CD4+CXCR5-PD-1highCXCR3–CCR6–), and Tph17 (CD4+CXCR5-PD-1highCXCR3–CCR6+) at baseline and after treatment for 1month or 3 months (n=19). (H) Gating strategy for T follicular Regulatory cells (Tfr) and flow cytometry plot of a control and a representative NMOSD patient (before and after tocilizumab 3 months). (I) Quantitative analysis of proportion of Tfr in healthy controls and NMOSD patient before and after tocilizumab 3 months (n=26). Differences were considered statistically significant for P<0.05. Paired, two-tailed Student’s t tests (if the distribution is normal) or Wilcoxon matched pairs tests (if it does not conform to the normal distribution) were used to compare baseline and post-treatment results, n=26.
Next, we assessed the effects of tocilizumab on Tfh, Tph, and Tfr cells. After tocilizumab treatment, there were significantly lower proportions of total Tfh cells at 1 month (0 month versus 1 month: 5.10% ± 0.70% versus 3.86% ± 0.57%, P = 0.0044) and 3 months (0 month versus 3 months: 5.10% ± 0.70% versus 3.18% ± 0.45%, P = 0.0009) compared to those before treatment (Figures 4A, B). Tocilizumab treatment tended to reduce the number of total Tph cells at 1 month (0 month versus 1 month: 6.61% ± 0.46% versus 5.61% ± 0.45%, P = 0.1884), and a significant decrease in the number of Tph cells was observed after 3 months (0 month versus 3 months: 6.61% ± 0.46% versus 5.38% ± 0.42%, P = 0.0106; Figure 4C). In addition, among the Tfh cell subsets, we observed a tendency for reduction in the proportion of Tfh1 cells (0 month versus 1 month: 3.54% ± 0.22% versus 3.15% ± 0.24%, P = 0.0929) and Tfh17 cells (0 month versus 1 month: 2.83% ± 0.19% versus 2.56% ± 0.18%, P = 0.1049) at 1 month, and a significant decrease in the number of Tfh1 cells (0 month versus 3 month: 3.54% ± 0.22% versus 2.68% ± 0.20%, P = 0.0491) and Tfh17 cells (0 month versus 3 months: 2.83% ± 0.19% versus 2.03% ± 0.12%, P = 0.0106) at 3 months. There was no significant decrease in the proportion of Tph1 at 1 month of tocilizumab treatment (0 month versus 1 month: 2.34% ± 0.28% versus 2.16% ± 0.33%, P = 0.6356) until 3 months (0 month versus 3 months: 2.34% ± 0.28% versus 1.35% ± 0.21%, P = 0.0134). We did not find any significant changes in the frequencies of Tfh2 cells, Tph2 cells or Tph17 cell subsets after tocilizumab treatment (Figures 4D–G). The proportion of Tfr cells tended to increase; however, the difference was not statistically significant (0 month versus 3 months:5.77% ± 0.39% versus 6.63% ± 0.37%, respectively; P = 0.1143; Figures 4H, I).
To sum up, the frequencies of total Tfh and Tph cells were decreased, whereas that of follicular regulatory T cells tended to increase. The subtypes of Tfh1, Tfh17 and Tph1 cells decreased significantly.
Tocilizumab Inhibited the Activation of B Cells in Patients With NMOSD
Next, we studied the expression of the costimulatory molecules CD86 and CD69 as markers of activated B cells that modulate T-cell signaling. No significant changes in the mean fluorescence intensity (MFI) of CD86 or CD69 were observed in CD19+ B cells after tocilizumab treatment for 1 month (not shown); however, the MFI of CD86 was decreased after 3 months (488.2 ± 30.47 versus 392.3 ± 32.62, respectively; P = 0.0205) and that of CD69 decreased at 3 months (366.5 ± 25.87 versus 291.6 ± 22.50, respectively; P = 0.0387; Figures 5A–F). There were no significant differences in the expression of BAFF-R (2384 ± 124.9 versus 2336 ± 96.75, respectively; P = 0.7620) before and after treatment with tocilizumab (Figures 5G, H). In contrast, HLA-DR expression decreased significantly after 3 months of tocilizumab treatment (19017 ± 1174 versus 14550 ± 1033, respectively; P = 0.0125). In short, three markers on B cells associated with T-cell activation (i.e., CD86 CD69, and HLA-DR) were downregulated after tocilizumab treatment.
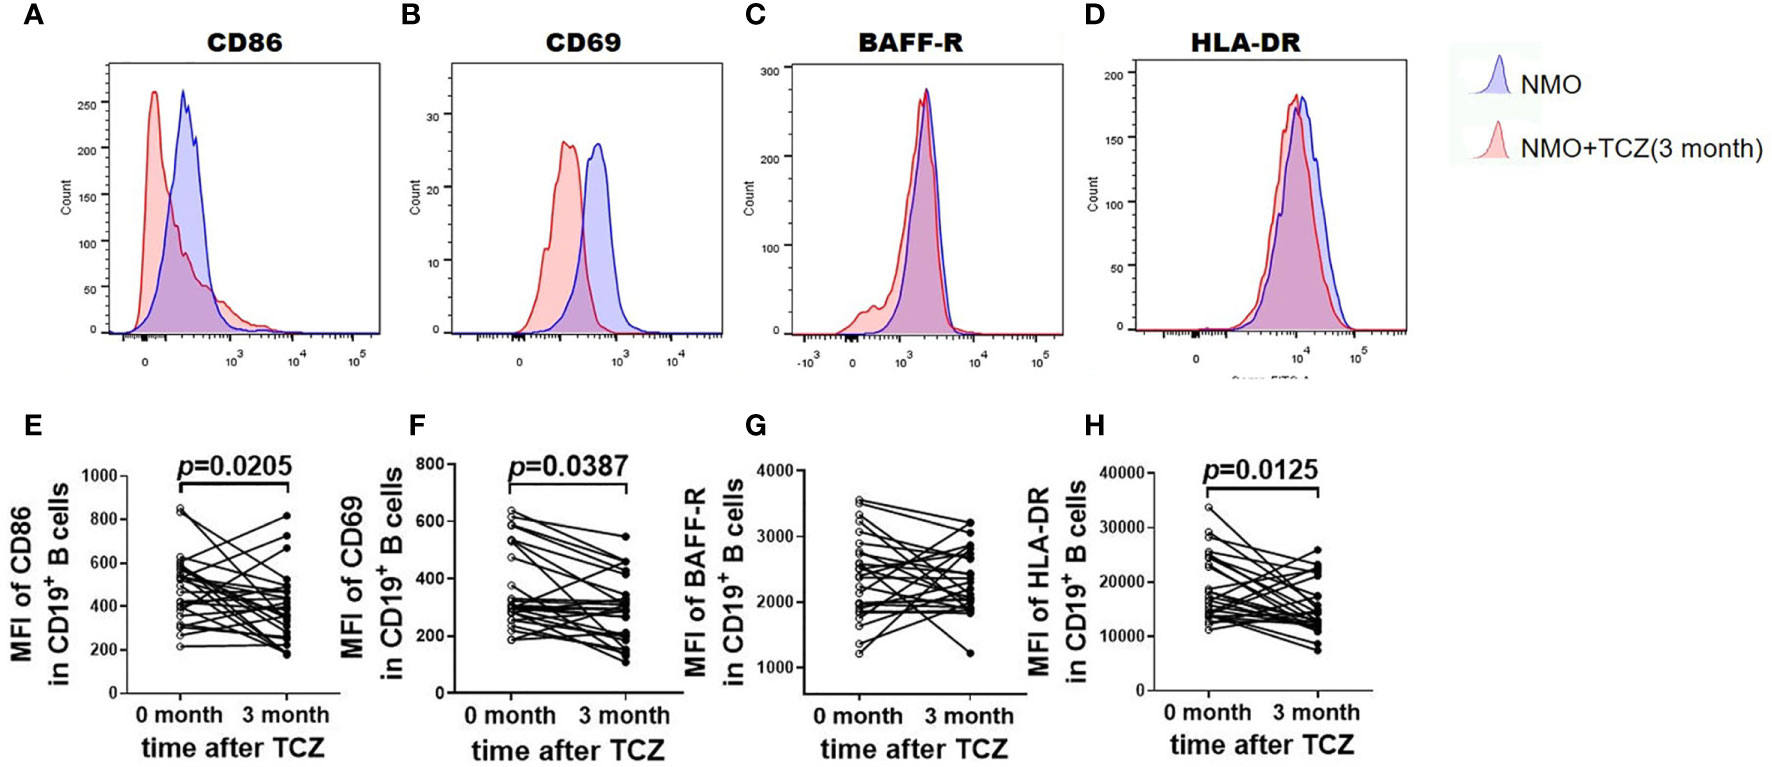
Figure 5 Tocilizumab alters the expression level of activation marker. (A–D) was the representative flow cytometric histogram after surface staining activation marker on total B cells (CD19+) from NMOSD patients before and after tocilizumab treatment. (E–H) was the quantitative analysis of the mean fluorescence intensity (MFI) of CD86, CD69, BAFF-R, HLA-DR in CD19+cells before and after tocilizumab treatment. Difference was considered statistically significant for P < 0.05. Paired, two-tailed Student’s t tests were used, n=26.
Effects of Tocilizumab Treatment on the Expression of PD-1 and Its Ligands in Peripheral B Cell Subsets
First, we compared the expression of PD-1 and its ligands PD-L1 and PD-L2 on B-cell subsets in HCs and patients with NMOSD. SWM B cells and ASCs exhibited significantly higher PD-1 expression in patients with NMOSD than that in HCs (NMOSD versus HCs: 197.7 ± 8.93 versus 113.2 ± 6.64, respectively; P<0.0001 and 323.5 ± 20.07 versus 200.1 ± 14.50 respectively; P < 0.0001). There were no significant differences in the expression of PD-1 on naïve B cells (NMOSD versus HCs): (148.5 ± 8.43 versus 130.5 ± 8.07, respectively; P=0.1378), DN B cells (147.9 ± 8.52 versus 130.3 ± 7.01, respectively; P=0.1201), and USW B cells (266.9 ± 14.47 versus 241.9 ± 15.80, respectively; P=0.2318) (Figures 6A, B). Intriguingly, we found that all B-cell subsets expressed higher levels of PD-L1 and PD-L2 in patients with NMOSD compared with HCs, to be detailed, the comparison of PD-L1 and PD-L2 levels (HCs versus NMOSD) on B cell subsets is that: naïve B (PD-L1: 346.8 ± 15.41 versus 401.6 ± 19.99, P=0.0449; PD-L2:126.7 ± 7.68 versus 170.0 ± 10.93, respectively; P=0.0038); DN B cells (PD-L1: 397.2 ± 20.57 versus 512.3 ± 29.88, P=0.0028; PD-L2:142.4 ± 8.59 versus 195.9 ± 15.94, respectively; P=0.0054); USW B cells (PD-L1: 692.6 ± 43.27 versus 908.7 ± 55.48, P=0.0054; PD-L2:203.1 ± 14.41 versus 267.9 ± 20.82, respectively; P=0.0098); SWM B cells (PD-L1: 432.5 ± 35.63 versus 592.9 ± 32.93, P=0.0026; PD-L2:140.0 ± 9.06 versus 200.8 ± 14.14, respectively; P=0.0068) and ASCs (PD-L1: 526.6 ± 30.41 versus 695.0 ± 45.53, P=0.0037; PD-L2:302.7 ± 18.76 versus 441.6 ± 32.68, respectively; P=0.0007) (Figures 6C–F).
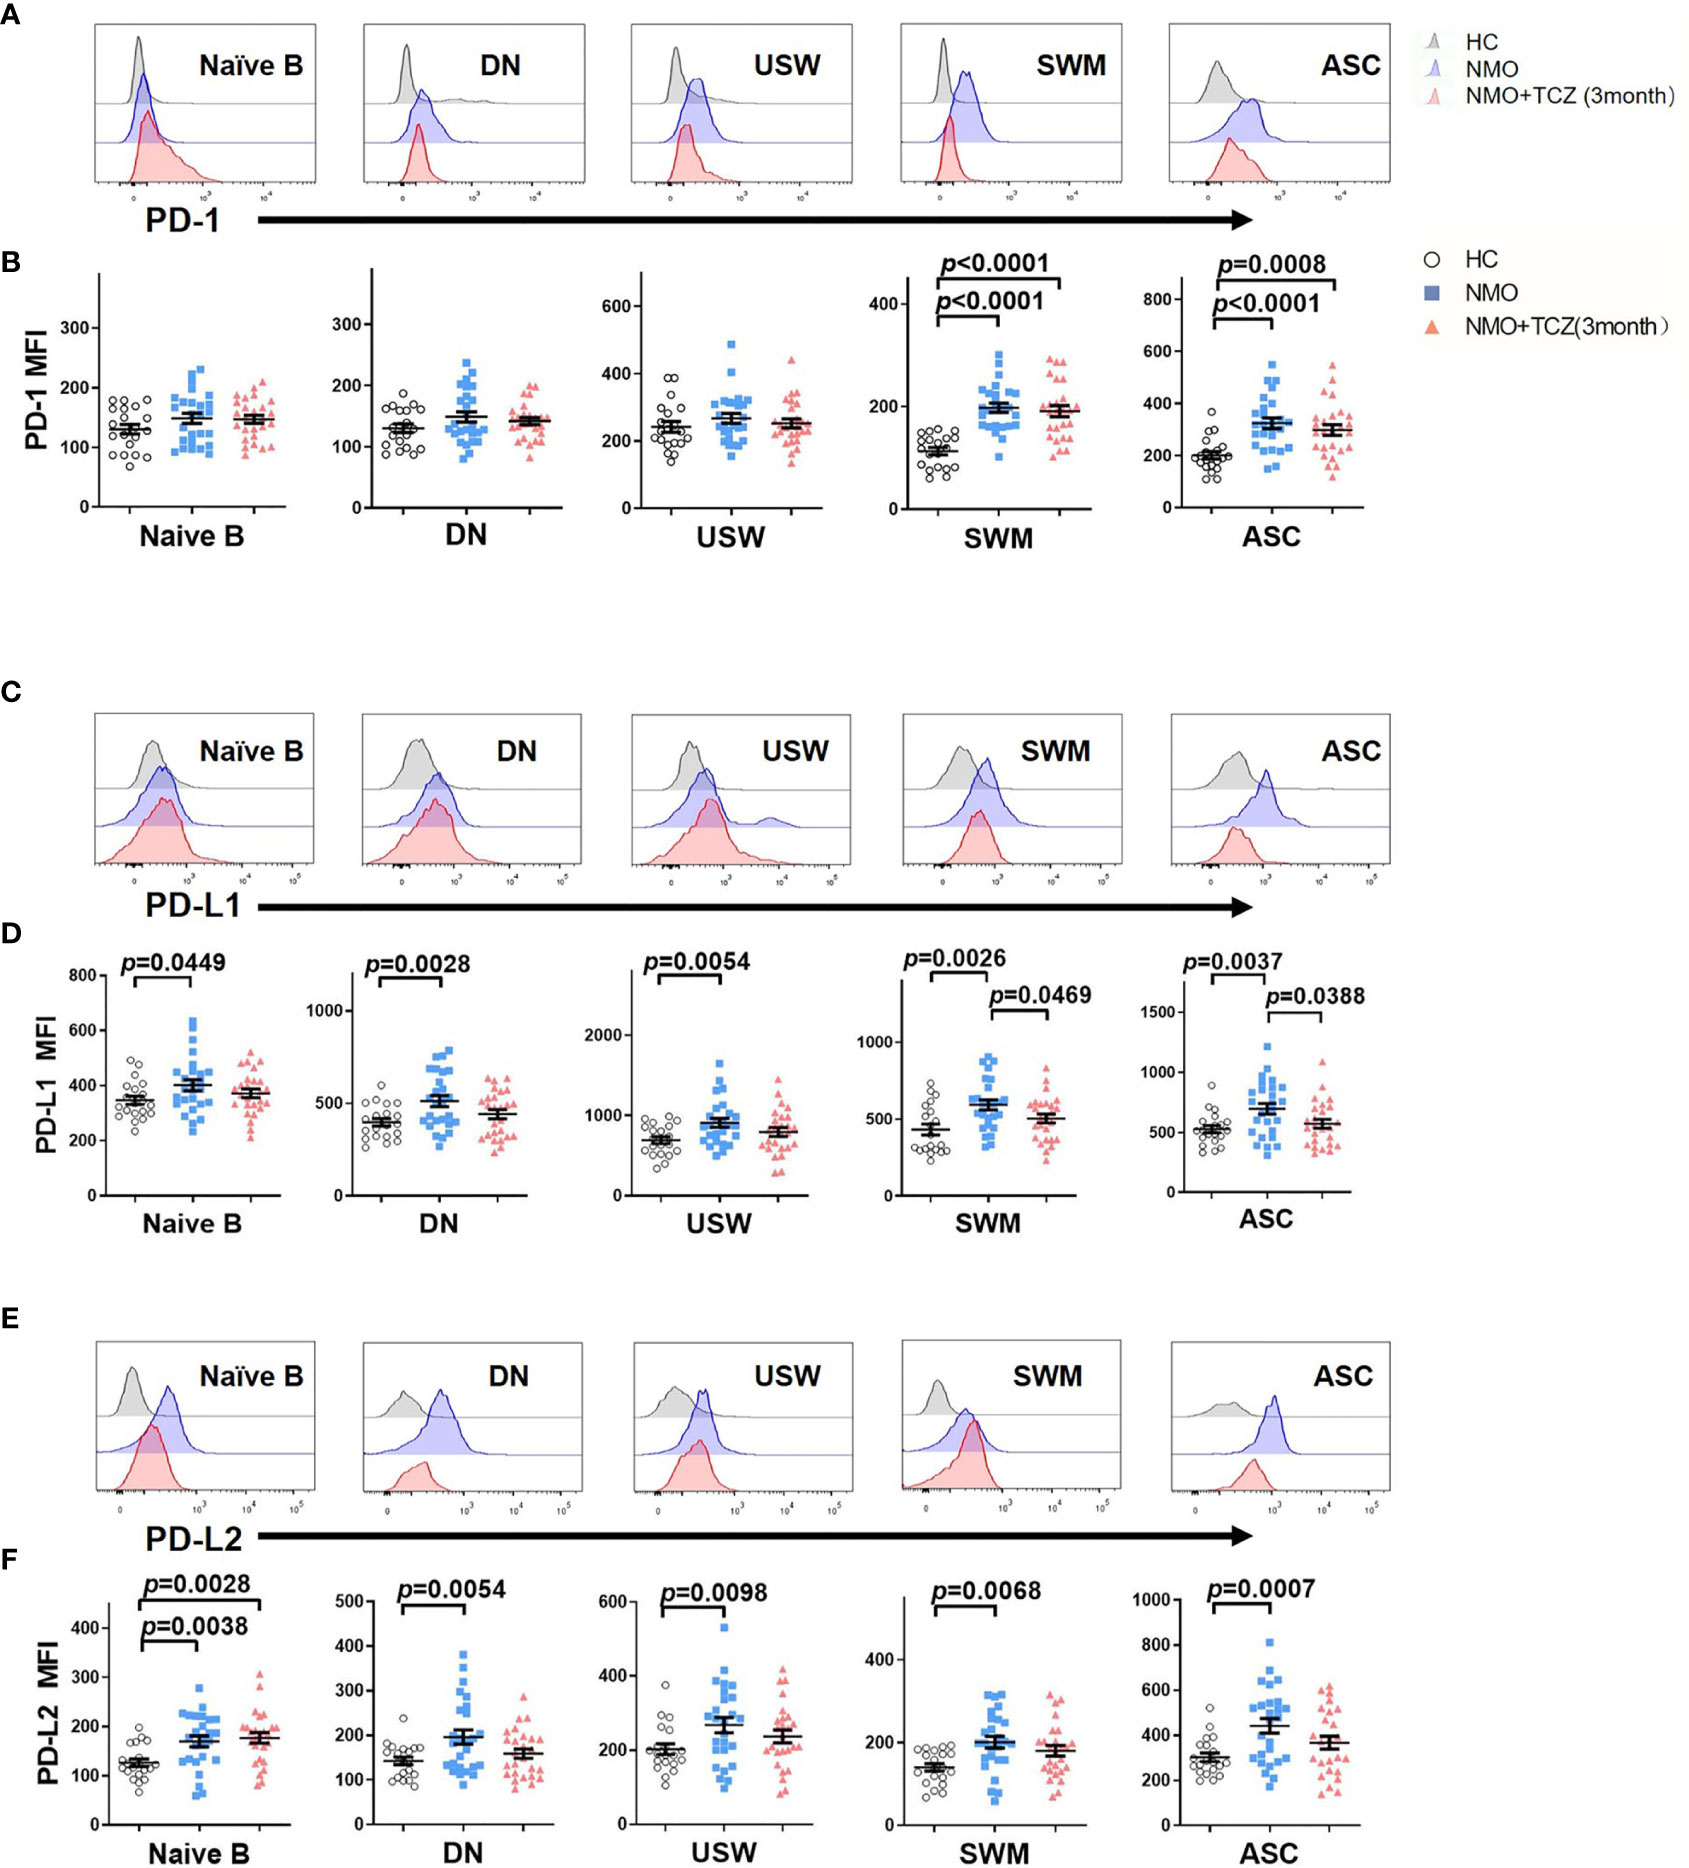
Figure 6 The expression of PD-1 and its corresponding ligands PD-L1 and PD-L2 on B cells subsets from healthy control (HC) and NMOSD patients before and after treatment. (A, C, E) Representative histograms of PD-1, PD-L1, PD-L2 in several B cells subsets from a healthy control and NMOSD patients before and after treatment. (B, D, F) was the quantitative analysis of mean fluorescence intensity (MFI) of PD-1, PD-L1&PD-L2 in several B cells subsets. Unpaired, two-tailed Student’s t tests (if the distribution is normal) or Mann-Whitney U tests (if it does not conform to the normal distribution) were used, n=26.
Next, we compared the expression of PD-1 and its ligands on B-cell subsets in the patients with NMOSD after 3 months of treatment with those in HCs. SWM B cells and ASCs exhibited significantly higher PD-1 expression in patients with NMOSD after treatment than that in HCs (191.0 ± 10.96 versus 113.2 ± 6.64, respectively; P<0.0001 and 297.6 ± 20.43 versus 200.1 ± 14.50 respectively; P = 0.0008). There were no significant differences in the expression of PD-1 on naïve B cells (HCs versus NMOSD+TCZ: 130.5 ± 8.07 versus 147.2 ± 6.71, P=0.1431), DN B cells (147.9 ± 8.52 versus 130.3 ± 7.01, respectively; P=0.2120), and USW B cells (266.9 ± 14.47 versus 241.9 ± 15.80, respectively; P=0.4582). Statistically, tocilizumab did not significantly affect the expression of PD-L1 or PD-L2 on all B-cell subsets compared with the baseline except in naïve B cells (PD-L2:126.7 ± 7.68 versus 177.1 ± 10.55, respectively; P=0.0028), although a decreasing tendency was observed in several B-cell subsets. To be detailed, the comparison of PD-L1 and PD-L2 levels (HCs versus NMOSD+TCZ) on B cell subsets is that: naïve B (PD-L1: 346.8 ± 15.41 versus 372.0 ± 15.39, P=0.2630); DN B cells (PD-L1: 397.2 ± 20.57 versus 441.1 ± 24.45, P=0.1936; PD-L2:142.4 ± 8.59 versus 158.8 ± 10.47, respectively; P=0.2523); USW B cells (PD-L1: 692.6 ± 43.27 versus 794.8 ± 54.56, P=0.1680; PD-L2: 203.1 ± 14.41 versus 237.4 ± 17.43, respectively; P=0.1150); SWM B cells (PD-L1: 432.5 ± 35.63 versus 503.7 ± 28.82, P=0.1026; PD-L2:140.0 ± 9.06 versus 179.9 ± 12.96, respectively; P=0.0634) and ASCs (PD-L1: 526.6 ± 30.41 versus 571.4 ± 36.32, P=0.3676; PD-L2: 302.7 ± 18.76 versus 367.1 ± 28.63, respectively; P=0.0667).
Finally, we compared the expression of PD-1 and its ligands on B-cell subsets in the patients with NMOSD before and after 3 months of treatment. Statistical analysis shows that the expression of PD-L1 on SWM cells and ASCs after treatment was significantly lower than those before treatment (592.9 ± 32.93 versus 503.7 ± 28.82, P=0.0469 and 695.0 ± 45.53 versus 571.4 ± 36.32, P=0.0388 respectively) (Figure 6B). Additionally, there was no significant differences in the expression of PD-1 and its ligands on B-cell subsets (Figures 6D, F).
As a whole, tocilizumab-treated patients showed little changes in PD-1 expression among all B-cell subsets compared with the baseline. By contrast, treatment with tocilizumab does have a tendency to reduce PD-L1 and PD-L2 expression on B-cell subsets. For instance, the expression of PD-L1 on SWM cells and ASCs after treatment was significantly lower than those before treatment (Figures 6D, F).
Discussion
The differential effects of disease-modifying drugs (DMDs) on peripheral blood B-cell subsets and differentiation-related Th cells have been investigated in multiple sclerosis (16–18). However, few studies have reported the effects of DMDs in NMOSD.
In this study, we found that in vivo blockade of the IL-6 receptor decreased lymphocyte activation, altered B- and T-cell homoeostasis in patients with NMOSD, and promoted the normalization of abnormal B- and T-cell subsets observed at baseline. Specifically, tocilizumab treatment led to an increase in the number of naïve B cells and decreases in the number of memory B cells and ASC B cells. Similarly, the frequencies and absolute numbers of abnormally reduced Tfh cells increased.
Decreases in the number of memory B cells were consistent with those reported with tocilizumab in patients with rheumatoid arthritis in a previous study (19). Unlike in rheumatoid arthritis, however, we also observed a significant decrease in the number of ASCs, probably because of the more pronounced abnormalities of these cells in patients with NMOSD. Naïve B cells are also dysregulated in patients with NMOSD, as reflected by the lower frequency of naïve B cells. Remarkably, the frequency of naïve B cells was normalized in response to tocilizumab, and the changes in naïve B cells were attributed to the recovery of the reduced number of memory B cells, ASCs, and DN B cells and, to a lesser degree, to a decline in the number of USW B cells. Second, it is known that IL-6 plays an important role in the terminal differentiation of B cells. Thus, IL-6 receptor blockade may lead to a failure of differentiation from naïve B cells to memory B cells.
Double-negative B cells are thought to be mature antigen-experienced B cells with developmental marker expression profiles similar to those of post-switch memory B cells (20). The proportion of DN B cells is increased in patients with multiple sclerosis, resulting in increased production of pro-inflammatory and cytotoxic cytokines following ex-vivo stimulation (21, 22). Consistent with a previous study (23), we also observed expanded DN B cells in patients with NMOSD, suggesting the possible involvement of DN B cells in the pathogenesis of NMOSD (19, 24). In this study, tocilizumab treatment effectively reduced the numbers of DN B cells and may facilitate the inhibition of inflammation in NMOSD. DN B cells were further divided into two subgroups in a previous study on systemic lupus erythematosus (SLE), DN1 cells (CXCR5+ CD19+ IgD-CD27-) and DN2 cells (CXCR5- CD19+IgD- CD27-). DN2 cells express T-bet and CD11c, and their activation is mediated by hyper-responsiveness to TLR7 and leads to the generation of autoreactive ASCs (25). The deeper characterization of these cells, via immunophenotyping, has the potential to identify novel SLE phenotypes that associate with disease-activity (26). Moreover, the frequency of DN B cells in rheumatic arthritis is inversely correlated to a subsequent good response (27). Additional larger scale studies are needed to determine whether DN B cells may serve as predictors of treatment response to tocilizumab.
In this research, blockade of the IL-6 receptor restores abnormally elevated SWM B cells and ASCs seen at baseline. The decrease of SWM B cells and ASCs may explain the reduction of the pathogenic AQP4-IgG titers found in our previous clinical trial (15), which showed that among AQP4-IgG positive patients, tocilizumab decreased sera AQP4-IgG titers significantly by 50% at the end of the study compared with those at baseline.
In NMOSD, the balance in Tfh cells and related subsets is impaired, making these cells a potential therapeutic target. Consistent with previous studies, we found an upregulation of Tfh cells, particularly Tfh1 cells, in NMOSD patients compared with HCs (6, 28, 29), while 3 months of treatment with tocilizumab reduced the frequency of Tfh cells, and we found that Tfh cell differentiation was associated with IL-6 and plasmablast formation. In line with our findings, specific targeting of IL-6 using tocilizumab therapy in patients with rheumatoid arthritis can significantly reduce circulating Tfh cell numbers, which are correlated with reduced plasmablast formation (30). In this study, we observed similar results in tocilizumab-treated patients with NMOSD, indicating the therapeutic efficacy of tocilizumab in these patients.
Tph cells may play a role in promoting B-cell responses and antibody production within pathologically inflamed non-lymphoid tissues. The possible mechanism lies in that CXCL13 and IL-21 produced by Tph cells may recruit both Tfh and B cells and thus promote local autoantibody production and perhaps modulate other B cell functions such as cytokine production (31). We found that Tph cells were increased in patients with NMOSD. Tocilizumab treatment resulted in reduction of the number of peripheral blood Tph cells. Further research is needed to investigate if this can offer a potential strategy for therapeutic targeting of tissue T cell-B cell interactions.
The role of IL-6 in autoimmune diseases helps to understand the mechanism of the effect of tocilizumab on B- and T-cell subsets. For B cells, IL-6 can promote the terminal differentiation of B cells (32) and contribute to survival of plasma cells (33). IL-6 receptor blockade by tocilizumab is expected to inhibit the differentiation of B cells and survival of plasma cells, as both of them express the IL-6 receptor. For T cells, IL-6 is known to promote early Tfh cell differentiation by transiently inducing B cell lymphoma 6 (BCL-6) expression in CD4+ T cells (34). Further, Tfh cells can promote germinal center formation through the production of IL-21, which sustains BCL-6 expression on B cells and promotes B cell activation, class-switch recombination, and plasma cell differentiation (35). Tph cell is a recently discovered Th cell subset, which can also promote B cell differentiation by secreting IL-21 (36). In general, pro-inflammatory IL-6 promotes the formation of germinal center B cells and Tfh/Tph cells in cooperation with IL-21.
The PD-1 pathway is one of the most important immune checkpoints and is indispensable for maintaining the homeostasis and tolerance of the immune system. The expression of PD-1 family members on B cells in NMOSD has not yet been investigated in detail. Herein, we found that PD-1, PD-L1, and PD-L2 expression was increased on ASCs and memory B cells in NMOSD patient compared to that in healthy controls, consistent with previous studies in systemic lupus erythematosus (37). Because all B cells are pro-inflammatory in NMOSD, upregulation of PD-1 and its ligands on B cells may on account of cellular activation. Additionally, PD-L1-deficient B cells in an experimental autoimmune encephalomyelitis mouse model exhibit aggravated autoimmunity (38), suggesting that the PD-1 pathway may have roles in the ablation of autoimmunity. In our cohort, tocilizumab treatment selectively downregulated PD-L1 expression on ASCs and memory B cells in patients with NMOSD; this treatment could block or control autoimmune responses and help restore homeostasis. Although B cells expressing PD-1 may diminish after anti-CD19 or anti-CD20 mAb treatment, the effects of tocilizumab on PD-1-related co-inhibitory signaling are persistent. This indicates that the mechanisms of tocilizumab differ from those of rituximab or inebilizumab regarding inhibition of disease activity. Little is known about the expression and kinetics of PD-1, PD-L1, and PD-L2 by B lymphocytes from NMOSD patients. Not only B cells that express PD-L1 and PD-L2 and T cells expressing PD-1 interact via this pathway, but also B cell-expressed PD-1, that could mediate B-B or B-T interactions. We postulate that the PD-1 system on B cells acts as a feedback of neuroinflammation in NMOSD. The elevated PD-1 system on B cells may play a protective role in controlling autoimmunity in active NMOSD. When autoimmune inflammation is suppressed by tocilizumab treatment, the PD-1 system tends to restore.
This study has several limitations. First, the follow-up period was relatively short, and the long-term effects on B-cell subsets after tocilizumab treatment were not evaluated. Second, the sample size of patients with tocilizumab treatment was extremely small. Additionally, 3 patients in this study experienced attacks during follow-ups, but the reason is not still clear. High-throughput single-cell sequencing may be warranted to explore heterogeneity of cellular immune function in patients who didn’t respond well to tocilizumab. Finally, it is a limitation that the mechanisms of the effects of tocilizumab on Tfh/Tph cell inhibition are not investigated in our study. Further evidence will be warranted on the mechanistic study.
Conclusions
In summary, we showed that tocilizumab inhibited the activation of mature B cells and Tfh cells but maintained co-inhibitory PD-1 expression on B cells in the peripheral blood of patients with NMOSD. These findings provide important insights into the effects of tocilizumab on the immune mechanism of NMOSD.
Data Availability Statement
The raw data supporting the conclusions of this article will be made available by the authors, without undue reservation.
Ethics Statement
The studies involving human participants were reviewed and approved by The Institutional Review Board of Tianjin Medical University General Hospital. The patients/participants provided their written informed consent to participate in this study.
Author Contributions
CZ and YL designed the study, collected, analyzed and interpreted the data and drafted and revised the manuscript. YL, PZ, and CD performed the research. YL and HZ did statistical analysis. T-XZ, MY, ZH, DJ, and GY collected and analyzed the data. F-DS revised the manuscript critically for intellectual content. All authors contributed to the article and approved the submitted version.
Funding
The study was supported by grants from the National Natural Science Foundation of China (81601019, 81601039, 82071389) and the Natural Science Foundation of Tianjin Province (20JCJQJC00280, 18JCQNJC13200, 20JCQNJC00460).
Conflict of Interest
The authors declare that the research was conducted in the absence of any commercial or financial relationships that could be construed as a potential conflict of interest.
Publisher’s Note
All claims expressed in this article are solely those of the authors and do not necessarily represent those of their affiliated organizations, or those of the publisher, the editors and the reviewers. Any product that may be evaluated in this article, or claim that may be made by its manufacturer, is not guaranteed or endorsed by the publisher.
Abbreviations
AQP4, aquaporin-4; ASCs, antibody-secreting cells; DN B cells, double negative B cells; HCs, healthy controls; MFI, mean fluorescence intensity; NMOSD, Neuromyelitis optica spectrum disorder; PBMCs, peripheral blood mononuclear cells; PD-1, programmed cell death 1; PD-L, programmed cell death 1 ligand; SWM B cells, switched memory B cells; Tfh cells, follicular T helper cells; Tfr cells, follicular regulatory T cells; Tph cells, peripheral T helper cells; USM B cells, unswitched memory B cells.
References
1. Wingerchuk D, Lennon V, Lucchinetti C, Pittock S, Weinshenker B. The Spectrum of Neuromyelitis Optica. Lancet Neurol (2007) 6:805–15. doi: 10.1016/S1474-4422(07)70216-8
2. Wingerchuk D, Banwell B, Bennett J, Cabre P, Carroll W, Chitnis T, et al. International Consensus Diagnostic Criteria for Neuromyelitis Optica Spectrum Disorders. Neurology (2015) 85:177–89. doi: 10.1212/WNL.0000000000001729
3. Bennett J, O’Connor K, Bar-Or A, Zamvil S, Hemmer B, Tedder T, et al. B Lymphocytes in Neuromyelitis Optica. Neurol Neuroimmunol Neuroinflamm (2015) 2:e104. doi: 10.1212/NXI.0000000000000104
4. Chihara N, Aranami T, Sato W, Miyazaki Y, Miyake S, Okamoto T, et al. Interleukin 6 Signaling Promotes Anti-Aquaporin 4 Autoantibody Production From Plasmablasts in Neuromyelitis Optica. Proc Natl Acad Sci USA (2011) 108:3701–6. doi: 10.1073/pnas.1017385108
5. Wilson R, Makuch M, Kienzler AK, Varley J, Taylor J, Woodhall M, et al. Condition-Dependent Generation of Aquaporin-4 Antibodies From Circulating B Cells in Neuromyelitis Optica. Brain (2018) 141:1063–74. doi: 10.1093/brain/awy010
6. Li Y, Zhang F, Qi Y, Chang G, Fu Y, Su L, et al. Association of Circulating Follicular Helper T Cells With Disease Course of NMO Spectrum Disorders. J Neuroimmunol (2015) 278:239–46. doi: 10.1016/j.jneuroim.2014.11.011
7. Rao DA, Gurish MF, Marshall JL, Slowikowski K, Fonseka CY, Liu Y, et al. Pathologically Expanded Peripheral T Helper Cell Subset Drives B Cells in Rheumatoid Arthritis. Nature (2017) 542:110–4. doi: 10.1038/nature20810
8. Agasing A, Wu Q, Khatri B, Borisow N, Ruprecht K, Brandt A, et al. Transcriptomics and Proteomics Reveal a Cooperation Between Interferon and T-Helper 17 Cells in Neuromyelitis Optica. Nat Commun (2020) 11:2856. doi: 10.1038/s41467-020-16625-7
9. Varrin-Doyer M, Spencer C, Schulze-Topphoff U, Nelson P, Stroud R, Cree B, et al. Aquaporin 4-Specific T Cells in Neuromyelitis Optica Exhibit a Th17 Bias and Recognize Clostridium ABC Transporter. Ann Neurol (2012) 72:53–64. doi: 10.1002/ana.23651
10. Shi J, Hou S, Fang Q, Liu X, Liu X, Qi H. PD-1 Controls Follicular T Helper Cell Positioning and Function. Immunity (2018) 49:264–74.e264. doi: 10.1016/j.immuni.2018.06.012
11. Salama A, Chitnis T, Imitola J, Ansari M, Akiba H, Tushima F, et al. Critical Role of the Programmed Death-1 (PD-1) Pathway in Regulation of Experimental Autoimmune Encephalomyelitis. J Exp Med (2003) 198:71–8. doi: 10.1084/jem.20022119
12. Khan A, Hams E, Floudas A, Sparwasser T, Weaver C, Fallon P. PD-L1hi B Cells Are Critical Regulators of Humoral Immunity. Nat Commun (2015) 6:5997. doi: 10.1038/ncomms6997
13. Murakami M, Kamimura D, Hirano T. Pleiotropy and Specificity: Insights From the Interleukin 6 Family of Cytokines. Immunity (2019) 50:812–31. doi: 10.1016/j.immuni.2019.03.027
14. Kang S, Tanaka T, Narazaki M, Kishimoto T. Targeting Interleukin-6 Signaling in Clinic. Immunity (2019) 50:1007–23. doi: 10.1016/j.immuni.2019.03.026
15. Zhang C, Zhang M, Qiu W, Ma H, Zhang X, Zhu Z, et al. Safety and Efficacy of Tocilizumab Versus Azathioprine in Highly Relapsing Neuromyelitis Optica Spectrum Disorder (TANGO): An Open-Label, Multicentre, Randomised, Phase 2 Trial. Lancet Neurol (2020) 19:391–401. doi: 10.1016/S1474-4422(20)30070-3
16. Haas J, Bekeredjian-Ding I, Milkova M, Balint B, Schwarz A, Korporal M, et al. B Cells Undergo Unique Compartmentalized Redistribution in Multiple Sclerosis. J Autoimmun (2011) 37:289–99. doi: 10.1016/j.jaut.2011.08.003
17. Kemmerer C, Pernpeintner V, Ruschil C, Abdelhak A, Scholl M, Ziemann U, et al. Differential Effects of Disease Modifying Drugs on Peripheral Blood B Cell Subsets: A Cross Sectional Study in Multiple Sclerosis Patients Treated With Interferon-β, Glatiramer Acetate, Dimethyl Fumarate, Fingolimod or Natalizumab. PloS One (2020) 15:e0235449. doi: 10.1371/journal.pone.0235449
18. Kowarik M, Astling D, Lepennetier G, Ritchie A, Hemmer B, Owens G, et al. Differential Effects of Fingolimod and Natalizumab on B Cell Repertoires in Multiple Sclerosis Patients. Neurotherapeutics (2021) 18:364–77. doi: 10.1007/s13311-020-00975-7
19. Moura RA, Quaresma C, Vieira AR, Goncalves MJ, Polido-Pereira J, Romao VC, et al. B-Cell Phenotype and IgD-CD27- Memory B Cells are Affected by TNF-Inhibitors and Tocilizumab Treatment in Rheumatoid Arthritis. PloS One (2017) 12:e0182927. doi: 10.1371/journal.pone.0182927
20. Jacobi A, Reiter K, Mackay M, Aranow C, Hiepe F, Radbruch A, et al. Activated Memory B Cell Subsets Correlate With Disease Activity in Systemic Lupus Erythematosus: Delineation by Expression of CD27, IgD, and CD95. Arthritis Rheum (2008) 58:1762–73. doi: 10.1002/art.23498
21. Claes N, Fraussen J, Vanheusden M, Hellings N, Stinissen P, Van Wijmeersch B, et al. Age-Associated B Cells With Proinflammatory Characteristics Are Expanded in a Proportion of Multiple Sclerosis Patients. J Immunol (Baltimore Md 1950) (2016) 197:4576–83. doi: 10.4049/jimmunol.1502448
22. Fraussen J, Marquez S, Takata K, Beckers L, Montes Diaz G, Zografou C, et al. Phenotypic and Ig Repertoire Analyses Indicate a Common Origin of IgDCD27 Double Negative B Cells in Healthy Individuals and Multiple Sclerosis Patients. J Immunol (Baltimore Md 1950) (2019) 203:1650–64. doi: 10.4049/jimmunol.1801236
23. Kowarik M, Astling D, Gasperi C, Wemlinger S, Schumann H, Dzieciatkowska M, et al. CNS Aquaporin-4-Specific B Cells Connect With Multiple B-cell Compartments in Neuromyelitis Optica Spectrum Disorder. Ann Clin Trans Neurol (2017) 4:369–80. doi: 10.1002/acn3.418
24. Nakayamada S, Kubo S, Yoshikawa M, Miyazaki Y, Yunoue N, Iwata S, et al. Differential Effects of Biological DMARDs on Peripheral Immune Cell Phenotypes in Patients With Rheumatoid Arthritis. Rheumatology (Oxf Engl) (2018) 57:164–74. doi: 10.1093/rheumatology/kex012
25. Jenks SA, Cashman KS, Zumaquero E, Marigorta UM, Patel AV, Wang X, et al. Distinct Effector B Cells Induced by Unregulated Toll-Like Receptor 7 Contribute to Pathogenic Responses in Systemic Lupus Erythematosus. Immunity (2018) 49:725–39.e726. doi: 10.1016/j.immuni.2018.08.015
26. Sachinidis A, Xanthopoulos K, Garyfallos A. Age-Associated B Cells (ABCs) in the Prognosis, Diagnosis and Therapy of Systemic Lupus Erythematosus (SLE). Mediterr J Rheumatol (2020) 31:311–8. doi: 10.31138/mjr.31.3.311
27. Mahmood Z, Muhammad K, Schmalzing M, Roll P, Dörner T, Tony H. CD27-IgD- Memory B Cells are Modulated by In Vivo Interleukin-6 Receptor (IL-6R) Blockade in Rheumatoid Arthritis. Arthritis Res Ther (2015) 17:61. doi: 10.1186/s13075-015-0580-y
28. Nicolas P, Ruiz A, Cobo-Calvo A, Fiard G, Giraudon P, Vukusic S, et al. The Balance in T Follicular Helper Cell Subsets Is Altered in Neuromyelitis Optica Spectrum Disorder Patients and Restored by Rituximab. Front Immunol (2019) 10:2686. doi: 10.3389/fimmu.2019.02686
29. Fan X, Jiang Y, Han J, Liu J, Wei Y, Jiang X, et al. Circulating Memory T Follicular Helper Cells in Patients With Neuromyelitis Optica/Neuromyelitis Optica Spectrum Disorders. Mediators Inflamm (2016) 2016:3678152. doi: 10.1155/2016/3678152
30. Chavele K, Merry E, Ehrenstein M. Cutting Edge: Circulating Plasmablasts Induce the Differentiation of Human T Follicular Helper Cells Via IL-6 Production. J Immunol (Baltimore Md 1950) (2015) 194:2482–5. doi: 10.4049/jimmunol.1401190
31. Shen P, Fillatreau S. Antibody-Independent Functions of B Cells: A Focus on Cytokines. Nat Rev Immunol (2015) 15:441–51. doi: 10.1038/nri3857
32. Roldan E, Brieva JA. Terminal Differentiation of Human Bone Marrow Cells Capable of Spontaneous and High-Rate Immunoglobulin Secretion: Role of Bone Marrow Stromal Cells and Interleukin 6. Eur J Immunol (1991) 21:2671–7. doi: 10.1002/eji.1830211105
33. Cassese G, Arce S, Hauser AE, Lehnert K, Moewes B, Mostarac M, et al. Plasma Cell Survival is Mediated by Synergistic Effects of Cytokines and Adhesion-Dependent Signals. J Immunol (2003) 171:1684–90. doi: 10.4049/jimmunol.171.4.1684
34. Nurieva RI, Chung Y, Martinez GJ, Yang XO, Tanaka S, Matskevitch TD, et al. Bcl6 Mediates the Development of T Follicular Helper Cells. Science (2009) 325:1001–5. doi: 10.1126/science.1176676
35. Rawlings DJ, Metzler G, Wray-Dutra M, Jackson SW. Altered B Cell Signalling in Autoimmunity. Nat Rev Immunol (2017) 17:421–36. doi: 10.1038/nri.2017.24
36. Makiyama A, Chiba A, Noto D, Murayama G, Yamaji K, Tamura N, et al. Expanded Circulating Peripheral Helper T Cells in Systemic Lupus Erythematosus: Association With Disease Activity and B Cell Differentiation. Rheumatology (Oxford) (2019) 58:1861–9. doi: 10.1093/rheumatology/kez077
37. Stefanski A, Wiedemann A, Reiter K, Hiepe F, Lino A, Dörner T. Enhanced Programmed Death 1 and Diminished Programmed Death Ligand 1 Up-Regulation Capacity of Post-Activated Lupus B Cells. Arthritis Rheumatol (Hoboken NJ) (2019) 71:1539–44. doi: 10.1002/art.40897
Keywords: NMOSD, tocilizumab, B cells, T helper cells, PD-1, PD-L
Citation: Liu Y, Zhang H, Zhang T-X, Yuan M, Du C, Zeng P, Huang Z, Jia D, Yang G, Shi F-D and Zhang C (2021) Effects of Tocilizumab Therapy on Circulating B Cells and T Helper Cells in Patients With Neuromyelitis Optica Spectrum Disorder. Front. Immunol. 12:703931. doi: 10.3389/fimmu.2021.703931
Received: 01 May 2021; Accepted: 14 July 2021;
Published: 29 July 2021.
Edited by:
Zahava Vadasz, Technion Israel Institute of Technology, IsraelReviewed by:
Loredana Frasca, National Institute of Health (ISS), ItalySun Jung Kim, Northwell Health, United States
Copyright © 2021 Liu, Zhang, Zhang, Yuan, Du, Zeng, Huang, Jia, Yang, Shi and Zhang. This is an open-access article distributed under the terms of the Creative Commons Attribution License (CC BY). The use, distribution or reproduction in other forums is permitted, provided the original author(s) and the copyright owner(s) are credited and that the original publication in this journal is cited, in accordance with accepted academic practice. No use, distribution or reproduction is permitted which does not comply with these terms.
*Correspondence: Chao Zhang, Y2hhb3poYW5nQHRtdS5lZHUuY24=