 Nicole C. Smith1*
 Navaneethaiyer Umasuthan1
 Surendra Kumar1
 Nardos T. Woldemariam2Rune Andreassen2
 Sherri L. Christian3*
 Matthew L. Rise1
- 1Department of Ocean Sciences, Memorial University of Newfoundland, St. John’s, NL, Canada
- 2Department of Life Sciences and Health, OsloMet-Oslo Metropolitan University, Oslo, Norway
- 3Department of Biochemistry, Memorial University of Newfoundland, St. John’s, NL, Canada
The Atlantic salmon (Salmo salar) is an economically important fish, both in aquaculture and in the wild. In vertebrates, macrophages are some of the first cell types to respond to pathogen infection and disease. While macrophage biology has been characterized in mammals, less is known in fish. Our previous work identified changes in the morphology, phagocytic ability, and miRNA profile of Atlantic salmon adherent head kidney leukocytes (HKLs) from predominantly “monocyte-like” at Day 1 of in vitro culture to predominantly “macrophage-like” at Day 5 of culture. Therefore, to further characterize these two cell populations, we examined the mRNA transcriptome profile in Day 1 and Day 5 HKLs using a 44K oligonucleotide microarray. Large changes in the transcriptome were revealed, including changes in the expression of macrophage and immune-related transcripts (e.g. csf1r, arg1, tnfa, mx2), lipid-related transcripts (e.g. fasn, dhcr7, fabp6), and transcription factors involved in macrophage differentiation and function (e.g. klf2, klf9, irf7, irf8, stat1). The in silico target prediction analysis of differentially expressed genes (DEGs) using miRNAs known to change expression in Day 5 HKLs, followed by gene pathway enrichment analysis, supported that these miRNAs may be involved in macrophage maturation by targeting specific DEGs. Elucidating how immune cells, such as macrophages, develop and function is a key step in understanding the Atlantic salmon immune system. Overall, the results indicate that, without the addition of exogenous factors, the adherent HKL cell population differentiates in vitro to become macrophage-like.
Introduction
Macrophages are white blood cells, found in all vertebrate species, that play a role in both the innate and adaptive immune systems (1). In innate immunity, macrophages provide some of the first lines of defense against infections and diseases, where they act as phagocytic cells to destroy foreign pathogens (2). In the adaptive immune system, macrophages function as a bridge between the innate and adaptive immune responses, acting as antigen-presenting cells to activate T lymphocytes (2, 3). Much of our knowledge of macrophage biology, such as macrophage differentiation and polarization, comes from mammalian models, while macrophages remain to be fully characterized across all fish species. However, using the mammalian model system as a platform and through various fish models, including zebrafish (Danio rerio), ginbuna crucian carp (Carassius langsdorfii) and goldfish (Carassius auratus), our knowledge of fish macrophage differentiation and activation is starting to expand [reviewed in (4)].
The ways in which macrophages respond to infections and diseases have been well-characterized in mammals: by producing cytokines and other inflammation-related proteins, by engulfing foreign pathogens through phagocytosis, and by destroying foreign pathogens by producing reactive oxygen species (ROS) and nitric oxide (NO), among other responses (2, 5). Macrophages demonstrate a high degree of plasticity, with the ability to generate different subtypes (also well described in mammals): M1 macrophages (or classically activated) and M2 macrophages (or alternatively activated) (6). M2 macrophages can be further separated into distinct sub-populations, based on their activation and function (M2a, M2b, M2c) (6). M1 macrophages are considered pro-inflammatory; they are activated by cytokines including IFN-γ and TNF-α and produce pro-inflammatory cytokines and ROS to protect against pathogens (7). Similar to mammals, IFN-γ and TNF-α have been described in several fish species, where they induce pro-inflammatory effects including increased phagocytosis, increased ROS and NO production, and enhanced expression of inflammatory cytokines (8–16). On the other hand, M2 macrophages are considered anti-inflammatory and are linked to immunosuppression and wound repair. M2 macrophages are activated by cytokines such as IL-4 and IL-13 (M2a), immune complexes or apoptotic cells (M2b) and IL-10, TGF-β or glucocorticoids (M2c) and are characterized by increased arginase activity, decreased microbicidal activity, and increased production of collagen and polyamines necessary for cell growth and wound-healing (3, 7, 17, 18). Teleost fish il-4/13A and il-4/13B genes have been identified and have similar functions as their mammalian counterparts; stimulation of macrophages from various teleost species with recombinant (r-) IL-4/13A and r-IL-4/13B increased the expression of immunosuppressive genes such as tgf-β, il-10 and socs3, increased arginase activity, and decreased the expression of pro-inflammatory genes and NO production (3, 10, 18–21).
Hematopoiesis, the process of blood cell formation, begins when a self-renewing hematopoietic stem cell (HSC) commits to a multipotent progenitor (MPP), which then gives rise to a common myeloid progenitor (CMP) cell. The CMP will then differentiate into either a megakaryocyte/erythroid progenitor (MEP) or a granulocyte/macrophage progenitor (GMP), which gives rise to erythrocytes/platelets or granulocytes/monocytes, respectively (4, 22). This process is tightly controlled by a multitude of cytokines, growth factors, and transcription factors and has been extensively studied in mammals. In particular, monocyte-to-macrophage differentiation, as well as macrophage polarization, are regulated by multiple factors including the growth factor colony-stimulating factor 1 (CSF1) and its receptor, CSF1R, the transcription factor PU.1, and members of the CCAAT/enhancer-binding proteins (C/EBP), interferon regulatory factor (IRF) and signal transducer and activator of transcription (STAT) families, among many others [reviewed in (23)]. One of the first studies to investigate fish macrophage differentiation examined goldfish primary kidney macrophages and identified three sub-populations that were characterized as progenitor cells, monocytes, and macrophages, with each population expressing differentiation markers including c-kit (early progenitors), granulin (monocytes) and legumain (mature macrophages) (24). It is now well-known that CSF1 and CSF1R are required for both mammalian and teleost myeloid cell differentiation (3). While our knowledge of fish macrophage biology is advancing, macrophage differentiation and polarization across all teleost species, including the Atlantic salmon (Salmo salar), remain to be described. The Atlantic salmon is an economically important farmed fish species in several countries including Canada, Norway and Chile. Given the essential role of macrophages in defense against pathogens, investigation into the genes and molecular pathways involved in Atlantic salmon macrophage differentiation and function is central to fully understanding the fish immune response and will aid in developing methods of disease prevention, therefore improving the health of farmed fish.
In mammals, HSCs originate from the bone marrow, while in fish, the primary hematopoietic organ is the anterior (or head) kidney. A heterogeneous population of adherent leukocytes, containing monocytes and macrophages, amongst other cells, can be isolated from the head kidney using Percoll density gradient centrifugation (21, 25, 26). Adherent head kidney leukocytes (HKLs) are frequently used as a macrophage-like model in fish immunological studies [(27–31), and many others]; however, many of these studies use HKLs from different culture times, which may produce data that are from different cell populations. Our previous work observed a change in the morphology, phagocytic ability, and miRNA profile of Atlantic salmon HKLs in vitro, suggesting that the cells differentiate from predominantly “monocyte-like” at Day 1 of culture to predominantly “macrophage-like” at Day 5 of culture (32). Microarrays are powerful tools that have been used to identify changes in gene expression profiles during fish immune responses [reviewed in (33, 34)]. Therefore, to further characterize the HKLs in vitro, we used 44K salmonid oligonucleotide microarrays (35) to examine the global transcript expression profiles of Atlantic salmon adherent Day 1 HKLs versus Day 5 HKLs.
Materials and Methods
Animals
The Atlantic salmon (1.2 kg ± 0.3 kg SD) used in this experiment were held in the Dr. Joe Brown Aquatic Research Building (JBARB) of the Ocean Sciences Centre in a 3,800 L tank and kept at 12°C with 95-110% oxygen saturation, using a flow-through seawater system. All procedures in this experiment were approved by Memorial University of Newfoundland’s Institutional Animal Care Committee (protocols: 18-01-MR and 14-02-MR) based on the guidelines of the Canadian Council of Animal Care. Five animals were used for the microarray experiment (one animal was removed following array hybridizations due to a technical error in labelling, therefore 4 animals were used for subsequent analysis), and 5 different animals were used for RT-qPCR analysis.
Macrophage Isolation and Culture
HKLs were isolated as previously described (32, 36). Atlantic salmon were euthanized with an overdose of MS222 (0.4 g/L, Syndel Laboratories, Vancouver, BC, Canada). The head kidney was removed and placed in isolation media: 500 mL of Leibovitz-15 medium (L-15, Gibco, Carlsbad, CA, USA) supplemented with 2.5% fetal bovine serum (FBS, Gibco), 1% penicillin/streptomycin (Gibco), and 27.5 mg of heparin (Sigma-Aldrich, St. Louis, MO, USA). The head kidney was pushed through a 100 µM nylon cell strainer (Thermo-Fisher Scientific, Waltham, MA, USA), then placed on a 34/51% Percoll gradient (GE Healthcare, Uppsala, Sweden) prepared with 5% Hank’s buffered salt solution (HBSS; Sigma-Aldrich) to ensure an isotonic solution, and centrifuged at 500 x g for 30 min at 4°C. Following centrifugation, the interface between the 34% and 51% gradient, which contains leukocytes, was collected and washed twice in isolation media at 500 x g for 5 min at 4°C. The cells were then re-suspended in culture media (L-15 supplemented with 5% FBS and 1% penicillin/streptomycin), and viable cells were counted on a hemocytometer using the Trypan Blue (Sigma-Aldrich) exclusion method. The cells were then seeded in 6-well culture plates (Corning Inc., Corning, NY, USA) at 3 x 10⁷ cells in 2 mL of culture media and incubated at 15°C for 24 h to allow cell adherence. Cells were then washed twice in culture media to remove non-adherent cells, and the media was replaced with fresh culture media. Media was changed every 48 h thereafter for up to 5 days.
Sampling of Head Kidney Cells for RNA Extraction
Twenty-four hours (Day 1) and 120 h (Day 5) after seeding, cells were washed twice in cell culture media then lysed in 500 μL of TRIzol (Invitrogen, Burlington, ON, Canada) and immediately placed at -80°C until RNA extraction.
RNA Extraction
Total RNA was extracted from the TRIzol-lysed samples following the manufacturer’s protocol, and RNA pellets were dissolved in DNase/RNase-free water (Gibco). The RNA samples were treated with 6.8 Kunitz units of DNase I (Qiagen, Mississauga, ON, Canada) to degrade residual genomic DNA, followed by purification using the RNeasy MinElute Cleanup Kit (Qiagen) according to the manufacturer’s protocol. RNA concentration was measured using NanoDrop spectrophotometry, and RNA integrity was checked by 1% agarose gel electrophoresis. All column-purified RNA samples had A260/280 and A260/230 ratios above 1.8.
Microarray Hybridization
Day 1 (24 h) and Day 5 (120 h) samples were subjected to microarray analysis using the consortium for Genomic Research on All Salmonids Project (cGRASP)-designed Agilent 44K salmonid oligonucleotide microarray (35). The microarray experiment was based on a common reference design, where the differences among Day 1 and Day 5 HKL samples were determined by comparing individual samples against a common reference pool consisting of equal quantities from all samples.
Five hundred nanograms of each sample of DNase-treated, column purified RNA were in vitro transcribed into antisense amplified RNA (aRNA) using the Amino Allyl MessageAmp™ II aRNA Amplification Kit (Ambion, Carlsbad, CA, USA) following the manufacturer’s instructions. The quality and quantity of the aRNAs were checked by agarose gel electrophoresis and NanoDrop spectrophotometry, respectively. Amplified RNA from all samples was pooled and used as a common reference. Twenty micrograms of aRNA were ethanol precipitated overnight and re-suspended in coupling buffer. The experimental samples were then labelled with Cy5 (GE Healthcare Life Sciences, Buckinghamshire, UK), while the common reference was labelled with Cy3 (GE Healthcare Life Sciences), following the manufacturer’s instructions. The efficiency of labelling and aRNA concentration were assessed using the “microarray” function of the NanoDrop spectrophotometer. The Cy5-labelled aRNA (825 ng) from each experimental sample was mixed with an equal quantity of Cy3-labelled aRNA from the common reference, and the resulting pool was fragmented using the Gene Expression Hybridization Kit, following the manufacturer’s instructions (Agilent, Mississauga, ON, Canada). Each labelled aRNA pool was co-hybridized to the microarray (8 arrays final in total, Figure 1A) for 17 h at 65°C with 10 rpm rotation using an Agilent hybridization oven. The array slides were washed immediately following hybridization as per the manufacturer’s instructions.
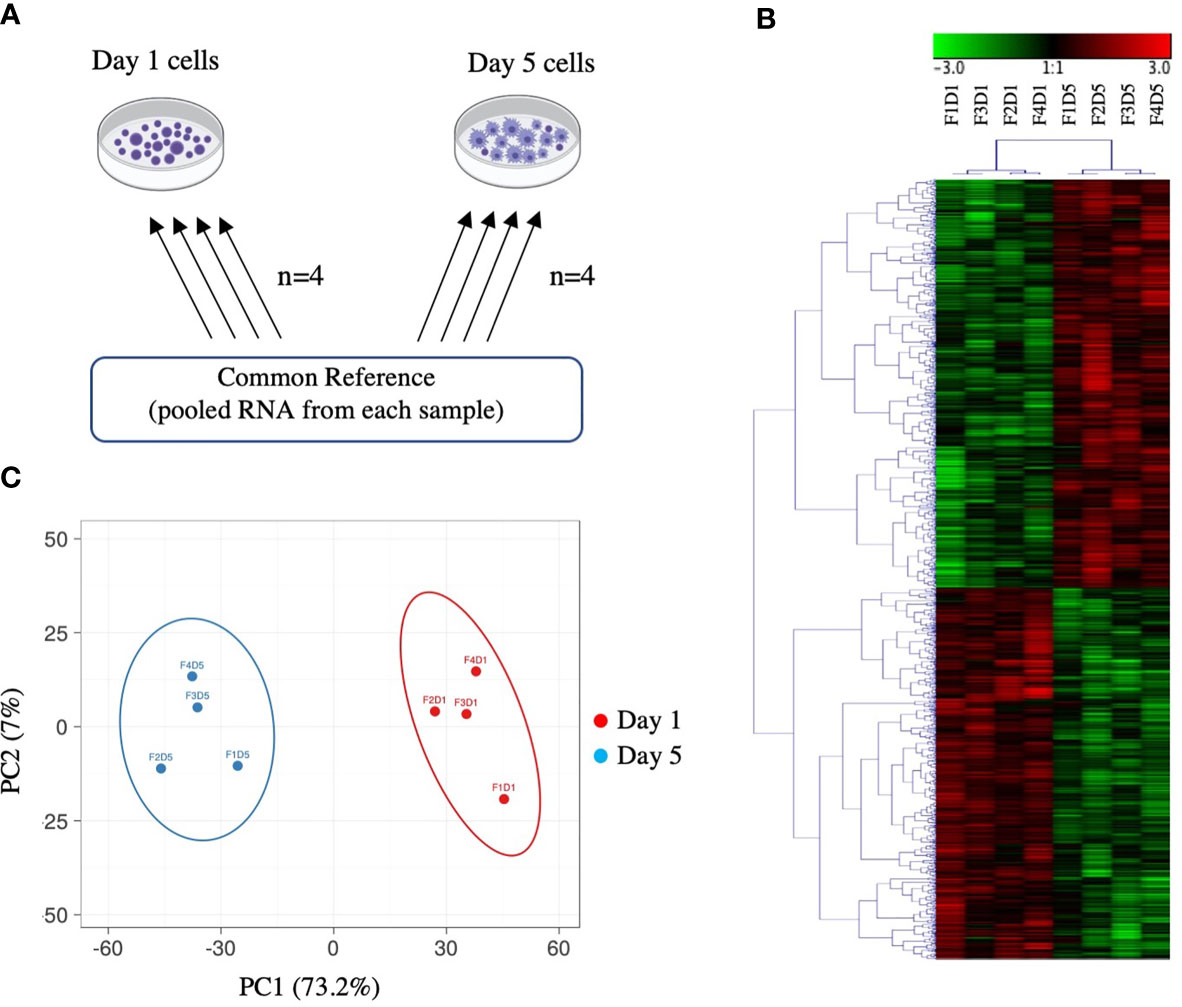
Figure 1 Overview of microarray experimental design and global gene expression profiles. (A) Common reference-based microarray experimental design. Each arrow represents one array and identifies the samples co-hybridized on that array; the base of the arrow identifies the Cy3-labeled sample and the head of the arrow identifies the Cy5-labeled sample. (B) Hierarchical clustering analysis of 2140 DEPs in Day 1 and Day 5 HKLs identified by paired SAM (FDR 0.05). Complete linkage was performed on median-centred genes using a Pearson correlation. Green represents downregulation and red represents upregulation. F represents fish; D represents Day (i.e. F1D1 is Fish 1 Day 1). (C) Principal component analysis (PCA) of Day 1 and Day 5 samples based on DEPs identified by paired SAM (FDR 0.05). Day 5 samples are represented by blue, Day 1 samples are represented by red. The X and Y axis show principal component 1 (PC1) and principal component 2 (PC2) that explain 73.2% and 7% of the total variance, respectively.
Microarray Data Acquisition and Analysis
The microarray slides were scanned at 5 µm resolution and 90% laser power using a ScanArray Gx Plus scanner and ScanExpress v4.0 software (Perkin Elmer, Waltham, MA, USA), and the Cy3 and Cy5 channel photomultiplier tube (PMT) settings were adjusted to balance the fluorescence signal. The raw data were saved as TIFF images, and the signal intensity data were extracted using Imagene 9.0 (BioDiscovery, El Segundo, CA, USA). R and the Bioconductor package ‘marray’ were used for background correction, removal of low-quality spots on the microarray and to log2-transform and Loess-normalize the data (37). Probes with more than 25% missing values were omitted from the dataset, and the missing values were imputed using the least square methods (‘EM_array’) and the ‘LSimpute’ package (37–39). The final dataset that was used for statistical analyses consisted of 18,108 probes for all arrays. The data have been submitted to NCBI’s Gene Expression Omnibus and are accessible through GEO Series accession number GSE173493.
A two-class paired Significance Analysis of Microarrays (SAM) (40) with a false discovery rate (FDR) of 0.05 was used to determine the differentially expressed probes (DEPs) between Day 1 and Day 5 groups, using R and the SAM project GitHub repository (https://github.com/MikeJSeo/SAM) (41). The resulting significant transcript lists were annotated using the contiguous sequences that were used to design the 60mer oligonucleotide probes of the array (35). Annotation was carried out with BLASTx searches against the NCBI non-redundant (nr) amino acid sequence database using an E-value threshold of 10-5 (42).
GO Term Enrichment and Network Analysis, Hierarchical Clustering Analysis and Principal Coordinate Analysis
Gene Ontology (GO) term enrichment analyses for all (both upregulated and downregulated) differentially expressed genes (DEGs; the distinction between DEPs and DEGs is explained in section 3.1), with a fold-change > |2| were performed using ClueGO plugin, available for the Cytoscape software (version 3.8.2). The ClueGO plug-in identifies and integrates significant GO terms from large gene lists and generates a functionally grouped GO term network (43). In this study, the GO database (30.03.2021) for the categories biological process (BP) and cellular component (CC) was used for analysis. The enrichment/depletion analysis was performed using a two-sided hypergeometric test after its adjustment by the Bonferroni step-down procedure. The kappa-statistics score threshold was set to 0.4 and GO pathways/terms with a p-value <0.05, corrected with the Bonferroni step-down procedure, were considered significant.
Genesis software (Rockville, MD, USA) was used for the hierarchical clustering and heatmap visualization of median centered data of DEPs (for analysis of the entire experiment) and of DEGs (for analysis of selected significant GO terms identified using ClueGO; see section 3.2) using Pearson correlation and complete linkage clustering. Hierarchical clustering analysis of all DEPs grouped Day 1 samples together and Day 5 samples together, with the exception of 1 fish (Fish 5), which we eliminated from further analysis. Principal components were calculated using the Singular Value Decomposition method and ClustVis: a web tool for visualizing clustering of multivariate data using Principal Component Analysis and heatmap (44).
cDNA Synthesis
Five hundred nanograms of purified RNA were reverse transcribed to cDNA in 20 µL reactions consisting of random primers (250 ng; Invitrogen) and MMLV-reverse transcriptase (200 U; Invitrogen) with the manufacturer’s first-strand buffer (1x final concentration), DTT (10 mM final concentration), 10 mM dNTP mix (10 mM each of dATP, dGTP, dCTP and dTTP) and RNase OUT (40 Units; Invitrogen) at 37°C for 50 min.
Reverse Transcription Quantitative PCR (RT-qPCR)
For RT-qPCR validation, HKLs from 5 additional Atlantic salmon (i.e. different from those used in the microarray experiment) were harvested, RNA isolated, and cDNA synthesized as described above. All primer sets used for RT-qPCR analysis were quality-tested according to MIQE guidelines (45). For each primer set, amplification efficiencies were determined by a 5-point standard curve using pooled cDNA from 5 fish, starting at 10 ng of input RNA, diluted in DNAse/RNAse-free water (Thermo Fisher Scientific) (46). Only primer pairs generating an amplicon with a single melting peak and no primer-dimer present in the no-template control (NTC) were used for RT-qPCR analysis. Primer sequences, amplification efficiencies, R2, and amplicon sizes for each assay can be found in Supplementary Table 1.
Five candidate normalizer genes were tested with cDNA from all experimental samples to determine the 2 most stable normalizer transcripts (i.e. with lowest M-value) using GeNorm software (47). The candidate normalizer genes tested were 60S ribosomal protein 32 (rpl32), elongation factor 1 alpha-1 (ef1a1), RNA polymerase 2 (polr2), polyadenylate-binding protein 1 (pabpc1) and elongation factor 1-alpha-2 (ef1a2). The 3 most stable genes were ef1a2 (M-value 0.180), ef1a1 (M-value 0.187) and rpl32 (M-value 0.198). The normalizers chosen for this study were ef1a2 and rpl32. The geometric mean of ef1a2 and rpl32 was calculated for each sample and was used as normalizer value in the relative quantity (RQ) calculations stated below.
For each reaction, 50 nM of both the forward and reverse primers and cDNA template representing 5 ng of input RNA were mixed with Power SYBR Green Master Mix (Thermo Fisher Scientific) for a total reaction volume of 13 µl. The real-time analysis program consisted of 1 cycle of 50°C for 2 min, 1 cycle of 95°C for 10 min, and 40 cycles of 95°C for 15 sec and 60°C for 1 min, with fluorescence detection at the end of each 60°C step. All reactions were run in triplicate in a ViiA 7 Real-Time PCR System (384-well format) (Applied Biosystems/Life Technologies). The RQ values of a given mRNA of interest were calculated using Excel, and relative to a calibrator [i.e. the Day 1 sample with the lowest expression (i.e. assigned a RQ value = 1.0)] taking into account the amplification efficiencies (46). A paired Student’s T-test was used to determine statistical differences. Differences were considered statistically significant at P<0.05. All statistical analyses were performed using GraphPad Prism v 8.0 (GraphPad Software, La Jolla, CA, USA, www.graphpad.com).
In Silico Prediction of Putative miRNA Target Genes and Target Gene Pathway Analysis
The miRNA target prediction tool RNAhybrid (v.2.2) (48) was used to determine if any of the DEGs identified in this study could be potential targets of the miRNAs identified as significantly differentially expressed (DE) in Day 1 monocyte-like cells compared with Day 5 macrophage-like cells in Smith et al. (32). The mature miRNAs analyzed were selected from those DE in Smith et al. (32), but in cases where both mature miRNAs from the same precursor were DE then only the most abundant (which is most likely to be the guide miRNA) was used. The 36 miRNAs used, along with their mature sequences (49) are given in Supplementary Table 2. The parameters applied in the RNA hybrid analysis were: No G:U in seed, helix constraint 2–8, loop constraints 5–5 and a minimum free energy threshold of -20 kcal/mol. These parameters allowed RNAhybrid to detect only candidate genes with perfect seed complementarity and high base-pairing stability.
The input sequences for target genes were those DEGs from this study with 3’ untranslated region (UTR) information, found using the ExUTR pipeline (50); i.e. a total of 1234 out of the 1477 DEGs. The predicted target genes from the in silico target gene prediction analysis were used as input in a gene pathway enrichment analysis (51) against the bioplanet database of all known biological pathways (52). Gene pathways are poorly described in Atlantic salmon, therefore the gene symbols for putative human orthologs were used against the human database. The significance level for enrichment was set as p-adjusted (Q-value) less than 0.05.
Results
Global Transcriptomic Changes in Atlantic Salmon HKLs in Response to Culture Period
Our previous work identified a change in the morphology, phagocytic ability, miRNA profile, and mRNA expression of two macrophage markers (mhc ii and marco), in Day 1 and Day 5 adherent HKLs (32). To explore changes in the mRNA transcriptome between these two cell populations, the DEPs between Day 1 (i.e. predominantly monocyte-like) and Day 5 (i.e. predominantly macrophage-like) HKLs were identified using a 44K salmonid microarray platform (35). The design for this microarray study is illustrated in Figure 1A. Using paired Significance Analysis of Microarrays (SAM) and a false discovery rate (FDR) of 0.05, 2140 DEPs were identified; 1123 DEPs were identified as upregulated in Day 5 HKLs compared to Day 1 HKLs while 1017 DEPs were downregulated in Day 5 HKLs compared to Day 1 HKLs. Using BLASTn/BLASTx searches against NCBI nr/nt databases, putative identities were determined for 2034 of the 2140 DEPs (1076 upregulated DEPs, 958 downregulated DEPs). The 44K platform contains some redundancies (i.e. multiple probes for one gene). Therefore, taking the redundancy into account, 1477 differentially expressed genes (DEGs) with known putative identities were identified (797 upregulated DEGs in Day 5 and 680 downregulated DEGs in Day 5). Selected DEPs for discussion can be found in Table 1, and complete information on the DEPs and paired SAM results can be found in Supplementary Tables 3 and 4.
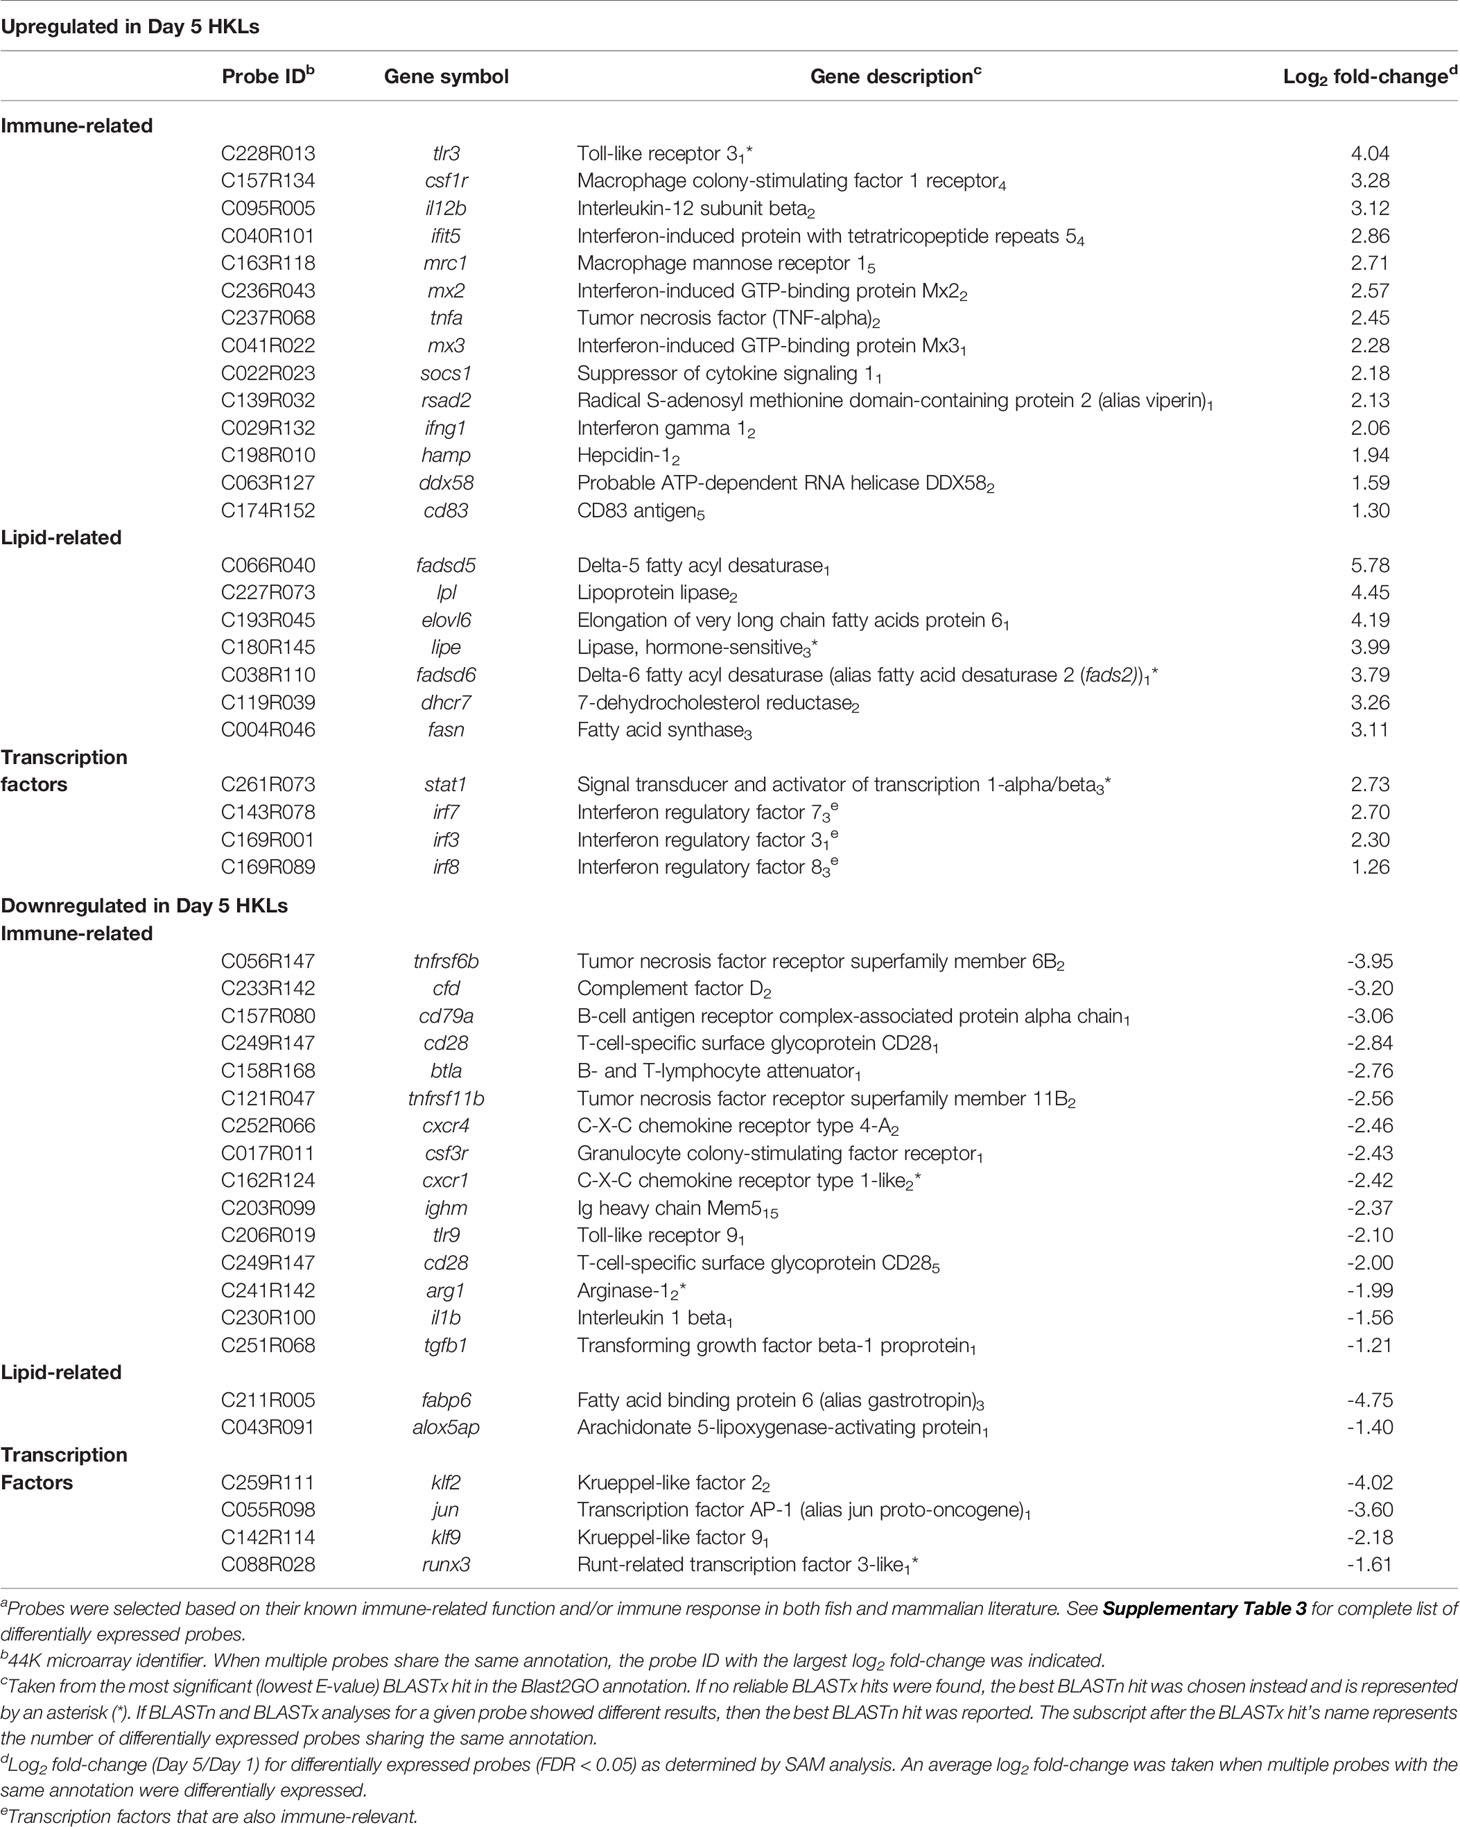
Table 1 Selecteda probes differentially expressed between Day 1 and Day 5 HKLs.
Hierarchical clustering analysis of median-centered DEPs grouped Day 1 samples and Day 5 samples separately (Figure 1B). Similarly, principal component analysis (PCA) also grouped Day 1 samples separately from Day 5 samples together (Figure 1C). PC1 and PC2 accounted for 73.2% and 7.0% of the variation, respectively. Day 1 samples showed a positive loading on PC1, whereas Day 5 samples showed a negative loading on PC1. There was a near split between positive/negative loading on PC2 with both Day 1 and Day 5 samples. These data indicate that Day 1 HKLs and Day 5 HKLs represent two separate groups of cells with distinct molecular phenotypes.
GO Term Network Analysis Identified Immune-Related and Lipid-Related Terms
To further understand the biological relevance of the identified DEGs, gene ontology (GO) term enrichment analyses, followed by network analysis, were performed on all DEGs with a fold-change greater than |2| (FDR = 0.05). GO terms with p-values less than 0.05 were considered statistically significant. The analysis resulted in 111 significant GO terms divided into 19 groups. The top GO term group (i.e. lowest individual term p-value) was “leukocyte activation” (GO:0045321; p-value 1.34e-15) which was the leading term of two groups, group 17 of which 36 GO terms belong and group 18, of which 55 GO terms belong, followed by “myeloid cell activation involved in immune response” (GO:0002275; p-value 2.02e-09) of which 13 GO terms belong, followed by “extracellular exosome (GO:0070062; p-value 2.00e-08) of which 8 GO terms belong. The leading term of all 19 groups can be found in Figure 2 and full details of the GO term analysis can be found in Supplementary Table 5. The results of the network analysis showed that the significant GO terms form a dense integrated network of functional groups (Figure 3). Notable transcripts related to macrophage differentiation and/or function, that were DE in Day 1 and Day 5 HKLs and appeared in multiple GO terms, include irf7 and irf8 (both upregulated in Day 5 HKLs compared to Day 1 HKLs), klf2 (downregulated in Day 5 HKLs compared to Day 1 HKLs), csf1r (upregulated in Day 5 HKLs compared to Day 1 HKLs), arg1 (downregulated in Day 5 HKLs compared to Day 1 HKLs) and fasn (upregulated in Day 5 HKLs compared to Day 1 HKLs). The appearance of these DE transcripts in multiple GO terms that are associated with leukocyte differentiation and function (e.g. “innate immune response”, “leukocyte activation”, “hemopoiesis”, to name a few) provides evidence that these transcripts are important for these processes in Atlantic salmon adherent HKLs.
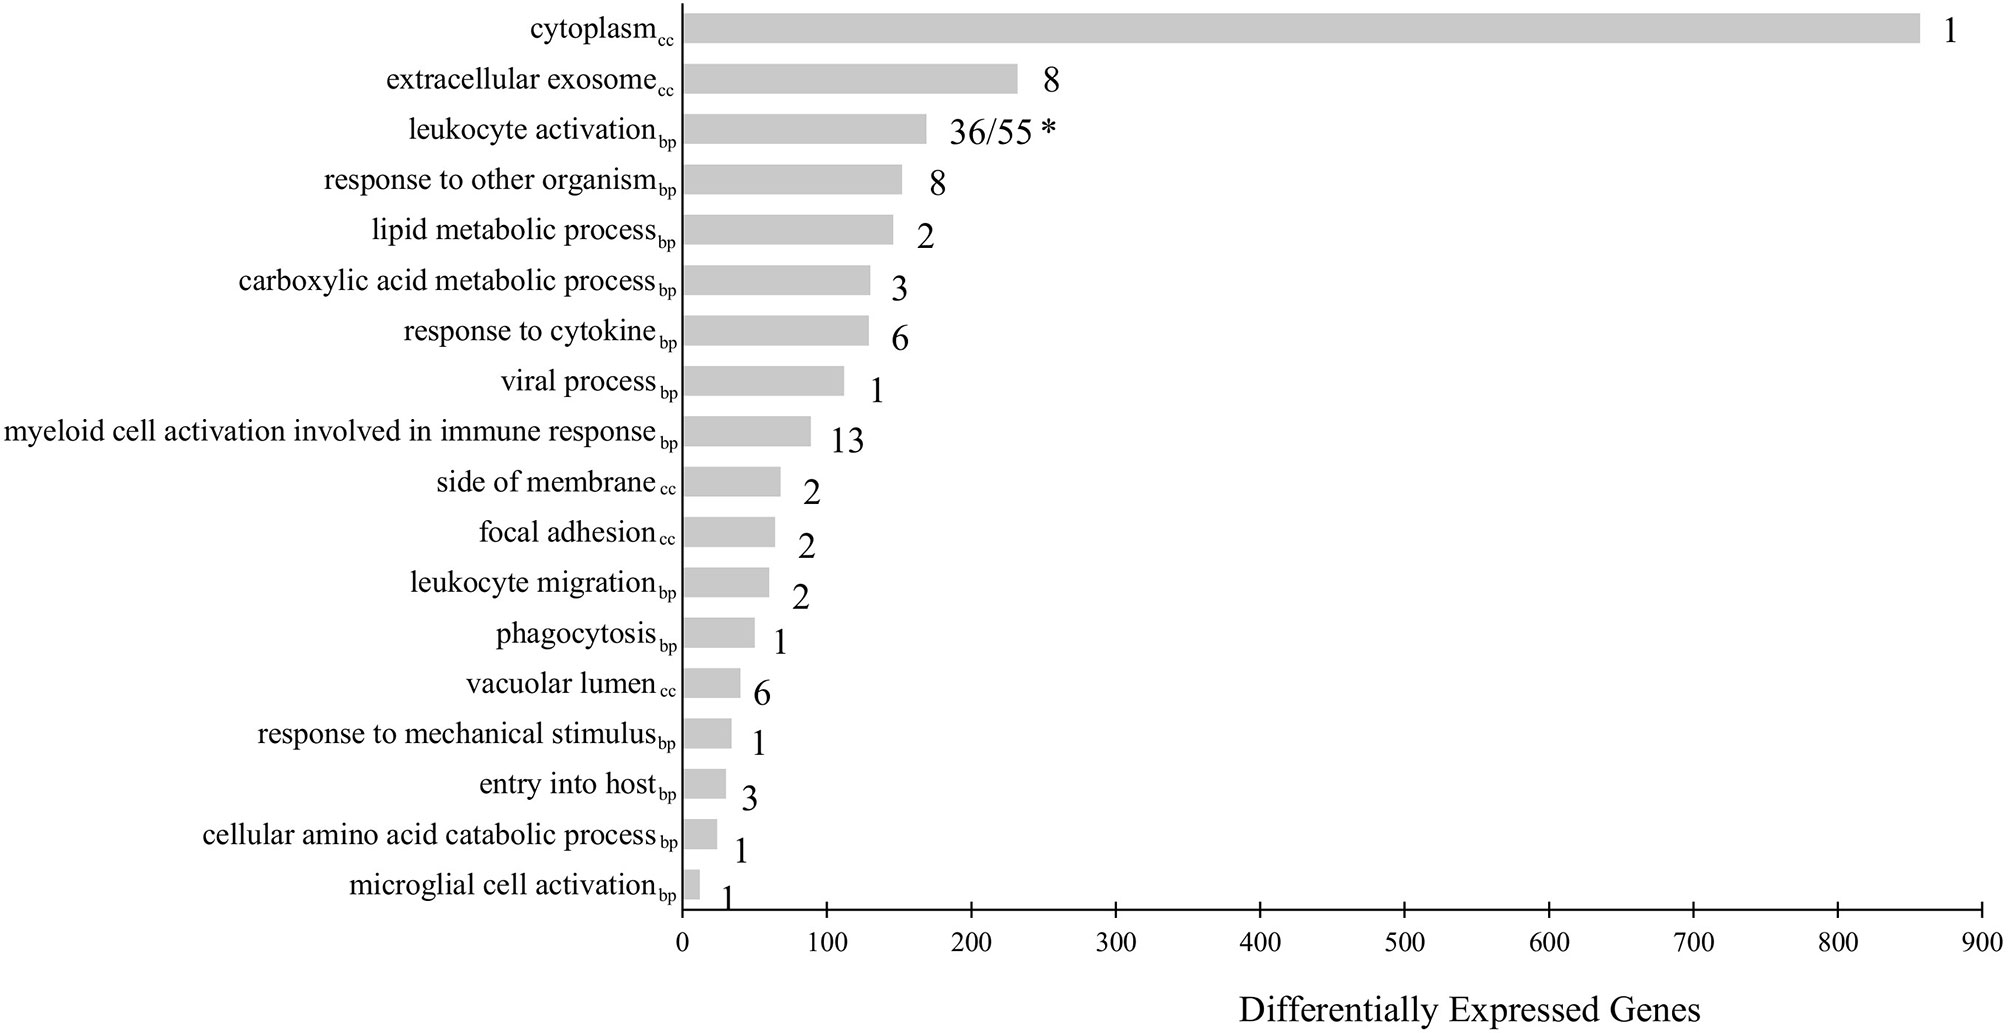
Figure 2 Gene Ontology (GO) term enrichment analysis of all differentially expressed genes (DEGs) between Day 1 and Day 5 HKLs with a fold-change > |2|. The leading term of each identified group is shown. The bars represent the number of DEGs associated with the term while the number after each bar represents the number of GO terms associated with that group. * “Leukocyte activation” is the leading term for two groups: Group 17 (consisting of 36 GO terms) and Group 18 (consisting of 55 GO terms). GO terms from the Biological Process database are identified by the subscript “bp”, while GO terms from Cellular Component are identified by “cc”.
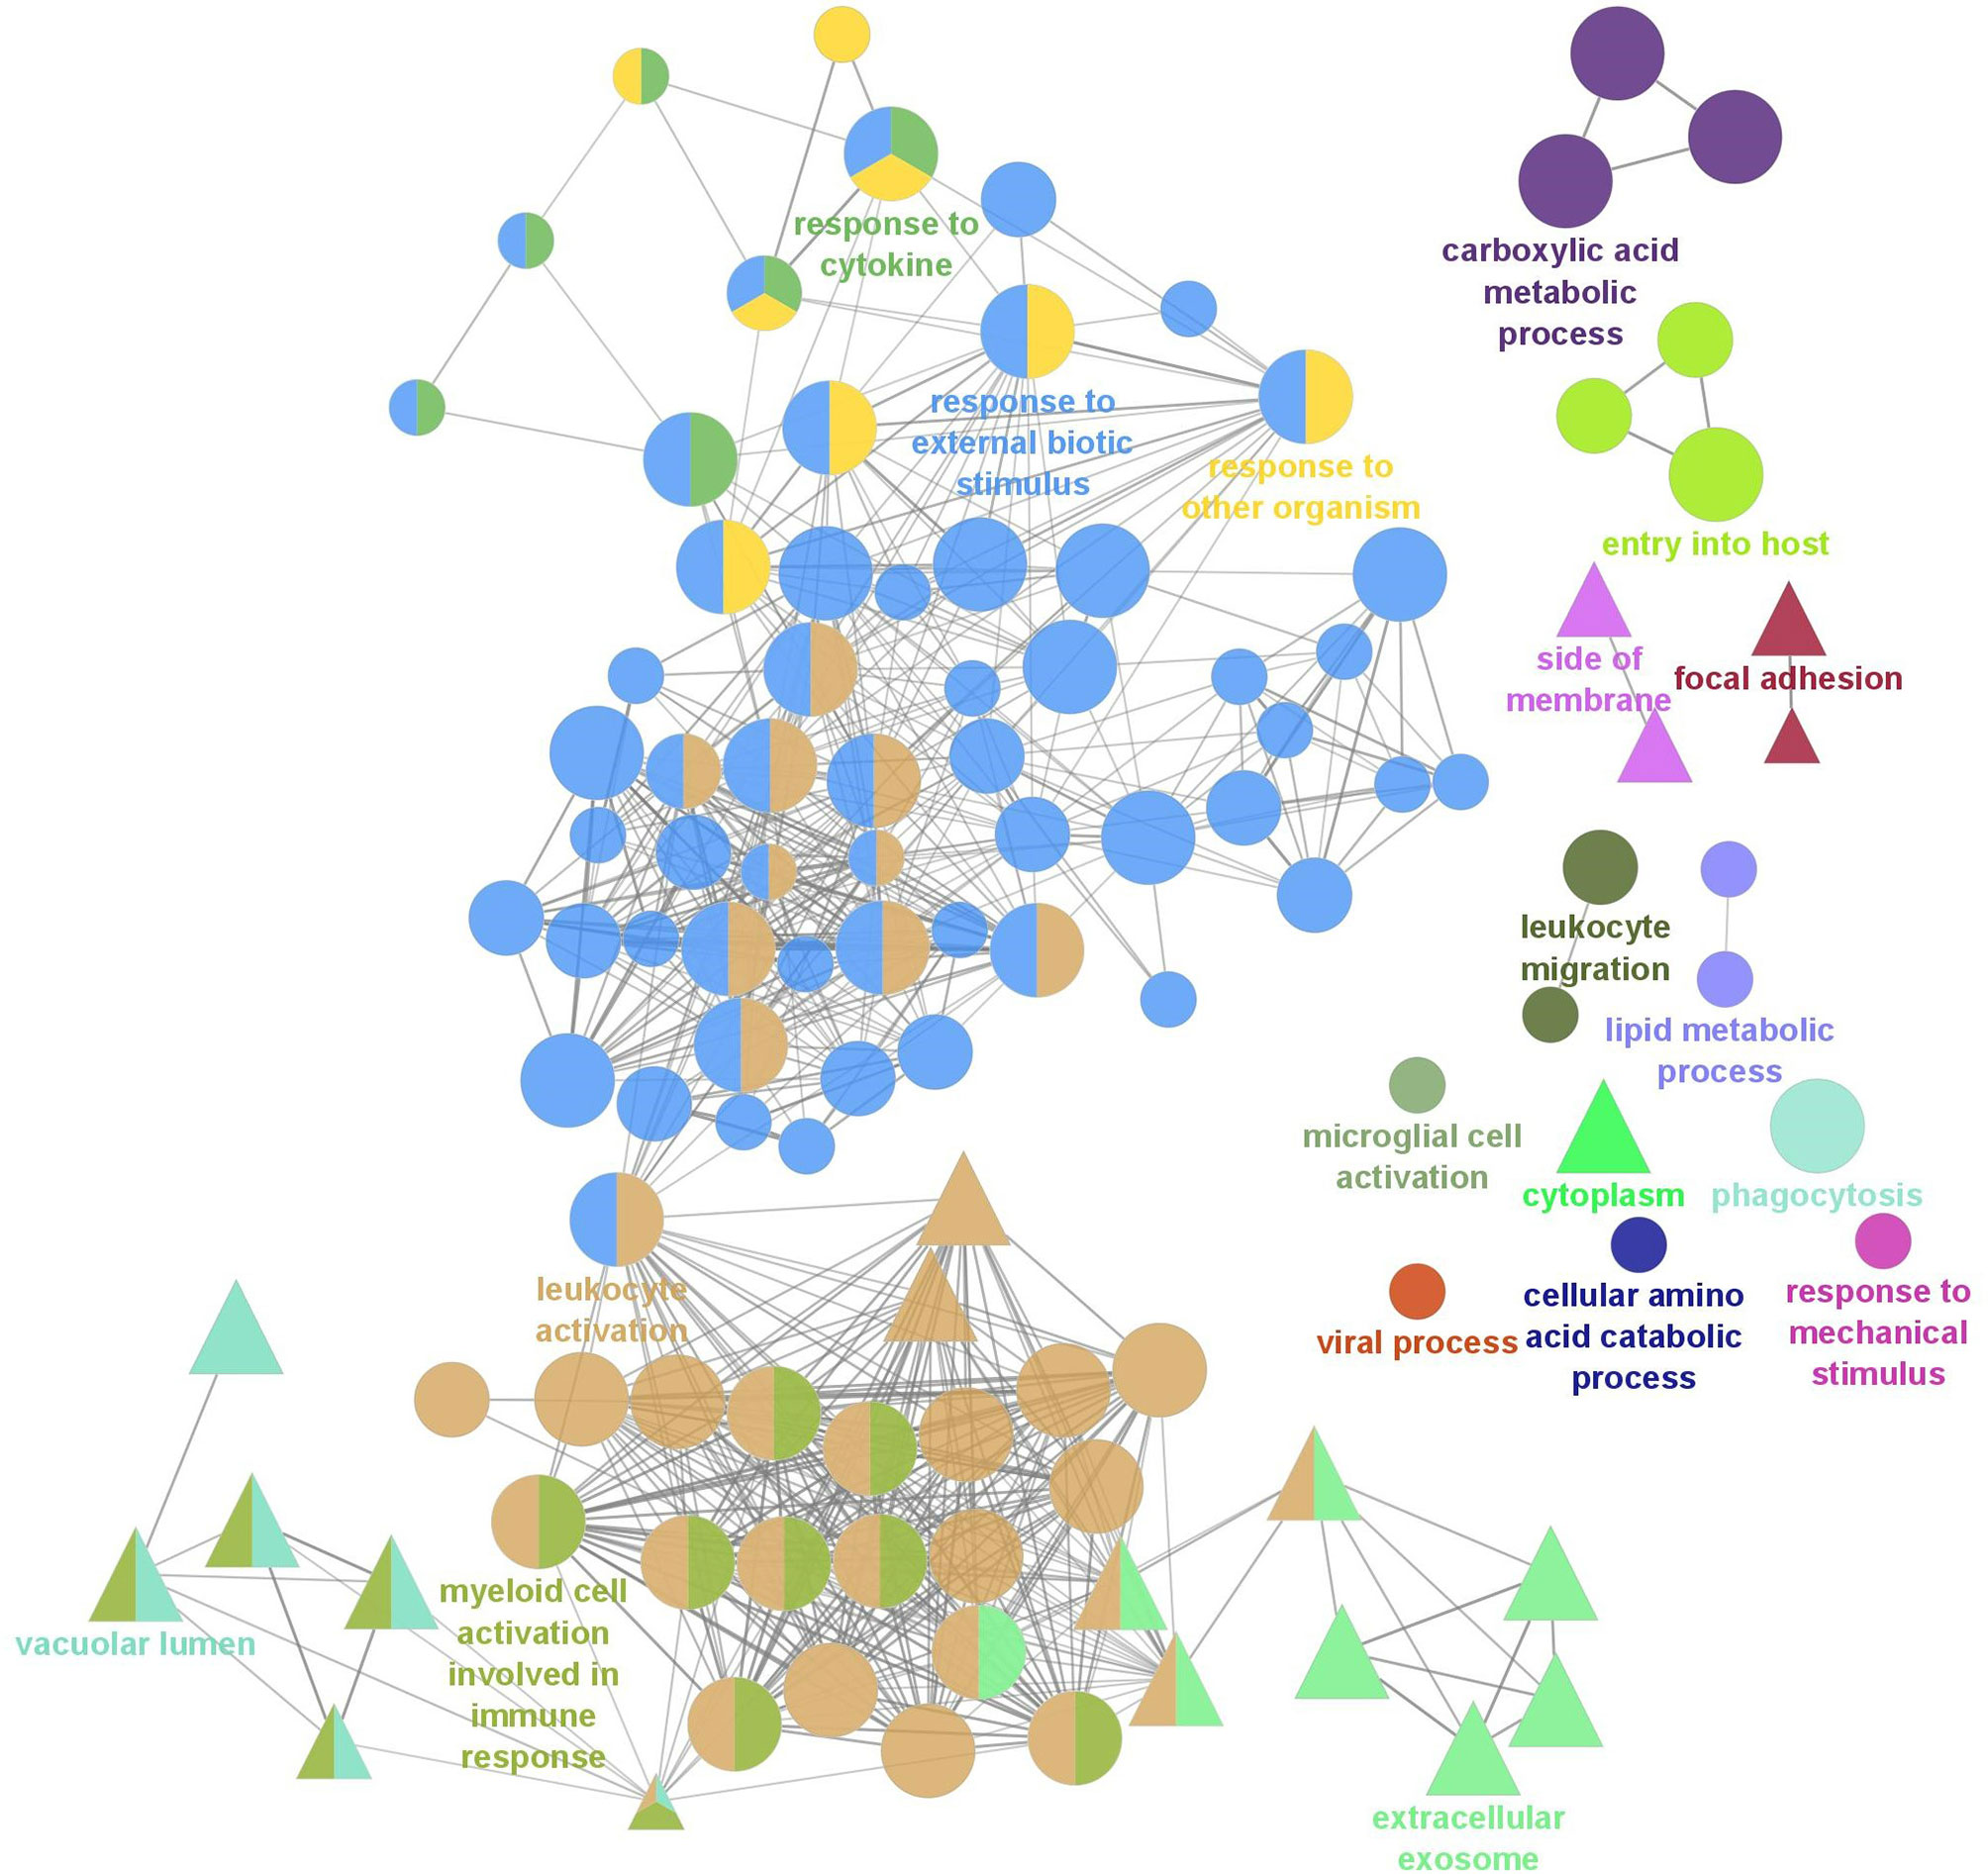
Figure 3 Gene Ontology (GO) term enrichment and network analysis of all DEGs between Day 1 and Day 5 HKLs. Two GO databases were used, Biological Process (BP; represented by circles) and Cellular Component (CC; represented by triangles) and each node represents a significantly enriched GO term (p<0.05, corrected with the Bonferroni step-down procedure). Related GO terms are labelled with the same colour and, when a term is shared by two or more GO cluster groups, the node is illustrated by multiple colours. The most significant terms unique to BP and CC are labelled. The size of the node represents the enrichment significance of the terms, and the thickness of edges indicates the kappa score.
A total of 54 DEGs contributing to the GO term “mononuclear cell differentiation” (GO:1903131) were used for hierarchical clustering and displayed using a heat map (Figure 4). Similar to the clustering of all DEPs (Figure 1B), within the transcripts associated with the GO term “mononuclear cell differentiation”, all Day 1 samples clustered together, and Day 5 samples clustered together, indicating Day 1 and Day 5 samples consist of two groups of cells with distinct molecular phenotypes. Of the DE transcripts annotated with the GO term “mononuclear cell differentiation”, 44% were downregulated (e.g. il1b, jun, cd28, cd4) and 56% were upregulated (e.g. csf1r, irf7, ifng1, fasn) in Day 5 HKLs compared to Day 1 HKLs, suggesting that these transcripts are likely important in mononuclear cell differentiation in Atlantic salmon HKLs.
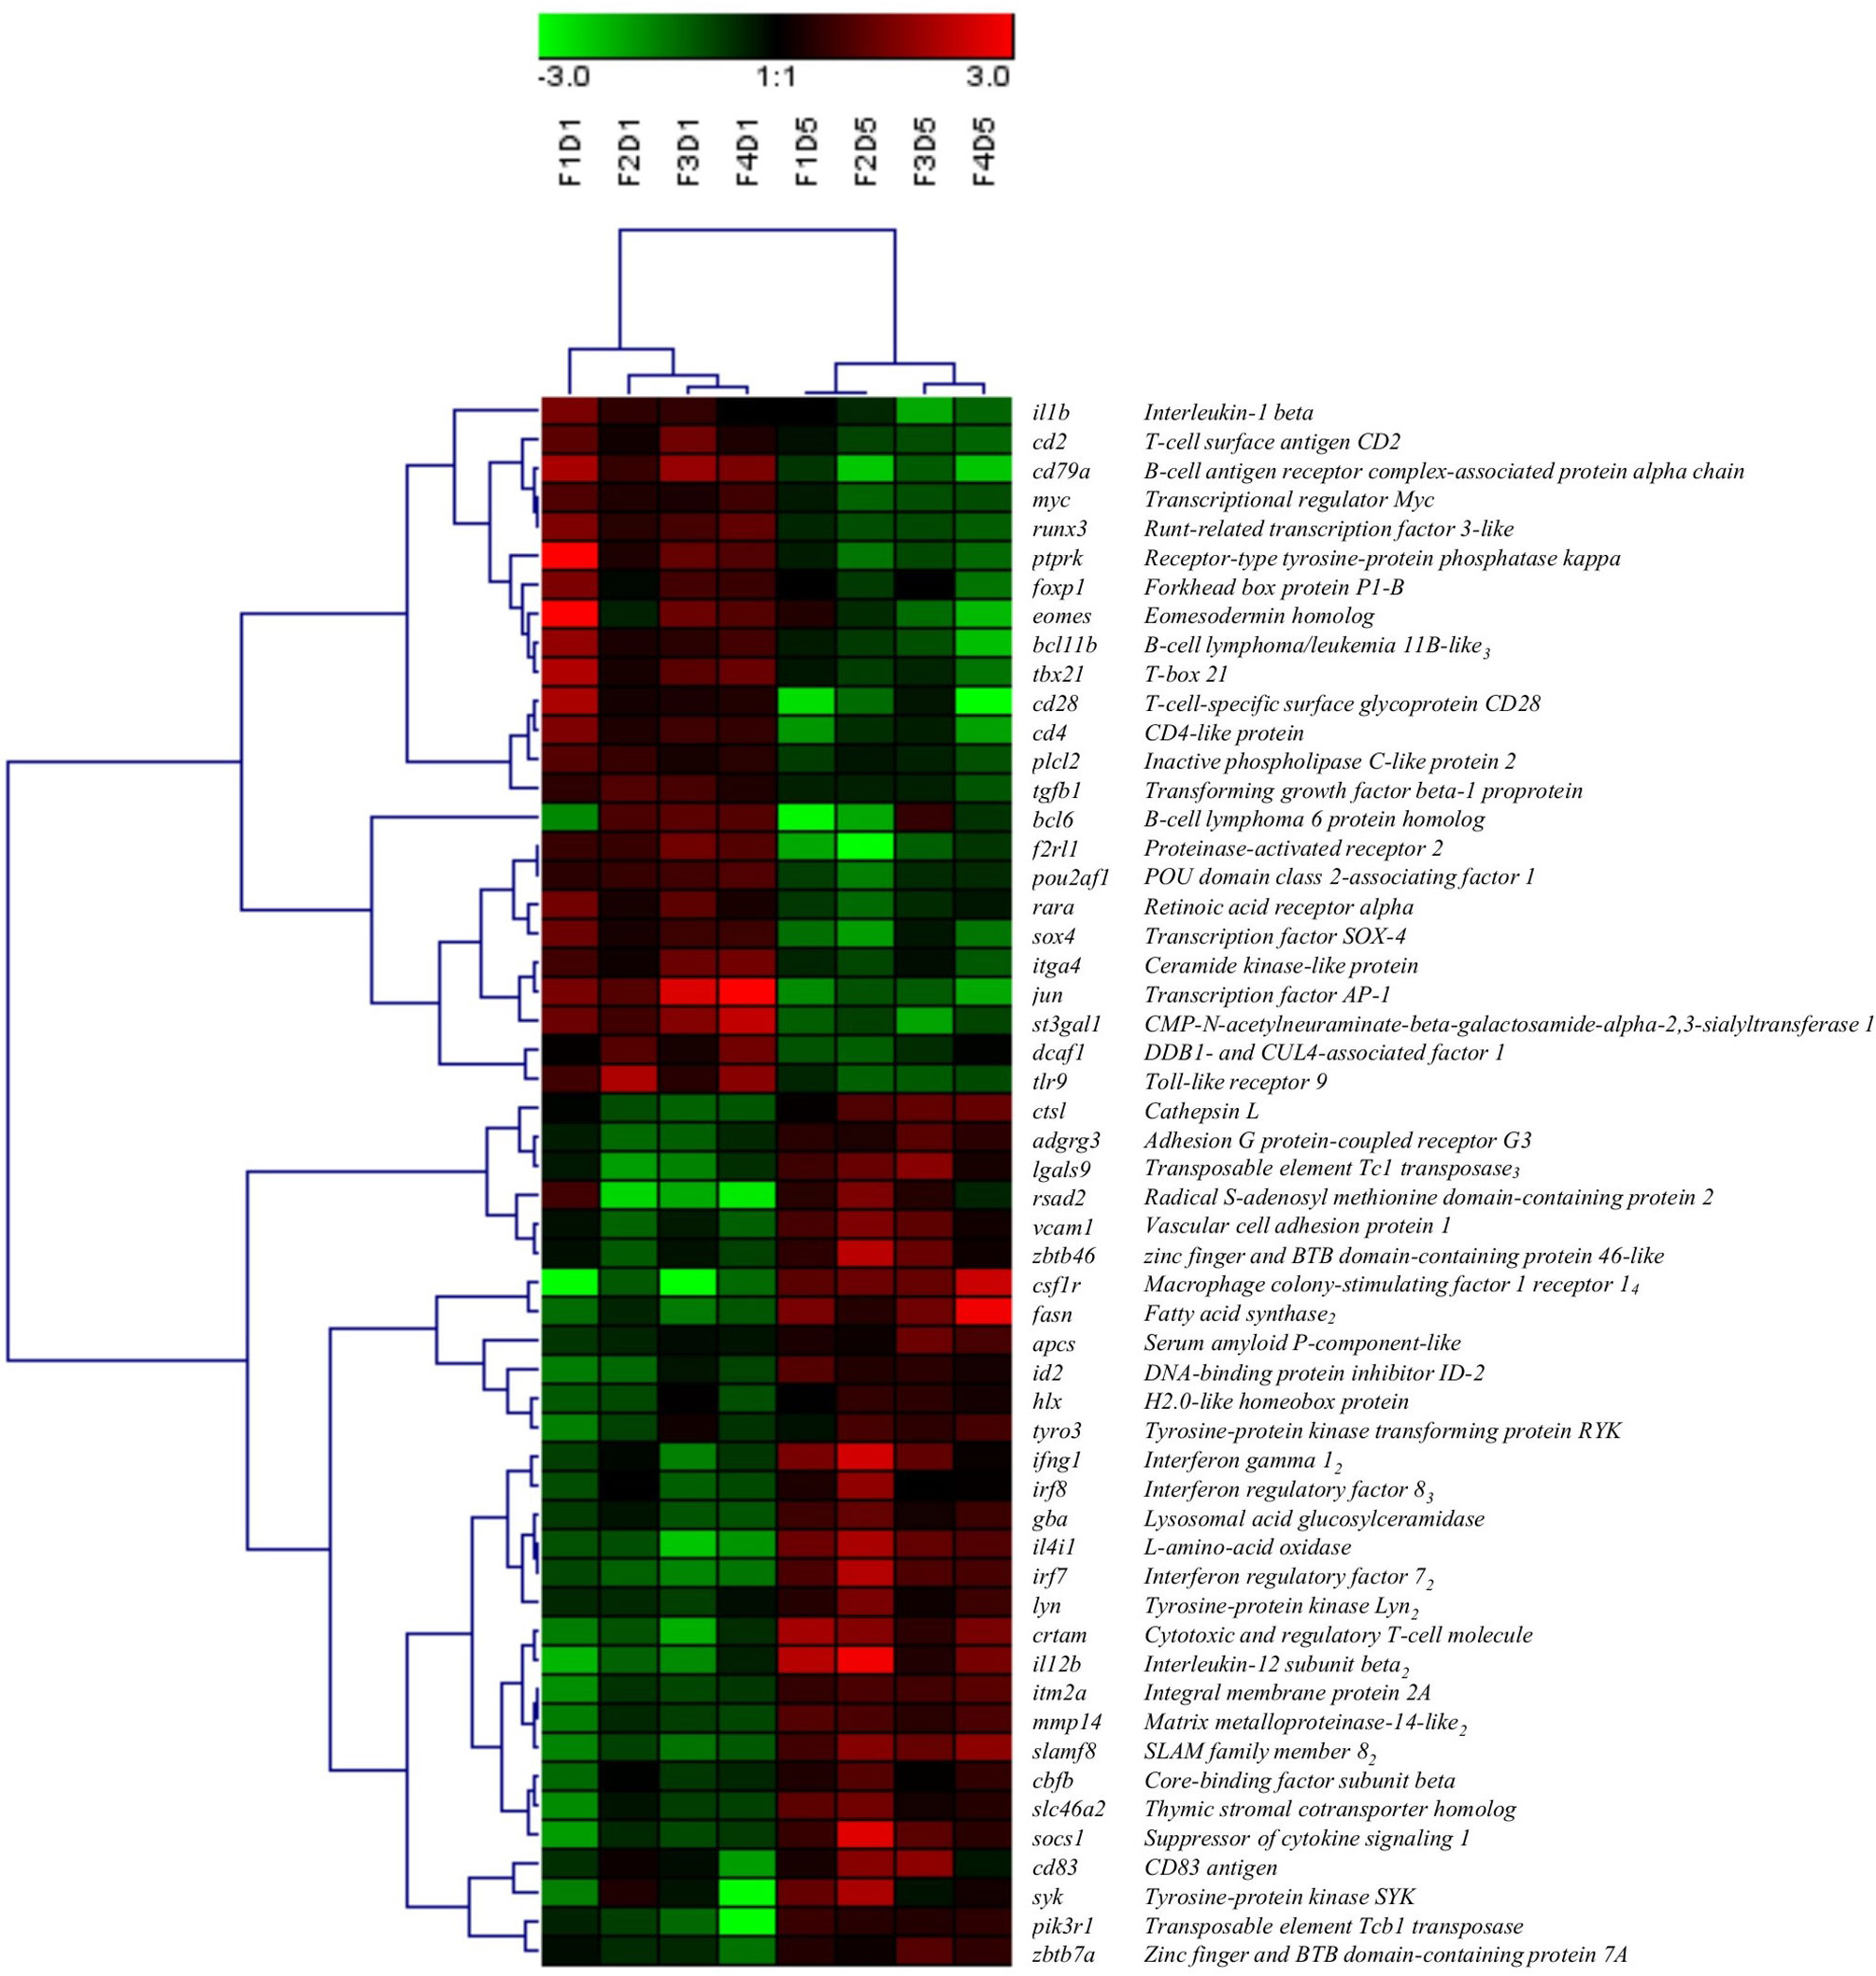
Figure 4 Hierarchical clustering analysis of DEGs associated with “mononuclear cell differentiation” (GO:1903131), shown as a heatmap. DEGs were median-centred and clustered using Pearson correlation and complete linkage hierarchical clustering. An average expression is shown when multiple probes were identified for one gene, and the subscript after the gene description indicates the number of probes. F indicates fish number; D indicates Day 1 or Day 5 (i.e. F1D1 is Fish 1 Day 1).
RT-qPCR of DE Transcripts Validated Microarray Results
Sixteen DE transcripts identified by the microarray were chosen for RT-qPCR validation. Transcripts were selected for RT-qPCR based on functional categories: macrophage-related transcripts, anti-bacterial/anti-viral-related transcripts, lipid-related transcripts and transcription factors (Figure 5).
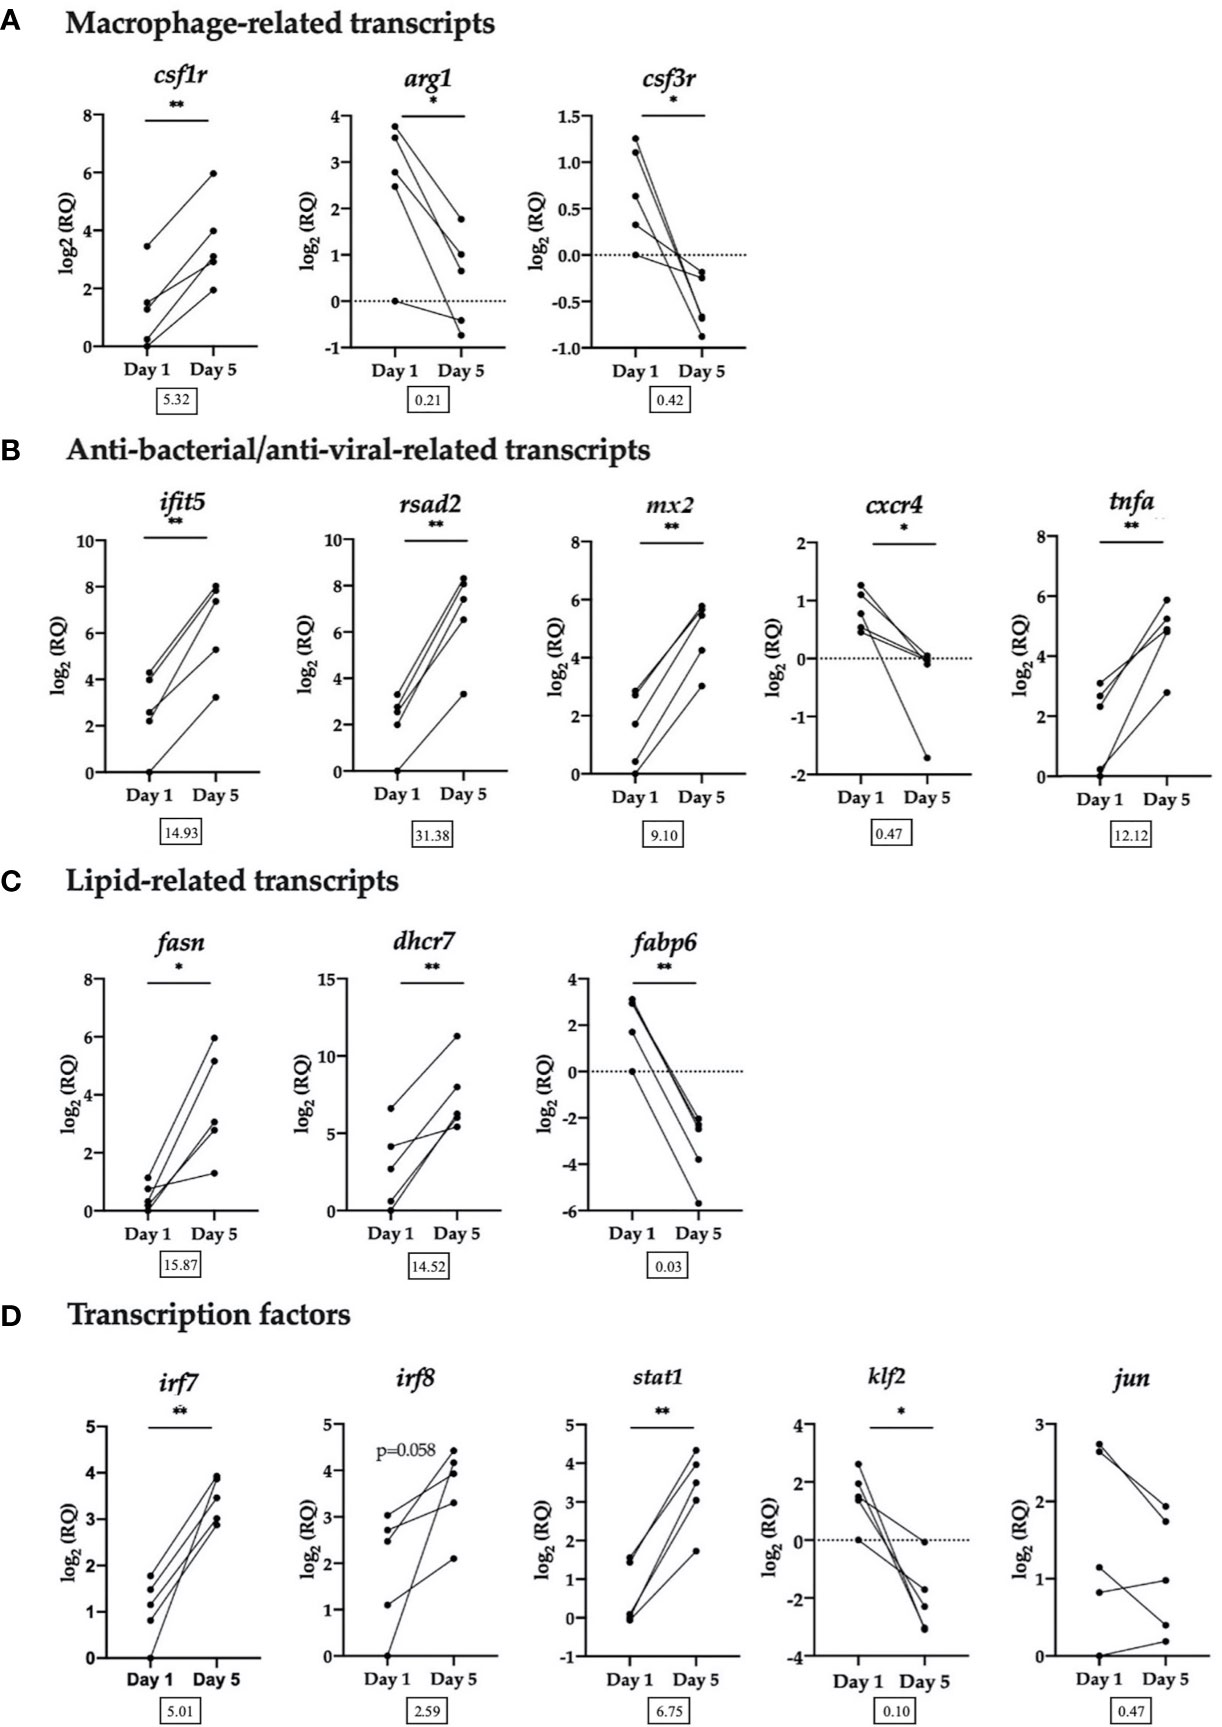
Figure 5 RT-qPCR validation of selected transcripts. (A) Macrophage-related transcripts. Colony-stimulating factor 1 receptor (csf1r), arginase-1 (arg1), granulocyte colony-stimulating factor receptor (alias colony stimulating factor 3 receptor (csf3r)). (B) Anti-bacterial/anti-viral-related transcripts. Interferon-induced protein with tetratricopeptide repeats 5 (ifit5), radical SAM domain-containing 2 (rsad2, alias viperin), interferon-induced GTP-binding protein Mx (mx2), C-X-C chemokine receptor type 4 (cxcr4), tumor necrosis factor alpha (tnfa). (C) Lipid-related transcripts. Fatty acid synthase (fasn), 7-dehydrocholesterol reductase (dhcr7), gastrotropin (alias fatty acid binding protein 6 (fabp6)). (D) Transcription factors. Interferon regulatory factor 7 (irf7), interferon regulatory factor 8 (irf8), signal transducer and activator of transcription 1 (stat1), krueppel-like factor 2 (klf2), transcription factor AP-1 (alias jun proto-oncogene (jun)). Data from each individual fish shown as log2(RQ), n = 5, *p < 0.05; **p < 0.01. The number under each figure represents the average fold-change in Day 5 HKLs compared to Day 1 HKLs.
The RT-qPCR results for all transcripts examined validated the microarray results, with the exception of irf8, which followed the same upregulated trend, but was not significant (p=0.058) and jun which followed the same downregulated trend but was not significant (p=0.164). In addition, using the same group of Atlantic salmon used in this RT-qPCR experiment, we previously confirmed a significant upregulation in Day 5 cells compared with Day 1 cells of two macrophage-related transcripts that were not identified as DE by the microarray but are known macrophage markers in the literature (marco and MHC II) (32). Of the transcripts examined by RT-qPCR, rsad2 had the largest significant upregulated fold-change (FC) (FC = 31.38) in Day 5 HKLs, while irf7 had the smallest significant upregulated FC (FC = 5.01). Fabp6 had the largest significant downregulated FC (FC = 0.03) in Day 5 HKLs and cxcr4 had the smallest significant downregulated FC (FC = 0.47).
In Silico miRNA Target Gene Predictions and Target Gene Pathway Enrichment Analysis
Out of the 1477 DEGs identified in this current study, 1234 (84%) had 3’UTR information and could be included in the target prediction analysis. The analysis identified 680 of them to be potential targets of one, or more, of the 36 DE miRNAs selected from our previous comparison of miRNA expression in Day 1 monocyte-like cells and Day 5 macrophage-like cells in (32) (Supplementary Table 6). The gene pathway enrichment analysis shown in Supplementary Table 7 identified gene pathways that were more likely to be regulated by miRNAs including interleukin-3, interleukin-5, and GM-CSF signaling; Fc gamma receptor-mediated phagocytosis; hematopoietic cell lineage; and lipid and lipoprotein metabolism. The complete overview of all pathways, p-values, and target genes participating in each pathway is given in Supplementary Table 7.
Discussion
The aquaculture sector in Canada generates $5.4 billion CAD in economic activity annually (53). The Atlantic salmon is Canada’s top aquaculture product (by volume) and is therefore of high economic importance. Identifying how their immune cells develop and function is necessary to fully understand the fish immune system. HKLs have been used in many in vitro immunology studies involving several fish species [(27–31), among many others], but remain to be fully characterized. Our previous work observed a change in morphology, phagocytic ability, and miRNA profile of HKLs cultured for 5 days, from predominantly monocyte-like at Day 1 of culture to predominantly macrophage-like at Day 5 of culture (32). Several mammalian studies have observed large numbers of differentially expressed transcripts during monocyte-to-macrophage differentiation and/or macrophage polarization using high-throughput profiling methods, such as microarrays, many of which were identified in this current study and are discussed below (54–58). Therefore, we used a 44K microarray to examine changes in transcript expression profiles between Day 1 monocyte-like HKLs and Day 5 macrophage-like HKLs. Changes in the transcript expression of immune-related genes, lipid-related genes, and genes encoding transcription factors that are involved with macrophage differentiation, polarization, and function in other vertebrates were identified. In addition, GO term analyses identified biological processes including leukocyte differentiation, hematopoiesis, innate immune response and lipid metabolic process.
Transcriptional Changes Associated With Macrophage Differentiation, Polarization, and Immune Response in Atlantic Salmon HKLs
The results of this study identified several macrophage and immune-related transcripts in both Day 1 and Day 5 HKLs. As the sample materials used in this study were immune cells, some of the identified transcripts were not unexpected. The paired SAM analysis identified differentially expressed transcripts between Day 1 and Day 5 HKLs that are involved in macrophage differentiation (including csf1r and csf3r), polarization of M1/M2 macrophages (including arg1 and ifng1), and macrophage function (including mx1, mx2 and tlr3).
The differentiation, proliferation, and survival of myeloid cells depends on signals derived from CSF1 upon binding with its receptor CSF1R (59–61). In humans and mice, CSF1R increases during macrophage differentiation, with CMPs expressing the lowest levels of CSF1R, monocytes expressing significantly more CSF1R and macrophages expressing the highest levels of CSF1R [reviewed in 52]. On the other hand, signaling through the granulocyte colony-stimulating factor 3 receptor (CSF3R, also known as GCSFR) is important for the proliferation, differentiation, and activation of neutrophils (62–64). Both csf1r and csf3r sequences have been identified in multiple fish species, and studies have indicated a conserved function for both receptors (4). As in mammals, csf1r has been identified as a marker of monocytes and macrophages in fish, and its expression is increased with macrophage differentiation (62, 65, 66). Similarly, csf3r, has been demonstrated to be necessary for neutrophil development in several fish species (67–69). In the current study, csf1r was significantly increased in Day 5 HKLs compared to Day 1 HKLs, while csf3r was significantly decreased in Day 5 HKLs compared to Day 1 HKLs, suggesting that, without the addition of exogenous factors, such as M1 (i.e. IFN-γ) and M2 (i.e. IL-4) activation stimuli, HKLs differentiate along the monocyte/macrophage lineage and not toward the granulocyte lineage during in vitro culturing. However, the downregulation of csf3r may also indicate that neutrophils were present at Day 1 of culture but had died off by Day 5. Several other transcripts related to different immune cells, including B cells (cd79a, ighm, igha2, cxcr3) and T cells (cd2, cd4, cd8b, cd28, cd96), were also downregulated in Day 5 cells compared to Day 1 cells (70–72). These results suggest that the Day 1 culture contained a heterogeneous mixture of several cell types but by Day 5 most of these cells were no longer present, leaving the Day 5 culture with a more homogenous population of cells (i.e. macrophages).
M1 “pro-inflammatory” macrophages and M2 “anti-inflammatory” macrophages can be defined based on their gene and protein expression profiles. Arginase enzyme activity and mRNA expression are hallmarks of M2 macrophages in both mammals and fish [reviewed in (3, 73)]. Like mammals, fish possess two arginase genes, arginase-1 (arg1) and arginase-2 (arg2) (3). While arg1 is a marker of M2 macrophages in mammals, results have shown that arg2 expression is a marker for the M2 phenotype in fish (19, 21, 74). Similarly, the chemokine receptors cxcr1 and cxcr4 are upregulated following M2 stimulation and are potential markers of M2 macrophages in mammals (cxcr1 and cxcr4) and fish (cxcr1) (21, 54). This current study revealed a decrease in arg1, cxcr1, and cxcr4 expression in Day 5 HKLs compared to Day 1 HKLs. Interestingly, we found a decrease in arg1 expression (similar to mammals) and not arg2 expression (similar to fish) in Day 5 HKLs, suggesting that the role of the arginase genes in macrophage differentiation and function may be species-specific. However, an examination of both arg1 and arg2 expression in Atlantic salmon, along with arginase enzyme activity in response to M2 stimulation, will be required to determine this.
Several markers of M1 macrophages, such as tnfa, il12b, and ifng1 were upregulated in unstimulated Day 5 HKLs. These genes have been identified in different fish species and their role in the fish macrophage immune response and M1 polarization are conserved with other vertebrates (1, 3, 9, 75–77). On the other hand, markers of M2 macrophages in mammals, including mrc1, socs1, and tgm, were also upregulated in Day 5 HKLs. While these genes are present in fish, they have yet to be characterized as teleost M2 markers, unlike the M1 markers identified here (1, 3). It is interesting to find an upregulation of both M1 and M2 markers in non-stimulated cells. These results may indicate that during the culture, adherent HKLs become primed to develop into M1 or M2 macrophages upon stimulation. Future research, using functional studies with M1 and M2 activating stimuli, as well as protein expression data, would help to determine if the transcripts identified here are in fact M2 markers in teleost fish, as they are in mammals, and if the HKLs cells become primed to develop into the M1 or M2 phenotype during culture time.
In addition to the classic markers of macrophages, this study showed the differential expression of several virus-responsive, bacteria-responsive and inflammation-related genes in the two cell populations including Toll-like receptor 3 (tlr3), interferon-induced GTP-binding proteins mx1 and mx2, radical SAM domain-containing 2 (rsad2), interferon-induced protein with tetratricopeptide repeats 5 (ifit5b), DExD/H-box helicase 58 (ddx58; also known as RIG-I), granulin (grn), hepcidin (hamp), and legumain (lgmn). These genes have been described in many fish species and have similar immune-related functions as their mammalian counterparts (24, 27, 78–83). In mammals, Tlr3 levels are highest in macrophages, compared to other mononuclear cells, and is not detected in neutrophils (84–86). While tlr3 has been described in several fish species, it is unknown if tlr3 is involved in HKL differentiation in fish. However, our results showed an upregulation of tlr3 in Day 5 HKLs, suggesting that tlr3 could be a novel marker of macrophages in fish. Legumain (LGMN) is associated with M2 macrophages (87–89) and its expression and activity is increased during monocyte-to-macrophage differentiation in both human THP-2 cells and murine RAW264.7 cells (88, 89). In goldfish, lgmn expression is highest in macrophages, compared to monocytes and progenitor cells, suggesting that lgmn may be a marker for macrophages in fish (24). Similarly, granulin may play a role in fish myeloid cell differentiation; in mutant zebrafish that do not express granulin, decreased differentiation of myeloid precursors into neutrophils and macrophages was observed, while adult mutants developed a head kidney with increased progenitors and decreased mature myeloid cells (90, 91). The upregulation of lgmn and grn in Day 5 HKLs, like the transcripts discussed thus far, point to the differentiation of HKLs into macrophages. In addition, the upregulation of virus-related and bacteria-related transcripts may indicate that Day 5 HKLs are more prepared to combat pathogen infection than Day 1 HKLs.
While we observed upregulation of several immune-relevant transcripts in Day 5 HKLs, there were also some immune-related genes (e.g. virus-responsive and bacteria-responsive) that were downregulated in Day 5 compared with Day 1 HKLs. For example, il1b, tnfrsf6b, tnfrsf11b and tlr9 were downregulated in Day 5 HKLs compared to Day 1 HKLs. These genes have been demonstrated to be responsive to bacterial and viral challenges in various fish species (92–94). The upregulation of some pathogen-responsive genes, and the downregulation of others, in Day 5 HKLs compared with Day 1 HKLs, suggests that these cells are likely changing in their responsiveness to pathogens over time in culture. Future research should use live pathogen challenges at different time points during differentiation to test this hypothesis.
Transcriptional Changes Associated With Lipid Metabolism Observed in Atlantic Salmon HKLs
Lipids play a major role in regulating many biological processes including cell growth, proliferation, and function. Lipids and fatty acids are required for a cell to grow and proliferate and, therefore, the enzymes involved in the formation of fatty acids are necessary for the development and differentiation of macrophages (95). Significant changes in the lipid-related transcriptome occur during mammalian monocyte-to-macrophage differentiation and M1/M2 polarization (57, 58, 96). Transcripts involved with fatty acid synthesis, elongation and desaturation, and cholesterol production, utilization and export are differentially expressed between mammalian monocytes and macrophages, as well as between M1 and M2 macrophages (57, 58, 96). In this study, transcripts related to the synthesis of fatty acids [e.g. fatty acid synthase (fasn) and long-chain fatty acid elongase 6 (elovl6)], transcripts involved in hydrolyzing triglycerides into free fatty acids [e.g. lipoprotein lipase (lpl)], and transcripts involved in fatty acid desaturation [e.g. fatty acid desaturase 2, fads2, alias delta-6 fatty acyl desaturase, fadsd6; and fads1, alias delta-5 fatty acyl desaturase, fadsd5)] were upregulated in Day 5 HKLs compared to Day 1 HKLs. In addition, GO term analysis identified lipid-related GO terms including lipid biosynthetic process (GO:0008610), neutral lipid catabolic process (GO:0046461) and cholesterol metabolic process (GO:0008203).
FASN is necessary for macrophage function in humans and the expression of both FASN and Elovl6 is upregulated in human and mouse macrophages, respectively, upon differentiation from monocytes (57, 58, 96). While both fasn and elovl6 have been described in numerous fish species, their role in macrophage differentiation in fish is unknown. In several fish studies, liver fasn and elovl6 expression were found to be responsive to diet (97–100). In white Pacific shrimp (Litopenaeus vannamei), fasn expression was increased in the gills and hemocytes (immune cells of shrimp) following V. parahaemolyticus infection and knockdown of fasn increased morbidity, suggesting that fasn may have a role in immune cell response in some aquatic species; however, this requires further investigation (101).
Lipoprotein lipase is an enzyme that hydrolyzes triglycerides in lipoproteins found in chylomicrons and very low-density lipoproteins (VLDLs) into free fatty acids. A dramatic upregulation of LPL was observed in human macrophages differentiated with M-CSF, as well as without exogenous factors (58, 96). Furthermore, differentiation of bone marrow cells from LPL-deficient mice had 40% less differentiated macrophages than control mice, suggesting that LPL is necessary for macrophage differentiation (102). Like fasn and elovl6, lpl expression in fish has been reported to be modified by diet (103–105), however, its role in HKLs differentiation and/or function is unknown. The increased expression of fasn, elovl6, and lpl suggests the need for macrophages to access fatty acids for inflammatory functions and this need is conserved in fish and mammals. Additionally, the high expression level of these transcripts may serve as novel markers of macrophages in fish.
Fatty acid desaturases are enzymes required for the synthesis of omega-3 and omega-6 polyunsaturated fatty acids (PUFAs) through the formation of double bonds between fatty acyl chain carbons. Fatty acid desaturase 2 (fads2, alias fadsd6) and fatty acid desaturase 1 (fads1, alias fadsd5) were upregulated in Day 5 HKLs compared to Day 1 HKLs. While most studies to date have examined fads2 and fads1 expression in organs with high fatty acid turnover, such as the liver, there are data suggesting that they play a role in myeloid cells (106, 107). In human macrophages, FADS2 expression increased during monocyte-to-macrophage differentiation and inhibition of FADS2 in human peripheral blood mononuclear cells (PBMCs) decreased the number of proliferating cells. Similar to fasn, elovl6, and lpl, fads2 and fads1 have been described in fish species (108), and their expression level in HKLs is regulated by nutrition and diet (109–113). The role of fads2 and fads1 in HKL differentiation and function has not been investigated, however, the results of this study suggest that, along with fasn and lpl, fads2 and fads1 may be conserved markers of macrophages and macrophage function.
7-dehydrocholesterol reductase (DHCR7) is an enzyme that catalyzes the production of cholesterol in the final step of cholesterol biogenesis (114). A significant increase in dhcr7 was observed in Day 5 HKLs compared to Day 1 HKLs, suggesting an increase in cholesterol biosynthesis in Day 5 HKLs. Ecker et al. (57) observed an increase in DHCR7 expression in primary human monocytes undergoing macrophage differentiation for 4 days. Interestingly, the increase in DHCR7 expression at 4 days, decreased to below baseline (day 1) values following 6 days of macrophage differentiation. Similar to the lipid-related transcripts discussed here, liver, muscle, and gut dhcr7 is responsive to diet in several fish species, but the role of dhcr7 in macrophage differentiation and/or function in fish has yet to be investigated (115–117).
Transcription Factors Involved in Mammalian Macrophage Differentiation Were DE in Atlantic Salmon HKLs
Macrophage differentiation and polarization are tightly regulated by transcription factors (TFs) and are associated with large changes in transcriptional programming. The TFs that regulate myeloid cell differentiation and macrophage polarization have been extensively studied and characterized in mammals, while this area of research is expanding in teleost fish (4, 23, 118). Transcripts encoding several TFs involved in mammalian macrophage biology were differentially expressed in Day 1 and Day 5 HKLs in the current study, suggesting possible conserved roles for these TFs. In the present study, members of the Krueppel-like factors (KLF) family (i.e. klf2, klf9) were downregulated in Day 5 HKLs compared to Day 1 HKLs, while members of the interferon regulatory factor (IRF) family (i.e. irf3, irf7, irf8), as well as signal transducer and activator of transcription 1 (stat1), were upregulated in Day 5 HKLs compared to Day 1 HKLs.
KLFs are members of the zinc-finger family of TFs which play roles in many biological processes including cell proliferation, differentiation, growth, apoptosis, and inflammation (119, 120). In primary human monocytes, KLF2 expression is reduced upon differentiation into macrophages and its overexpression in the THP-1 human cell line inhibited LPS-induced cytokine secretion and decreased phagocytic ability, indicating that the suppression of KLF2 is necessary for macrophage differentiation and function (121). Similarly, KLF9 overexpression in RAW264.7 murine cell line reduced LPS-induced inflammatory cytokine release (122). While KLF9 is mostly known for its involvement in B-cell differentiation (123), these studies suggest that KLF2 and KLF9 have a role in monocyte maintenance and their downregulation is necessary for macrophage differentiation. This current study found a decrease of both klf2 and klf9 in Day 5 HKLs compared to Day 1 HKLs. There is very little information on fish KLFs, however, there are recent studies that provide evidence for a role of KLF2 and KLF9 in the immune response (124, 125). For example, KLF2 expression was found to be highest in PBMCs of ayu (Plecoglossus altivelis) compared to other tissues (liver, spleen, brain, gill, head kidney) and its expression increased with L. anguillarum infection. Furthermore, siRNA knockdown of KLF2 increased il1b and tnfa expression in both resting and L. anguillarum infected head kidney monocytes/macrophages, suggesting that, similar to mammalian cells, KLF2 suppresses ayu monocyte/macrophage activation (124). While the role of KLF2 and KLF9 in macrophage differentiation and polarization is unknown in fish, the results of this study suggest that, as in mammals, these TFs are involved in regulating myeloid cell differentiation in fish. It is possible that KLF2 and/or KLF9 play a role in maintaining the monocyte or precursor population and their decrease in expression is necessary for macrophage differentiation and function.
Members of both the IRF and STAT TF families have been implicated in a wide range of cellular events, including cell growth, proliferation, survival, and immune responses and each has members that are important mediators of macrophage polarization and/or differentiation (126). IRF3, IRF7 and IRF8 are involved in mammalian macrophage differentiation, polarization and/or function (127). The expression of both IRF8 and IRF7 increases during macrophage differentiation, while the expression of IRF8 declines upon granulocytic differentiation (128–130). Furthermore, IRF8 is necessary for the formation of mature, functional macrophages while the expression of IRF7 is both necessary and sufficient to induce monocyte-to-macrophage differentiation in U937 monocytic cell line (128–130). In mammals, IRF3 is associated with M1 polarization (131, 132). In fish, irf8 is specifically associated with primary macrophages during zebrafish embryogenesis (90). While irf8 null mutants have decreased macrophage development and enhanced neutrophil production, overexpression of irf8 in the mutants could partially recover this effect (90). Similar to mammals, both irf3 and irf7 are responsive to viral infection in a fish monocyte/macrophage cell line (RTS11), as well as primary fish macrophages, suggesting that irf3 and irf7 have a role in the immune response of fish macrophages (133, 134). The increase in irf3, irf7 and irf8 expression in Day 5 HKLs compared to Day 1 HKLs observed in the current study may indicate that, if the functions of these genes are the same in fish as they are in mammals, then the Day 5 culture is composed more of macrophages compared to the Day 1 culture.
In primary human monocytes, STAT1 activity increased as monocytes differentiated into macrophages (135). Moreover, STAT1 binding was detected in the promoters of genes important for macrophage differentiation and function, such as FcyRI, ICAM-1 and IRF1 (135). In several fish species, stat1 expression and/or signaling, as well as M1 markers, are increased in head kidney leukocytes following IRF-γ stimulation (115, 116, 136). Here we found an upregulation of stat1 in Day 5 HKLs compared to Day 1 HKLs, suggesting an increase in stat1 is indicative of macrophage differentiation in the Day 5 culture.
DE miRNAs Are Predicted to Target DE Transcripts and Are Associated With Macrophage Immune Function Gene Pathways
miRNAs are short, non-coding RNAs that play a role in regulating gene expression by binding to a partially complementary sequence in the (usually) 3’ UTR of their target mRNA, leading to mRNA degradation or the prevention of translation (137). miRNAs regulate several biological processes including cell differentiation and immune response, among many others [reviewed in (138, 139)]. Work in mammals has demonstrated that miRNAs can mediate the differentiation and activation of macrophages (140, 141). Our previous work identified 66 DE miRNAs when comparing Day 1 and Day 5 HKLs (22 miRNAs downregulated and 44 miRNAs upregulated in Day 5 HKLs, compared to Day 1 HKLs) (32), including many that are involved in mammalian macrophage function (e.g. miR-146a, miR-155 and miR-21) (142–144), as well as teleost fish immune response (e.g. miR-146a, miR-462, miR-2188 and miR-731) (145, 146). The 36 major expressed DE miRNAs (32), likely to be the biologically relevant guide-miRNAs, were used as input against the 3’UTRs from the DEGs identified in the current study. This targeted approach could identify whether any of the DEGs are potential targets of the DE miRNAs in (32). This is a first step to determine which miRNAs may be involved in monocyte-to-macrophage differentiation by targeting DEGs for post-transcriptional regulation by the RISC-complex.
The results from the in silico target prediction applying the selected DE miRNAs from (32) and all DEGs with 3’UTR information revealed that 660 of the DE transcripts identified in the current study were potential targets. It is unlikely that more than half of the DEGs are true targets as there are usually a large percentage of false positives for several reasons in these predictions (147). However, such in silico predictions are still used as a first means to single out which DEGs may be true miRNA targets. Among the interesting putative targets with known roles in macrophage differentiation and/or function with predicted miRNA response elements for particular DE miRNAs were tnfa (ssa-miR-214-1-3p and ssa-miR-139-5p), fadsd5 (ssa-miR-21a-5p), and ifit5 (ssa-miR210-1-5p and ssa-miR-22a-3p), all of which showed increased expression in Day 5 cells. Other interesting predicted targets like arg1 (ssa-miR-214-3-3p and ssa-miR-2188-3p), cxcr4 (ssa-miR-214-3-3p), klf2 (miR-181a-5p, ssa-miR-29b-3p and ssa-miR-novel-16-5p), klf9 (ssa-miR-155-5p, ssa-miR-214-3-3p and ssa-miR-210-1-5p), and il1b (ssa-miR-139-5p, ssa-miR-24ac-3p and ssa-miR-725-3p) all showed decreased expression in Day 5 cells. The traditionally acknowledged function of miRNAs is to downregulate gene expression which would lead to a decrease of target transcripts if the miRNA expression increases (137). Such inverse relationships were not always the case between a miRNA and its predicted target from our in silico analysis. However, the function of most cellular miRNAs is to maintain equilibrium of the target transcripts, which is regulated positively by the rate of transcription and negatively by miRNAs. Differentiation of a cell type that is dependent on an increased level of a given transcript can be triggered by transcriptional activation. However, the miRNAs that contribute to maintaining this transcript in equilibrium would also increase in order to maintain the higher expression level of this transcript in balance. Such relationships between a miRNA and its target, also referred to as feed forward loops (148), lead to increases of both the targets and their miRNAs as they are (often) activated by the same transcription factors. Similar dynamics have been proposed for miRNAs associated with immune responses and their targets (147), and many of the DE miRNA genes changing expression in Day 5 HKLs have upstream transcription binding motifs of irf8, irf1, and irf3 (146) that are increased in Day 5 HKLs in this study. Future functional studies, using knock-out or overexpression models, are required to fully determine if a DE gene identified in this study is the target of a certain DE miRNA identified in our previous work (32).
The DEGs found in this current study that were identified as potential targets (see Supplementary Table 6) of the DE miRNAs (32) were used for pathway enrichment analysis. The results showed that the putative target genes were significantly enriched in pathways associated with macrophage immune function, such as interleukin-3, interleukin-5, and Fc gamma receptor-mediated phagocytosis, pathways associated with macrophage differentiation, such as GM-CSF signaling and hematopoietic cell lineage, and lipid-related pathways such as lipid and lipoprotein metabolism. Although not proving certain miRNA-target interactions, the enrichment of these gene pathways further suggests that the miRNAs are involved in macrophage maturation.
Conclusion
The aim of the current study was to build on our previous work (32) and examine changes in gene expression of Atlantic salmon HKLs in vitro. We identified immune-related transcripts, lipid-related transcripts, and transcripts encoding TFs that were differentially expressed between Day 5 and Day 1 HKL populations. Many of the identified transcripts are markers of macrophages, involved in M1/M2 polarization and/or involved in macrophage function in other species, suggesting a conserved function for some of the transcripts, as well as the possibility of using these transcripts as macrophage markers, although future functional studies are required to confirm this. Overall, the results indicate that, without the addition of exogenous factors, the HKL cell population differentiates in vitro to become macrophage-like, and this dynamic change in cell population is an important consideration when working with Atlantic salmon HKLs in vitro.
Data Availability Statement
The datasets presented in this study can be found in online repositories. The names of the repository/repositories and accession number(s) can be found in the article/Supplementary Material.
Ethics Statement
The animal study was reviewed and approved by Memorial University of Newfoundland’s Institutional Animal Care Committee.
Author Contributions
Conceptualization: NS, SC, and MR. Methodology: NS, SC, and MR. Software: NS, NU, SK, NW, and RA. Validation: NS. Formal analysis: NU, SK, NW, and RA. Investigation: NS. Resources: SC and MR. Data curation: NS, NU, SK, NW, and RA. Writing—original draft preparation: NS. Writing—review and editing: NS, NU, SK, NW, RA, SC, MR. Visualization: NS. Supervision: SC and MR. Project administration: NCS, SC, and MR. Funding acquisition, SC and MR. All authors contributed to the article and approved the submitted version.
Funding
This study was funded by Natural Sciences and Engineering Research Council of Canada (NSERC) Discovery Grants to MR (341304-2012 and 2020-04519), a Memorial University of Newfoundland Seed grant to SC (212779), a NSERC Discovery Grant to SC (2017-04630), a Norwegian Research Council grant to RA (280839/E40), and Genomic Applications Partnership Program projects [GAPP # 6604: Biomarker Platform for Commercial Aquaculture Feed Development project; and GAPP #6607: Integrated Pathogen Management of Co-infection in Atlantic salmon (IPMC) project] funded by the Government of Canada through Genome Canada and Genome Atlantic, and Cargill Innovation (formerly EWOS Innovation) to MR. The IPMC project was also funded by the Government of Newfoundland and Labrador through the Department of Tourism, Culture, Industry and Innovation (Leverage R&D award #5401-1019-108. NS was supported by a NSERC PGS D fellowship.
Conflict of Interest
The authors declare that the research was conducted in the absence of any commercial or financial relationships that could be construed as a potential conflict of interest.
Publisher’s Note
All claims expressed in this article are solely those of the authors and do not necessarily represent those of their affiliated organizations, or those of the publisher, the editors and the reviewers. Any product that may be evaluated in this article, or claim that may be made by its manufacturer, is not guaranteed or endorsed by the publisher.
Supplementary Material
The Supplementary Material for this article, including details on qPCR assays used [27, 32, 149–151] can be found online at: https://www.frontiersin.org/articles/10.3389/fimmu.2021.709910/full#supplementary-material
References
1. Hodgkinson JW, Grayfer L, Belosevic M. Biology of Bony Fish Macrophages. Biology (Basel) (2015) 4:881–906. doi: 10.3390/biology4040881
2. Schlomchik M, Janeway C, Travers P, Walport M, Shlomchik M. Principals of Innate and Adaptive Immunity. In: Immunobiology: The Immune System in Health and Disease, 5th (Fifth) Edition. New York: Garland Science (2001). Available at: https://www.ncbi.nlm.nih.gov/books/NBK27090/.
3. Grayfer L, Kerimoglu B, Yaparla A, Hodgkinson JW, Xie J, Belosevic M. Mechanisms of Fish Macrophage Antimicrobial Immunity. Front Immunol (2018) 9:1105. doi: 10.3389/fimmu.2018.01105
4. Katzenback B, Katakura F, Belosevic M. Regulation of Teleost Macrophage and Neutrophil Cell Development by Growth Factors and Transcription Factors. In: New Advances and Contributions to Fish Biology. Hakan Türker: IntechOpen (2012). p. 97–149. Available at: https://www.intechopen.com/books/new-advances-and-contributions-to-fish-biology/regulation-of-fish-macrophage-and-neutrophil-cell-development-by-growth-factors-and-transcription-fa.
5. Geissmann F, Manz MG, Jung S, Sieweke MH, Merad M, Ley K. Development of Monocytes, Macrophages, and Dendritic Cells. Science (2010) 327:656–61. doi: 10.1126/science.1178331
6. Italiani P, Boraschi D. From Monocytes to M1/M2 Macrophages: Phenotypical vs. Functional Differentiation. Front Immunol (2014) 5:514. doi: 10.3389/fimmu.2014.00514
7. Zhou D, Huang C, Lin Z, Zhan S, Kong L, Fang C, et al. Macrophage Polarization and Function With Emphasis on the Evolving Roles of Coordinated Regulation of Cellular Signaling Pathways. Cell Signal (2014) 26:192–7. doi: 10.1016/j.cellsig.2013.11.004
8. Yang S, Li Q, Mu Y, Ao J, Chen X. Functional Activities of Interferon Gamma in Large Yellow Croaker Larimichthys crocea. Fish Shellfish Immunol (2017) 70:545–52. doi: 10.1016/j.fsi.2017.09.051
9. Arts JAJ, Tijhaar EJ, Chadzinska M, Savelkoul HFJ, Verburg-van Kemenade BML. Functional Analysis of Carp Interferon-γ: Evolutionary Conservation of Classical Phagocyte Activation. Fish Shellfish Immunol (2010) 29:793–802. doi: 10.1016/j.fsi.2010.07.010
10. Wang T, Secombes CJ. The Cytokine Networks of Adaptive Immunity in Fish. Fish Shellfish Immunol (2013) 35:1703–18. doi: 10.1016/j.fsi.2013.08.030
11. Ordás MC, Costa MM, Roca FJ, López-Castejón G, Mulero V, Meseguer J, et al. Turbot TNFα Gene: Molecular Characterization and Biological Activity of the Recombinant Protein. Mol Immunol (2007) 44:389–400. doi: 10.1016/j.molimm.2006.02.028
12. Hong S, Li R, Xu Q, Secombes CJ, Wang T. Two Types of TNF-alpha Exist in Teleost Fish: Phylogeny, Expression, and Bioactivity Analysis of Type-II TNF-Alpha3 in Rainbow Trout Oncorhynchus mykiss. J Immunol (2013) 191:5959–72. doi: 10.4049/jimmunol.1301584
13. Zhang A, Chen D, Wei H, Du L, Zhao T, Wang X, et al. Functional Characterization of TNF-Alpha in Grass Carp Head Kidney Leukocytes: Induction and Involvement in the Regulation of NF-KappaB Signaling. Fish Shellfish Immunol (2012) 33:1123–32. doi: 10.1016/j.fsi.2012.08.029
14. Hirono I, Nam B-H, Kurobe T, Aoki T. Molecular Cloning, Characterization, and Expression of TNF cDNA and Gene From Japanese Flounder Paralychthys olivaceus. J Immunol (2000) 165:4423–7. doi: 10.4049/jimmunol.165.8.4423
15. Sun B, Skjæveland I, Svingerud T, Zou J, Jørgensen J, Robertsen B. Antiviral Activity of Salmonid Gamma Interferon Against Infectious Pancreatic Necrosis Virus and Salmonid Alphavirus and Its Dependency on Type I Interferon. J Virol (2011) 85:9188–98. doi: 10.1128/JVI.00319-11
16. Morrison RN, Zou J, Secombes CJ, Scapigliati G, Adams MB, Nowak BF. Molecular Cloning and Expression Analysis of Tumour Necrosis Factor-α in Amoebic Gill Disease (AGD)-Affected Atlantic Salmon (Salmo salar L.). Fish Shellfish Immunol (2007) 23:1015–31. doi: 10.1016/j.fsi.2007.04.003
17. Wiegertjes GF, Wentzel AS, Spaink HP, Elks PM, Fink IR. Polarization of Immune Responses in Fish: The ‘Macrophages First’ Point of View. Mol Immunol (2016) 69:146–56. doi: 10.1016/j.molimm.2015.09.026
18. Lu X-J, Chen J. Specific Function and Modulation of Teleost Monocytes/Macrophages: Polarization and Phagocytosis TT. Zool Res (2019) 40:146–50. doi: 10.24272/j.issn.2095-8137.2019.035
19. Hodgkinson JW, Fibke C, Belosevic M. Recombinant IL-4/13A and IL-4/13B Induce Arginase Activity and Down-Regulate Nitric Oxide Response of Primary Goldfish (Carassius auratus L.) Macrophages. Dev Comp Immunol (2017) 67:377–84. doi: 10.1016/j.dci.2016.08.014
20. Yang Z-J, Li C-H, Chen J, Zhang H, Li M-Y, Chen J. Molecular Characterization of an interleukin-4/13B Homolog in Grass Carp (Ctenopharyngodon idella) and Its Role in Fish Against Aeromonas hydrophila Infection. Fish Shellfish Immunol (2016) 57:136–47. doi: 10.1016/j.fsi.2016.08.022
21. Joerink M, Ribeiro CMS, Stet RJM, Hermsen T, Savelkoul HFJ, Wiegertjes GF. Head Kidney-Derived Macrophages of Common Carp (Cyprinus carpio L.) Show Plasticity and Functional Polarization Upon Differential Stimulation. J Immunol (2006) 177:61–9. doi: 10.4049/jimmunol.177.1.61
22. Iwasaki H, Akashi K. Myeloid Lineage Commitment From the Hematopoietic Stem Cell. Immunity (2007) 26:726–40. doi: 10.1016/j.immuni.2007.06.004
23. Hume DA, Summers KM, Rehli M. Transcriptional Regulation and Macrophage Differentiation. In: Myeloid Cells Heal Dis. John Wiley & Sons, Inc. (2017). p. 117–39.
24. Barreda DR, Hanington PC, Walsh CK, Wong P, Belosevic M. Differentially Expressed Genes That Encode Potential Markers of Goldfish Macrophage Development In Vitro. Dev Comp Immunol (2004) 28:727–46. doi: 10.1016/j.dci.2003.11.005
25. Neumann NF, Barreda DR, Belosevic M. Generation and Functional Analysis of Distinct Macrophage Sub-Populations From Goldfish (Carassius auratus L.) Kidney Leukocyte Cultures. Fish Shellfish Immunol (2000) 10:1–20. doi: 10.1006/fsim.1999.0221
26. Stafford JL, McLauchlan PE, Secombes CJ, Ellis AE, Belosevic M. Generation of Primary Monocyte-Like Cultures From Rainbow Trout Head Kidney Leukocytes. Dev Comp Immunol (2001) 25:447–59. doi: 10.1016/S0145-305X(01)00015-5
27. Eslamloo K, Xue X, Hall JR, Smith NC, Caballero-Solares A, Parrish CC, et al. Transcriptome Profiling of Antiviral Immune and Dietary Fatty Acid Dependent Responses of Atlantic Salmon Macrophage-Like Cells. BMC Genomics (2017) 18:706. doi: 10.1186/s12864-017-4099-2
28. Soto-Dávila M, Valderrama K, Inkpen SM, Hall JR, Rise ML, Santander J. Effects of Vitamin D(2) (Ergocalciferol) and D(3) (Cholecalciferol) on Atlantic Salmon (Salmo salar) Primary Macrophage Immune Response to Aeromonas salmonicida Subsp. Salmonicida Infection. Front Immunol (2020) 10:3011. doi: 10.3389/fimmu.2019.03011
29. Smith NC, Christian SL, Taylor RG, Santander J, Rise ML. Immune Modulatory Properties of 6-Gingerol and Resveratrol in Atlantic Salmon Macrophages. Mol Immunol (2018) 95:10–9. doi: 10.1016/j.molimm.2018.01.004
30. Alzamora-Gonzales L, Colona-Vallejos EH, Aguilar-Luis MA, Calderon-Bardales CH, Quillama-Polo EL, de Amat-Herbozo CA, et al. Increased Production of Nitric Oxide in Head Kidney Leukocytes of Oncorhynchus Mykiss (Rainbow Trout) Fed a Diet Supplemented With Cell Walls of Saccharomyces cerevisiae. Front Immunol (2015). doi: 10.3389/conf.fimmu.2015.05.00242
31. González-Stegmaier R, Romero A, Estepa A, Montero J, Mulero V, Mercado L. Effects of Recombinant Flagellin B and Its ND1 Domain From Vibrio anguillarum on Macrophages From Gilthead Seabream (Sparus aurata L.) and Rainbow Trout (Oncorhynchus mykiss, W.). Fish Shellfish Immunol (2015) 42:144–52. doi: 10.1016/j.fsi.2014.10.034
32. Smith NC, Christian SL, Woldemariam NT, Clow KA, Rise ML, Andreassen R. Characterization of miRNAs in Cultured Atlantic Salmon Head Kidney Monocyte-Like and Macrophage-Like Cells. Int J Mol Sci (2020) 21:3989. doi: 10.3390/ijms21113989
33. Maekawa S, Wang P, Chen S. Comparative Study of Immune Reaction Against Bacterial Infection From Transcriptome Analysis. Front Immunol (2019) 10:153. doi: 10.3389/fimmu.2019.00153
34. Roy A. Microarray Analysis of Fish Genomic Data for Enhancing Aquaculture Productivity of India. Ann Proteomics Bioinform (2017) 1:12. doi: 10.29328/journal.hpbr.1001002
35. Jantzen SG, Sanderson DS, von Schalburg KR, Yasuike M, Marass F, Koop BFA. 44K Microarray Dataset of the Changing Transcriptome in Developing Atlantic Salmon (Salmo salar L.). BMC Res Notes (2011) 4:88. doi: 10.1186/1756-0500-4-88
36. Smith NC, Wajnberg G, Chacko S, Woldemariam NT, Lacroix J, Crapoulet N, et al. Characterization of miRNAs in Extracellular Vesicles Released From Atlantic Salmon Monocyte-Like and Macrophage-Like Cells. Front Immunol (2020) 11:587931. doi: 10.3389/fimmu.2020.587931
37. Booman M, Xu Q, Rise ML. Evaluation of the Impact of Camelina Oil-Containing Diets on the Expression of Genes Involved in the Innate Anti-Viral Immune Response in Atlantic Cod (Gadus morhua). Fish Shellfish Immunol (2014) 41:52–63. doi: 10.1016/j.fsi.2014.05.017
38. Celton M, Malpertuy A, Lelandais G, de Brevern AG. Comparative Analysis of Missing Value Imputation Methods to Improve Clustering and Interpretation of Microarray Experiments. BMC Genomics (2010) 11:15. doi: 10.1186/1471-2164-11-15
39. Bø TH, Dysvik B, Jonassen I. LSimpute: Accurate Estimation of Missing Values in Microarray Data With Least Squares Methods. Nucleic Acids Res (2004) 32:e34. doi: 10.1093/nar/gnh026
40. Tusher VG, Tibshirani R, Chu G. Significance Analysis of Microarrays Applied to the Ionizing Radiation Response. Proc Natl Acad Sci USA (2001) 98:5116–21. doi: 10.1073/pnas.091062498
41. Seo MJ. Sam: Significant Analysis of Microarrays (2014). Available at: https://github.com/MikeJSeo/SAM.
42. Umasuthan N, Xue X, Caballero-Solares A, Kumar S, Westcott JD, Chen Z, et al. Transcriptomic Profiling in Fins of Atlantic Salmon Parasitized With Sea Lice: Evidence for an Early Imbalance Between Chalimus-Induced Immunomodulation and the Host’s Defense Response. Int J Mol Sci (2020) 21:2417. doi: 10.3390/ijms21072417
43. Bindea G, Mlecnik B, Hackl H, Charoentong P, Tosolini M, Kirilovsky A, et al. ClueGO: A Cytoscape Plug-in to Decipher Functionally Grouped Gene Ontology and Pathway Annotation Networks. Bioinformatics (2009) 25:1091–3. doi: 10.1093/bioinformatics/btp101
44. Metsalu T, Vilo J. ClustVis: A Web Tool for Visualizing Clustering of Multivariate Data Using Principal Component Analysis and Heatmap. Nucleic Acids Res (2015) 43:W566–70. doi: 10.1093/nar/gkv468
45. Bustin SA, Benes V, Garson JA, Hellemans J, Huggett J, Kubista M, et al. The MIQE Guidelines: Minimum Information for Publication of Quantitative Real-Time PCR Experiments. Clin Chem (2009) 55:611–22. doi: 10.1373/clinchem.2008.112797
46. Pfaffl MW. A New Mathematical Model for Relative Quantification in Real-Time RT-PCR. Nucleic Acids Res (2001) 29:e45. doi: 10.1093/nar/29.9.e45
47. Vandesompele J, De Preter K, Pattyn F, Poppe B, Van Roy N, De Paepe A, et al. Accurate Normalization of Real-Time Quantitative RT-PCR Data by Geometric Averaging of Multiple Internal Control Genes. Genome Biol (2002) 3(7):research0034.1. doi: 10.1186/gb-2002-3-7-research0034
48. Krüger J, Rehmsmeier M. RNAhybrid: microRNA Target Prediction Easy, Fast and Flexible. Nucleic Acids Res (2006) 34:W451–4. doi: 10.1093/nar/gkl243
49. Woldemariam NT, Agafonov O, Hoyheim B, Houston RD, Taggart JB, Andreassen R. Expanding the MiRNA Repertoire in Atlantic Salmon; Discovery of IsomiRs and MiRNAs Highly Expressed in Different Tissues and Developmental Stages. Cells (2019) 8:42. doi: 10.3390/cells8010042
50. Huang Z, Teeling EC. ExUTR: A Novel Pipeline for Large-Scale Prediction of 3′-UTR Sequences From NGS Data. BMC Genomics (2017) 18:847. doi: 10.1186/s12864-017-4241-1
51. Kuleshov MV, Jones MR, Rouillard AD, Fernandez NF, Duan Q, Wang Z, et al. Enrichr: A Comprehensive Gene Set Enrichment Analysis Web Server 2016 Update. Nucleic Acids Res (2016) 44:W90–7. doi: 10.1093/nar/gkw377
52. Huang R, Grishagin I, Wang Y, Zhao T, Greene J, Obenauer JC, et al. The NCATS BioPlanet – An Integrated Platform for Exploring the Universe of Cellular Signaling Pathways for Toxicology, Systems Biology, and Chemical Genomics. Front Pharmacol (2019) 10:445. doi: 10.3389/fphar.2019.00445
53. Canadian Aquaculture Industry by the Numbers. Available at: https://www.aquaculture.ca/industry-by-the-numbers-index.
54. Martinez FO, Gordon S, Locati M, Mantovani A. Transcriptional Profiling of the Human Monocyte-to-Macrophage Differentiation and Polarization: New Molecules and Patterns of Gene Expression. J Immunol (2006) 177:7303–11. doi: 10.4049/jimmunol.177.10.7303
55. Jiang L, Li X, Zhang Y, Zhang M, Tang Z, Lv K. Microarray and Bioinformatics Analyses of Gene Expression Profiles in BALB/c Murine Macrophage Polarization. Mol Med Rep (2017) 16:7382–90. doi: 10.3892/mmr.2017.7511
56. Bayik D, Tross D, Haile LA, Verthelyi D, Klinman DM. Regulation of the Maturation of Human Monocytes Into Immunosuppressive Macrophages. Blood Adv (2017) 1:2510–9. doi: 10.1182/bloodadvances.2017011221
57. Ecker J, Liebisch G, Englmaier M, Grandl M, Robenek H, Schmitz G. Induction of Fatty Acid Synthesis Is a Key Requirement for Phagocytic Differentiation of Human Monocytes. Proc Natl Acad Sci USA (2010) 107:7817–22. doi: 10.1073/pnas.0912059107
58. Wallner S, Grandl M, Konovalova T, Sigrüner A, Kopf T, Peer M, et al. Monocyte to Macrophage Differentiation Goes Along With Modulation of the Plasmalogen Pattern Through Transcriptional Regulation. PloS One (2014) 9:e94102. doi: 10.1371/journal.pone.0094102
59. Hume DA, Irvine KM, Pridans C. The Mononuclear Phagocyte System: The Relationship Between Monocytes and Macrophages. Trends Immunol (2019) 40:98–112. doi: 10.1016/j.it.2018.11.007
60. Ma X, Lin WY, Chen Y, Stawicki S, Mukhyala K, Wu Y, et al. Structural Basis for the Dual Recognition of Helical Cytokines IL-34 and CSF-1 by CSF-1R. Structure (2012) 20:676–87. doi: 10.1016/j.str.2012.02.010
61. Stanley ER, Chitu V. CSF-1 Receptor Signaling in Myeloid Cells. Cold Spring Harb Perspect Biol (2014) 6:a021857. doi: 10.1101/cshperspect.a021857
62. Katzenback BA, Belosevic M. Colony-Stimulating Factor-1 Receptor Protein Expression Is a Specific Marker for Goldfish (Carassius Auratus L.) Macrophage Progenitors and Their Differentiated Cell Types. Fish Shellfish Immunol (2012) 32:434–45. doi: 10.1016/j.fsi.2011.12.003
63. Panopoulos AD, Watowich SS. Granulocyte Colony-Stimulating Factor: Molecular Mechanisms of Action During Steady State and “Emergency” Hematopoiesis. Cytokine (2008) 42:277–88. doi: 10.1016/j.cyto.2008.03.002
64. Lieschke GJ, Grail D, Hodgson G, Metcalf D, Stanley E, Cheers C, et al. Mice Lacking Granulocyte Colony-Stimulating Factor Have Chronic Neutropenia, Granulocyte and Macrophage Progenitor Cell Deficiency, and Impaired Neutrophil Mobilization. Blood (1994) 84:1737–46. doi: 10.1182/blood.V84.6.1737.bloodjournal8461737
65. Hanington PC, Hitchen SJ, Beamish LA, Belosevic M. Macrophage Colony Stimulating Factor (CSF-1) Is a Central Growth Factor of Goldfish Macrophages. Fish Shellfish Immunol (2009) 26:1–9. doi: 10.1016/j.fsi.2008.09.020
66. Chen Q, Lu X-J, Chen J. Identification and Functional Characterization of the CSF1R Gene From Grass Carp Ctenopharyngodon idellus and Its Use as a Marker of Monocytes/Macrophages. Fish Shellfish Immunol (2015) 45:386–98. doi: 10.1016/j.fsi.2015.04.029
67. Basheer F, Rasighaemi P, Liongue C, Ward AC. Zebrafish Granulocyte Colony-Stimulating Factor Receptor Maintains Neutrophil Number and Function Throughout the Life Span. Infect Immun (2019) 87:e00793-18. doi: 10.1128/IAI.00793-18
68. Pazhakh V, Clark S, Keightley MC, Lieschke GJA. GCSFR/CSF3R Zebrafish Mutant Models the Persistent Basal Neutrophil Deficiency of Severe Congenital Neutropenia. Sci Rep (2017) 7:44455. doi: 10.1038/srep44455
69. Katzenback BA, Belosevic M. Characterization of Granulocyte Colony Stimulating Factor Receptor of the Goldfish (Carassius Auratus L.). Dev Comp Immunol (2012) 36:199–207. doi: 10.1016/j.dci.2011.07.005
70. Sarin H. B-Cell Antibody Class Switchings are Pressuromodulated Events: Part II, Gene Recombination. Transl Med Commun (2018) 3:2. doi: 10.1186/s41231-018-0020-5
71. Lepletier A, Lutzky VP, Mittal D, Stannard K, Watkins TS, Ratnatunga CN, et al. The Immune Checkpoint CD96 Defines a Distinct Lymphocyte Phenotype and Is Highly Expressed on Tumor-Infiltrating T Cells. Immunol Cell Biol (2019) 97:152–64. doi: 10.1111/imcb.12205
72. Cano R, Lopera H. Introduction to T and B Lymphocytes. In: Anaya J, Shoenfeld Y, Rojas-Villarraga A, Levy RA, Cervera R, editors. Autoimmunity: From Bench to Bedside. Bogota: El Rosario University Press (2013). Available at: https://www.ncbi.nlm.nih.gov/books/NBK459471/.
73. Forlenza M, Fink IR, Raes G, Wiegertjes GF. Heterogeneity of Macrophage Activation in Fish. Dev Comp Immunol (2011) 35:1246–55. doi: 10.1016/j.dci.2011.03.008
74. Joerink M, Savelkoul HFJ, Wiegertjes GF. Evolutionary Conservation of Alternative Activation of Macrophages: Structural and Functional Characterization of Arginase 1 and 2 in Carp (Cyprinus carpio L.). Mol Immunol (2006) 43:1116–28. doi: 10.1016/j.molimm.2005.07.022
75. Zou J, Carrington A, Collet B, Dijkstra JM, Yoshiura Y, Bols N, et al. Identification and Bioactivities of IFN-Gamma in Rainbow Trout Oncorhynchus mykiss: The First Th1-Type Cytokine Characterized Functionally in Fish. J Immunol (2005) 175:2484–94. doi: 10.4049/jimmunol.175.4.2484
76. Grayfer L, Belosevic M. Molecular Characterization, Expression and Functional Analysis of Goldfish (Carassius aurutus L.) Interferon Gamma. Dev Comp Immunol (2009) 33:235–46. doi: 10.1016/j.dci.2008.09.001
77. Grayfer L, Walsh JG, Belosevic M. Characterization and Functional Analysis of Goldfish (Carassius auratus L.) Tumor Necrosis Factor-Alpha. Dev Comp Immunol (2008) 32:532–43. doi: 10.1016/j.dci.2007.09.009
78. Grayson TH, Cooper LF, Wrathmell AB, Roper J, Evenden AJ, Gilpin ML. Host Responses to Renibacterium salmoninarum and Specific Components of the Pathogen Reveal the Mechanisms of Immune Suppression and Activation. Immunology (2002) 106:273–83. doi: 10.1046/j.1365-2567.2002.01420.x
79. Xu C, Evensen Ø, Munang’andu HM. De Novo Assembly and Transcriptome Analysis of Atlantic Salmon Macrophage/Dendritic-Like TO Cells Following Type I IFN Treatment and Salmonid Alphavirus Subtype-3 Infection. BMC Genomics (2015) 16:96. doi: 10.1186/s12864-015-1302-1
80. Eslamloo K, Ghorbani A, Xue X, Inkpen SM, Larijani M, Rise ML. Characterization and Transcript Expression Analyses of Atlantic Cod Viperin. Front Immunol (2019) 10:311. doi: 10.3389/fimmu.2019.00311
81. Zhou X, Michal JJ, Zhang L, Ding B, Lunney JK, Liu B, et al. Interferon Induced IFIT Family Genes in Host Antiviral Defense. Int J Biol Sci (2013) 9:200–8. doi: 10.7150/ijbs.5613
82. Espin Palazon R, Cheng X, Campbell CA, Li L, Schmid B, Traver D. Zebra “Fishing” the Role of Granulin in Hematopoiesis. Blood (2019) 134:1194. doi: 10.1182/blood-2019-130781
83. Rodrigues PNS, Vázquez-Dorado S, Neves JV, Wilson JM. Dual Function of Fish Hepcidin: Response to Experimental Iron Overload and Bacterial Infection in Sea Bass (Dicentrarchus labrax). Dev Comp Immunol (2006) 30:1156–67. doi: 10.1016/j.dci.2006.02.005
84. Heinz S, Haehnel V, Karaghiosoff M, Schwarzfischer L, Müller M, Krause SW, et al. Species-Specific Regulation of Toll-Like Receptor 3 Genes in Men and Mice. J Biol Chem (2003) 278:21502–9. doi: 10.1074/jbc.M301476200
85. Muzio M, Bosisio D, Polentarutti N, D’amico G, Stoppacciaro A, Mancinelli R, et al. Differential Expression and Regulation of Toll-Like Receptors (TLR) in Human Leukocytes: Selective Expression of TLR3 in Dendritic Cells. J Immunol (2000) 164:5998–6004. doi: 10.4049/jimmunol.164.11.5998
86. Hayashi F, Means TK, Luster AD. Toll-Like Receptors Stimulate Human Neutrophil Function. Blood (2003) 102:2660–9. doi: 10.1182/blood-2003-04-1078
87. Liu E, Li Z, Zhang Y, Chen K. Hepcidin Induces M1 Macrophage Polarization in Monocytes or THP-1 Derived Macrophages. Iran J Immunol (2019) 16:190–9. doi: 10.22034/IJI.2019.80270
88. Solberg R, Smith R, Almlof M, Tewolde E, Nilsen H, Johansen HT. Legumain Expression, Activity and Secretion Are Increased During Monocyte-to-Macrophage Differentiation and Inhibited by Atorvastatin. Biol Chem (2015) 396:71–80. doi: 10.1515/hsz-2014-0172
89. Shen L, Kang L, Wang D, Xun J, Chen C, Du L, et al. Legumain-Deficient Macrophages Promote Senescence of Tumor Cells by Sustaining JAK1/STAT1 Activation. Cancer Lett (2020) 472:40–9. doi: 10.1016/j.canlet.2019.12.013
90. Shiau CE, Kaufman Z, Meireles AM, Talbot WS. Differential Requirement for Irf8 in Formation of Embryonic and Adult Macrophages in Zebrafish. PloS One (2015) 10:e0117513. doi: 10.1371/journal.pone.0117513
91. Li L, Jin H, Xu J, Shi Y, Wen Z. Irf8 Regulates Macrophage Versus Neutrophil Fate During Zebrafish Primitive Myelopoiesis. Blood (2011) 117:1359–69. doi: 10.1182/blood-2010-06-290700
92. Eslamloo K, Caballero-Solares A, Inkpen SM, Emam M, Kumar S, Bouniot C, et al. Transcriptomic Profiling of the Adaptive and Innate Immune Responses of Atlantic Salmon to Renibacterium salmoninarum Infection. Front Immunol (2020) 11:567838. doi: 10.3389/fimmu.2020.567838
93. Ingerslev H-C, Rønneseth A, Pettersen EF, Wergeland HI. Differential Expression of Immune Genes in Atlantic Salmon (Salmo salar L.) Challenged Intraperitoneally or by Cohabitation With IPNV. Scand J Immunol (2009) 69:90–8. doi: 10.1111/j.1365-3083.2008.02201.x
94. Fierro-Castro C, Barrioluengo L, López-Fierro P, Razquin BE, Villena AJ. Fish Cell Cultures as In Vitro Models of Inflammatory Responses Elicited by Immunostimulants. Expression of Regulatory Genes of the Innate Immune Response. Fish Shellfish Immunol (2013) 35:979–87. doi: 10.1016/j.fsi.2013.07.015
95. Remmerie A, Scott CL. Macrophages and Lipid Metabolism. Cell Immunol (2018) 330:27–42. doi: 10.1016/j.cellimm.2018.01.020
96. Liu H, Shi B, Huang C-C, Eksarko P, Pope RM. Transcriptional Diversity During Monocyte to Macrophage Differentiation. Immunol Lett (2008) 117:70–80. doi: 10.1016/j.imlet.2007.12.012
97. Larbi Ayisi C, Zhao J, Wu J-W. Replacement of Fish Oil With Palm Oil: Effects on Growth Performance, Innate Immune Response, Antioxidant Capacity and Disease Resistance in Nile Tilapia (Oreochromis niloticus). PloS One (2018) 13:e0196100. doi: 10.1371/journal.pone.0196100
98. Morais S, Silva T, Cordeiro O, Rodrigues P, Guy D, Bron J, et al. Effects of Genotype and Dietary Fish Oil Replacement With Vegetable Oil on the Intestinal Transcriptome and Proteome of Atlantic Salmon (Salmo Salar). BMC Genomics (2012) 13:448. doi: 10.1186/1471-2164-13-448
99. Betancor MB, Olsen RE, Marandel L, Skulstad OF, Madaro A, Tocher DR, et al. Impact of Dietary Carbohydrate/Protein Ratio on Hepatic Metabolism in Land-Locked Atlantic Salmon (Salmo salar L.). Front Physiol (2018) 9:1751. doi: 10.3389/fphys.2018.01751
100. Caballero-Solares A, Xue X, Parrish CC, Foroutani MB, Taylor RG, Rise ML. Changes in the Liver Transcriptome of Farmed Atlantic Salmon (Salmo Salar) Fed Experimental Diets Based on Terrestrial Alternatives to Fish Meal and Fish Oil. BMC Genomics (2018) 19:796. doi: 10.1186/s12864-018-5188-6
101. Zuo H, Gao J, Yuan J, Deng H, Yang L, Weng S, et al. Fatty Acid Synthase Plays a Positive Role in Shrimp Immune Responses Against Vibrio parahaemolyticus Infection. Fish Shellfish Immunol (2017) 60:282–8. doi: 10.1016/j.fsi.2016.11.054
102. Chang CL, Garcia-Arcos I, Nyrén R, Olivecrona G, Kim JY, Hu Y, et al. Lipoprotein Lipase Deficiency Impairs Bone Marrow Myelopoiesis and Reduces Circulating Monocyte Levels. Arterioscler Thromb Vasc Biol (2018) 38:509–19. doi: 10.1161/ATVBAHA.117.310607
103. Liang XF, Oku H, Ogata HY. The Effects of Feeding Condition and Dietary Lipid Level on Lipoprotein Lipase Gene Expression in Liver and Visceral Adipose Tissue of Red Sea Bream Pagrus Major. Comp Biochem Physiol A Mol Integr Physiol (2002) 131:335–42. doi: 10.1016/s1095-6433(01)00481-0
104. Sánchez-Moya A, García-Meilán I, Riera-Heredia N, Vélez EJ, Lutfi E, Fontanillas R, et al. Effects of Different Dietary Vegetable Oils on Growth and Intestinal Performance, Lipid Metabolism and Flesh Quality in Gilthead Sea Bream. Aquaculture (2020) 519:734881. doi: 10.1016/j.aquaculture.2019.734881
105. Wang A, Yang W, Liu F, Wang Z, Cang P, Yin X, et al. Cloning and Characterization of Lipoprotein Lipase (LPL) and the Effects of Dietary Lipid Levels on the Expression of LPL in the Redlip Mullet (Liza Haematocheila). Aquac Nutr (2018) 24:832–41. doi: 10.1111/anu.12612
106. Ménégaut L, Jalil A, Thomas C, Masson D. Macrophage Fatty Acid Metabolism and Atherosclerosis: The Rise of PUFAs. Atherosclerosis (2019) 291:52–61. doi: 10.1016/j.atherosclerosis.2019.10.002
107. Gromovsky AD, Schugar RC, Brown AL, Helsley RN, Burrows AC, Ferguson D, et al. Δ-5 Fatty Acid Desaturase Fads1 Impacts Metabolic Disease by Balancing Proinflammatory and Proresolving Lipid Mediators. Arterioscler Thromb Vasc Biol (2018) 38:218–31. doi: 10.1161/ATVBAHA.117.309660
108. Vagner M, Santigosa E. Characterization and Modulation of Gene Expression and Enzymatic Activity of Delta-6 Desaturase in Teleosts: A Review. Aquaculture (2011) 315:131–43. doi: 10.1016/j.aquaculture.2010.11.031
109. Holen E, Araujo P, Sissener NH, Rosenlund G, Waagbø R. A Comparative Study: Difference in omega-6/omega-3 Balance and Saturated Fat in Diets for Atlantic Salmon (Salmo salar) Affect Immune-, Fat Metabolism-, Oxidative and Apoptotic-Gene Expression, and Eicosanoid Secretion in Head Kidney Leukocytes. Fish Shellfish Immunol (2018) 72:57–68. doi: 10.1016/j.fsi.2017.10.040
110. Betancor MB, Li K, Bucerzan VS, Sprague M, Sayanova O, Usher S, et al. Oil From Transgenic Camelina Sativa Containing Over 25% N-3 Long-Chain PUFA as the Major Lipid Source in Feed for Atlantic Salmon (Salmo salar). Br J Nutr (2018) 119:1378–92. doi: 10.1017/S0007114518001125
111. Geay F, Santigosa I Culi E, Corporeau C, Boudry P, Dreano Y, Corcos L, et al. Regulation of FADS2 Expression and Activity in European Sea Bass (Dicentrarchus labrax, L.) Fed a Vegetable Diet. Comp Biochem Physiol B Biochem Mol Biol (2010) 156:237–43. doi: 10.1016/j.cbpb.2010.03.008
112. Abdul Hamid NK, Carmona-Antoñanzas G, Monroig Ó, Tocher DR, Turchini GM, Donald JA. Isolation and Functional Characterisation of a Fads2 in Rainbow Trout (Oncorhynchus mykiss) With Δ5 Desaturase Activity. PloS One (2016) 11:e0150770–e0150770. doi: 10.1371/journal.pone.0150770
113. Wang S, Monroig Ó, Tang G, Zhang L, You C, Tocher DR, et al. Investigating Long-Chain Polyunsaturated Fatty Acid Biosynthesis in Teleost Fish: Functional Characterization of Fatty Acyl Desaturase (Fads2) and Elovl5 Elongase in the Catadromous Species, Japanese Eel Anguilla japonica. Aquaculture (2014) 434:57–65. doi: 10.1016/j.aquaculture.2014.07.016
114. Moebius FF, Fitzky BU, Lee JN, Paik YK, Glossmann H. Molecular Cloning and Expression of the Human delta7-sterol Reductase. Proc Natl Acad Sci USA (1998) 95:1899–902. doi: 10.1073/pnas.95.4.1899
115. Zhu T, Corraze G, Plagnes-Juan E, Quillet E, Dupont-Nivet M, Skiba-Cassy S. Regulation of Genes Related to Cholesterol Metabolism in Rainbow Trout (Oncorhynchus mykiss) Fed a Plant-Based Diet. Am J Physiol Regul Integr Comp Physiol (2018) 314:R58–70. doi: 10.1152/ajpregu.00179.2017
116. Król E, Douglas A, Tocher DR, Crampton VO, Speakman JR, Secombes CJ, et al. Differential Responses of the Gut Transcriptome to Plant Protein Diets in Farmed Atlantic Salmon. BMC Genomics (2016) 17:156. doi: 10.1186/s12864-016-2473-0
117. Hixson SM, Parrish CC, Xue X, Wells JS, Collins SA, Anderson DM, et al. Growth Performance, Tissue Composition, and Gene Expression Responses in Atlantic Salmon (Salmo salar) Fed Varying Levels of Different Lipid Sources. Aquaculture (2017) 467:76–88. doi: 10.1016/j.aquaculture.2016.04.011
118. Kurotaki D, Sasaki H, Tamura T. Transcriptional Control of Monocyte and Macrophage Development. Int Immunol (2017) 29:97–107. doi: 10.1093/intimm/dxx016
119. McConnell BB, Yang VW. Mammalian Krüppel-Like Factors in Health and Diseases. Physiol Rev (2010) 90:1337–81. doi: 10.1152/physrev.00058.2009
120. Jha P, Das H. KLF2 in Regulation of NF-κb-Mediated Immune Cell Function and Inflammation. Int J Mol Sci (2017) 18:2383. doi: 10.3390/ijms18112383
121. Das H, Kumar A, Lin Z, Patino WD, Hwang PM, Feinberg MW, et al. Kruppel-Like Factor 2 (KLF2) Regulates Proinflammatory Activation of Monocytes. Proc Natl Acad Sci (2006) 103:6653–8. doi: 10.1073/pnas.0508235103
122. Ai F, Zhao G, Lv W, Liu B, Lin J. Dexamethasone Induces Aberrant Macrophage Immune Function and Apoptosis. Oncol Rep (2020) 43:427–36. doi: 10.3892/or.2019.7434
123. Dengler HS, Baracho GV, Omori SA, Bruckner S, Arden KC, Castrillon DH, et al. Distinct Functions for the Transcription Factor Foxo1 at Various Stages of B Cell Differentiation. Nat Immunol (2008) 9:1388–98. doi: 10.1038/ni.1667
124. Lu X-J, Chen Q, Chen J, Chen J. Molecular Identification and Functional Analysis of KLF2 in Plecoglossus altivelis (Ayu): It’s Regulatory Role in Monocyte/Macrophage Activation. Fish Shellfish Immunol (2017) 62:257–64. doi: 10.1016/j.fsi.2017.01.035
125. Yu Y, Li C, Wang Y, Wang Q, Wang S, Wei S, et al. Molecular Cloning and Characterization of Grouper Krϋppel-Like Factor 9 Gene: Involvement in the Fish Immune Response to Viral Infection. Fish Shellfish Immunol (2019) 89:677–86. doi: 10.1016/j.fsi.2019.03.041
126. Platanitis E, Decker T. Regulatory Networks Involving STATs, IRFS, and NFκB in Inflammation. Front Immunol (2018) 9:2542. doi: 10.3389/fimmu.2018.02542
127. Günthner R, Anders H-J. Interferon-Regulatory Factors Determine Macrophage Phenotype Polarization. Mediators Inflamm (2013) 2013:731023. doi: 10.1155/2013/731023
128. Tamura T, Nagamura-Inoue T, Shmeltzer Z, Kuwata T, Ozato K. ICSBP Directs Bipotential Myeloid Progenitor Cells to Differentiate Into Mature Macrophages. Immunity (2000) 13:155–65. doi: 10.1016/S1074-7613(00)00016-9
129. Tamura T, Kurotaki D, Koizumi S. Regulation of Myelopoiesis by the Transcription Factor IRF8. Int J Hematol (2015) 101:342–51. doi: 10.1007/s12185-015-1761-9
130. Lu R, Pitha PM. Monocyte Differentiation to Macrophage Requires Interferon Regulatory Factor 7. J Biol Chem (2001) 276:45491–6. doi: 10.1074/jbc.C100421200
131. Toshchakov V, Jones BW, Perera P-Y, Thomas K, Cody MJ, Zhang S, et al. TLR4, But Not TLR2, Mediates IFN-Beta-Induced STAT1alpha/Beta-Dependent Gene Expression in Macrophages. Nat Immunol (2002) 3:392–8. doi: 10.1038/ni774
132. Wang N, Liang H, Zen K. Molecular Mechanisms That Influence the Macrophage m1-m2 Polarization Balance. Front Immunol (2014) 5:614. doi: 10.3389/fimmu.2014.00614
133. Holland JW, Bird S, Williamson B, Woudstra C, Mustafa A, Wang T, et al. Molecular Characterization of IRF3 and IRF7 in Rainbow Trout, Oncorhynchus mykiss: Functional Analysis and Transcriptional Modulation. Mol Immunol (2008) 46:269–85. doi: 10.1016/j.molimm.2008.08.265
134. Zhao X, Huo R, Yan X, Xu T. IRF3 Negatively Regulates Toll-Like Receptor-Mediated NF-κB Signaling by Targeting TRIF for Degradation in Teleost Fish. Front Immunol (2018) 9:867. doi: 10.3389/fimmu.2018.00867
135. Coccia EM, Del Russo N, Stellacci E, Testa U, Marziali G, Battistini A. STAT1 Activation During Monocyte to Macrophage Maturation: Role of Adhesion Molecules. Int Immunol (1999) 11:1075–83. doi: 10.1093/intimm/11.7.1075
136. Wu H, Zhang Y, Lu X, Xiao J, Feng P, Feng H. STAT1a and STAT1b of Black Carp Play Important Roles in the Innate Immune Defense Against GCRV. Fish Shellfish Immunol (2019) 87:386–94. doi: 10.1016/j.fsi.2019.01.037
137. O’Brien J, Hayder H, Zayed Y, Peng C. Overview of MicroRNA Biogenesis, Mechanisms of Actions, and Circulation. Front Endocrinol (2018) 9:402. doi: 10.3389/fendo.2018.00402
138. He S, Yang L, Li D, Li M. Kruppel-Like Factor 2-Mediated Suppression of MicroRNA-155 Reduces the Proinflammatory Activation of Macrophages. PloS One (2015) 10:e0139060. doi: 10.1371/journal.pone.0139060
139. Bushati N, Cohen SM. microRNA Functions. Annu Rev Cell Dev Biol (2007) 23:175–205. doi: 10.1146/annurev.cellbio.23.090506.123406
140. Roy S. miRNA in Macrophage Development and Function. Antioxid Redox Signal (2016) 25:795–804. doi: 10.1089/ars.2016.6728
141. Essandoh K, Li Y, Huo J, Fan GC. MiRNA-Mediated Macrophage Polarization and Its Potential Role in the Regulation of Inflammatory Response. Shock (2016) 46:122–31. doi: 10.1097/SHK.0000000000000604
142. Garo LP, Murugaiyan G. Contribution of MicroRNAs to Autoimmune Diseases. Cell Mol Life Sci (2016) 73:2041–51. doi: 10.1007/s00018-016-2167-4
143. Zhang Y, Zhang M, Zhong M, Suo Q, Lv K. Expression Profiles of miRNAs in Polarized Macrophages. Int J Mol Med (2013) 31:797–802. doi: 10.3892/ijmm.2013.1260
144. Lu L, McCurdy S, Huang S, Zhu X, Peplowska K, Tiirikainen M, et al. Time Series miRNA-mRNA Integrated Analysis Reveals Critical miRNAs and Targets in Macrophage Polarization. Sci Rep (2016) 6:37446. doi: 10.1038/srep37446
145. Woldemariam NT, Agafonov O, Sindre H, Høyheim B, Houston RD, Robledo D, et al. miRNAs Predicted to Regulate Host Anti-Viral Gene Pathways in IPNV-Challenged Atlantic Salmon Fry Are Affected by Viral Load, and Associated With the Major IPN Resistance QTL Genotypes in Late Infection. Front Immunol (2020) 11:2113. doi: 10.3389/fimmu.2020.02113
146. Andreassen R, Woldemariam NT, Egeland IO, Agafonov O, Sindre H, Hoyheim B. Identification of Differentially Expressed Atlantic Salmon miRNAs Responding to Salmonid Alphavirus (SAV) Infection. BMC Genomics (2017) 18:343–9. doi: 10.1186/s12864-017-3741-3
147. Andreassen R, Høyheim B. miRNAs Associated With Immune Response in Teleost Fish. Dev Comp Immunol (2017) 75:77–85. doi: 10.1016/j.dci.2017.02.023
148. Kittelmann S, McGregor AP. Modulation and Evolution of Animal Development Through MicroRNA Regulation of Gene Expression. Genes (Basel) (2019) 10:321. doi: 10.3390/genes10040321
149. Katan T, Caballero-Solares A, Taylor RG, Rise ML, Parrish CC. Effect of Plant-Based Diets with Varying Ratios of ω6 to ω3 Fatty Acids on Growth Performance, Tissue Composition, Fatty Acid Biosynthesis and Lipid-Related Gene Expression in Atlantic Salmon (Salmo salar). Comp Biochem Physiol Part D Genomics Proteomics (2019) 30:290–304. doi: 10.1016/j.cbd.2019.03.004
150. Caballero-Solares A, Hall JR, Xue X, Eslamloo K, Taylor RG, Parrish CC, et al. The Dietary Replacement of Marine Ingredients by Terrestrial Animal and Plant Alternatives Modulates the Antiviral Immune Response of Atlantic Salmon (Salmo salar). Fish Shellfish Immunol (2017) 64:24–38. doi: 10.1016/j.fsi.2017.02.040
151. Xue X, Hall JR, Caballero-Solares A, Eslamloo K, Taylor RG, Parrish CC, et al. Liver Transcriptome Profiling Reveals That Dietary DHA and EPA Levels Influence Suites of Genes Involved in Metabolism, Redox Homeostasis, and Immune Function in Atlantic Salmon (Salmo salar). Mar Biotechnol NY (2020) 22(2):263–84. doi: 10.1007/s10126-020-09950-x
Keywords: Atlantic salmon, transcriptome, macrophage, microarray, cell differentiation, head kidney leukocyte culture
Citation: Smith NC, Umasuthan N, Kumar S, Woldemariam NT, Andreassen R, Christian SL and Rise ML (2021) Transcriptome Profiling of Atlantic Salmon Adherent Head Kidney Leukocytes Reveals That Macrophages Are Selectively Enriched During Culture. Front. Immunol. 12:709910. doi: 10.3389/fimmu.2021.709910
Received: 14 May 2021; Accepted: 05 July 2021;
Published: 16 August 2021.
Edited by:
Jorunn Jørgensen, Arctic University of Norway, NorwayReviewed by:
Dimitar Borisov Iliev, Bulgarian Academy of Sciences (BAS), BulgariaAlexander Rebl, Leibniz Institute for Farm Animal Biology (FBN), Germany
Gyri T. Haugland, University of Bergen, Norway
Copyright © 2021 Smith, Umasuthan, Kumar, Woldemariam, Andreassen, Christian and Rise. This is an open-access article distributed under the terms of the Creative Commons Attribution License (CC BY). The use, distribution or reproduction in other forums is permitted, provided the original author(s) and the copyright owner(s) are credited and that the original publication in this journal is cited, in accordance with accepted academic practice. No use, distribution or reproduction is permitted which does not comply with these terms.
*Correspondence: Nicole C. Smith, bmljb2xlLmMuc21pdGhAbXVuLmNh; Sherri L. Christian, c2hlcnJpLmNocmlzdGlhbkBtdW4uY2E=