 Elena Merino Tejero1‡
 Danial Lashgari1‡
 Rodrigo García-Valiente1
 Jiaojiao He2,3
 Philippe A. Robert4†
 Michael Meyer-Hermann4,5
 Jeroen E. J. Guikema6
 Huub Hoefsloot7
 Antoine H. C. van Kampen1,7*
- 1Bioinformatics Laboratory, Epidemiology and Data Science, Amsterdam Public Health Research Institute, Amsterdam Institute for Infection and Immunity, Amsterdam, Netherlands
- 2Bioinformatics and Systems Biology, Vrije Universiteit Amsterdam, Amsterdam, Netherlands
- 3Bioinformatics and Systems Biology, Institute for Life Sciences, University of Amsterdam, Amsterdam, Netherlands
- 4Department for Systems Immunology and Braunschweig Integrated Centre of Systems Biology, Helmholtz Centre for Infection Research, Braunschweig, Germany
- 5Institute for Biochemistry, Biotechnology and Bioinformatics, Technische Universität Braunschweig, Braunschweig, Germany
- 6Department of Pathology, Lymphoma and Myeloma Center Amsterdam (LYMMCARE), Amsterdam University Medical Centers, Amsterdam, Netherlands
- 7Biosystems Data Analysis, Swammerdam Institute for Life Sciences, University of Amsterdam, Amsterdam, Netherlands
Memory B cells and antibody-secreting plasma cells are generated within germinal centers during affinity maturation in which B-cell proliferation, selection, differentiation, and self-renewal play important roles. The mechanisms behind memory B cell and plasma cell differentiation in germinal centers are not well understood. However, it has been suggested that cell fate is (partially) determined by asymmetric cell division, which involves the unequal distribution of cellular components to both daughter cells. To investigate what level and/or probability of asymmetric segregation of several fate determinant molecules, such as the antigen and transcription factors (BCL6, IRF4, and BLIMP1) recapitulates the temporal switch and DZ-to-LZ ratio in the germinal center, we implemented a multiscale model that combines a core gene regulatory network for plasma cell differentiation with a model describing the cellular interactions and dynamics in the germinal center. Our simulations show that BLIMP1 driven plasma cell differentiation together with coupled asymmetric division of antigen and BLIMP1 with a large segregation between the daughter cells results in a germinal center DZ-to-LZ ratio and a temporal switch from memory B cells to plasma cells that have been observed in experiments.
Introduction
Memory B cells (MBCs) and antibody-secreting plasma cells (PCs) are generated within germinal centers (GCs) during affinity maturation in which B-cell proliferation, selection, differentiation, and self-renewal play important roles in the GC reaction (1). Positive selection of B cells is facilitated by collecting antigen (Ag) presented by follicular dendritic cells (FDCs) and subsequent engagement in T follicular helper (Tfh) cells contacts. B cells with higher-affinity receptors (BcRs) are thought to receive more help from Tfh cells due to increased presentation of pMHCII on their surface. Selected B cells recycle to the dark zone (DZ) to further divide and differentiate as output cells (OCs) or to enter a next cycle of selection (recycling).
The mechanisms behind MBC and PC differentiation into OCs from GCs are not well understood. However, in other systems, such as Drosophila, it has been suggested that cell fate is (partially) determined by asymmetric cell division, which involves the unequal distribution of cellular components to both daughter cells (2). Another study exclusively analyzed the distribution of Ag in in vivo and in vitro mouse B cells showing that accumulated Ag is maintained in a polarized distribution prior to the division in approximately 72% of the B cells and that this polarization is maintained during cell division resulting in an asymmetric division of Ag over both daughter cells (3). The daughter cell that receives more Ag as a result of asymmetric division was postulated to be more efficient in receiving T cell help, both at the B–T cell border and in the GC, which may affect cell fate (3). In the same issue, it was argued and shown by computational modeling that asymmetric division may largely affect the production of PCs (4). Later, a more comprehensive computational model of the GC reaction predicted that asymmetric division of Ag might codetermine B-cell fate, since inclusion of this mechanism resulted in GC transzone migration rates and DZ-to-LZ ratio in agreement with experimental data (5, 6). In addition to asymmetric Ag division, in vitro studies have shown that other B-cell fate-altering molecules, such as transcriptional regulator B-cell lymphoma 6 (BCL6) and the receptor for interleukin-21 (IL-21R), segregate asymmetrically in approximately 44% of mitotic GC B cells (7). In contrast, IRF4 was mostly symmetrically distributed (11% asymmetry comparable to tubulin). The same study suggested that CD40 signaling facilitates TF asymmetry by providing polarity cues to B cells. However, other polarity cues [e.g., cell–cell contacts (8)], TFs [e.g., BLIMP1 transcription (9)], and signaling pathways [e.g., nuclear factor kappa B (Nf-kB)] may drive asymmetric division and/or B-cell fate.
Regardless of the mechanism, asymmetric division has been shown to result in daughter cells with unequal amounts of Ag and/or TF. The amount of segregation seems to vary for different TFs, and this might be dependent on polarity cues, signaling pathways and strength, and/or stochastic events. We hypothesized that (the level of) Ag and TF (BCL6, IRF4, BLIMP1) segregation affects GC dynamics and B-cell fate in different ways or to different extents. To test this hypothesis, we implemented a multiscale model (MSM) that combines a core gene regulatory network for B cell of PC differentiation with a model describing the cellular interactions and dynamics in the GC.
Our simulations show that BLIMP1-driven PC differentiation coupled to asymmetric division of Ag and BLIMP1 with a large segregation between the daughter cells results in a GC transzone migration and a temporal switch from MBCs to PCs that are both observed in experiments (6, 10). Consequently, these computational results prompt for more direct experiments aimed to verify or falsify this mechanism for PC differentiation.
Methods
Multiscale Model
To enable the investigation of cellular and molecular mechanisms involved in PC differentiation, we recently developed a multiscale model (MSM) (11) that integrates an agent-based model (ABM) of the GC reaction (5) with a gene regulatory network (GRN) involved in PC differentiation (12). We slightly modified this model to investigate the effect of asymmetric Ag and TF division. In brief, the ABM contains the main processes that take place in the GC reaction, which lasts for 21 days (504 h). B cells at the centroblast (CB) state divide in the DZ while accumulating SHMs in their BcR. They then differentiate to CCs and migrate to the LZ where they may encounter FDCs and Tfh cells. FDCs carry Ag in their membrane, which is internalized by CCs when in contact with an affinity-dependent rate. This provides CCs with survival signals that temporarily rescue them from apoptosis and allow them to undergo further encounter(s) with Tfh cells. CCs with higher internalized Ag, thus higher affinity for the Ag, will outcompete other CCs with less internalized Ag. CCs are then fully rescued from apoptosis and recycle back to the DZ as CBs. Recycled CBs further divide asymmetrically in 72% of the cases where all of the internalized Ag goes to one of the daughter cells. The GRN of PC differentiation comprises three TFs (BLIMP1, BCL6, and IRF4) that regulate each other and are affected by upstream BcR and CD40 signals. BCL6 is involved in maintaining GC B-cell phenotype, while IRF4 and BLIMP1 promote PC differentiation and exit from the GC. Initial TF concentration in founder CBs were based on microarray data (12) and defined as follows (BLIMP1 = 0, BCL6 = 5, and IRF4 = 0) to achieve the high BCL6 and low BLIMP1 and IRF4 steady state. CCs receive signals through BcR and CD40 respectively when in contact with FDCs or Tfh cells. In the model, BcR signal strength is assumed to be constant, while CD40 signal strength depends on affinity, which can range between 0 and 1, and determines the B-cell fate. The GRN is a bistable system with one state (BCL6 high, BLIMP1/IRF4 low) being the intracellular state of CBs, CCs, and MBCs and a second state (BLIMP1/IRF4 high, BCL6 low) representing the intracellular state of PCs. After dividing, recycled CBs that inherited all of the internalized Ag, and/or are in BLIMP1 high state, differentiate to OCs, either MBCs or PCs, while the remaining CBs differentiate to CCs and stay in the GC. Ag in the CCs is removed, giving no advantage in further rounds of selection.
Definition of Output Cells and Memory Versus PC Differentiation Fate
Table 1 shows the cell type definition based on Ag status and BLIMP1 level. Recycled CBs that finish dividing may differentiate to PCs at any time of the GC reaction (Figure 1) when BLIMP1 reaches the differentiation threshold (≥8.10−8M) and become BLIMP1+ irrespective of its Ag status, and, consequently, PCs may either be Ag+ or Ag−. BLIMP1+ cells that are not (yet) OCs are annotated as PB (Ag+ or Ag−). Ag+/BLIMP1− OCs are considered to be MBCs. This definition correctly recapitulates the MBC dynamics as described in Weisel and coworkers (10). Finally, Ag-/BLIMP1− CBs stay in the GC and recycle back to the LZ as CCs.

Table 1 Definition of OCs (PCs and MBCs) in terms of Ag status and BLIMP1 level.
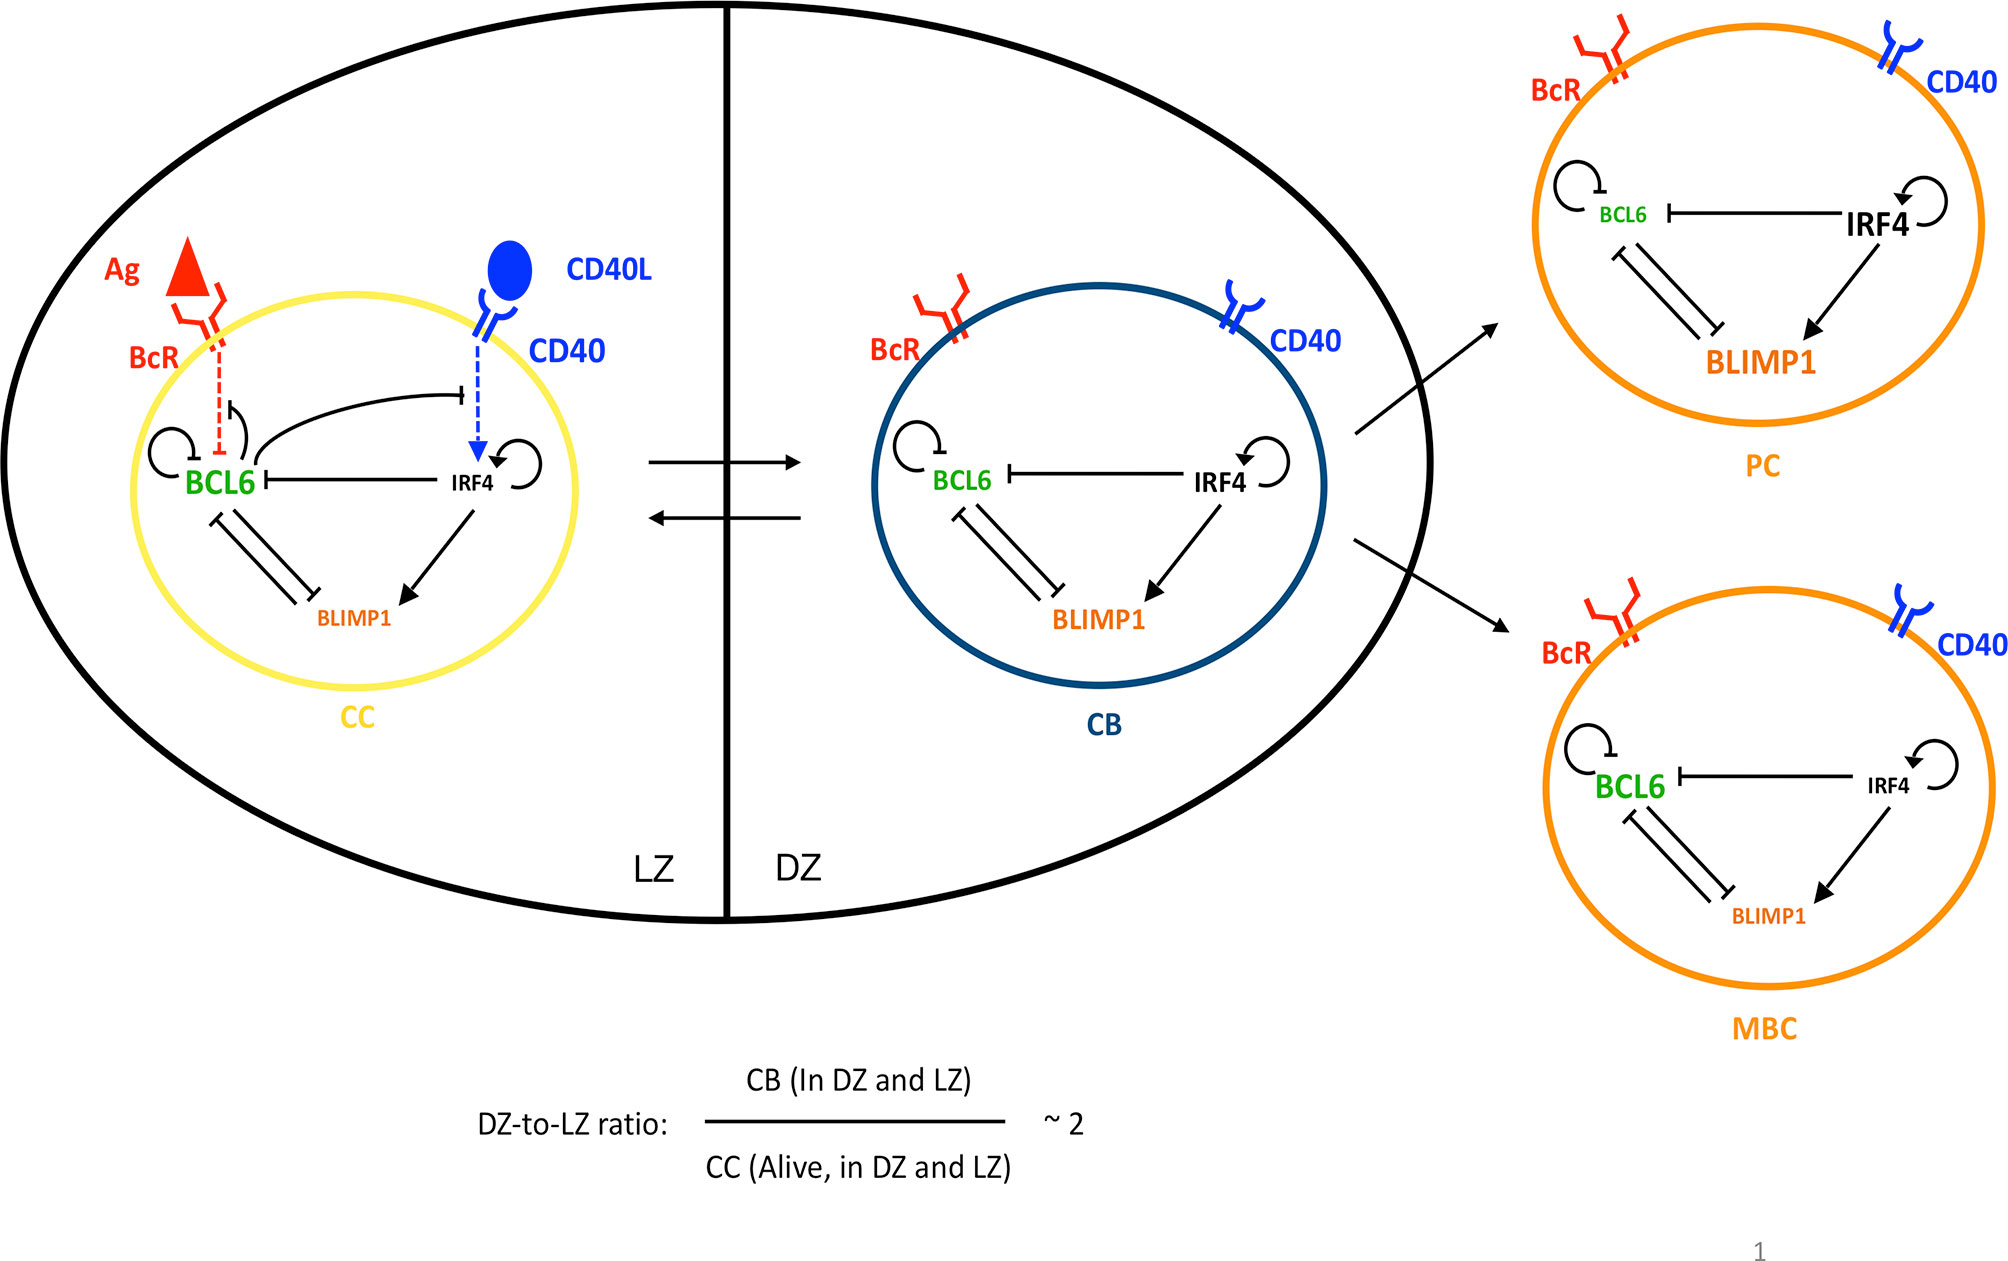
Figure 1 Four GC B cells representing the PC differentiation process: CC (yellow), CB (blue), PC (orange), and MBC (orange). CBs are mainly present in the DZ and CCs in the LZ, while PCs and MBCs are mainly generated in the DZ and then exit the GC. Transition between CBs and CCs is reversible, while the transition between CBs and PCs or MBCs is irreversible. The DZ-to-LZ ratio is the ratio of CBs to non-apoptotic CCs present in both zones and fluctuates around 2. An intracellular GRN comprising three TFs is embedded in each B cell: BCL6 (green), IRF4 (black), and BLIMP1 (orange). The size of each TF represents the expression levels in the cell state. The CC BcR may bind to Ag (red) or the CD40L (blue) when receiving T-cell help, resulting in BcR and CD40 signaling, respectively, which changes the state of the network. Arrows between cells represent transition. Arrows between TFs, BcR, and/or CD40 indicate activation. Bar-headed lines denote inhibition.
Modeling of Asymmetric Division
In the current model, we do not distinguish between different mechanisms that lead to asymmetry but only assume that Ag and TFs (BCL6, IRF4, BLIMP1) can be unequally distributed between the two daughter cells. Asymmetric division is parameterized by a probability (P) of asymmetric division and a polarity level (L) representing the extent of asymmetry. Following experimental observations from Thaunat and coworkers, we set the probability for asymmetric division of Ag to either PAg = 0.0 or PAg = 0.72 (3). The same study showed that Ag division can happened both symmetrically and asymmetrically, which is why we did not further investigate asymmetric Ag probabilities of 100%. Consequently, in 0% or 72% of the cell divisions, the Ag is distributed asymmetrically over the daughter cells. The probability of asymmetric division for TFs is unknown, and, therefore, we used three different probabilities: PTF = 0.0, PTF = 0.72, or PTF = 1.0. Consequently, in 0%, 72%, or 100% of the cell divisions, the TFs are distributed asymmetrically over the daughter cells. In the current model, when the Ag and TFs are asymmetrically distributed in the same division, high Ag and TF polarity levels are directed towards the same daughter cell. Nevertheless, in this study, we are interested in simulating the effect of simultaneous asymmetric division of Ag and TFs.
The polarity level (LAg and LTF) of asymmetry represents the concentration of Ag and TFs in one daughter cell expressed as the fraction of Ag and TFs in the parent cell; the second daughter cell, by definition, assumes a concentration of 1-polarity. Consequently, a polarity level of L = 0.5 represents symmetric division (the concentration of Ag and TFs in each daughter cell is 50% of the parent cell). An asymmetric division probability P = 0.0, by definition, corresponds to a polarity level (L = 0.5). A polarity level of L = 1.0 results in one daughter cell that has taken all Ag and/or TFs from the parent cell, while the other daughter cell will receive none. In the simulations, the TFs may segregate with a different polarity levels (LBLIMP1, LBCL6, LIRF4).
Simulations
We performed two sets of GC simulations. In the first set of nine simulations (Table 2), the TFs cosegregate with equal polarity levels, while in the second set of 27 simulations (Table 3), the TFs may cosegregate with different polarity levels. Simulation 3 from the first set (Table 2) is considered the reference simulation in which there is asymmetric division of Ag (PAg) but always symmetric division of TFs. We consider this simulation as the reference since in the original LEDA model, no TFs were modeled, while asymmetric Ag division showed to result in a correct DZ-to-LZ ratio. The DZ-to-LZ ratio was calculated as the ratio of CBs to non-apoptotic CCs present in both zones (Figure 1). Since Simulations 1–3 from the second set of 27 simulations (Table 3) were the only cases to show differences in the MBC and PC dynamics, we repeated these simulations 15 times with different random seeds. Supplementary Figures 1–3 show the results from these repetitions and demonstrate that there is a limited variability in the temporal dynamics. Therefore, we did not repeat the other simulations, since these are expected to give a similar amount of variation.
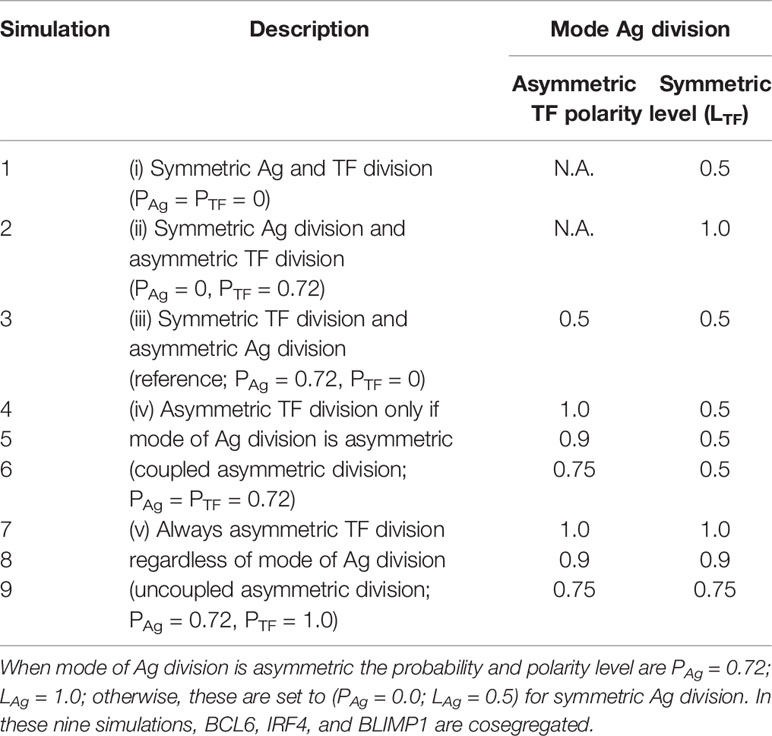
Table 2 Simulated asymmetry of TF concentrations (polarity level LTF) in daughter cells after division.
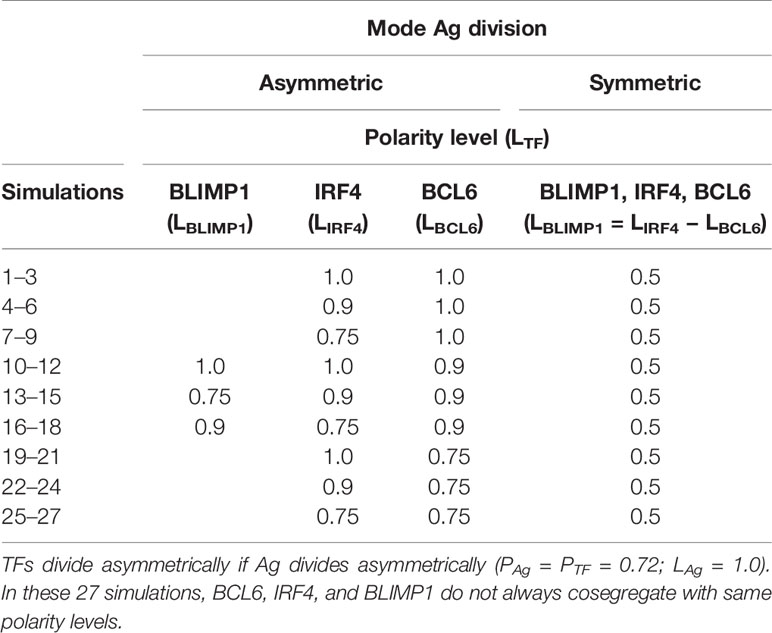
Table 3 Simulated asymmetry of TFs concentrations (PTF = 0.72; polarity levels LBLIMP1, LIRF4, and LBCL6) in daughter cells after asymmetric division.
In the first set of simulations, we studied different combinations of Ag and TF (a)symmetric division (Table 2). In these simulations, the TFs are cosegregated over the daughter cells according to the polarity levels (LTF) shown in Table 2. The polarity level for the asymmetric Ag division is always LAg = 1.0. These nine simulations represent five scenarios: (i) TFs and Ag divide symmetrically (PTF = PAg = 0.0); (ii) TFs divide asymmetrically with probability PTF = 0.72, while Ag always divides symmetrically (PAg = 0.0; Figure 2A); (iii) TFs divide symmetrically (PTF = 0.0), while Ag can divide asymmetrically (PAg = 0.72; reference); (iv) TFs divide asymmetrically (PTF = 0.72) only when Ag divides asymmetric (PAg = 1.0; Figure 2B); and (5) TFs always divide asymmetrically (PTF = 1.0), while Ag divides asymmetrically with probability PAg = 0.72 (Figure 2C).
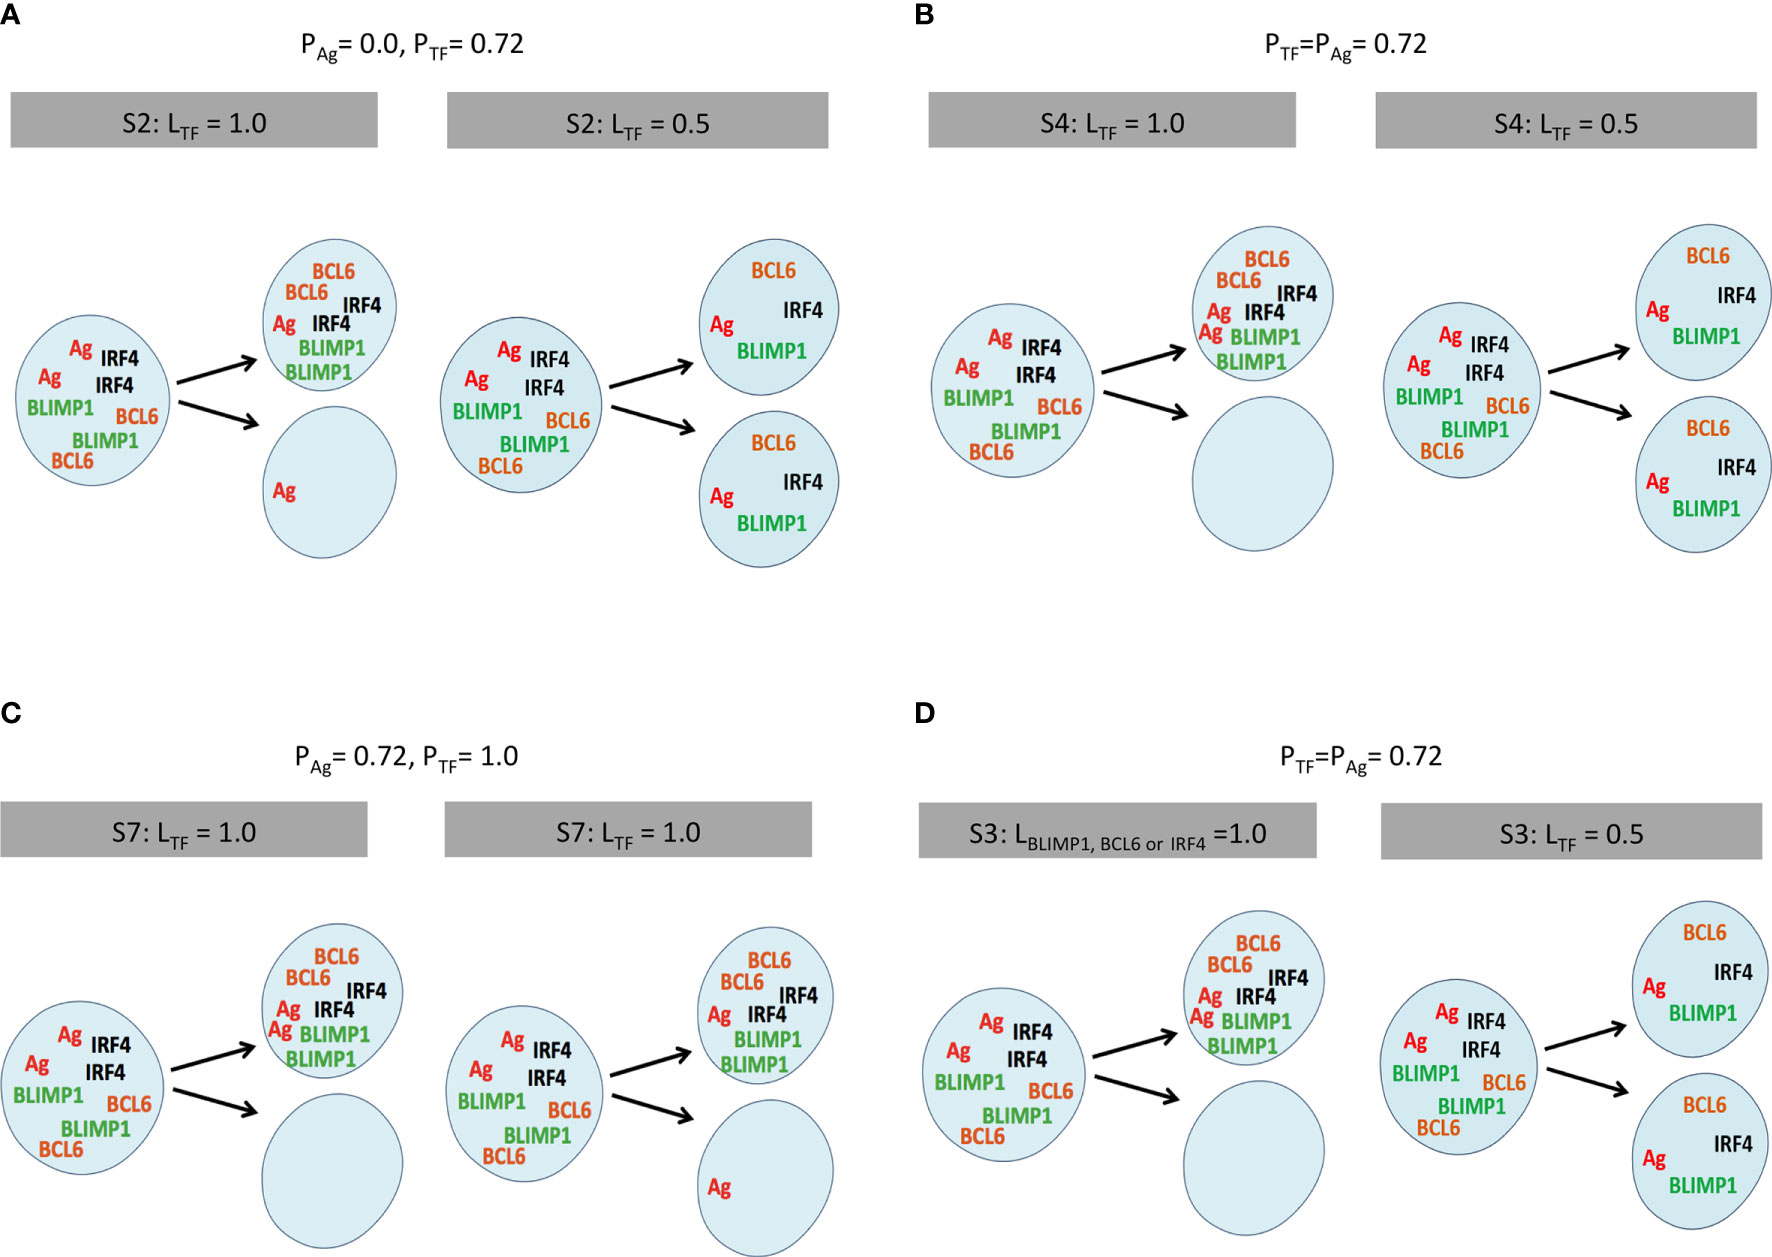
Figure 2 Scheme of internalized Ag and TF division patterns modeled in a selection of simulations (Tables 2, 3). (A) Simulation 2, symmetric Ag and asymmetric TF distribution (LTF = 1.0). (B) Simulation 4, coupled asymmetric division (LTF = 1.0). (C) Simulation 7, uncoupled asymmetric division (LTF = 1.0), and (D) simulation 3, partial asymmetric co-segregation of TFs and Ag (PTF = PAg = 0.72; LAg = 1.0) while varying the level of BLIMP1 (LBLIMP1 = 1.0). Internalized Ag (red) and TF (orange, green, black) are shown in the parent and two daughter cells. The probability and polarity levels are shown in the gray box.
In the second set of 27 simulations, the Ag is distributed asymmetrically in 72% of the recycled B-cell divisions (PAg = 0.72, LAg = 1.0; Table 3), since it was previously shown that this results in transzone migration rates in better agreement with experimental data (5). In these simulations, the TFs cosegregate with the Ag, since they only divide asymmetrically when the Ag divides asymmetrically (PAg = PTF = 0.72). Moreover, TFs segregate with different polarity levels (LBLIMP1, LBCL6, LIRF4) as shown in Figure 2D.
Simulation of Gene Regulatory Network
To facilitate the interpretation of the MSM, we additionally performed a set of GRN simulations to model TF dynamics. For these simulations, initial TF concentration of the mother cell was conceptually chosen to simulate an extreme condition of our MSM in which a mother PB, at the low BCL6 and high BLIMP1 and IRF4 steady state, underwent the last division before becoming a PC and exiting the GC. Subsequently, asymmetric division of the parent PB was simulated with the different combinations of LTFs for the first set of simulations (Table 2). For the second set of simulations, we investigated representative LBLIMP1, LBCL6, and LIRF4 combinations (i.e., simulations 1–4, 7, 10, 19; Table 3). At the start of the simulation, we defined the concentrations of BLIMP1, BCL6, and IRF4 according to the polarity levels and, subsequently, simulate until a steady state was reached. This allowed us to determine if despite the concentration reduction, BLIMP1 concentration returned to its high level steady state (PC phenotype). Since we were simulating TF dynamics of CBs that do not interact with Ag presented by FDCs nor with Tfh cells, we set the CD40 and BcR signals to 0.
Results
Symmetric TF and Ag Division
We first aimed to gain insight in the contribution of asymmetric division on GC dynamics and OCs. Therefore, we simulated the GC reaction without asymmetric Ag and TFs division (PTF = PAg = 0.0, LTF = LAg = 0.5; simulation 1, Table 2).
We found a DZ-to-LZ ratio that initially fluctuated between 5 and 15 and then increased to values up to 800 or the ratio became infinite due to low or zero CC counts, respectively (Figure 3A), strongly contradicting experimentally observed DZ-to-LZ ratio of 2. This is explained by a lack of recycled CBs without retained Ag, which led to no differentiation to CC state and a premature termination of the GC reaction. Thus, the number of accumulated OCs reached 1,417 cells at the end of the GC reaction (Table 4 and Figure 3B). No MBCs were produced (Figure 4A), and all OCs were PCs (Figure 4B) due to the lack of Ag+ cells. Furthermore, 87% of PCs were generated within the first 6 days of the GC reaction, which contradicts a temporal switch from MBCs to PCs (Supplementary Figure 3).
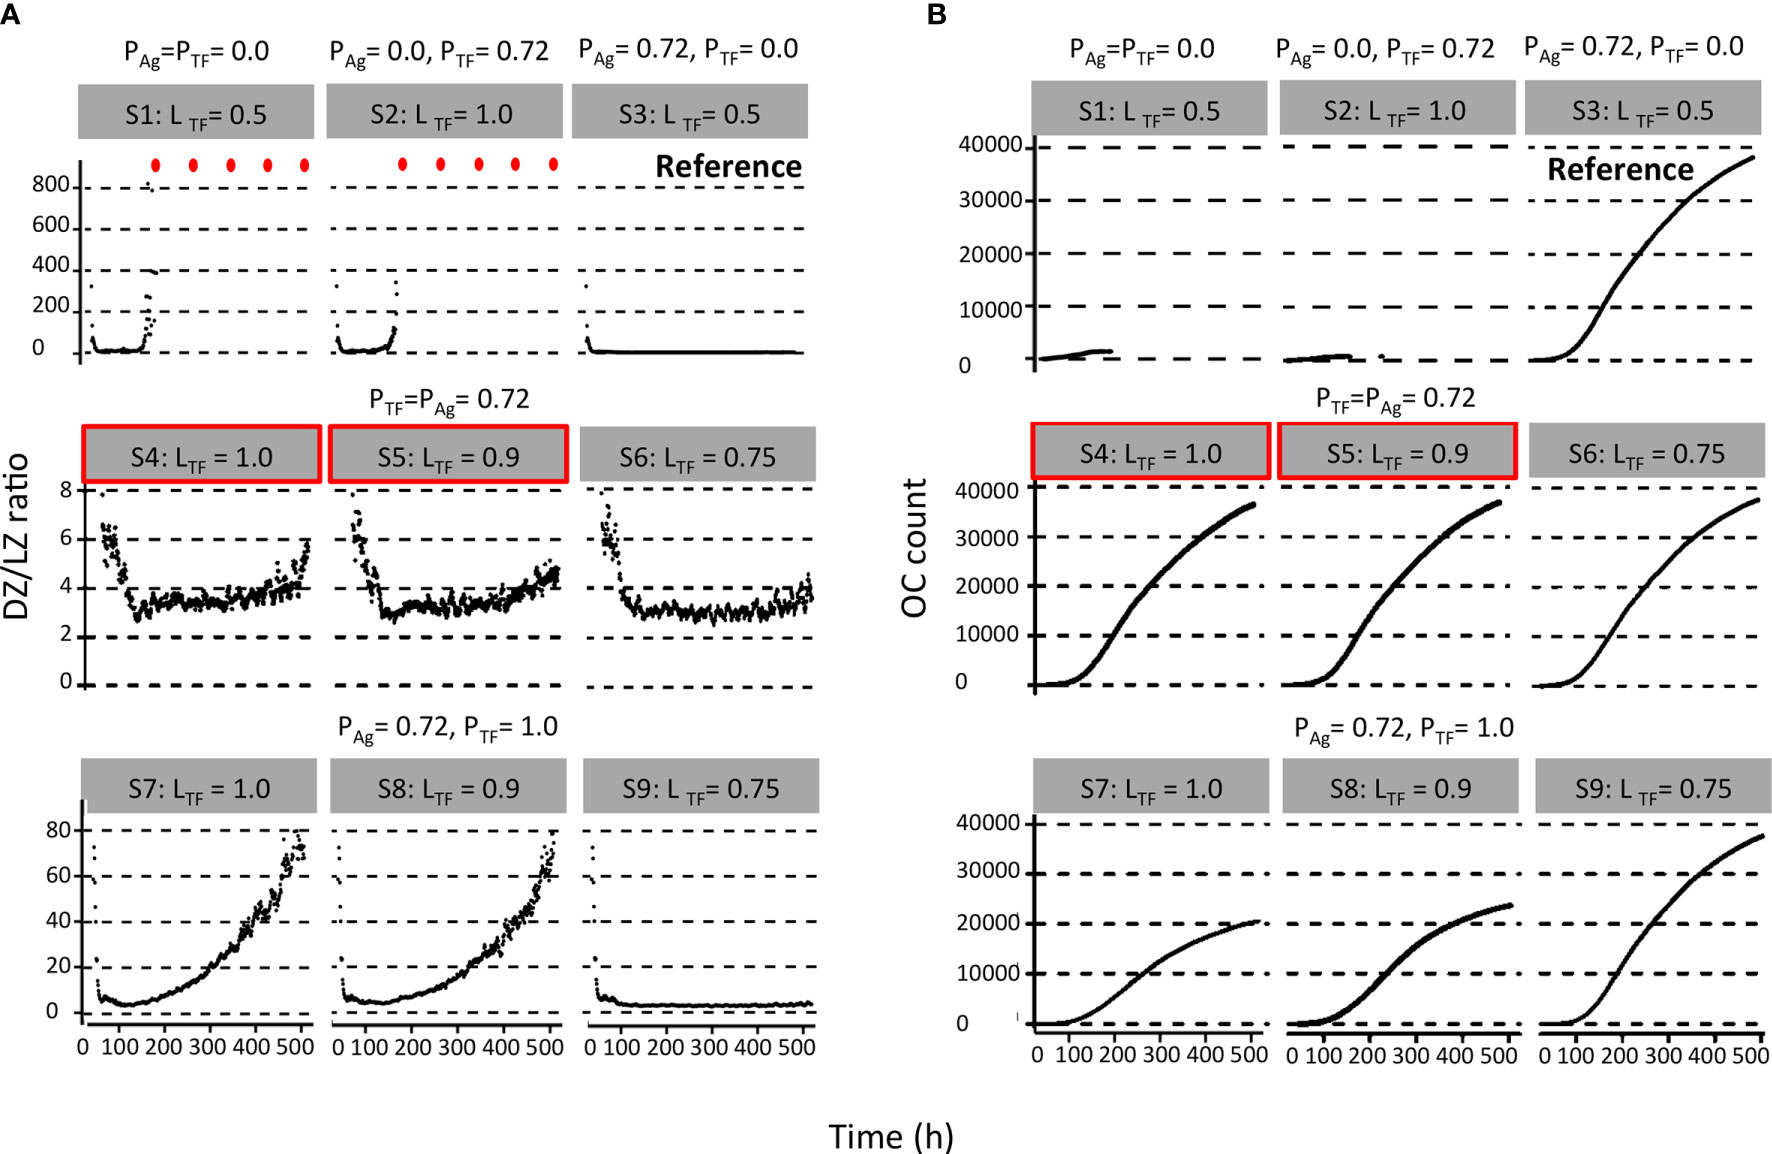
Figure 3 Results from first set of simulations (Table 2). (A) DZ-to-LZ ratio and (B) accumulated OCs during the GC reaction. The probability of asymmetric division (P) is indicated above the gray box, and simulation number and polarity levels (L) are shown in the gray box. Red dots indicate DZ-to-LZ ratio values of infinity. First row of plots corresponds to (left column) symmetric division of Ag and TFs, (middle column) symmetric division of Ag and asymmetric division of TFs, and (right column) symmetric division of TFs and asymmetric division of Ag. Second row of plots corresponds to asymmetric TF division only if mode of Ag division is asymmetric. Red boxes indicate parameters that are closer to biological results. Third row of plots corresponds to always asymmetric TF division regardless of mode of Ag division.
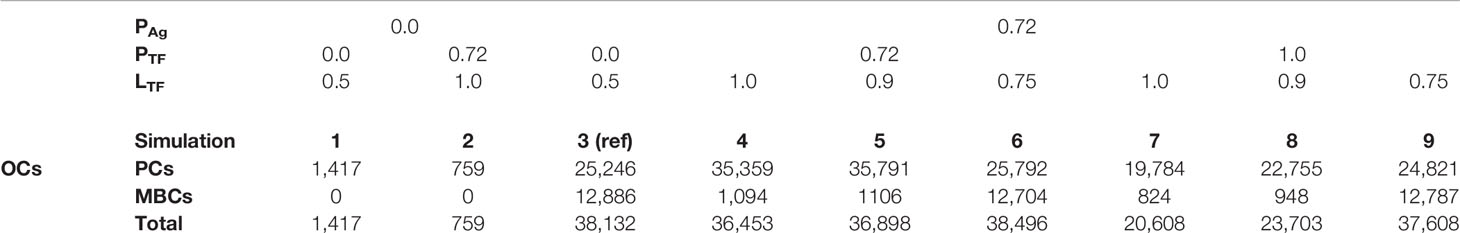
Table 4 Number of OCs at day 21 originating from the first set of simulations (Table 2).
Figure 4 Results from first set of simulations (Table 2). (A) Relative MBC and (B) PC count during the GC. The probability of asymmetric division (P) is indicated above the gray box and simulation number and polarity levels (L) are shown in the gray box. First row of plots corresponds to (left column) symmetric division of Ag and TFs, (middle column) symmetric division of Ag and asymmetric division of TFs, and (right column) symmetric division of TFs and asymmetric division of Ag. Second row of plots corresponds to asymmetric TF division only if mode of Ag division is asymmetric. Red boxes indicate parameters that are closer to biological results. Third row of plots corresponds to always asymmetric TF division regardless of mode of Ag division.
Asymmetric TF Division and Symmetric Ag Division
Next, we aimed to establish the effect of asymmetric TF division while keeping symmetric Ag division (simulation 2, Table 2; PAg = 0.0, PTF = 0.72, LAg = 0.5, LTF = 1.0). Again, we find that the DZ-to-LZ ratio initially fluctuated between 5 and 15 and then increased until 400 or was infinite since no CCs were produced (Figure 3A) strongly contradicting experimentally observed DZ-to-LZ ratio of 2. In addition, the number of accumulated OCs reached 759 cells at the end of the GC reaction, none of them being MBCs (Table 4; Figures 3B, 4) Furthermore, 92% of PCs were generated within the first 6 days of the GC reaction (Supplementary Figure 3) again contradicting a temporal switch. Finally, asymmetric TF division led to approximately a twofold decrease in PC production compared to symmetric TF division (simulation 1) as shown in Table 4. This could be explained by analyzing the TF dynamics in isolation (Figure 5). Extreme TF polarity levels promoted the production of a daughter B cell in the low BLIMP1 state and another one in the high BLIMP1 state, yet symmetric TF polarities promoted the production of both daughter B cells in the high BLIMP1 state. We conclude that asymmetric division of TF only does not result in expected GC dynamics while also the number of OCs remains 50-fold lower than in the reference simulation.
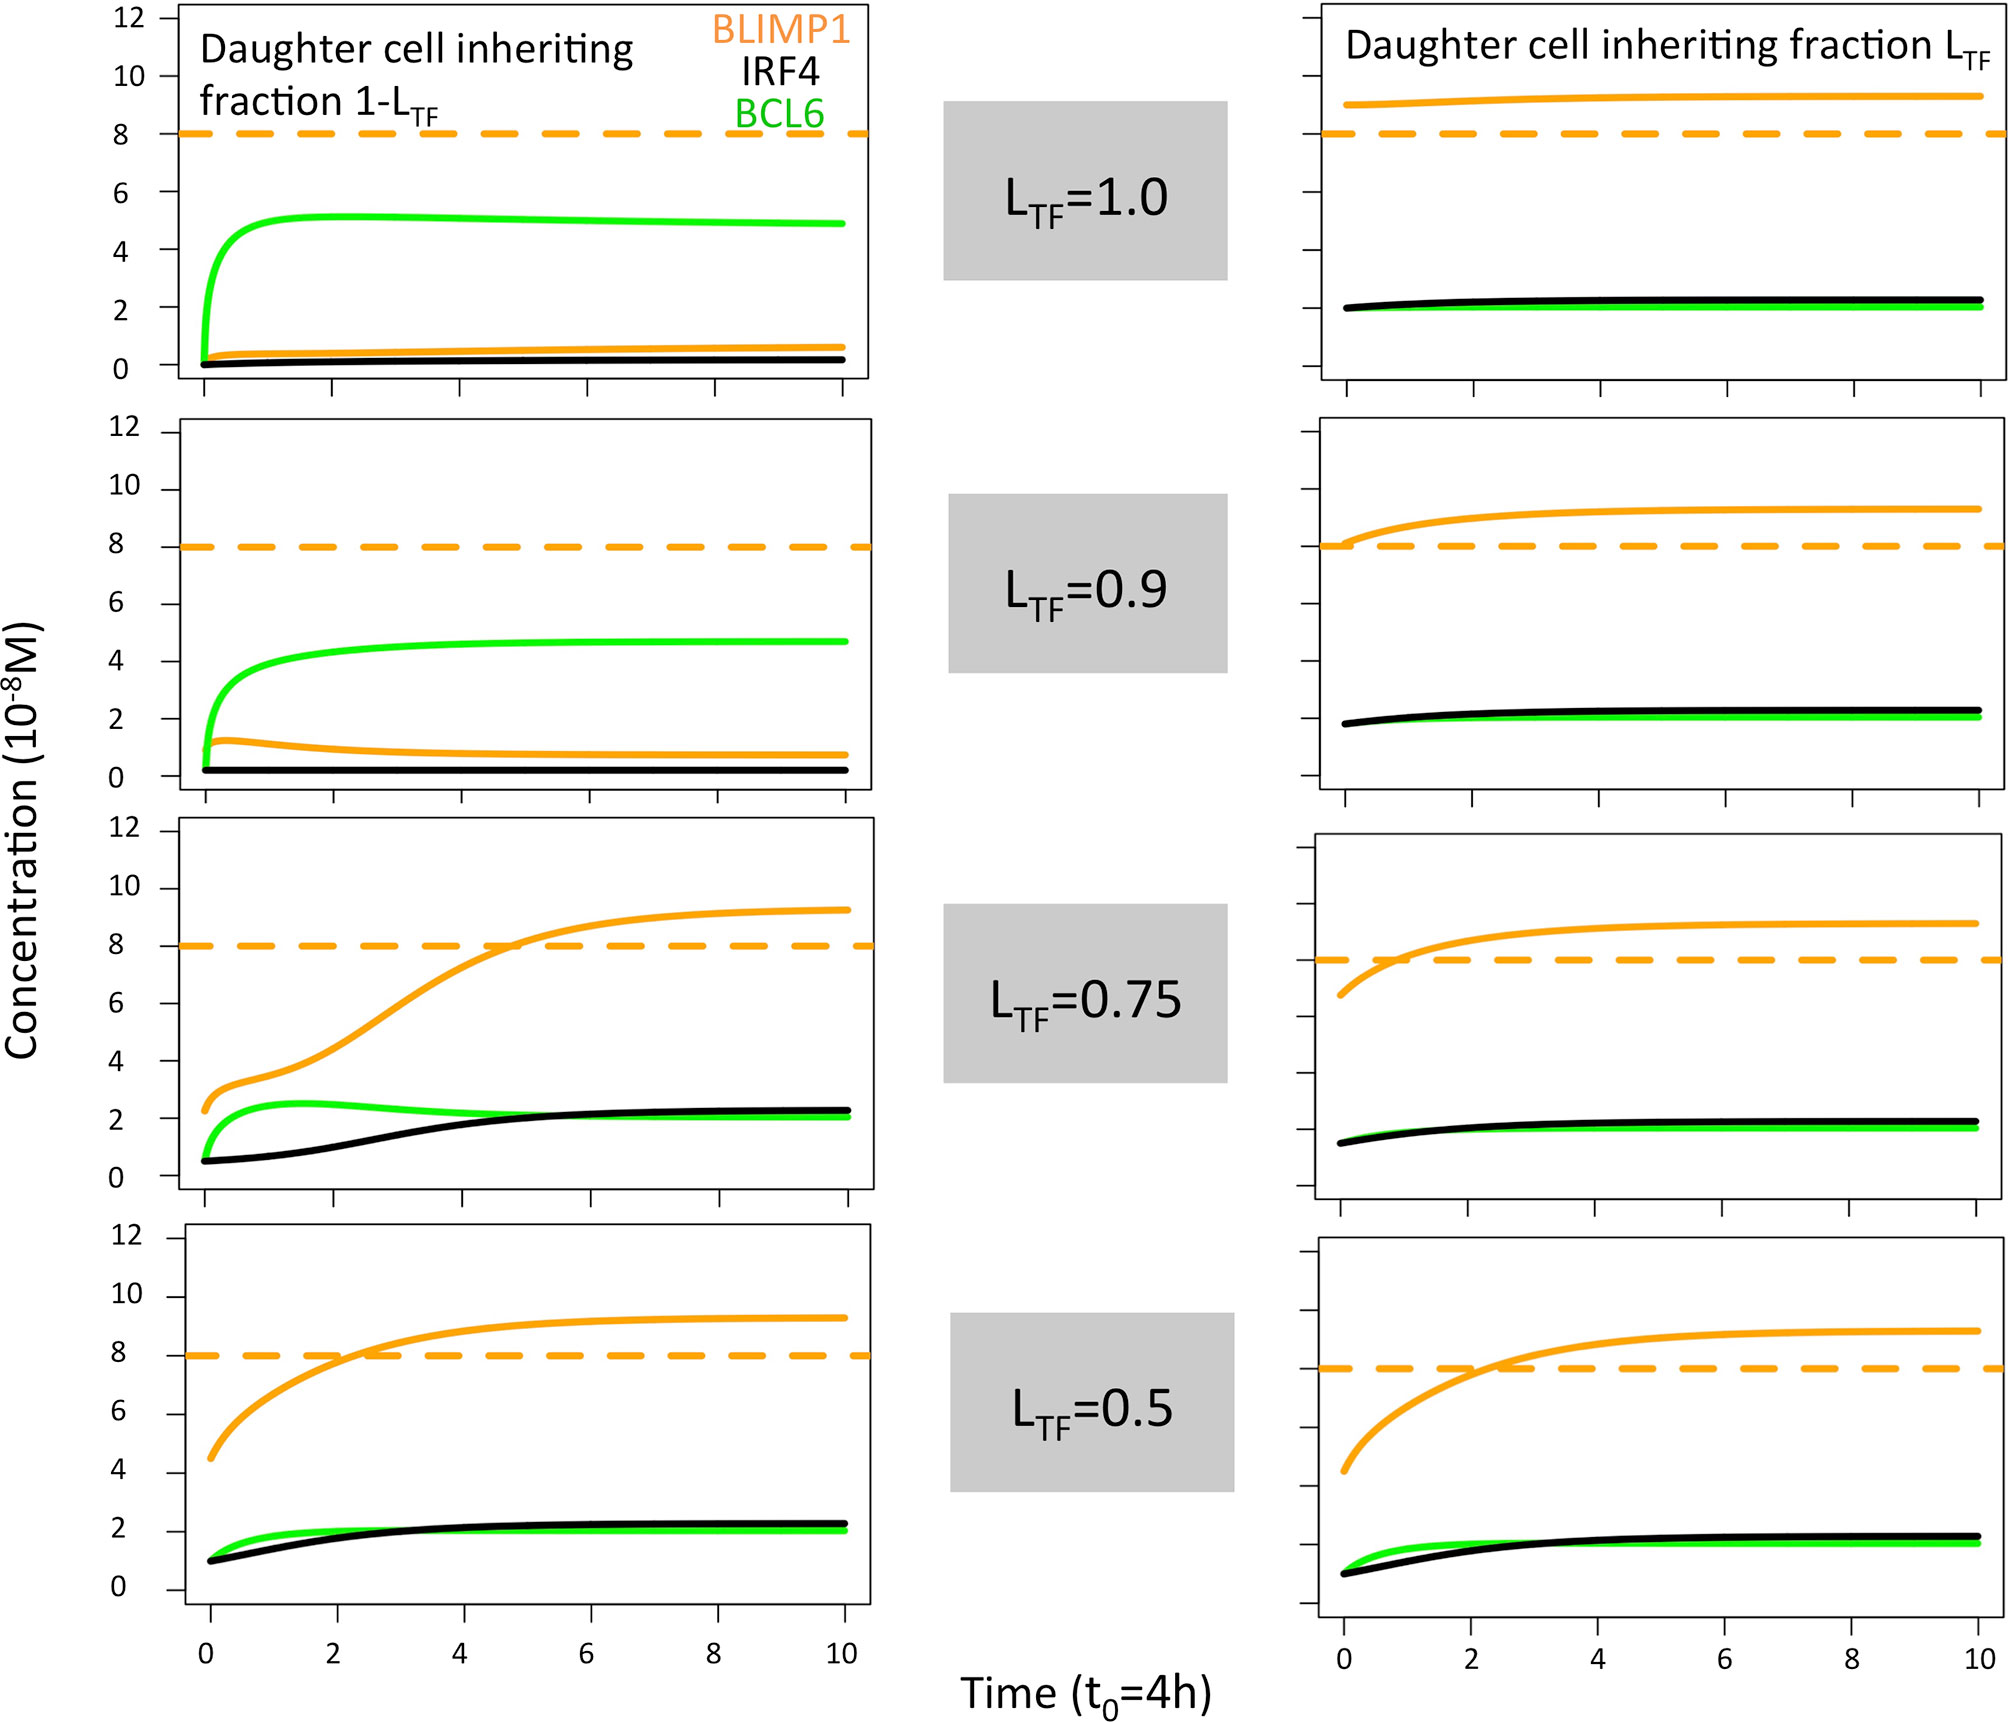
Figure 5 Solution curves based on the GRN (ODE model) for BLIMP1 (orange), BCL6 (green), and IRF4 (black) in two daughter cells. The initial TF concentrations were based on the concentration of the parent cell (BLIMP1 = 8, BCL6 = 2, IRF4 = 2) and the different polarity levels (LTF = 1.0, LTF = 0.9, LTF = 0.75, and LTF = 0.5; Table 2).
Symmetric TFs Division and Asymmetric Ag Division (Reference)
We questioned whether or not symmetric cosegregation of TFs with asymmetric Ag division had an effect on GC B-cell dynamics (PTF = 0.0, LTF = 0.5, PAg = 0.72, LAg = 1.0; simulation 3, Table 2). We found the DZ-to-LZ ratio fluctuating between 2 and 4 (Figure 3A). This was a maximum of 2-fold increase in DZ-to-LZ ratio compared to previous observations of 2 (6) and similar to the affinity-based CD40 signaling simulation (Scenario 2) discussed in (11). The number of accumulated OCs reached 38,132 cells at the end of the GC reaction (Table 4 and Figure 3B) of which 12,886 were MBCs (Figure 4A) and 25,246 were PCs (Figure 4B). Furthermore, MBCs were generated throughout the GC reaction, and 90% of PCs were generated after the peak (day 6) of the GC reaction (Supplementary Figure 3). We conclude that asymmetric Ag division is largely responsible for obtaining a DZ-to-LZ ratio close to experimental observations. Asymmetric TF division is not required. Asymmetric Ag division also re-establishes a larger number of OCs, but no temporal switch is observed.
Asymmetric TF Division Only if Mode of Ag Division Is Asymmetric (Coupled Asymmetric Division)
Next, we investigated a scenario (simulations 4–6, Table 2; PAg = PTF = 0.72) that assumes that asymmetric TF and Ag division always happen simultaneously. Since we are mostly interested in the effect of the TFs, we assumed that in the case of asymmetric division, all Ag goes to a single daughter cell (LAg = 1.0) while we used different polarization levels for the TF (LTF = 1.0, 0.9, and 0.75). All three simulations had similar DZ-to-LZ ratios and total number of OCs, which were also similar to the reference simulation (Table 4 and Figures 3A, B). Nevertheless, low TF polarity levels showed approximately a 12-fold increase in MBCs, at the expense of PC output, compared to extreme TF polarity levels. Furthermore, low TF polarity levels showed similar MBC counts compared to the reference simulation (Figure 4). Interestingly, extreme TF polarity levels (LTF = 1.0, 0.9) resulted in a temporal switch from MBCs to PCs, which was not the case for simulations with low TF polarity levels (LTF = 0.75 nor LTF = 0.5 in the reference simulation).
When analyzing the TF dynamics in the GRN, we found, as expected, that extreme TF polarity levels generated a high BLIMP1 state in one of the TF inheriting daughters (0 h, Figure 5) while leaving the other daughter B-cell in a low BLIMP1 state. Contrarily, low TF polarity levels promoted a slower progression to the high BLIMP1 state (4–8 h), which explains the increased number of MBCs (Ag+/BLIMP1−) in simulations 3 and 6. We conclude that simultaneous asymmetric division of Ag and TF results in DZ-to-LZ ratios similar to the reference simulation, but only extreme TF polarity levels resulted in a temporal switch.
Always Asymmetric TF Division Regardless of Mode of Ag Division (Uncoupled Asymmetric Division)
Since there is no a priori reason to suggest that asymmetric Ag and TF division are coupled (simulations 4–6), we performed three additional simulations in which TF always divide asymmetrically (PTF = 1.0, LTF = 1.0, LTF = 0.9, and LTF = 0.75) regardless of the model of Ag division (PAg = 0.72, LAg = 1.0; simulations 7–9, Table 2). We found that for extreme TF polarity levels (LTF = 1.0, 0.9), the DZ-to-LZ ratio progressively increased up to a value of 80, which meant a 40-fold increase compared to the reference simulation (Figure 3A). Contrarily, low TF polarity levels (LTF = 0.75) showed a DZ-to-LZ ratio that fluctuated between 2 and 4 similarly to the reference simulation (Figure 3A). Extreme TF polarity levels showed a 2-fold decrease in OC counts and a 12-fold increase in MBC counts compared to low TF polarity levels and the reference simulation (Table 4 and Figure 3B). In extreme TF polarity levels, there was a 1.2-fold decrease in PC counts compared to low TF polarity levels and a 1.7-fold decrease in PC counts compared to simulations with coupled asymmetric Ag and TFs division (Table 4 and Figure 4). While approximately 90% of PCs were generated after the peak (day 6) of the GC reaction for all TF polarity levels, low TF polarity levels produced MBCs during the entire GC reaction (Supplementary Figure 4). Thus, while low polarity levels resulted in similar DZ-to-LZ ratio and OC production as the reference simulation, it did not result in a temporal switch from MBCs to PCs.
The TF dynamics in the GRN, as described in the previous section (see above, Figure 5), explained the decreased OC count observed in simulations 7 and 8 compared to simulations 4–6 and 9. In addition, it could explain the similarity in OC count observed when comparing simulations 6 and 9.
We concluded that uncoupled Ag and TFs asymmetric division lead to a 40-fold increase in DZ-to-LZ ratios and a reduction in OC production for the extreme TF polarity levels. However, for these extreme polarities, a temporal switch is observed.
Collectively, the first set of simulations show that assuming that the decision for PC differentiation is fully based on BLIMP1 levels and that all TFs cosegregate during asymmetric division, then the simulated DZ-to-LZ ratio is close to those observed experimentally. Furthermore, a temporal switch from MBCs to PCs was only present in simulations with coupled Ag and TFs asymmetric division and extreme TF polarities LTF.
Coupled Ag and TFs Asymmetric Division With Different Polarity Levels for Individual TFs
From the first set of simulations (simulations 1–9, Table 2), we showed that coupled Ag and TFs asymmetric division with extreme TF polarity levels resulted in a DZ-to-LZ ratio that was similar to the reference simulation and a temporal switch. However, in these simulations, we assumed that BCL6, IRF4, and BLIMP1 always distributed in equal amounts (LTF) over the daughter cells. Based on previous research, this is unlikely (7, 8). Therefore, we performed 27 additional simulations (Table 3; PTF = PAg = 0.72 and LAg = 1.0) in which TFs can be distributed in different amounts (LBLIMP1, LIRF4, and LBCL6) to the daughter cells. In these simulations TFs are only asymmetrically distributed in case of asymmetric Ag division. For each simulation, we investigated the GC dynamics and OC production.
All simulations showed a DZ-to-LZ ratio that was similar to the reference simulation (data not shown). Furthermore, the number of OCs at the end of the GC reaction is similar for all 27 simulations (Figure 6A). Figures 6B, C show the number of MBCs and PCs produced for the 27 combinations of TF polarity levels. We observed that neither the polarity level of IRF4 nor BCL6 have a big influence on the number of OCs, MBCs, or PCs. However, there is a clear difference when comparing the extreme (LBLIMP1 = 1.0 and LBLIMP1 = 0.9; LIRF4 = LBCL6 = 1.0) and low (LBLIMP1 = 0.75; LIRF4 = LBCL6 = 1.0) BLIMP1 polarity levels. Low polarity levels resulted in a 12-fold increase in MBC counts and a 1.2-fold decrease in PC counts (Supplementary Figures 5–7).
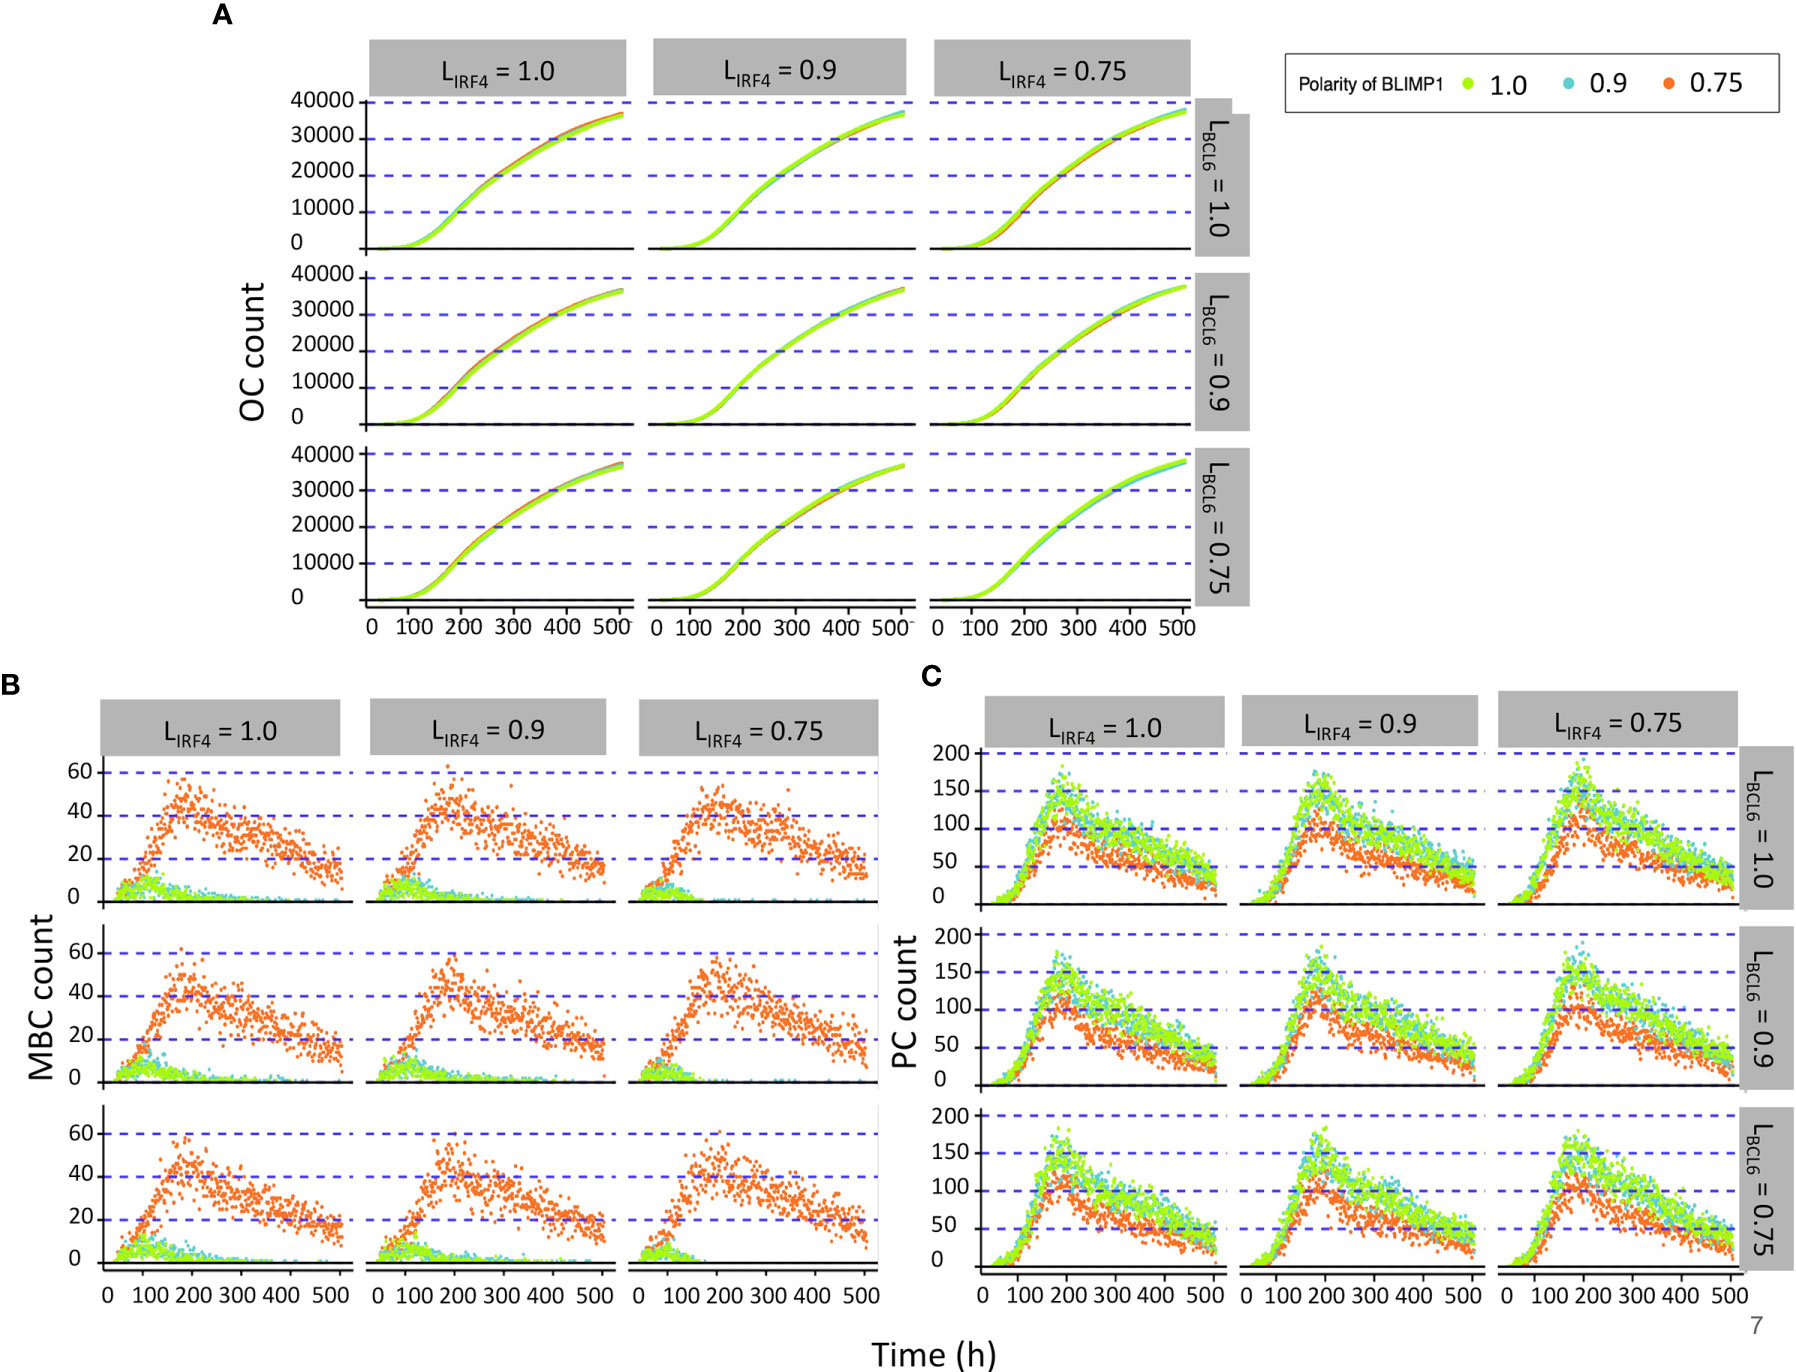
Figure 6 Results from the second set of simulations (Table 3). (A) Accumulated OCs, (B) relative MBC, and (C) PC count during the GC reaction. At the top of each panel column, the IFR4 polarity level is indicated. To the right of each panel row, the BCL6 polarity level is indicated. The colors indicate the different BLIMP1 polarity levels.
When analyzing the TF dynamics in the GRN, we found that extreme IRF4 polarity levels (LIRF4 = 1.0, LIRF4 = 0.9; LBLIMP1 = LBCL6 = 1.0) immediately generated a high BLIMP1 state in one of the TF inheriting daughters while leaving the other daughter B cell in a low BLIMP1 state (Figure 7). Low IRF4 polarity levels (LIRF4 = 0.75; LBLIMP1 = LIRF4 = 1.0) generated both daughter B cells in the high BLIMP1 steady state. Nevertheless, in this situation, the daughter B cell that inherited 25% (1 − LIRF4) of IRF4, along with 0% of BLIMP1 and BCL6 concentration, slowly progressed to the high BLIMP1 state within 20 h until BLIMP1 levels reached the PC differentiation threshold. Considering that after the last division, PBs are defined as PCs and exit the GC, this could explain why no difference in OC dynamics was observed when varying IRF4 polarity levels.
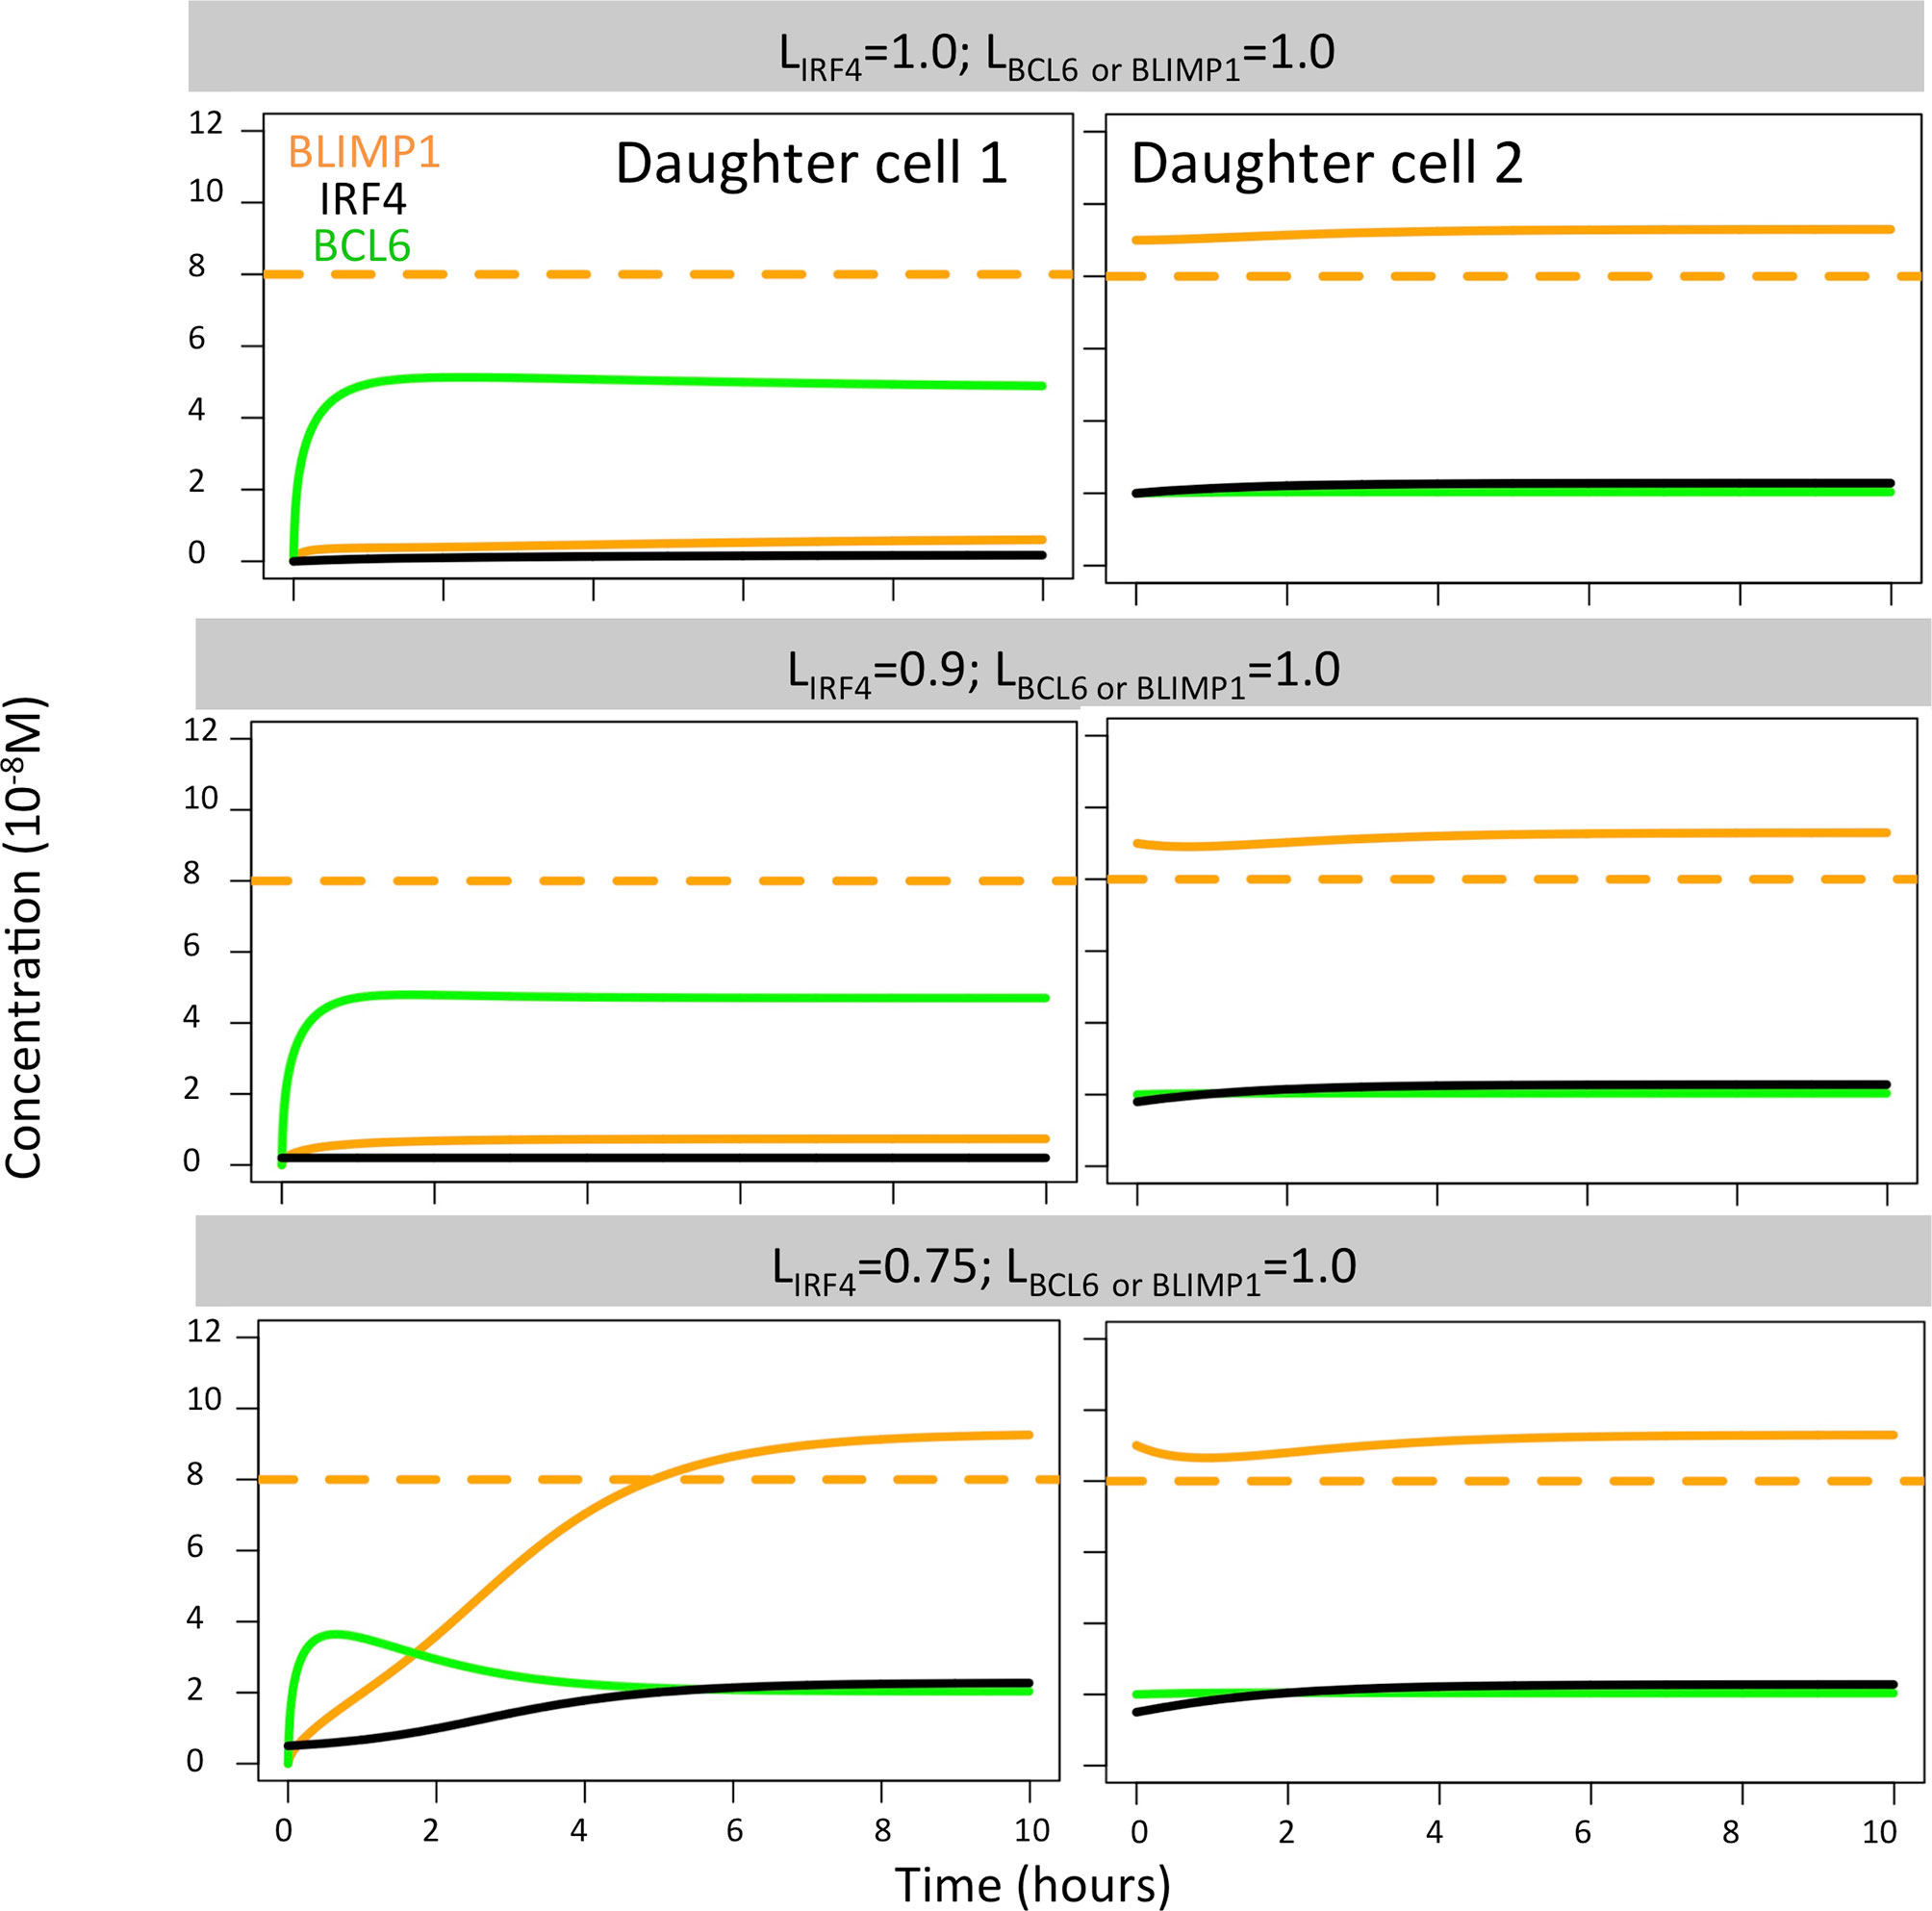
Figure 7 BLIMP1 (orange), BCL6 (green), and IRF4 (black) dynamics in two theoretical daughter B cells. Their initial TF concentrations were set to simulate the asymmetric division of a parent cell (BLIMP1 = 8, BCL6 = 2, IRF4 = 2) with all different combinations of IRF4 levels (LIRF4 = 1.0, LIRF4 = 0.9, and LIRF4 = 0.75, as shown in Table 2). Levels of BCL6 and BLIMP1 were fixed (LBCL6 = LBLIMP1 = 1.0).
In the case of BCL6, we found that all polarity levels (LBCL6 = 1.0, LBCL6 = 0.9, LBCL6 = 0.75; LBLIMP1 = LIRF4 = 1.0) immediately generated a high BLIMP1 state in one of the TF inheriting daughters, leaving the other daughter B cell in a low BLIMP1 state (Figure 8). This is why no difference in OC dynamics was observed when varying BCL6 polarity levels. Such results were not surprising since changes in the BCL6 level as a result of BcR signaling are not sustained in time nor become large enough to switch the BLIMP1 from a high to low level.
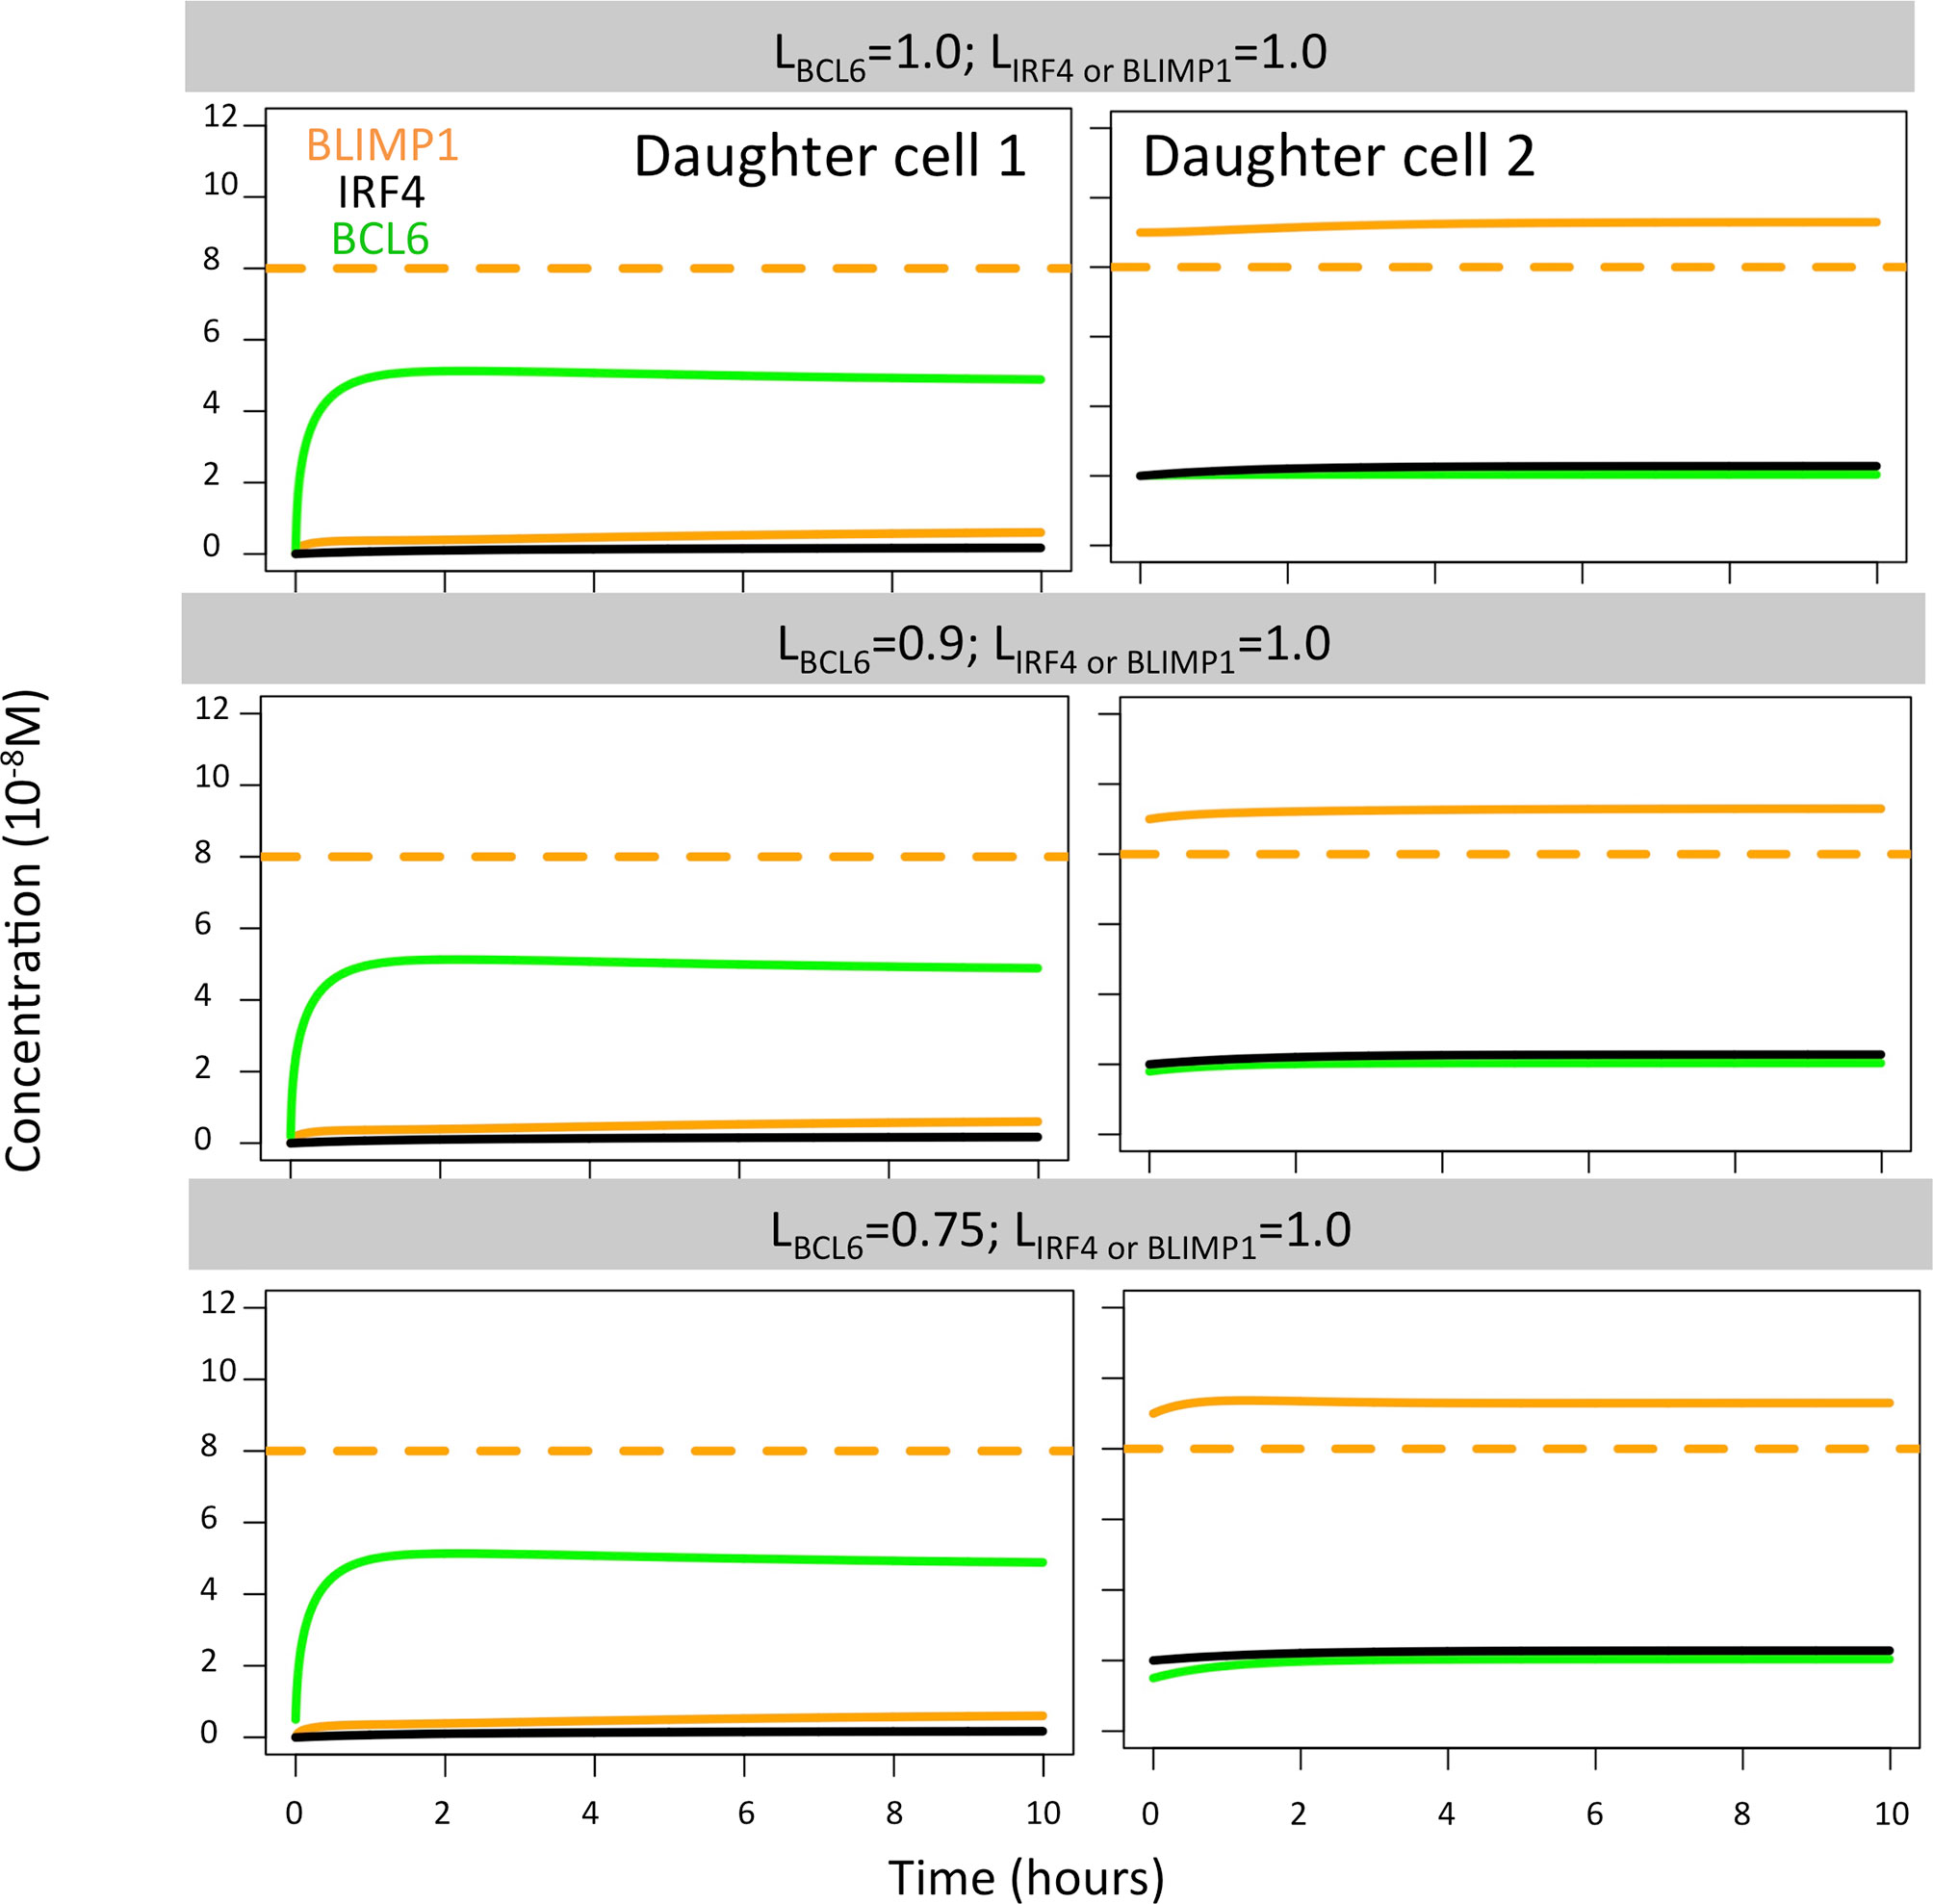
Figure 8 BLIMP1 (orange), BCL6 (green), and IRF4 (black) dynamics in two theoretical daughter B cells. Their initial TF concentrations were set to simulate the asymmetric division of a parent cell (BLIMP1 = 8, BCL6 = 2, IRF4 = 2) with all different combinations of BCL6 levels (LBCL6 = 1.0, LBCL6 = 0.9, and LBCL6 = 0.75, as shown in Table 2). Levels of IRF4 and BLIMP1 were fixed (LIRF4 = LBLIMP1 = 1.0).
Finally, we found extreme BLIMP1 polarity levels (LBLIMP1 = 1, LBLIMP1 = 0.9; LIRF4 = LBCL6 = 1.0) immediately generated a high BLIMP1 steady state in one of the TF inheriting daughters, leaving the other daughter B cell in a low BLIMP1 steady state (Figure 9). Low BLIMP1 polarity levels (LBLIMP1 = 0.75; LBCL6 = LIRF4 = 1.0) introduced a delay (4 h) in the progression of the high BLIMP1 inheriting daughter B cell to the high BLIMP1 state. This could explain the differences observed in OC dynamics when varying BLIMP1 polarity levels.
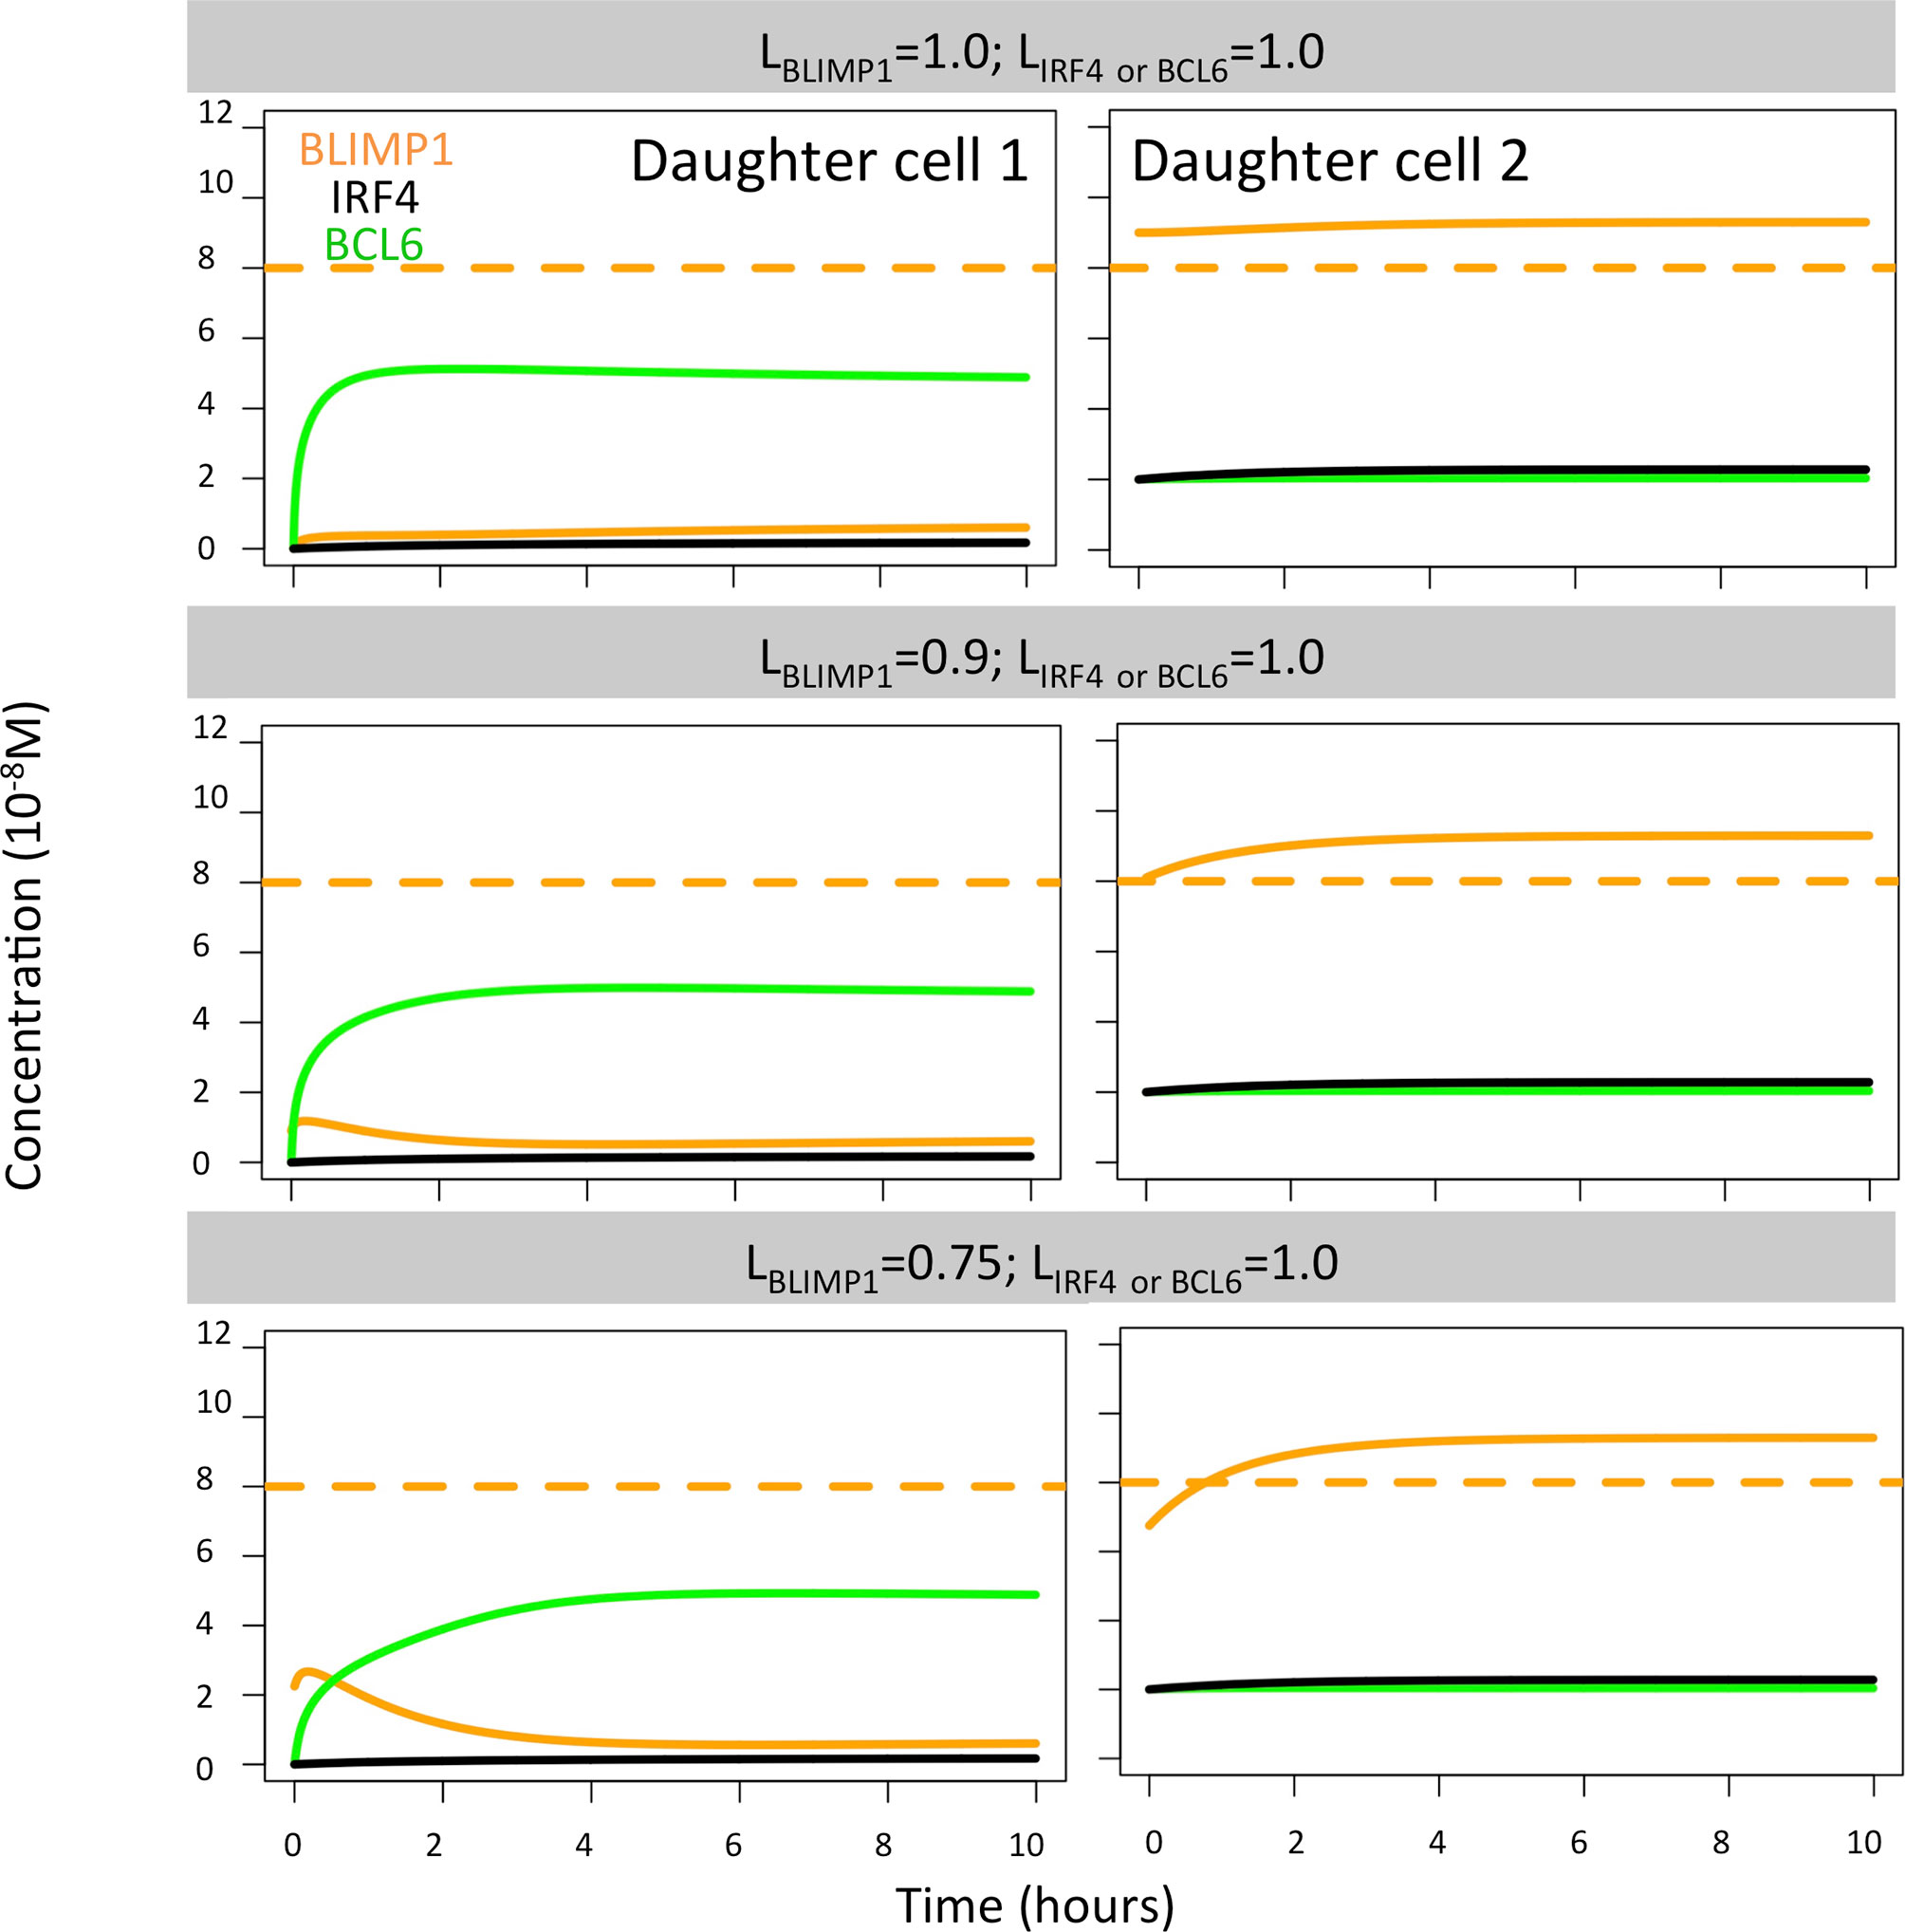
Figure 9 BLIMP1 (orange), BCL6 (green), and IRF4 (black) dynamics in two theoretical daughter B cells. Their initial TF concentrations were set to simulate the asymmetric division of a parent cell (BLIMP1 = 8, BCL6 = 2, IRF4 = 2) with all different combinations of BLIMP1 levels (LBLIMP1 = 1.0, LBLIMP1 = 0.9, and LBLIMP1 = 0.75, as shown in Table 2). Levels of IRF4 and BCL6 were fixed (LIRF4 = LBCL6 = 1.0).
We conclude that the combined results from these 27 simulations and the first set of 9 simulations show that BLIMP1 driven PC differentiation together with coupled asymmetric division of Ag and BLIMP1 with a large segregation between the daughter cells results in a GC DZ-to-LZ ratio and a temporal switch from MBCs to PCs that are both observed in experiments (6, 10) However, future experimental validation of our findings remain necessary.
Discussion
It has been shown experimentally that Ag and TFs can asymmetrically divide and that this may codetermine GC B-cell fate (3, 5, 7, 8). However, so far, this has not been proven experimentally. Based on a computational model of the GC, Meyer-Hermann and colleagues hypothesized that asymmetric division of Ag might play a role in PC differentiation, as this resulted in a DZ-to-LZ ratio in agreement with experimental data (5). However, using our MSM, we recently showed that asymmetric Ag division alone cannot explain PC differentiation, since it is not fully consistent with experimental observations that B cells with increased BLIMP1 levels differentiate to PCs, but we only considered one specific mode of coupled asymmetric division (i.e., PAg = PTF = 0.72, LBLIMP1 = LIRF4 = LBCL6 = 1.0) (11). Therefore, in the current work, we investigated the putative effect of asymmetric division of Ag and TFs in more detail and hypothesized that this affects GC dynamics and B-cell dynamics and fate. From our simulations, we conclude that BLIMP1-driven PC differentiation together with coupled asymmetric division of Ag and BLIMP1 with extreme TF polarity levels for BLIMP1 segregation results in GC DZ-to-LZ ratio and a temporal switch from MBCs to PCs that are also observed in experiments (6, 10). This confirmed our previous finding that asymmetric Ag division alone is not sufficient to drive PC differentiation, but also asymmetric division of at least BLIMP1 is required.
An important insight from our model is the observation that outcomes of simulations with (uncoupled) symmetric division of Ag and/or TF do not agree with experimental observations (migrations rates, temporal switch). It is, however, important to emphasize that this result does not definitely exclude this scenario to be true. Although our GC model is the most sophisticated model currently available and based on a large range of experimental observations, we cannot exclude the possibility that other choices, assumptions, or parameter settings would change our conclusion. Nevertheless, we think that our simulations provide at least some evidence that asymmetric division is involved in PC differentiation. Furthermore, prior studies have shown that unequal stimulation of signaling pathways, e.g., CD40 and PI3K, induced when B cells present Ag to and receive help from TFH cells during the selection process in the GC reaction, can provide polarity cues that drive asymmetry division (7, 8). It was proposed that unequal inheritance of Ag transmembrane receptor, costimulation, and/or cytokine signaling could result in unequal activation of signaling pathways. Although this hypothesis was not experimentally tested, it is in line with our finding.
The observation that IRF4 asymmetric division had no effect of PC production was both interesting and surprising. On the one hand, in vitro data suggest that IRF4, and/or different levels of T help through Cd40/Nf-kB induction of IFR4, regulates MBC and PC differentiation in a concentration-dependent manner (13, 14). Furthermore, quantitative modeling of the terminal B-cell differentiation showed through parameter sensitivity analysis for bistability that kinetic parameters associated to IRF4 dynamics and CD40 induction of IRF4 were critical in promoting B-cell transition towards PC differentiation (12). Nevertheless, the same study showed that above a critical IRF4 concentration threshold (>1.10−8M), CCs irreversibly differentiated to PCs. In our model, asymmetric division takes place at a late stage of B-cell development (PB) in which IRF4 concentration is close to the high IRF4 steady state (2.10−8M). Thus, we found that even with low IRF4 polarity levels, when daughter B cells inherited 75% of IRF4 (LIRF4 = 0.75), this did not decrease IRF4 concentration below the above-mentioned critical IRF4 threshold. This explained why we found no effect of IRF4 asymmetric division on PC differentiation. In addition, in vitro studies in conjoined sibling B cells showed that unequal IRF4 expression could drive branching of B-cell state prior to the loss of PAX5, a MBC promoter, hence at early stages of B-cell transition to PC. Furthermore, the levels of BLIMP1 in sibling B cells were not measured, leaving the open question of whether asymmetric BLIMP1 division could be the driver of PC differentiation and supporting the need to further investigate BLIMP1 asymmetric division at later stages of PC differentiation in the GCs.
Apart from model assumptions, our study has several limitations. First, our findings and conclusions remain to be validated or falsified in future experiments. We propose experiments to generate data about the (1) BLIMP1 probability of asymmetric division and polarity level in single PBs; (2) extent and/or role of the cosegregation of BLIMP1, BCL6 and IRF4; and (3) extent and/or role of (a)symmetric division of CD40 signaling in relation to B-cell fate. Second, the probability (PAg = 0.72) for asymmetric Ag division was based on experimental data (7). For asymmetric TF division, we used this same value in several simulations. However, probabilities of PBCL6 = 0.44 and PIRF4 = 0.11 have been reported (7), while for BLIMP1, such probability is unknown. Nevertheless, we here show that asymmetric division of IRF4 and BCL6 did not have an effect on the fate of the B cell, and thus, we believe that this would not change our main conclusion. Third, no data are available about the number of MBCs and PCs produced during a single GC reaction. Thus, we cannot substantiate which simulations are more realistic in terms of OC production. Fourth, as we have discussed previously (11), the current definition of MBCs as Ag+BLIMP1− cells should be improved, since it definition merely classifies OCs, which are not PCs to be MBCs. Nevertheless, we here showed that symmetric TF division did not agree with the observation of a temporal switch in the GC reaction. This could indicate that asymmetric TF division plays a role in MBC differentiation. Interestingly, PAX5 has been shown to asymmetrically segregate and always oppose asymmetric IRF4 distribution (8). Further experiments need to be carried out to validate this hypothesis since the effect of asymmetric PAX5 division on MBC formation was not addressed.
Data Availability Statement
Publicly available datasets were analyzed in this study. This data can be found here: https://github.com/EDS-Bioinformatics-Laboratory/AsymmetricDivision.
Author Contributions
EM, HH, and AK designed the study. EM, DL, MM-H, and PR implemented the software. JH, EM, DL, and AK carried out the simulations and analyses. All authors were involved in the interpretation of results. JG, HH, and AK supervised the study. All authors contributed to the article and approved the submitted version.
Funding
This work is supported by a CASyM Exchange Research Grant, COSMIC (www.cosmic-h2020.eu), which has received funding from the European Union’s Horizon 2020 research and innovation programme under the Marie Skłodowska-Curie grant agreement No 765158, and by the Human Frontier Science Program 570 (RGP0033/2015).
Conflict of Interest
The authors declare that the research was conducted in the absence of any commercial or financial relationships that could be construed as a potential conflict of interest.
Publisher’s Note
All claims expressed in this article are solely those of the authors and do not necessarily represent those of their affiliated organizations, or those of the publisher, the editors and the reviewers. Any product that may be evaluated in this article, or claim that may be made by its manufacturer, is not guaranteed or endorsed by the publisher.
Acknowledgments
We thank Barbera van Schaik for setting up a Virtual Machine provided by the Dutch national e-infrastructure with the support of SURF Cooperative, to process large output files.
Supplementary Material
The Supplementary Material for this article can be found online at: https://www.frontiersin.org/articles/10.3389/fimmu.2021.716240/full#supplementary-material
References
1. De Silva NS, Klein U. Dynamics of B Cells in Germinal Centres. Nat Rev Immunol (2015) 15(3):137–48. doi: 10.1038/nri3804
2. Neumüller RA, Knoblich JA. Dividing Cellular Asymmetry: Asymmetric Cell Division and its Implications for Stem Cells and Cancer. Genes Dev (2009) 23(23):2675–99. doi: 10.1101/gad.1850809
3. Thaunat O, Granja AG, Barral P, Filby A, Montaner B, Collinson L, et al. Asymmetric Segregation of Polarized Antigen on B Cell Division Shapes Presentation Capacity. Sci (80-) (2012) 335(6067):457–79. doi: 10.1126/science.1214100
4. Dustin ML, Meyer-Hermann M. Antigen Feast or Famine. Sci (80-) (2012) 335(6067):408–9. doi: 10.1126/science.1218165
5. Meyer-Hermann M, Mohr E, Pelletier N, Zhang Y, Victora GD, Toellner KM. A Theory of Germinal Center B Cell Selection, Division, and Exit. Cell Rep (2012) 2(1):162–74. doi: 10.1016/j.celrep.2012.05.010
6. Victora GD, Schwickert TA, Fooksman DR, Kamphorst AO, Meyer-Hermann M, Dustin ML, et al. Germinal Center Dynamics Revealed by Multiphoton Microscopy With a Photoactivatable Fluorescent Reporter. Cell (2010) 143(4):592–605. doi: 10.1016/j.cell.2010.10.032
7. Barnett BE, Ciocca ML, Goenka R, Barnett LG, Wu J, Laufer TM, et al. Asymmetric B Cell Division in the Germinal Center Reaction. Sci (80-) (2012) 335(6066):342–4. doi: 10.1126/science.1213495
8. Lin W-HW, Adams WC, Nish SA, Chen Y-H, Yen B, Rothman NJ, et al. Asymmetric PI3K Signaling Driving Developmental and Regenerative Cell Fate Bifurcation. Physiol Behav (2015) 176(1):139–48. doi: 10.1016/j.celrep.2015.10.072
9. Radtke D, Bannard O. Expression of the Plasma Cell Transcriptional Regulator Blimp-1 by Dark Zone Germinal Center B Cells During Periods of Proliferation. Front Immunol (2019) 10(JAN):1–16. doi: 10.3389/fimmu.2018.03106
10. Weisel FJ, Zuccarino-Catania GV, Chikina M, Shlomchik MJ. A Temporal Switch in the Germinal Center Determines Differential Output of Memory B and Plasma Cells. Immunity (2016) 44(1):116–30. doi: 10.1016/j.immuni.2015.12.004
11. Merino Tejero E, Lashgari D, García-Valiente R, Gao X, Crauste F, Robert PA, et al. Multiscale Modeling of Germinal Center Recapitulates the Temporal Transition From Memory B Cells to Plasma Cells Differentiation as Regulated by Antigen Affinity-Based Tfh Cell Help. Front Immunol (2021) 11(620716):1–15. doi: 10.3389/fimmu.2020.620716
12. Martínez MR, Corradin A, Klein U, Álvarez MJ, Toffolo GM, Di Camillo B, et al. Quantitative Modeling of the Terminal Differentiation of B Cells and Mechanisms of Lymphomagenesis. Proc Natl Acad Sci USA (2012) 109(7):2672–7. doi: 10.1073/pnas.1113019109
13. Sciammas R, Li Y, Warmflash A, Song Y, Dinner AR, Singh H. An Incoherent Regulatory Network Architecture That Orchestrates B Cell Diversification in Response to Antigen Signaling. Mol Syst Biol (2011) 7(495):1–15. doi: 10.1038/msb.2011.25
Keywords: asymmetric division, germinal center, plasma cell differentiation, multiscale modeling, agent-based modeling
Citation: Merino Tejero E, Lashgari D, García-Valiente R, He J, Robert PA, Meyer-Hermann M, Guikema JEJ, Hoefsloot H and van Kampen AHC (2021) Coupled Antigen and BLIMP1 Asymmetric Division With a Large Segregation Between Daughter Cells Recapitulates the Temporal Transition From Memory B Cells to Plasma Cells and a DZ-to-LZ Ratio in the Germinal Center. Front. Immunol. 12:716240. doi: 10.3389/fimmu.2021.716240
Received: 28 May 2021; Accepted: 26 July 2021;
Published: 17 August 2021.
Edited by:
Said Aoufouchi, UMR 9019 Intégrité du Génome et Cancers, FranceReviewed by:
Ziv Shulman, Weizmann Institute of Science, IsraelHong Zan, The University of Texas Health Science Center at San Antonio, United States
Copyright © 2021 Merino Tejero, Lashgari, García-Valiente, He, Robert, Meyer-Hermann, Guikema, Hoefsloot and van Kampen. This is an open-access article distributed under the terms of the Creative Commons Attribution License (CC BY). The use, distribution or reproduction in other forums is permitted, provided the original author(s) and the copyright owner(s) are credited and that the original publication in this journal is cited, in accordance with accepted academic practice. No use, distribution or reproduction is permitted which does not comply with these terms.
*Correspondence: Antoine H. C. van Kampen, YS5oLnZhbmthbXBlbkBhbXN0ZXJkYW11bWMubmw=
†Present address: Philippe A. Robert, Department of Immunology, University of Oslo, Oslo, Norway
‡These authors share first authorship