 Yongbiao Huang
 Shanshan Huang
 Li Ma
Li Ma Lingyan Xiao
 Wan Qin
 Long Li
 Xianglin Yuan
- Department of Oncology, Tongji Hospital, Tongji Medical College, Huazhong University of Science and Technology, Wuhan, China
Background: Hepatocellular carcinoma (HCC) is an extremely malignant cancer with poor survival. H2AFY gene encodes for a variant of H2A histone, and it has been found to be dysregulated in various tumors. However, the clinical value, biological functions and correlations with immune infiltration of H2AFY in HCC remain unclear.
Methods: We analyzed the expression and clinical significance of H2AFY in HCC using multiple databases, including Oncomine, HCCDB, TCGA, ICGC, and so on. The genetic alterations of H2AFY were analyzed by cBioPortal and COSMIC databases. Co-expression networks of H2AFY and its regulators were investigated by LinkedOmics. The correlations between H2AFY and tumor immune infiltration were explored using TIMER, TISIDB databases, and CIBERSORT method. Finally, H2AFY was knocked down with shRNA lentiviruses in HCC cell lines for functional assays in vitro.
Results: H2AFY expression was upregulated in the HCC tissues and cells. Kaplan–Meier and Cox regression analyses revealed that high H2AFY expression was an independent prognostic factor for poor survival in HCC patients. Functional network analysis indicated that H2AFY and its co-expressed genes regulates cell cycle, mitosis, spliceosome and chromatin assembly through pathways involving many cancer-related kinases and E2F family. Furthermore, we observed significant correlations between H2AFY expression and immune infiltration in HCC. H2AFY knockdown suppressed the cell proliferation and migration, promoted cycle arrest, and apoptosis of HCC cells in vitro.
Conclusion: Our study revealed that H2AFY is a potential biomarker for unfavorable prognosis and correlates with immune infiltration in HCC.
Introduction
Hepatocellular carcinoma (HCC) is the major pathological type of primary liver cancer, which is an extremely malignant and aggressive cancer with poor clinical outcome and high mortality rate (1, 2). Due to the abuse of alcohol, hepatitis virus infection, and nonalcoholic fatty liver disease, the morbidity of HCC is increasing, and it has gradually become one of the leading causes of cancer-related death worldwide (3, 4). Nowadays, the common treatment methods for HCC include curative surgical resection, liver transplantation, radiation therapy, chemotherapy, immune and molecular-targeted therapy, curative resection is still considered the preferred treatment choice for early HCC (5, 6). On account of lacking the early specific symptoms and effective biomarkers, most HCC patients were usually at an advanced stage when they were first diagnosed, and lost the opportunity for curative resection. Therefore, it is urgent to identify a novel and reliable biomarker which could be helpful for early diagnosis and prognosis prediction of HCC and even serve as a therapeutic target.
In recent years, a growing body of studies suggest that epigenetics regulation mechanisms such as DNA methylation, m6A modification, and histone variants are involved in initiation and development of various human diseases, especially tumorigenesis (7–9). Histone variants can replace their corresponding canonical histones within the nucleosome and alter the composition and structure of chromatin, thereby regulating various fundamental cellular biological processes, and, their dysregulation may lead to cancer initiation and progression (10–12). There are plenty of histone variants, but most of the histone variants are from the H2A histone family. The H2AFY gene encodes for H2A variants family member macroH2A1, which has two splicing variant isoforms, macroH2A1.1 and macroH2A1.2 respectively (13). Currently, the role for H2AFY in the tumorigenesis and progression of various solid tumors has drawn considerable attention, such as lung cancer, melanoma, breast cancer, colorectal carcinoma, bladder cancer, and gastric cancer, and it has been found to be dysregulated in these tumors (14–19).
Although H2AFY has been reported to be highly expressed in HCC which may lead to a lower survival and a poorer prognosis (20, 21), the biological function of H2AFY and its relationship with clinicopathological characteristics and tumor immune infiltrates in HCC remain largely unclear. In this study, we comprehensively investigated the expression level, mutations, diagnostic and prognostic significance of H2AFY in patients with HCC in various public databases, including Oncomine, HCCDB, The Cancer Genome Atlas (TCGA), International Cancer Genome Consortium (ICGC) and others. Furthermore, through a range of bioinformatics analyses, we explored the potential biological functions and gene regulatory networks correlated with H2AFY in HCC, and analyzed the correlation between H2AFY and infiltrating immune cells in tumor microenvironment. Additionally, we performed a series of functional assays to further evaluated the effects of H2AFY knockdown on HCC cell proliferation, migration, apoptosis, and cell cycle in vitro, and our results revealed that H2AFY regulates HCC development may in part through the regulation of STAT3 signaling.
Materials and Methods
Data Acquisition and Processing
The RNA-seq data, corresponding clinical data, and survival information of HCC patients were obtained from the TCGA database (22), and the details were shown in Table 1.
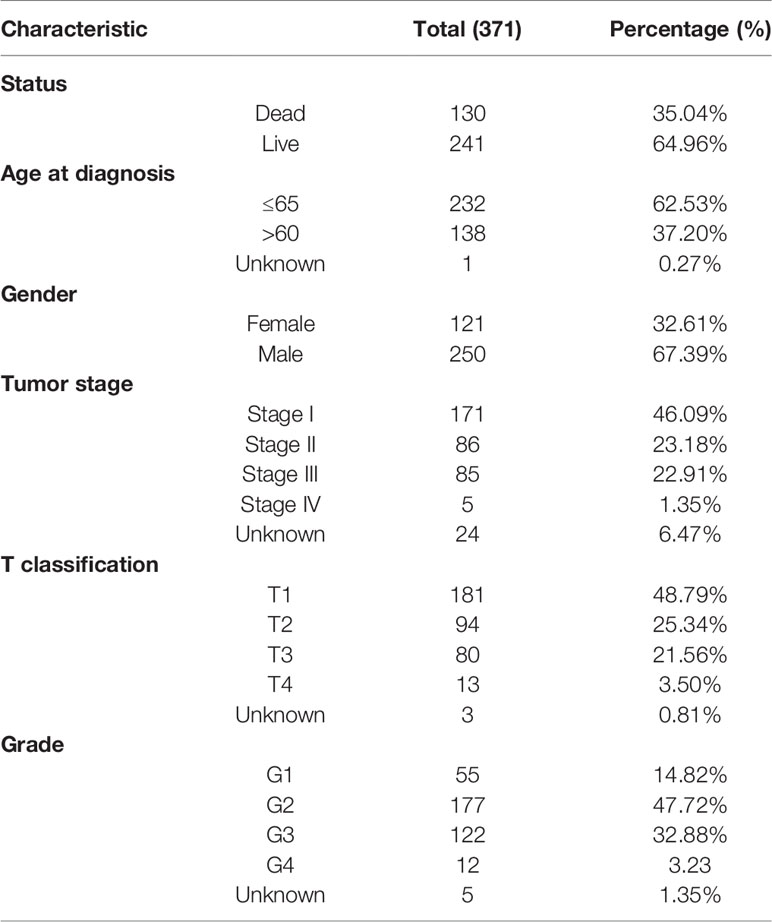
Table 1 The clinical characteristics of patients in the TCGA-LIHC cohort.
Differential Expression Analysis of H2AFY
We used the Oncomine database to examine the expression of H2AFY in liver cancers and normal tissues, set the threshold as: P-value as 0.001, fold change (FC) as 1.5, and gene rank as top 10% (23). Besides, we also analyzed the H2AFY gene expression level in HCC via TIMER database based on TCGA data (24). The HCCDB database contains 15 public HCC datasets which were from the Gene Expression Omnibus (GEO), TCGA, and ICGC, and it was further used for verifying the differential expression of H2AFY between HCC and normal tissues (25).
Genetic Alteration and Survival Analysis
The cBioPortal database and the Catalogue of Somatic Mutations in Cancer (COSMIC) database were utilized to evaluate the alteration frequency and types of H2AFY in HCC (26, 27). In the TCGA-LIHC cohort, patients with complete follow-up information were included in survival analyses, Kaplan–Meier curves, receiver operating characteristic (ROC) curves, and Cox regression models were applied to determine the prognostic significance of H2AFY. Additionally, the impacts of H2AFY expression on overall survival of HCC patients were further validated in the ICGC dataset (LIRI-JP project), Kaplan–Meier Plotter, and GEPIA2 database (28, 29). GeneMANIA was applied to visualize the interaction network of H2AFY and predict their function (30).
Coexpression Analysis in LinkedOmics
LinkedOmics is an online analysis platform that contains multi-dimensional data of 32 TCGA cancer types (31). H2AFY co-expression statistical analysis was performed using Spearman correlation test in the “LinkFinder” module, the results were presented in volcano plot and heat maps. The survival heatmaps of top 50 co-expressed genes were plotted by GEPIA2 database. The GO annotation, KEGG pathways, kinase-target enrichment, miRNA-target enrichment, and transcription factor-target enrichment analyses were conducted by gene set enrichment analysis (GSEA) in the “LinkInterpreter” module. The simulations of 500 and the rank criterion was set as false discovery rate (FDR) <0.05.
GSEA Between H2AFY High- and Low-Expression Groups
GSEA analysis was carried out to detect different functional phenotypes between H2AFY high- and low-expression groups by using GSEA software (v.4.0.3) based on the expression profile of the TCGA-LIHC dataset (32). KEGG gene set (c2.cp.kegg.v7.4.symbols.gmt) and GO_BP gene set (c5.go.bp.v7.4.symbols.gmt were) were used as the reference gene sets, and 1,000 random permutations were performed per analysis. Nominal P-value <0.05 and FDR <0.05 were regarded significant.
Immune Infiltration Analysis
We used the TIMER database to investigate the correlations between H2AFY expression, copy number alterations and the abundance of six major tumor-infiltrating immune cells in HCC. Besides, the correlations between H2AFY and immune cell marker genes and several key immune checkpoint genes were also analyzed through the “Correlation” module of TIMER and GEPIA2. Then, we compared the expression of these immune checkpoint genes between patients with high- and low-H2AFY expression. The distribution of H2AFY expression across immune subtypes were further explored in TISIDB database (33). The relative fractions of 22 immune cell types of patients in TCGA-LIHC cohort were calculated through CIBERSORT algorithm, presenting in bar graphs, heatmap, and violin plot (34, 35).
Cell Culture and Transfection
The human normal liver cell line L02 and HCC cell lines MHCC-97H, Hep3B, Huh7 and HepG2 were gifts from gastroenterology laboratory and hepatic surgery laboratory of the Tongji Hospital, Wuhan, China. Jurkat cell line was stored in oncology laboratory of the Tongji Hospital, Wuhan, China. L02 cells and Jurkat cells were cultured in RPMI 1640 medium (HyClone, USA) and other hepatoma cells was in DMEM medium (HyClone, USA), with 10% fetal bovine serum (FBS, Gibco, USA), at 37°C in 5% CO2 incubator. The lentiviral H2AFY-specific shRNA vectors and negative control (NC) were obtained from OBiO (Shanghai, China). Transfection was carried out with polybrene (OBiO, China). The sequences of H2AFY-shRNAs were listed: H2AFY-sh1, 5′-GGATGCTGCGGTACATCAA-3′; H2AFY-sh2, 5′-GCTGAAATCCATTGCATTT-3′; H2AFY-sh3, 5′-GCGAGAGTATAGGCATCTA-3′; and NC, 5′-TTCTCCGAACGTGTCACGT-3′.
qRT-PCR
Total RNA from cells was extracted using TRIzol reagent (TaKaRa, Japan) and reverse transcribed by Hi Script II QRT SuperMix (Vazyme, China). The qRT-PCR was carried out using ChamQ Universal SYBR qPCR Master Mix (Vazyme, China). All primers were listed as follows: H2AFY, Forward: CGGATGCTGCGGTACATCAA, Reverse: CTCCGCTGTCAGGTATTCCAG. GAPDH, Forward: GACAGTCAGCCGCATCTTCT, and Reverse: GCGCCCAATACGACCAAATC. GAPDH was utilized as internal control.
CCK8 Viability Assay
Cells (3,000 cells/well) were seeded in 96-well plates, after overnight attachment, the medium was changed to 100 μl FBS-free medium with 10% CCK8 (MCE, USA) in each well and incubated for 2 h at 37°C, then the OD values at 450 nm were detected through microplate reader (BioTek, USA). These steps were repeated at 0, 24, 48, and 72 h, and the relative absorbance was calculated based on the OD values at 0 h.
Clone Formation Assay
Cells (2,000 cells/well) were seeded in 6-well plates and cultured until visible clones appeared. Then we used methanol to fix clones 15 min, 1% crystal violet to stain clones 20 min, and counted the number of clones (>50 cells).
Cell Apoptosis and Cell Cycle Assays
For cell apoptosis assay, cells were collected by EDTA-free trypsin, washed with PBS for three times, and resuspended in binding buffer. After incubation with PI and Annexin V-APC (BD Biosciences, USA) in dark for 15 min, the cell apoptosis was examined through flow cytometer (BD, Biosciences, USA) and analyzed by FlowJo 10.6.2. For cell cycle assay, cells were collected and fixed in 70% ethanol at 4°C overnight, then stained as the protocol of the cell cycle staining kit (MultiSciences, China). The cell cycle was examined using flow cytometer and analyzed by Modfit LT software.
Wound Healing Assay
Cells were seeded in 6-well plates with serum-free DMEM and cultured to 100% density, and then the scratch wounds were created using 10 μl pipette tips. Images of wounds were captured at 0, 24, and 48 h, the area of wounds was quantified by ImageJ software (40×).
Transwell For Migration Assay
For transwell migration assay, 4 × 10⁴ cells were seeded on the upper transwell chambers in 200 μl serum-free culture medium, and 600 μl medium containing 20% FBS was added to the lower chambers. After 40 h incubation, the cells that migrated through membranes were fixed with methanol, stained with 1% crystal violet and counted under light microscope (200×).
Western Blot
Total cellular protein was extracted with RIPA lysis buffer (Servicebio, China), denatured by mixing 5× loading buffer and boiling for 5 min. Then the denatured protein was subjected to SDS/polyacrylamide-gel electrophoresis and transferred to 0.45 µm polyvinylidene fluoride membranes. The membranes were blocked in 5% nonfat milk for 1 h at room temperature, and subsequently incubated with the following primary antibodies: H2AFY (Abcam, CAT# ab183041, 1:10,000), Cyclin B1 (Proteintech, CAT# 28603-1-AP, 1:1,000), Cyclin D1 (Proteintech, CAT# 26939-1-AP, 1:1,000), E-Cadherin (Cell Signaling Technology, CAT# 3195, 1:1,000), Vimentin (Cell Signaling Technology, CAT# 5741, 1:1,000), Bcl-2 (Cell Signaling Technology, CAT# 4223, 1:1,000), STAT3 (Cell Signaling Technology, CAT# 9139, 1:1,000), p-STAT3 (Cell Signaling Technology, CAT# 9145, 1:1,000), and α-Tublin (Proteintech, CAT# 11224-1-AP, 1:5,000) at 4°C overnight. Next, the membranes were washed with TBST three times, each for 10 min and incubated with secondary antibodies at room temperature for 1 h. Finally, the indicated proteins were visualized by West Pico plus Chemiluminescent Substrate (Thermo Fisher Scientific, USA).
Statistical Analysis
All data of this study were statistically analyzed by R software 3.6.1 and Prism 8.0. The Wilcoxon test or Kruskal–Wallis test were used to examine the mRNA expression levels of H2AFY in different clinical subgroups, logistic regression was conducted to analyze the association of the H2AFY expression and clinicopathological characteristics. The Kaplan–Meier method and log-rank test were applied for comparing overall survival. Correlation analyses were performed by Spearman correlation test. For experimental data, Student’s t-test was used to determine the differences between two groups. P <0.05 was regarded statistically significant.
Results
High H2AFY Expression in HCC
We initially analyzed H2AFY mRNA expression levels in multiple public databases to examine H2AFY expression in HCC. Data from the Oncomine database revealed that H2AFY expression was dramatically higher in HCC tissues than normal tissues (FC >1.5, P <0.01), and ranked within the top 10% (Figure 1A and Figure S1). Meanwhile, the upregulation of H2AFY in HCC compared with normal tissues was also observed in TIMER database (Figure 1B). In the HCCDB database, analysis of ten HCC cohorts further verified that H2AFY was significantly upregulated in HCC (Figure 1C).
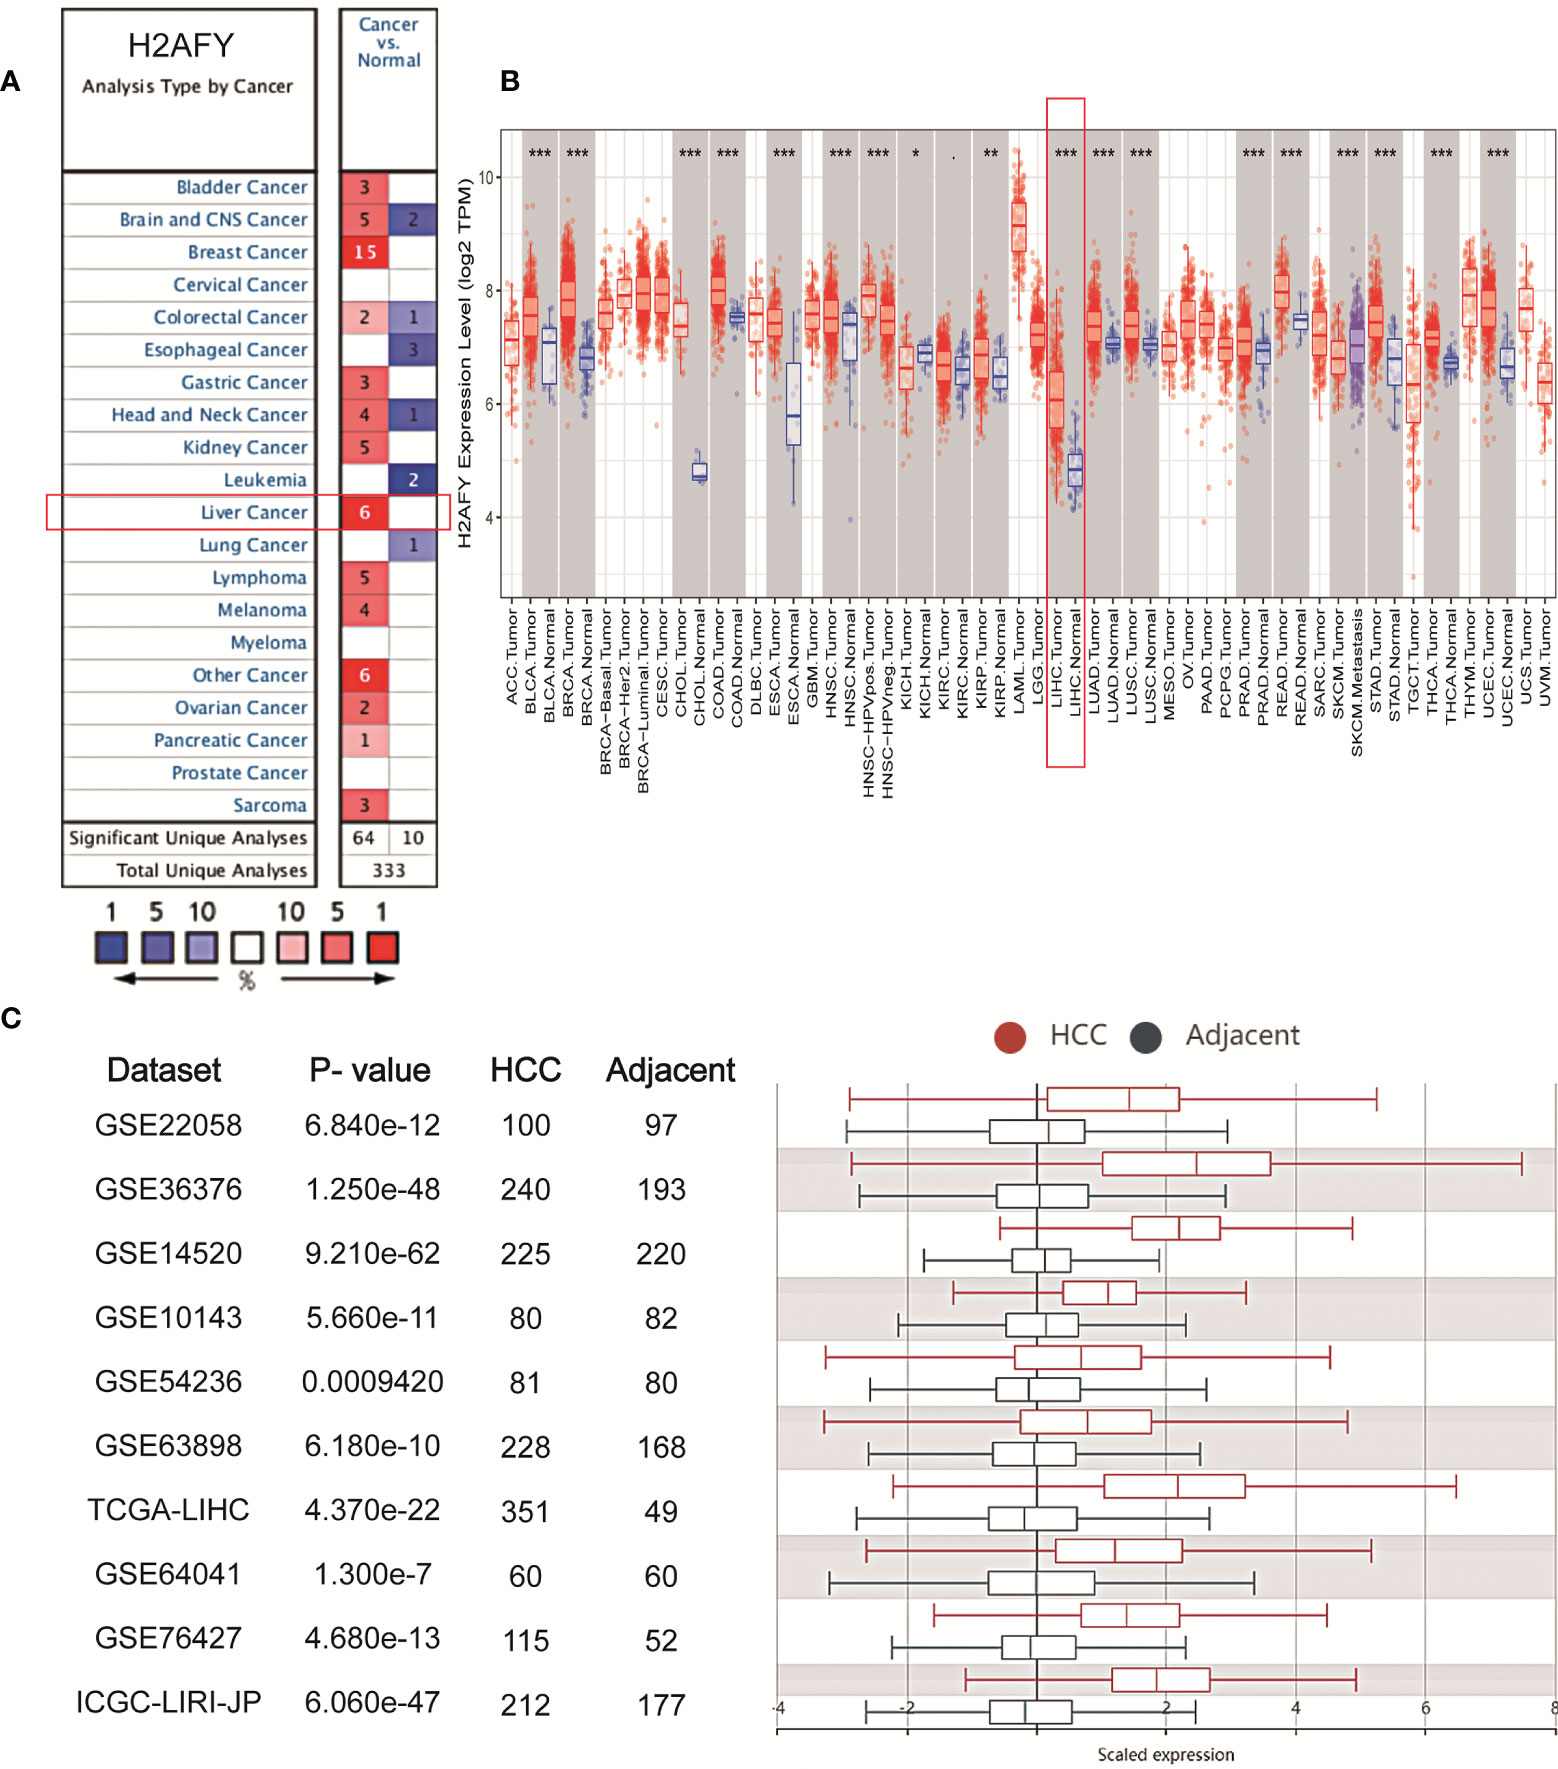
Figure 1 The elevated H2AFY expression in HCC. (A) Upregulated or downregulated H2AFY expression in different cancer types (Oncomine database, red color—upregulation, blue color—downregulation). (B) H2AFY expression levels in different tumor tissues and normal tissues (TIMER database). (C) Comparing the H2AFY expression between HCC and adjacent tissues in ten HCC cohorts (HCCDB database) *P < 0.05; **P < 0.01; ***P < 0.001.
Association With H2AFY Expression and Clinical Variables
Based on the H2AFY expression data and clinical information from TCGA, a total of 371 HCC patients were analyzed. The H2AFY expression in younger patients (≤65 years) was significantly higher than patients older than 65 years (P = 0.031, Figure 2A). Dead patients presented increased H2AFY expression compared to alive patients (P = 0.004). H2AFY expression was increased in dead patients compared to alive patients (P = 0.004, Figure 2B), increased in female compared to male (P = 0.004, Figure 2C).
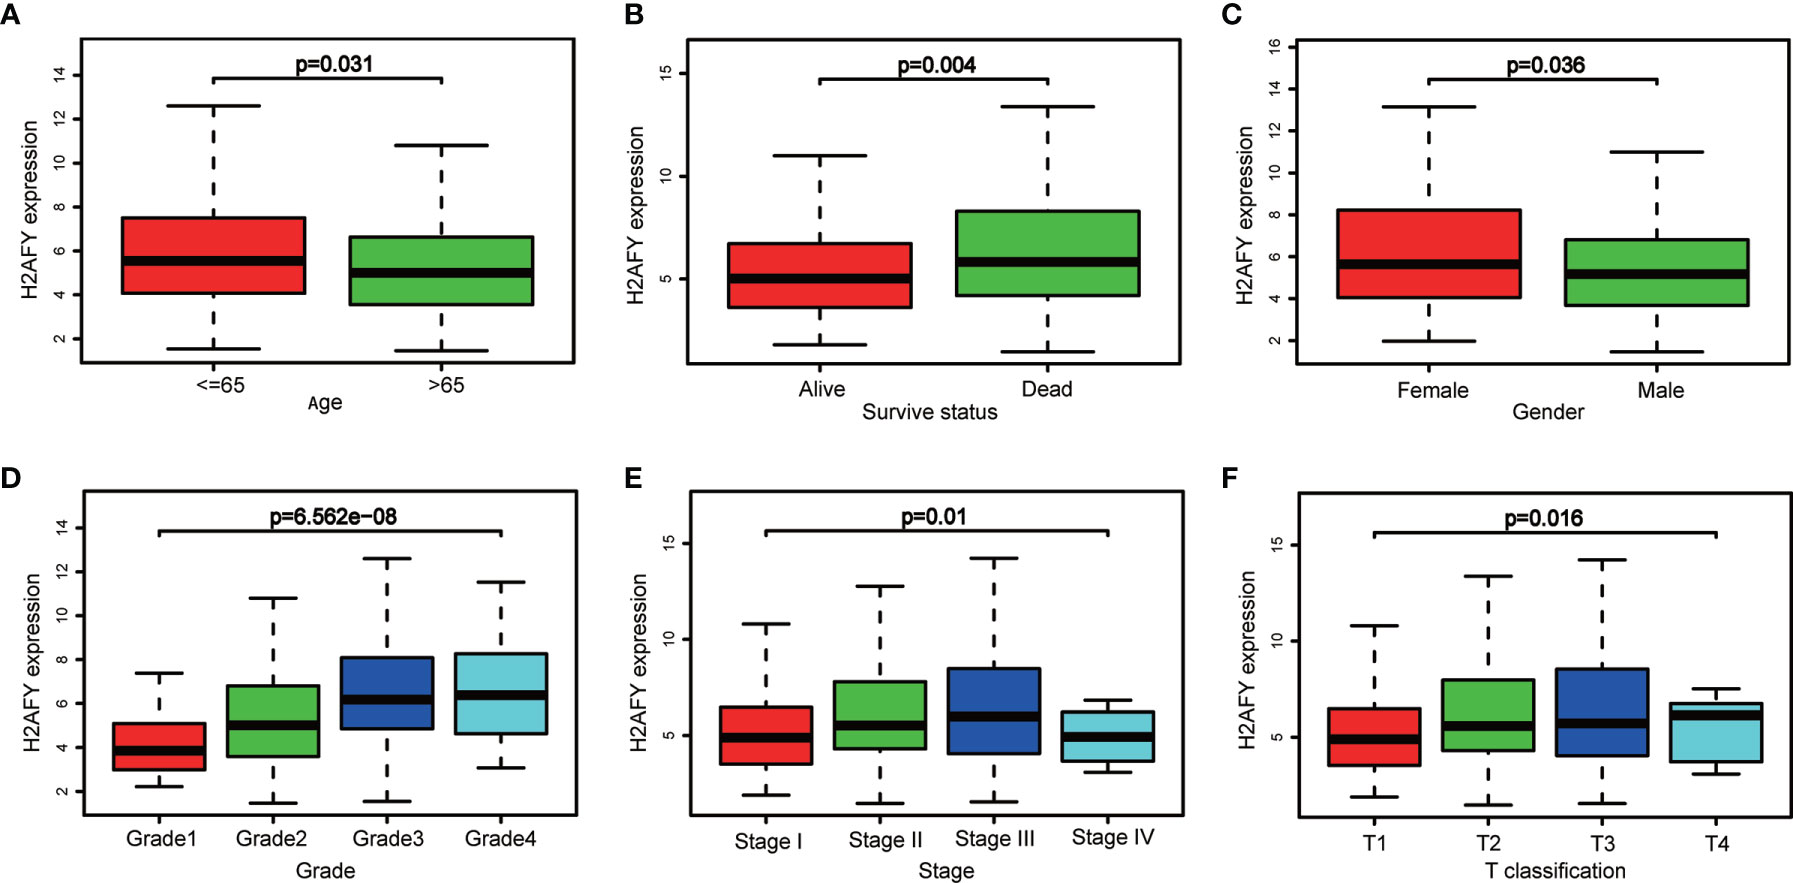
Figure 2 H2AFY expression in sub-groups of different clinical characteristics. Subgroup analyses of H2AFY expression based on (A) age, (B) survive status, (C) gender, (D) histological grade, (E) tumor stage, and (F) T classification.
Besides, H2AFY expression increased with the histological grade (P = 6.562e−08, Figure 2D) and T classification (P = 0.016, Figure 2F). As shown in Figure 2E, the H2AFY expression levels were significant different in the subgroups of clinical stage (P = 0.01). In logistic regression analysis, H2AFY expression as a dependent categorical variable (according to the median value), the results indicated that increased H2AFY expression in HCC was prominently associated with age (OR = 1.669 for ≤65 vs. >65, P = 0.018), survival status (OR = 1.624 for dead vs. alive, P = 0.027), histological grade (OR = 3.394 for G3–G4 vs. G1–G2, P <0.0001), T classification (OR = 1.590 for T2–T3 vs. T1, P = 0.030; OR = 4.304 for T4 vs. T1, P = 0.031), clinical stage (OR = 1.638 for stages II–III vs. stage I, P = 0.024; OR = 1.784 for stage III vs. stage I, P <0.031) (Table 2).
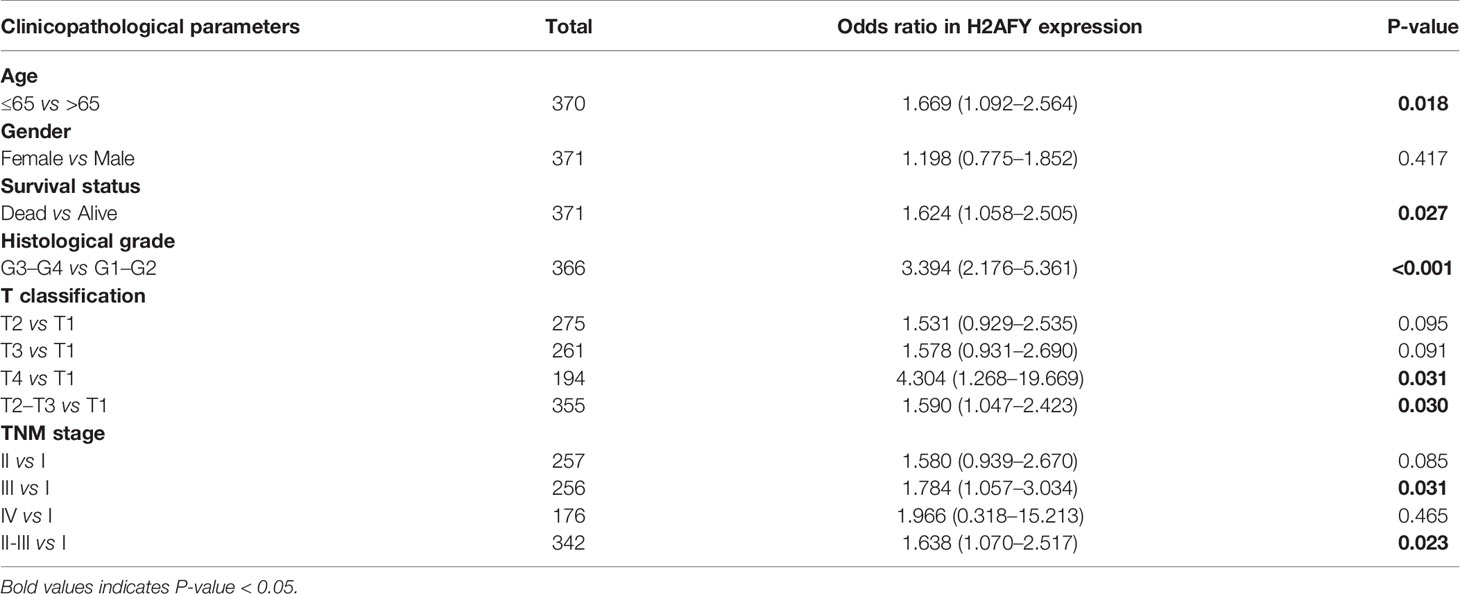
Table 2 Correlations between H2AFY expression and clinicopathological parameters by logistic regression.
Genetic Alterations of H2AFY in HCC
In the cBioPortal database, we evaluated the alteration (copy-number alteration and mutation) types and frequency of H2AFY in HCC. The TCGA–Firehose Legacy dataset was selected for analysis, which included 360 samples with complete DNA sequencing data. The alteration frequency of H2AFY was 1.1% in HCC, which include amplification in two cases, missense mutation in two cases (Figure 3A). The detailed mutation landscapes were showed in Figure 3B. Since the alteration frequency was relatively low, we failed to explore the association between H2AFY genetic alteration and the survival of HCC patients. In addition, we further evaluated the mutation types of H2AFY in another database, COSMIC. The mutation types of H2AFY were clearly displayed in two pie charts (Figures 3C, D). Approximately seven (10.29%) of the 68 samples had missense substitutions, two (2.94%) of the 68 samples had synonymous substitutions, and seven (8.82%) of the 68 samples had other mutations (Figure 3C). The substitution mutations mainly included A > C (22.22%), C > A (22.22%), G > A (22.22%), followed by A > G (11.11%), C > T (11.11%), and G > T (11.11%) (Figure 3D).
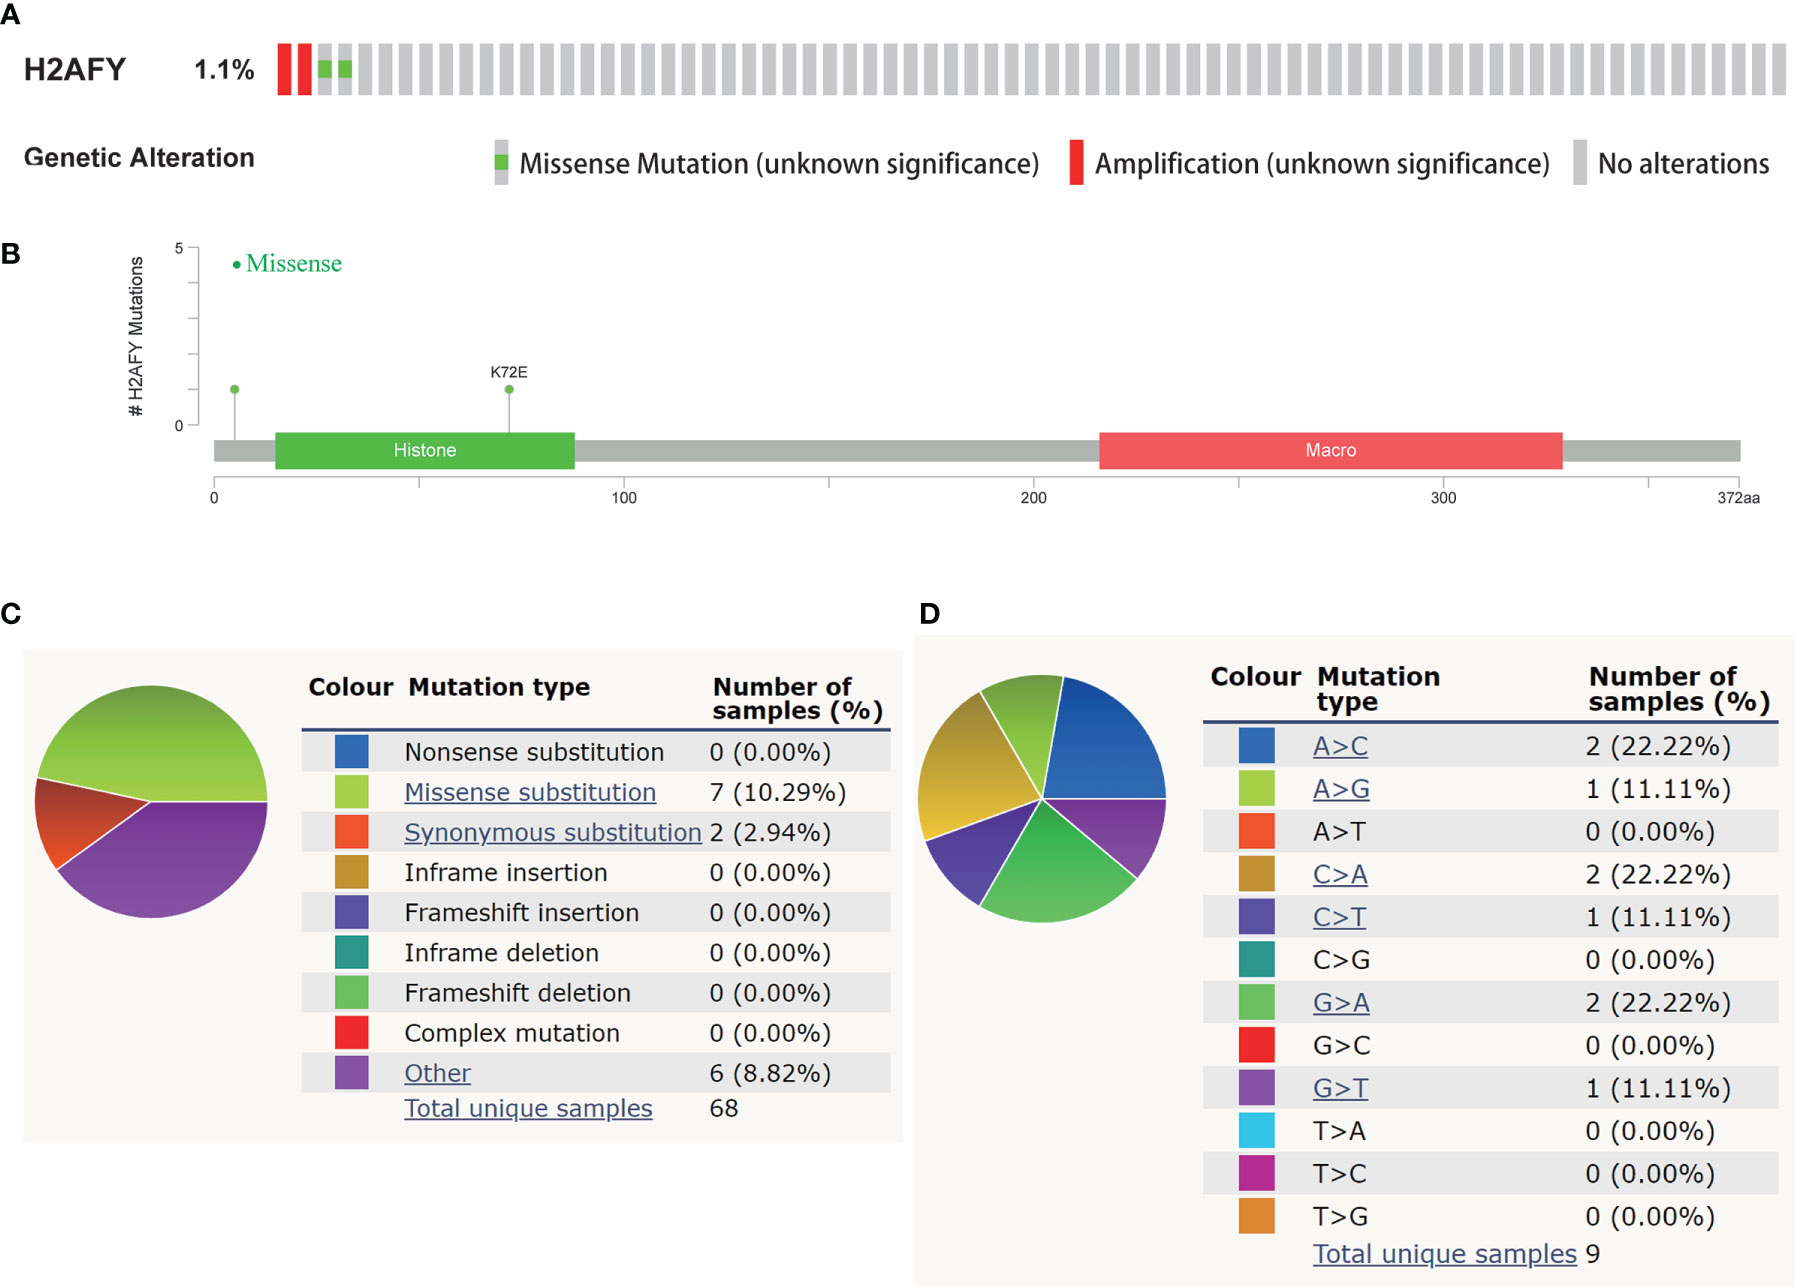
Figure 3 Genetic alterations of H2AFY in HCC. (A) OncoPrint of H2AFY alterations in TCGA-LIHC cohort (cBioPortal). (B) Schematic presentation of H2AFY mutations in TCGA-LIHC cohort (cBioPortal). (C, D) The mutation types of H2AFY in HCC (Catalogue of Somatic Mutations in Cancer (COSMIC) database).
Prognostic Significance of H2AFY in HCC
Then, we explore the role of H2AFY in HCC patients’ survival outcomes in multiple databases. Based on the median H2AFY expression value, the HCC patients were split into high- and low-H2AFY expression groups. In the TCGA-LIHC cohort, Kaplan–Meier survival curves indicated that patients with high H2AFY expression tended to have poor overall survival (log-rank P <0.001, Figure 4A), time-dependent ROC curves indicated that H2AFY had moderate sensitivity and specificity for predicting survival (Figure 4B). Further univariate and multivariate Cox regression analyses revealed that H2AFY could function as a prognostic indicator independent of other clinical parameters for HCC patients (Figures 4C, D). In the ICGC cohort, the similar results were observed (Figures 4E, F). Besides, we verified the prognostic significance of H2AFY through K–M plotter and GEPIA online databases, the results also indicated that high H2AFY expression was associated poor survival (log-rank P <0.001, Figures 4G, H).
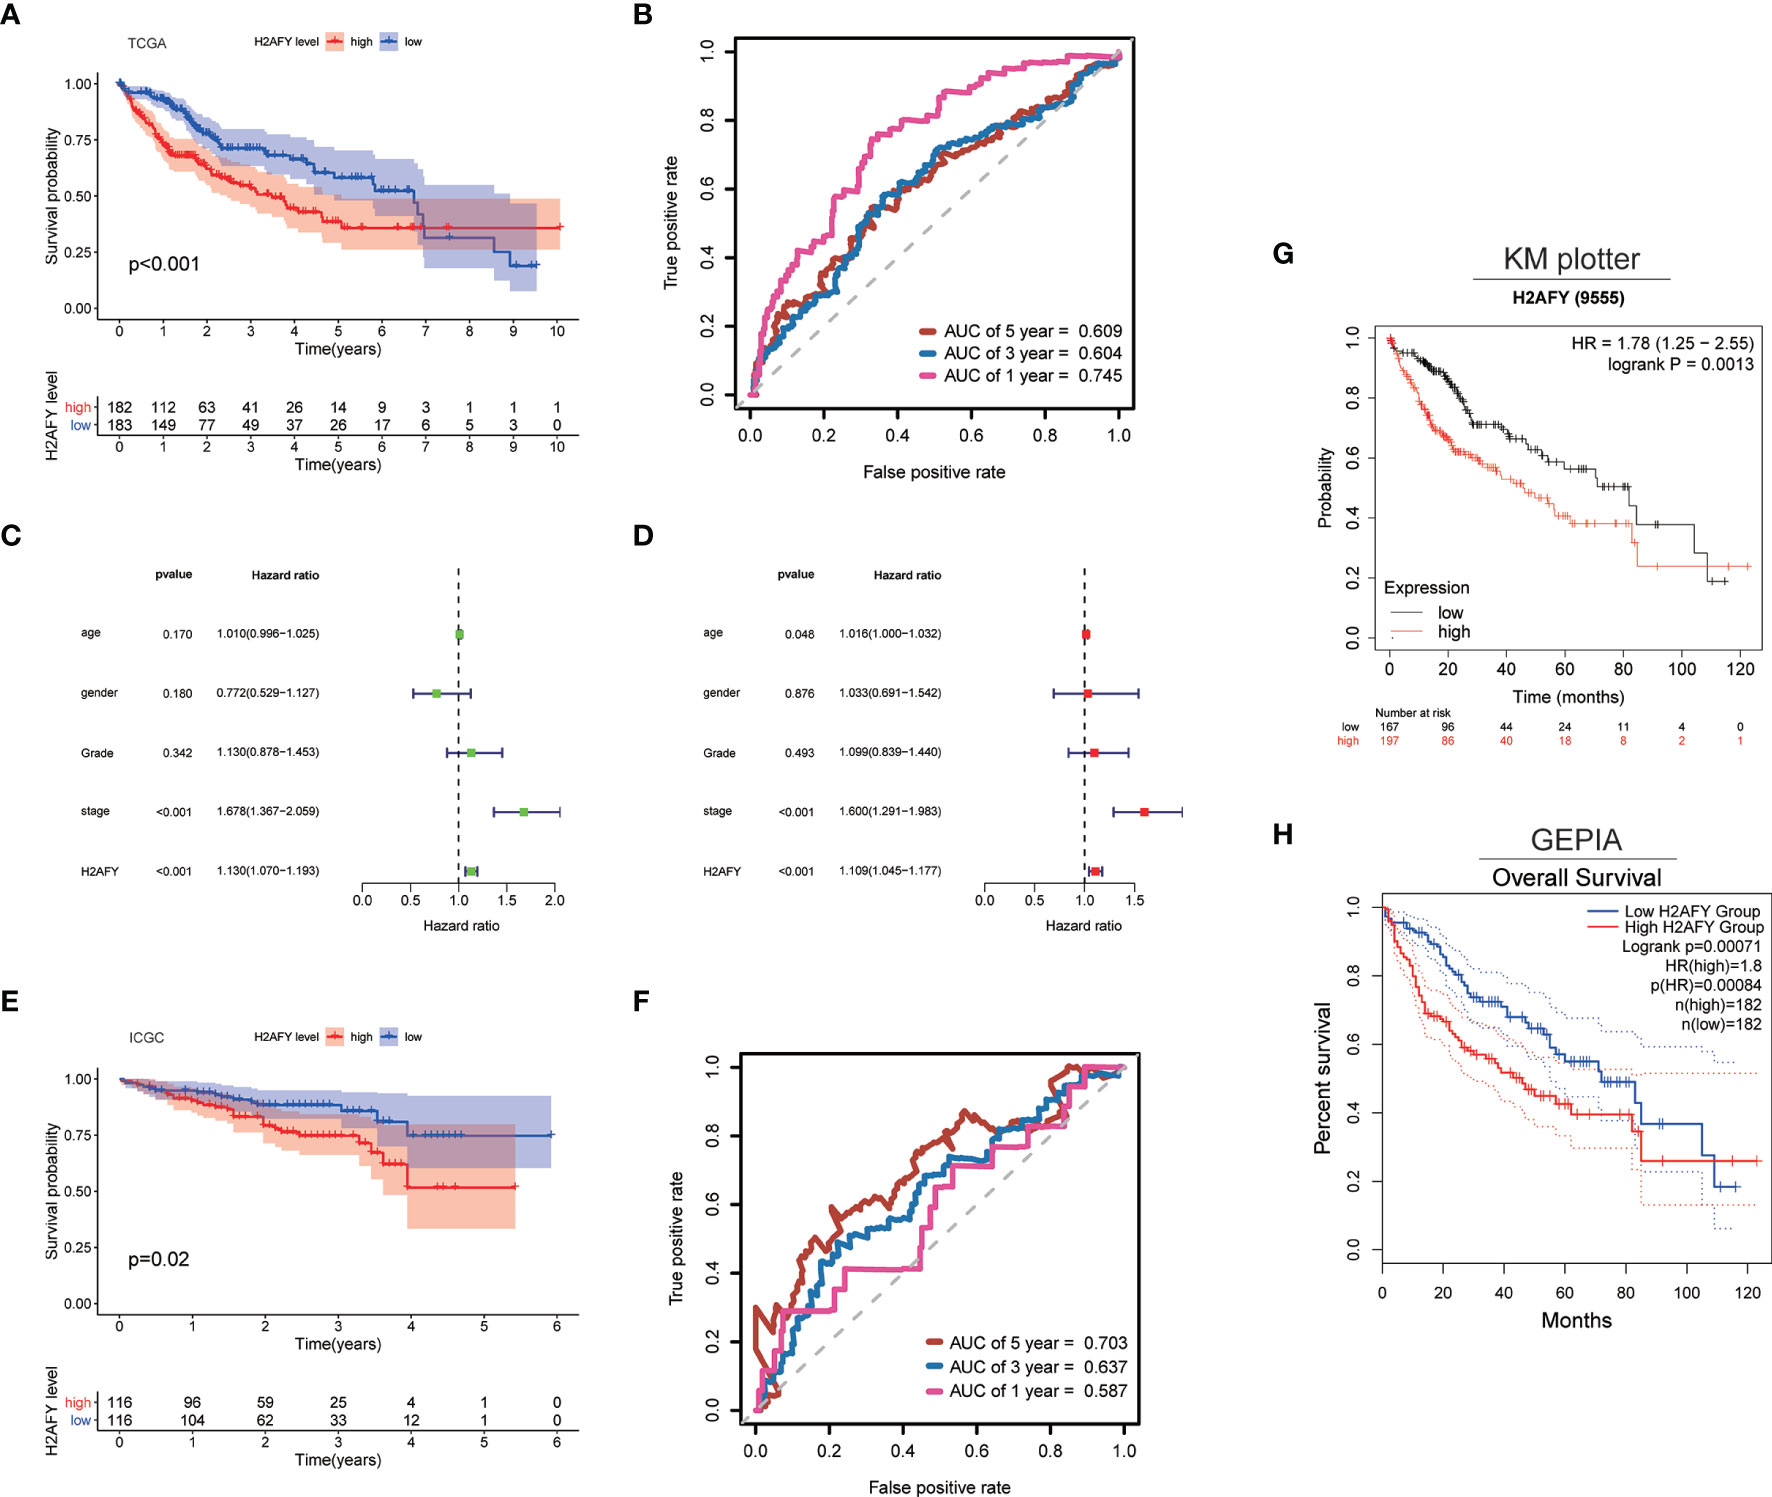
Figure 4 H2AFY is associated with overall survival of HCC patients. (A) Kaplan–Meier survival curves and (B) time-dependent ROC curves of H2AFY in TCGA-LIHC cohort. (C) univariate Cox analysis and (D) multivariate Cox analysis in TCGA-LIHC cohort. (E) Kaplan–Meier survival curves and (F) time-dependent ROC curves of H2AFY in ICGC cohort (LIRI-JP project). (G) Kaplan–Meier survival analyses of H2AFY in Kaplan–Meier Plotter and (H) GEPIA2.
H2AFY Co-Expression Networks in HCC
The co-expression pattern of H2AFY was explored in TCGA-LIHC cohort through LinkedOmics (Table S1). As presented in Figure 5A, a total of 7,201 genes positively correlated with H2AFY and 2,928 genes negatively correlated with H2AFY were identified (FDR <0.01). The top 50 positively and negatively correlated genes were presented in heat maps (Figure 5B). H2AFY expression exhibited a strong positive correlation with the expression of CEP55 (positive rank #1, r = 0.663, FDR = 2.14E−44), CCNB1 (r = 0.659, FDR = 7.55E−44) and DEPDC1B (r = 0.637, FDR = 6.98E−40), etc. Remarkably, the top 50 positively correlated genes had high probability of being high-risk markers in HCC, of which 45/50 genes owned high hazard ratio (HR, P <0.05). Conversely, 23/50 genes were with low HR (P <0.05) in the top 50 negatively correlated genes (Figure 5C). The results of GO enrichment analysis by GSEA suggested that H2AFY co-expressed genes participate mainly in microtubule cytoskeleton organization involved in mitosis, organelle fission, kinetochore organization, chromosome segregation, cell cycle G2/M phase transition and regulation of cell cycle phase transition. (Figure 5D and Table S2). KEGG pathway analysis revealed enrichment in the cell cycle, homologous recombination, DNA replication, spliceosome, and mRNA surveillance pathway. (Figure 5D and Table S3). All these findings indicated the important roles of H2AFY and its co-expressed genes in cell cycle regulation for HCC progression.
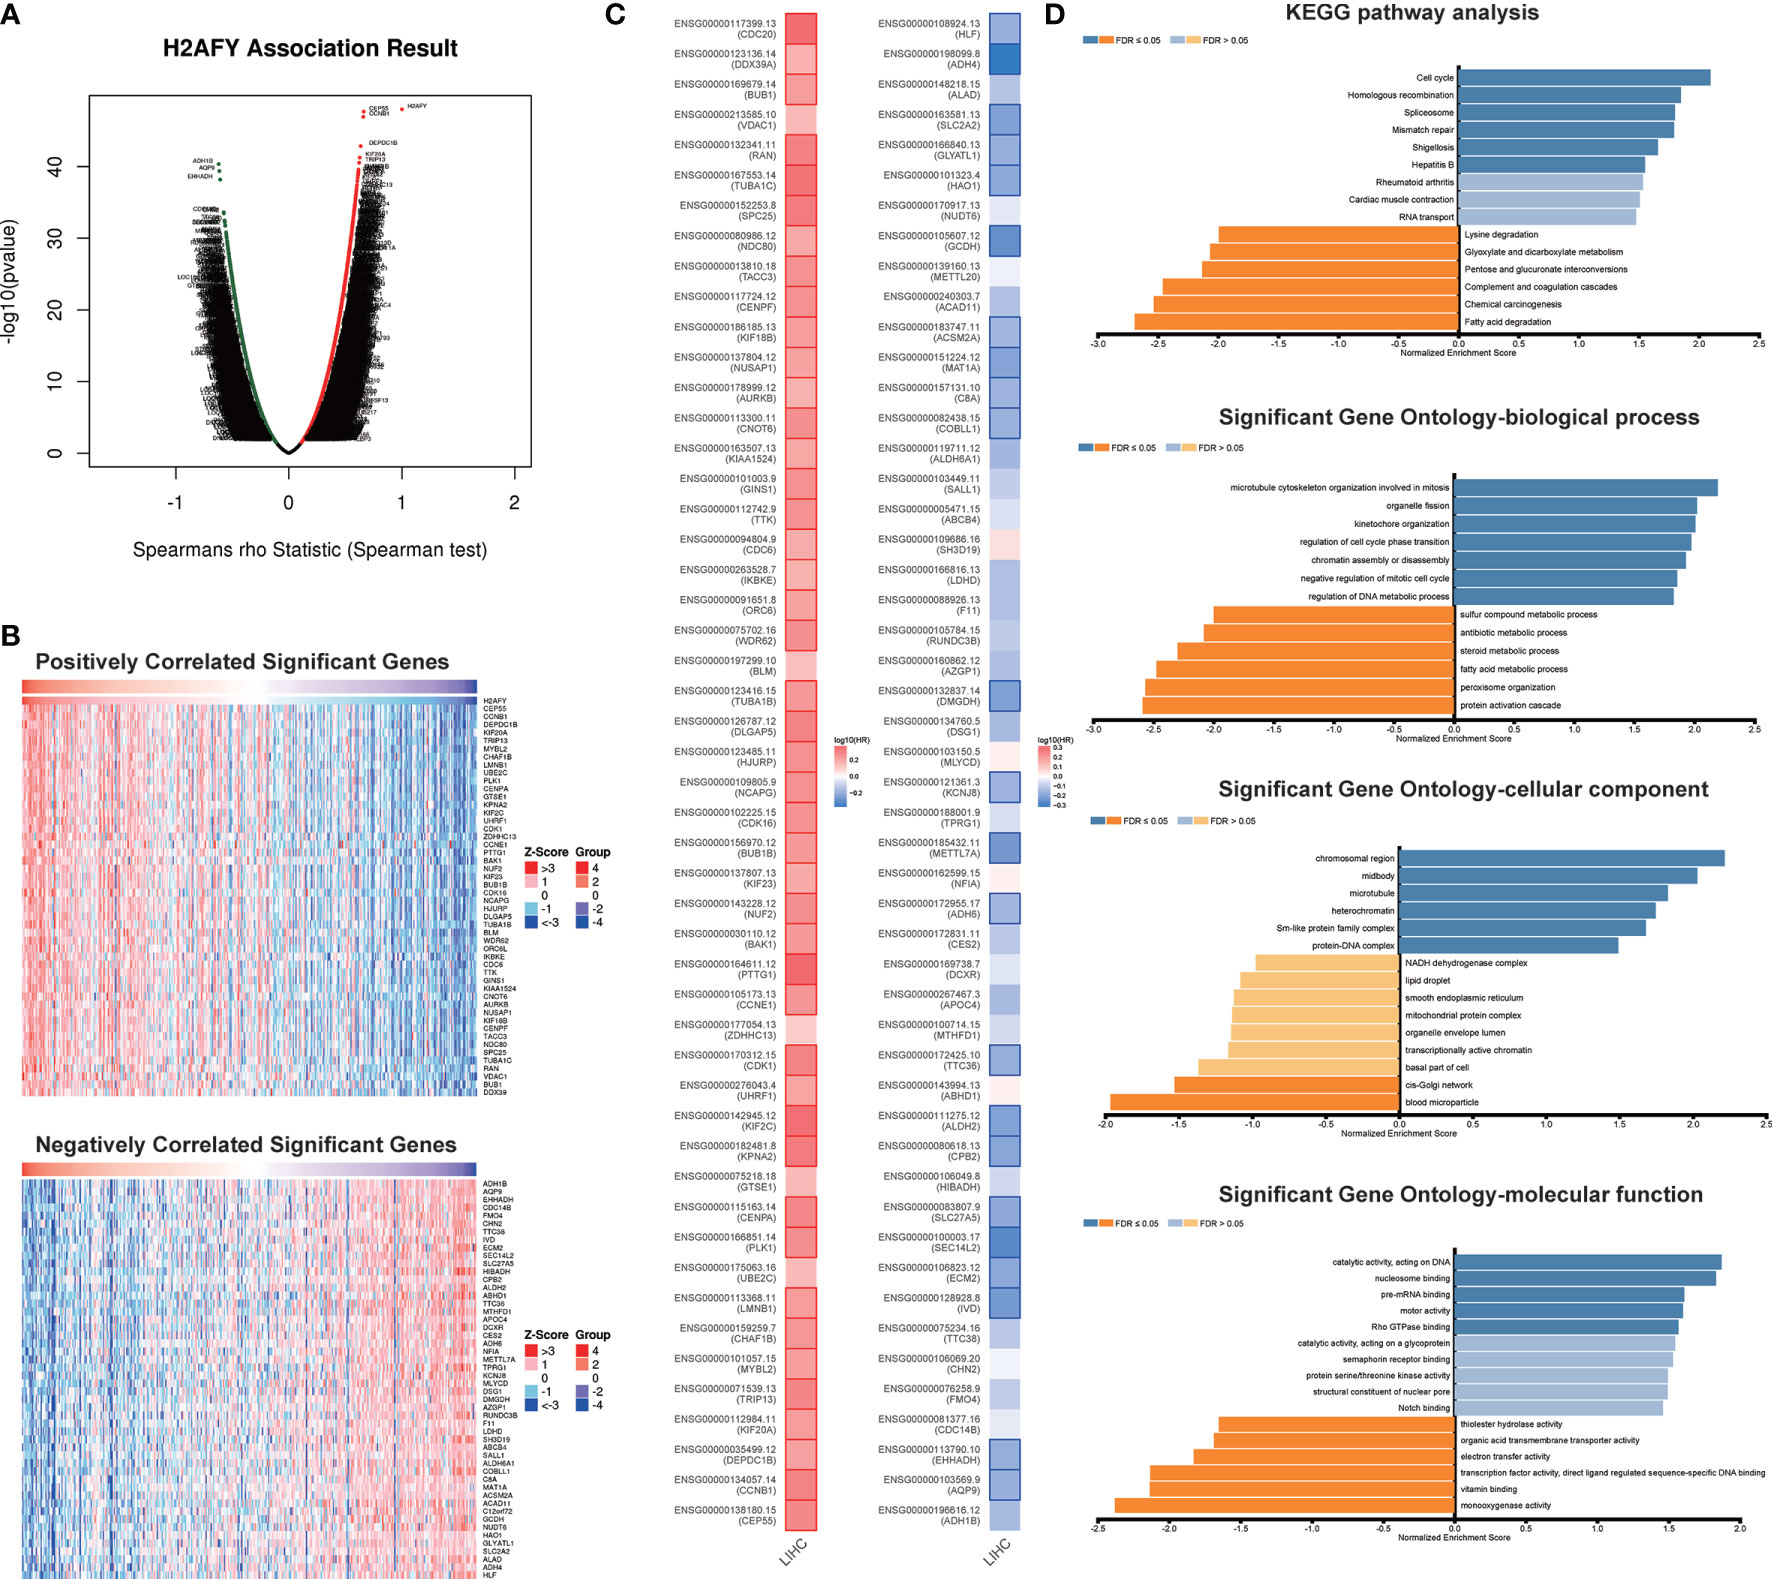
Figure 5 H2AFY co-expression networks in HCC (LinkedOmics). (A) Volcano plot of the global H2AFY highly correlated genes identified by Spearman test. (B) Heat maps of top 50 genes positively and negatively correlated with H2AFY. (C) Survival heatmaps of top 50 genes positively and negatively correlated with H2AFY. (D) Significantly enriched GO terms and KEGG pathways related to H2AFY.
Regulators of H2AFY Networks in HCC
To determine the regulatory factors of H2AFY in HCC, we further analyzed the kinase, miRNA, and transcription factor targets’ enrichment of H2AFY co-expressed genes using GSEA. The top five most significant kinase-target networks were related mainly to PLK1, CDK1, CHEK1, AURKB, and CDK2 (Table 3 and Table S4). Interestingly, no significant miRNA targets were enriched for H2AFY co-expressed genes (Table 3 and Table S5). The significantly enriched transcription factor-targets were associated primarily with E2F transcription factor family (Table 3 and Table S6), including V$E2F_Q4, V$E2F_Q6, V$E2F_02, V$E2F1DP1_01, and V$E2F1DP2_01.
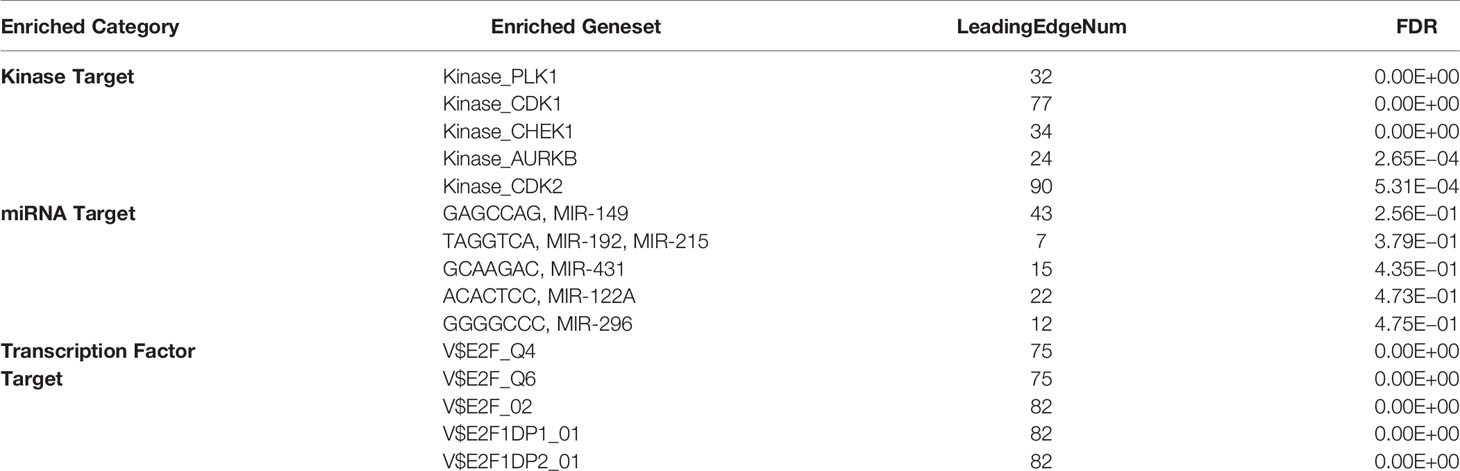
Table 3 The kinase, miRNA and transcription factor-target networks of H2AFY in HCC (LinkedOmics).
GSEA Between High- and Low-H2AFY Expression Groups
To explore the biological processes and signaling pathways that H2AFY may regulate, GSEA was performed between high- and low-H2AFY expression groups using TCGA-LIHC transcriptome data. We found some immune-related and cancer-related processes and pathways were significantly gathered in high-H2AFY expression group (Figures 6A, C), such as activation of innate immune response, innate immune response activating cell surface receptor signaling pathway, T-cell activation involved in immune response, B-cell activation involved in immune response, T-cell differentiation involved in immune response, lymphocyte activation of immune response, pathways in cancer, cell cycle, apoptosis and T-cell receptor signaling pathway, these results implied that H2AFY might be involved in immune response and impact immune infiltration. However, multiple metabolic processes like drug catabolic process, fatty acid catabolic process, lipid oxidation, drug metabolism cytochrome P450, and fatty acid metabolism were activated in low-H2AFY expression group (Figures 6B, D).
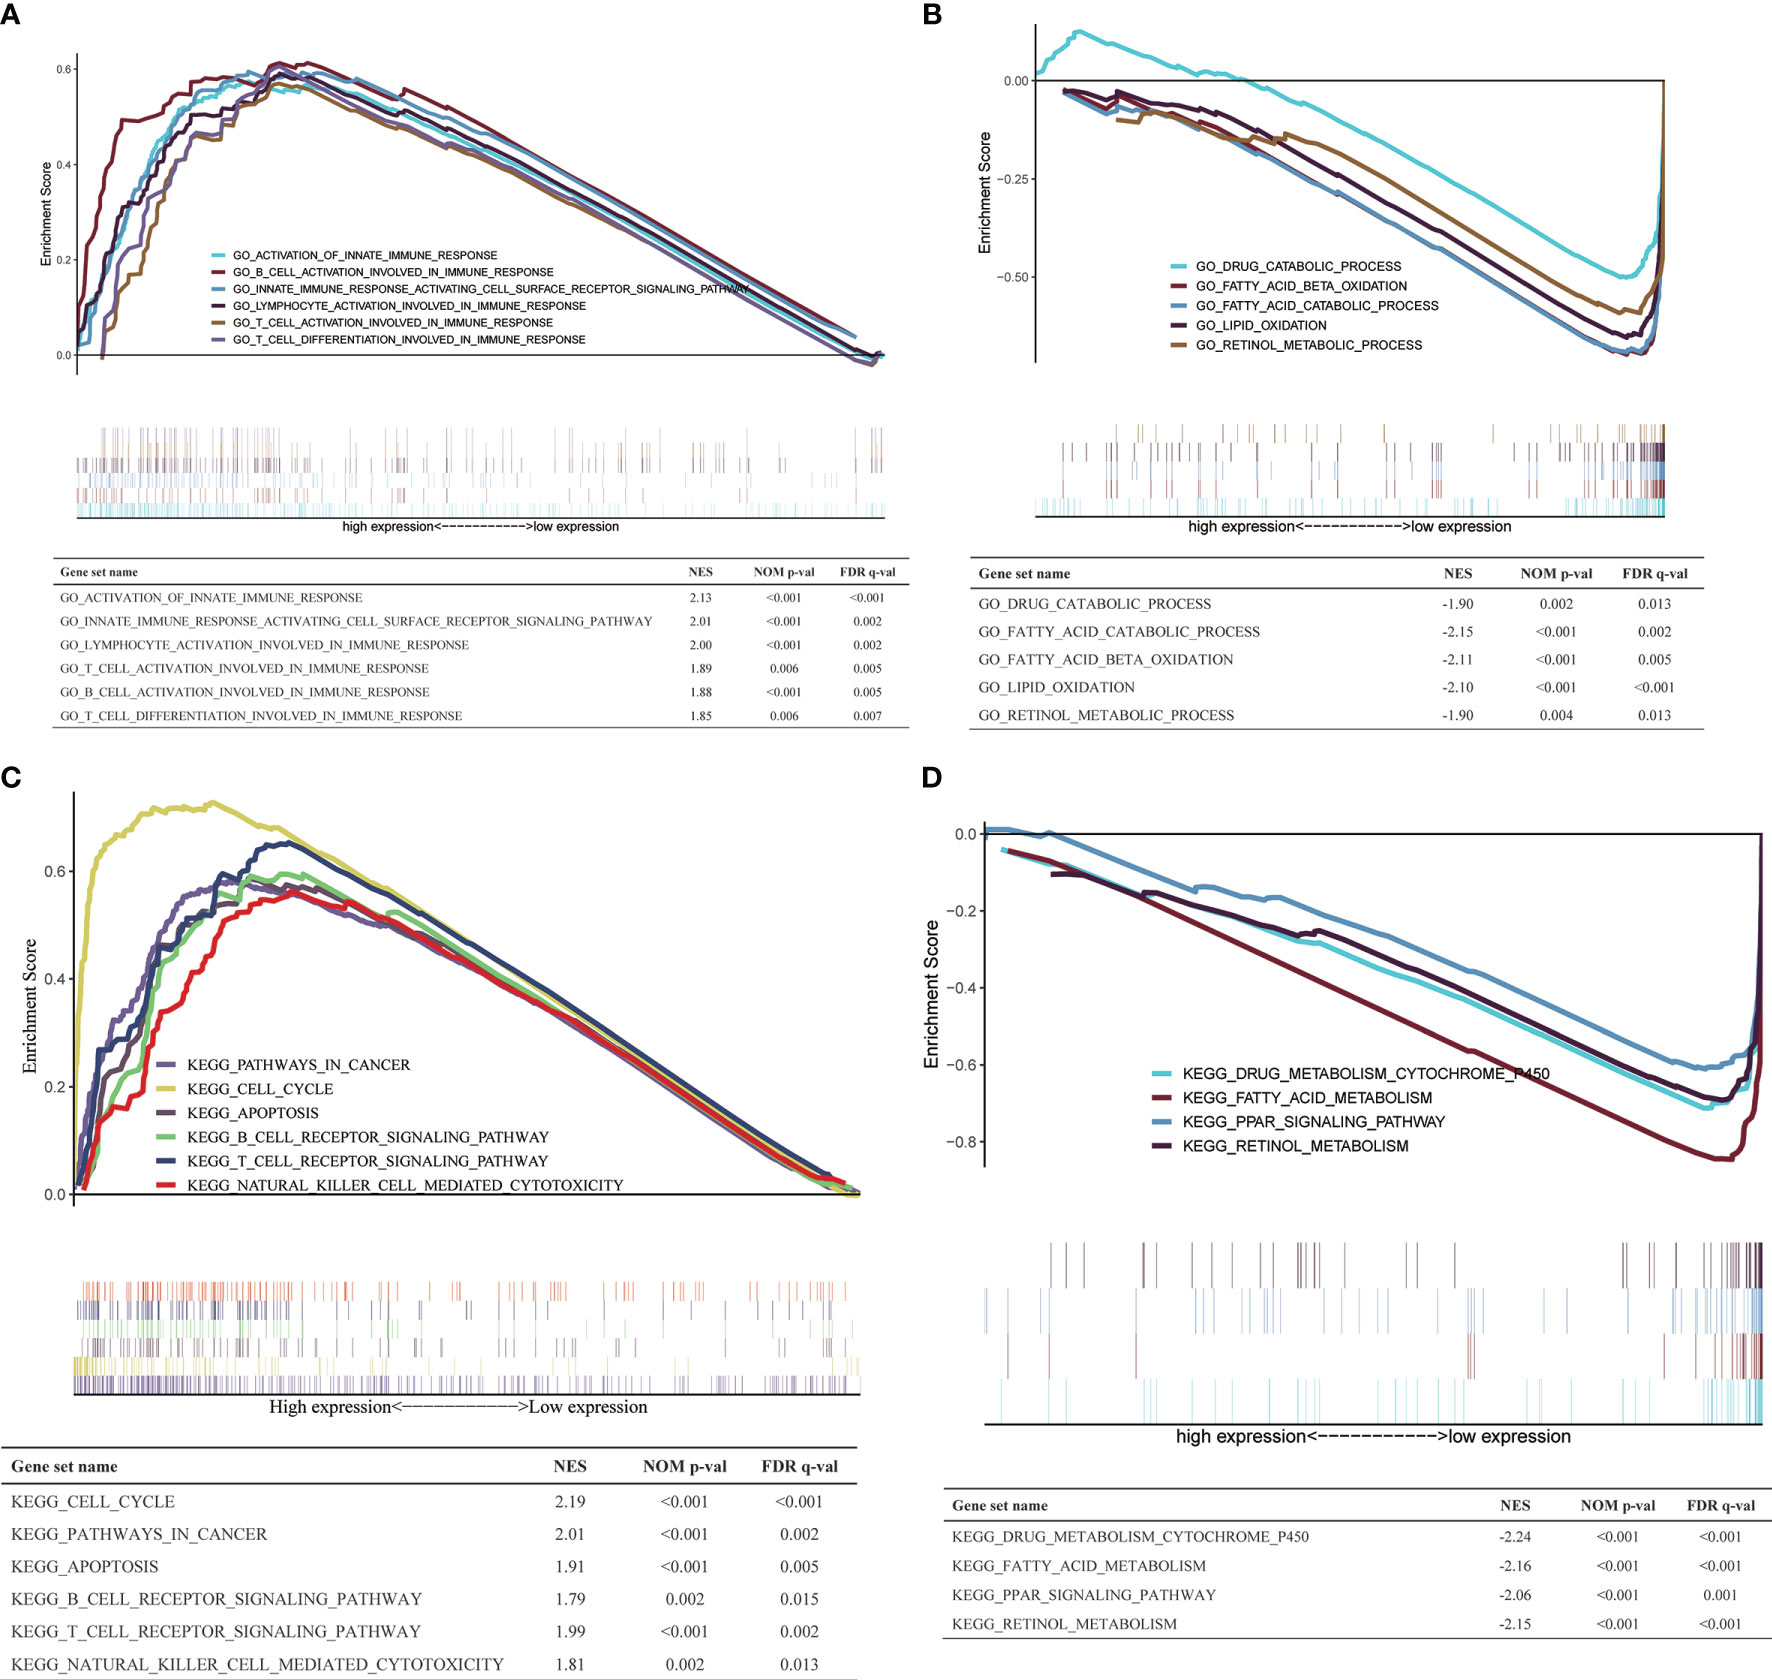
Figure 6 GSEA in TCGA-LIHC cohort. (A, B) The GO_BP annotations enriched in HCC patients with high/low H2AFY expression. (C, D) The KEGG pathways enriched in HCC patients with high/low H2AFY expression.
Association Between H2AFY Expression and Immune Infiltration
Then, we investigate the correlation between H2AFY expression and immune infiltration levels in HCC through TIMER database. The results revealed that a significant positive correlation between H2AFY expression and infiltration level of B cells (r = 0.441, P = 8.99e−18), CD8+ T cells (r = 0.292, P = 3.85e−08), CD4+ T cells (r = 0.442, P = 7.57e−18), Macrophages (r = 0.554, P = 8.38e−29), Neutrophils (r = 0.455, P = 4.84e−19), and Dendritic cells (r = 0.462, P = 2.34e−19) in HCC (Figure 7A). Moreover, the copy number alterations of H2AFY could affect the infiltration level of six dominant immune cells, especially high amplification (Figure 7B). Next, we comprehensively explored the correlation between H2AFY expression and related marker genes of various tumor-infiltrating immune cells in HCC tissues. Correlation analysis was adjusted by tumor purity. In line with the above results, the H2AFY expression was significantly correlated with most selected immune cell marker genes (Table 4).
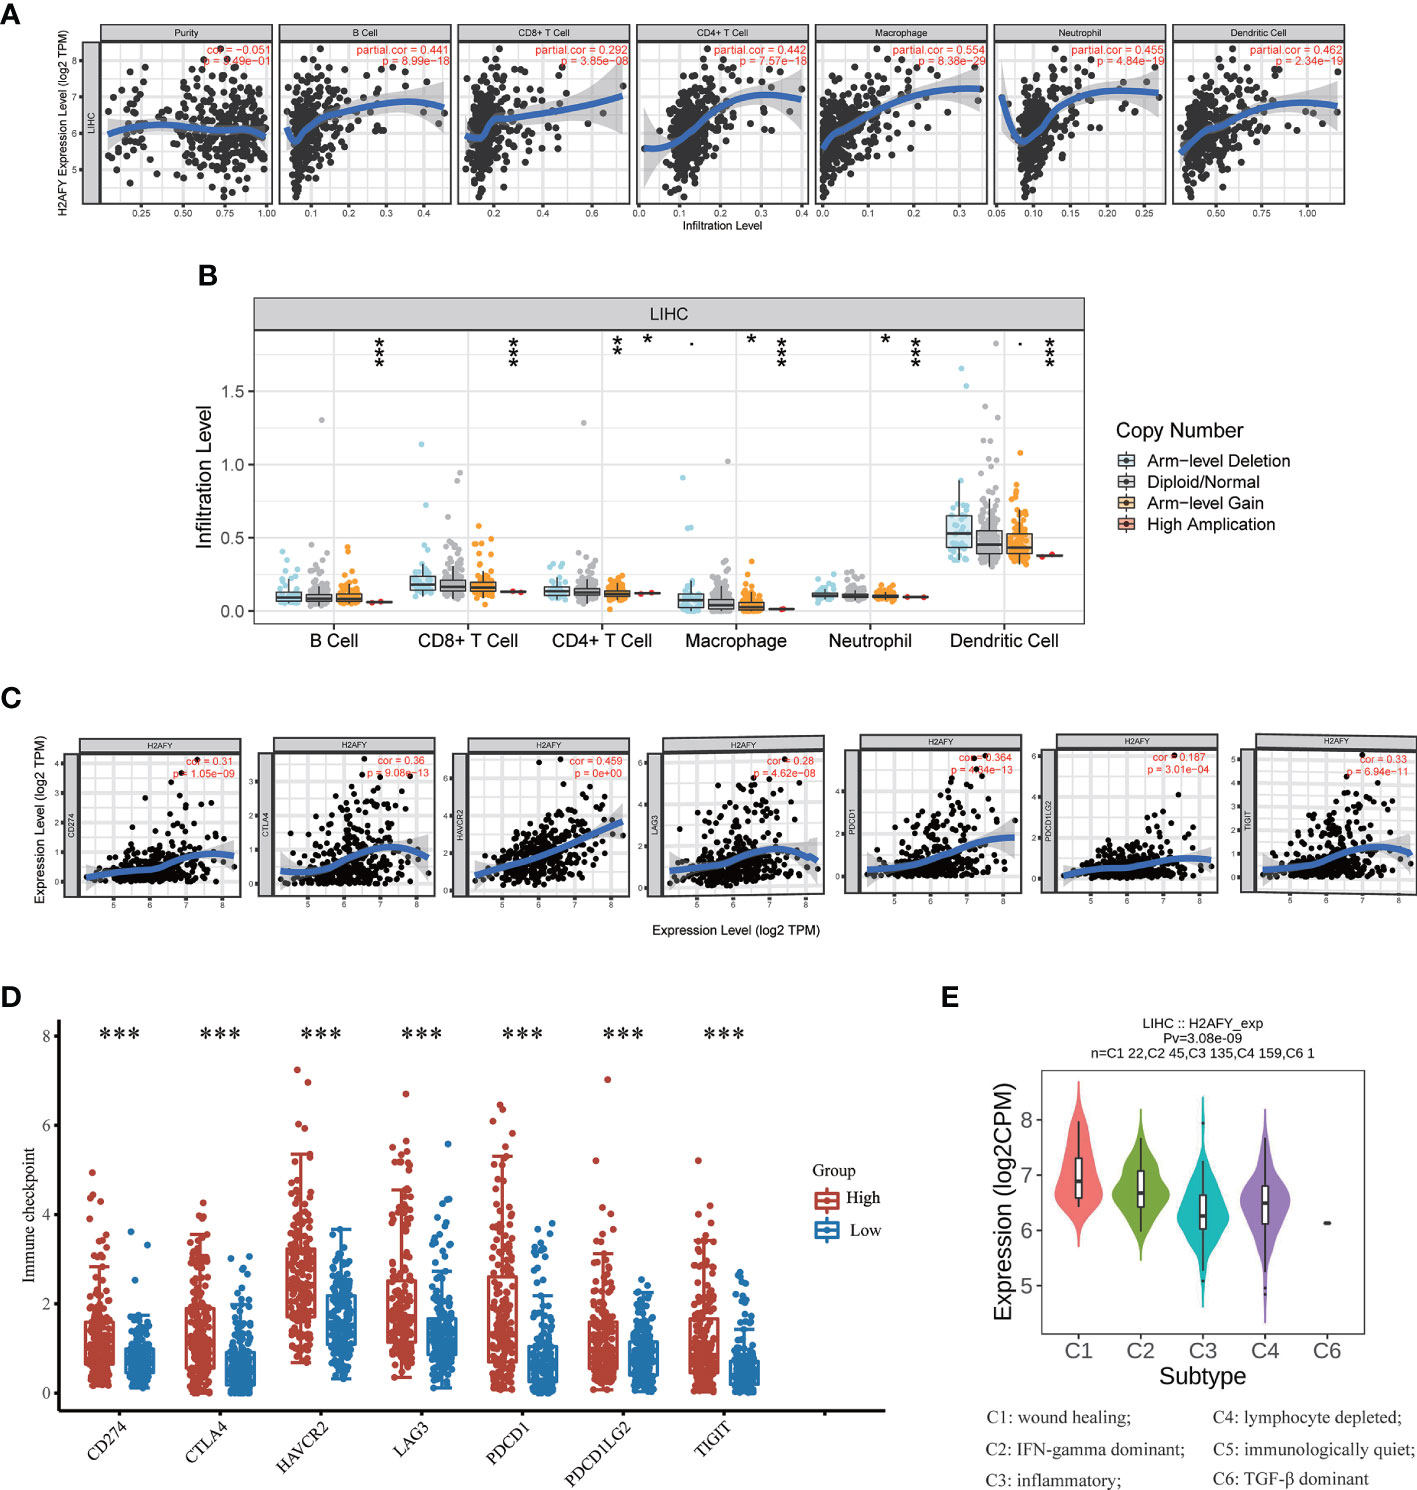
Figure 7 Correlations of H2AFY expression with immune infiltration in HCC. (A) Correlation analysis of H2AFY expression and abundance of immune cells in TIMER. (B) H2AFY copy number alterations affects the immune infiltration levels. (C) Correlations between the expression of H2AFY and several immune checkpoint genes. (D) The expression of several immune checkpoint genes between high- and low-H2AFY expression patients. (E) H2AFY expression in different immune subtypes of HCC (TISIDB database) *P < 0.05; **P < 0.01; ***P < 0.001.
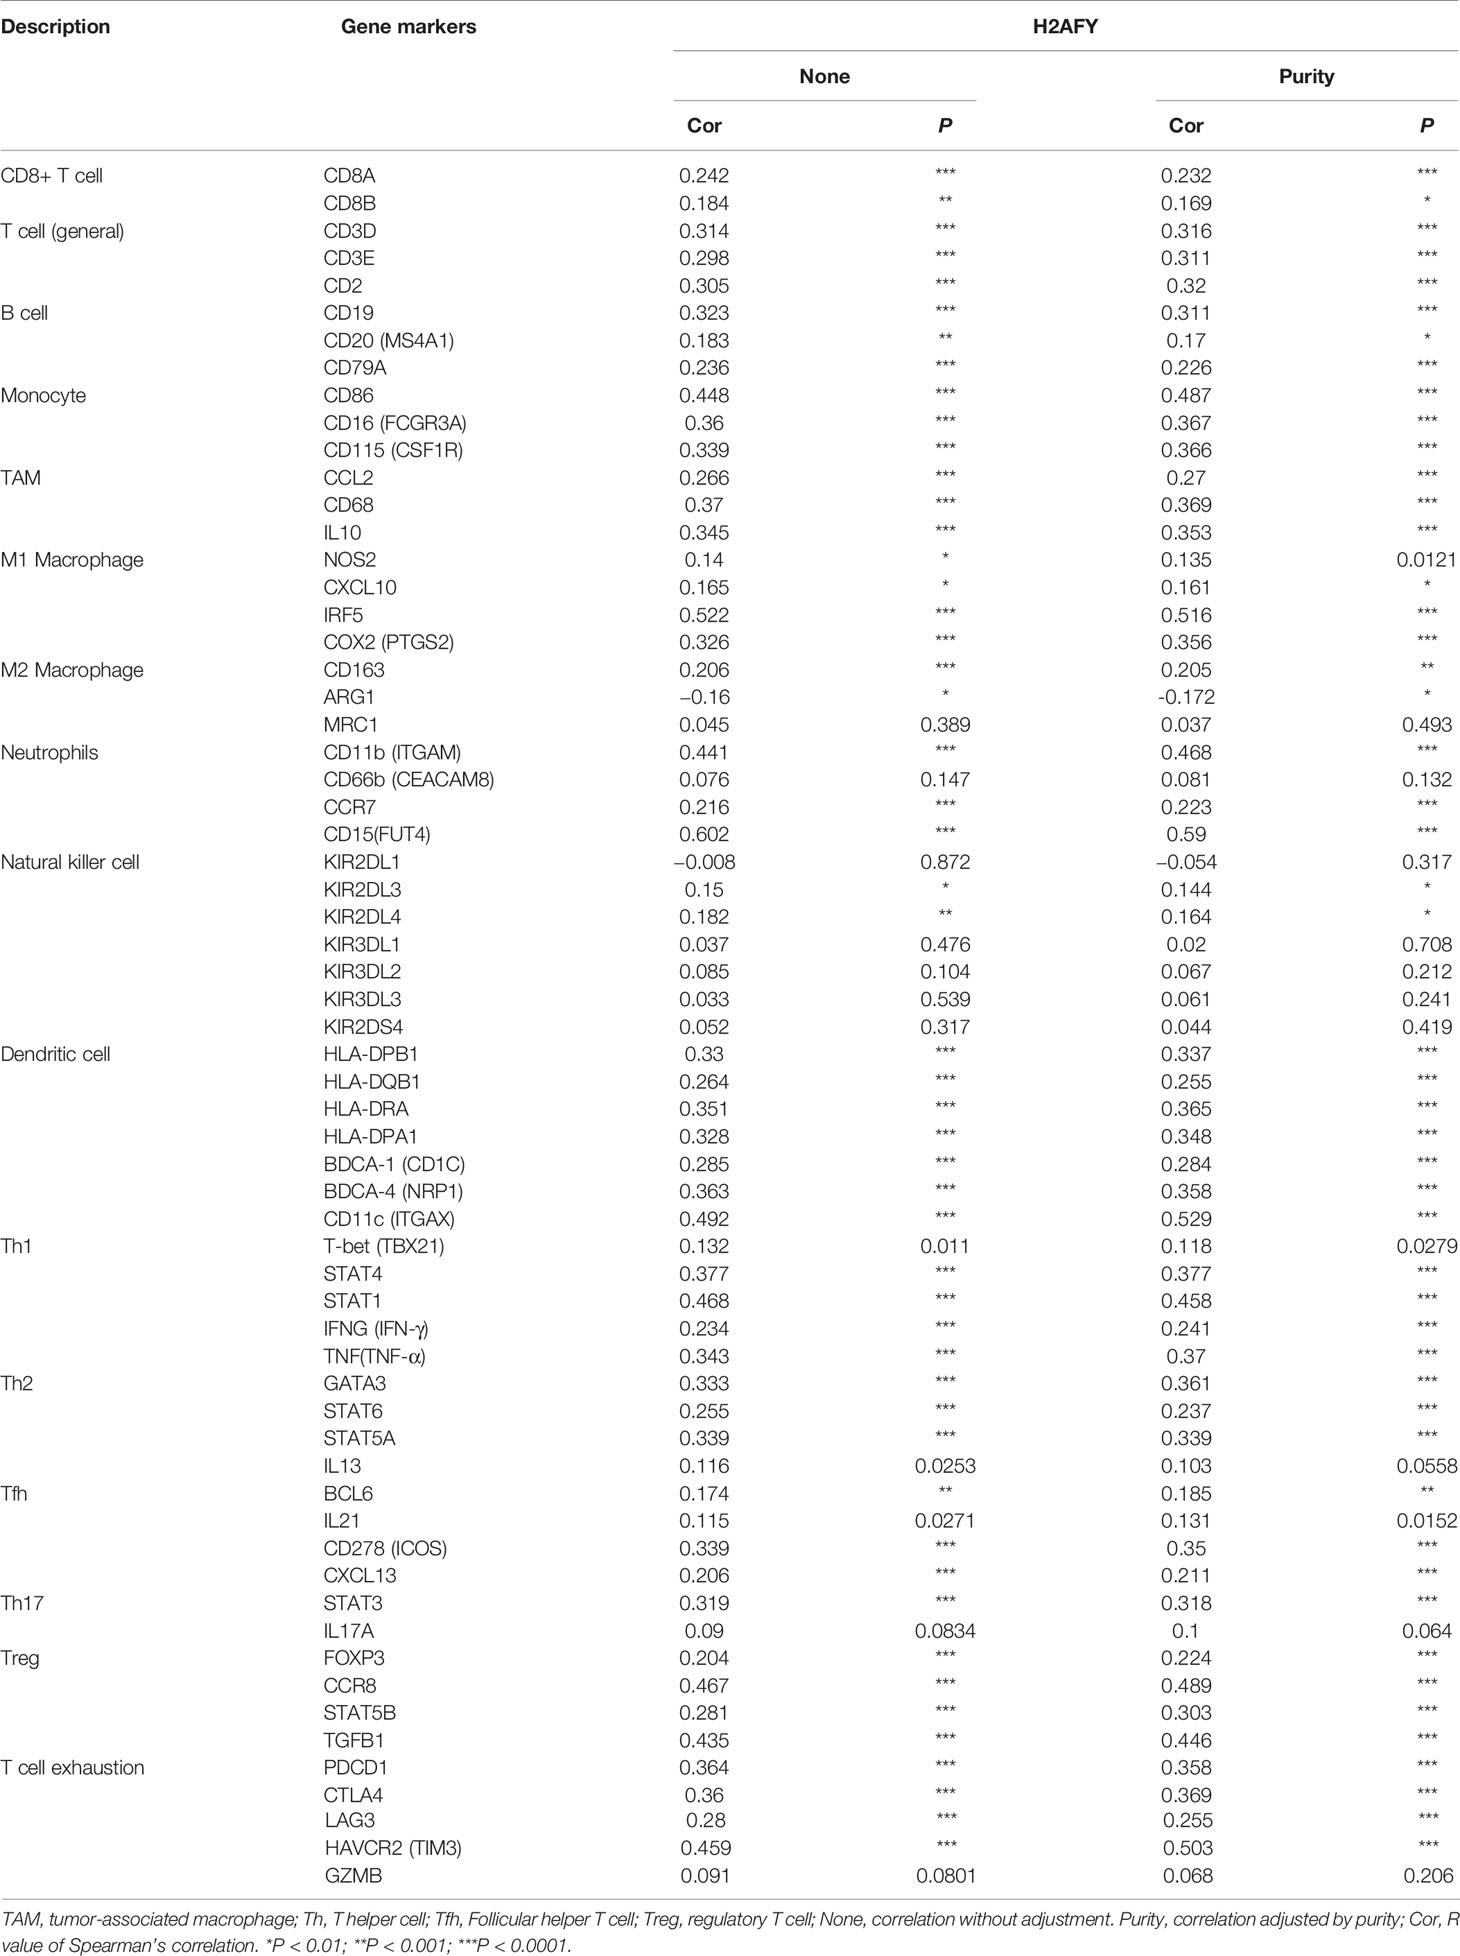
Table 4 Correlations between H2AFY and markers of immune infiltrates for HCC in TIMER.
Based on reported studies, immune checkpoint molecules expression level might be tightly linked to the efficacy of immune checkpoint inhibitors. Therefore, we further investigated the correlation of H2AFY and seven key immune checkpoint molecules to clarify the role of H2AFY in immune checkpoint blockade therapy for HCC patients. The results in TIMER database pointed out that H2AFY had a close correlation with CD274 (PD-L1), CTLA4, HAVCR2, LAG3, PDCD1, PDCD1LG2, and TIGIT (P <0.001, Figure 7C), and the correlation was validated in GEPIA2 database (Figure S3). Additionally, compared with low-H2AFY expression group, these immune checkpoint genes expression levels were also higher in high-H2AFY expression group (P <0.001, Figure 7D). We further explored the relationship of H2AFY expression and immune subtypes, as displayed in Figure 7E, H2AFY expression was significantly differently distributed between six immune subtypes.
The CIBERSORT method was further employed to understand the association between H2AFY expression with 22 immune cell types in TCGA-LIHC cohort. Figure 8A summarized the relative fraction of these immune cells in each HCC patient. Within and between groups, the relative fraction of each immune cell type varied in HCC (Figure 8B). We found that high-H2AFY expression patients presented significantly higher B cell memory, T cells CD4 memory active, T cells regulatory (Tregs), T cells follicular helper, T cells gamma delta, macrophages M0 and Dendritic cells resting proportions (P <0.05), and lower B cell naive, NK cell resting, NK cell active, Monocytes, macrophages M2, Mast cells resting (P <0.05, Figure 8C). All these findings suggested that H2AFY was closely related to immune infiltration, and H2AFY might be able to predict the response of HCC patients to immune checkpoint blockade therapy.
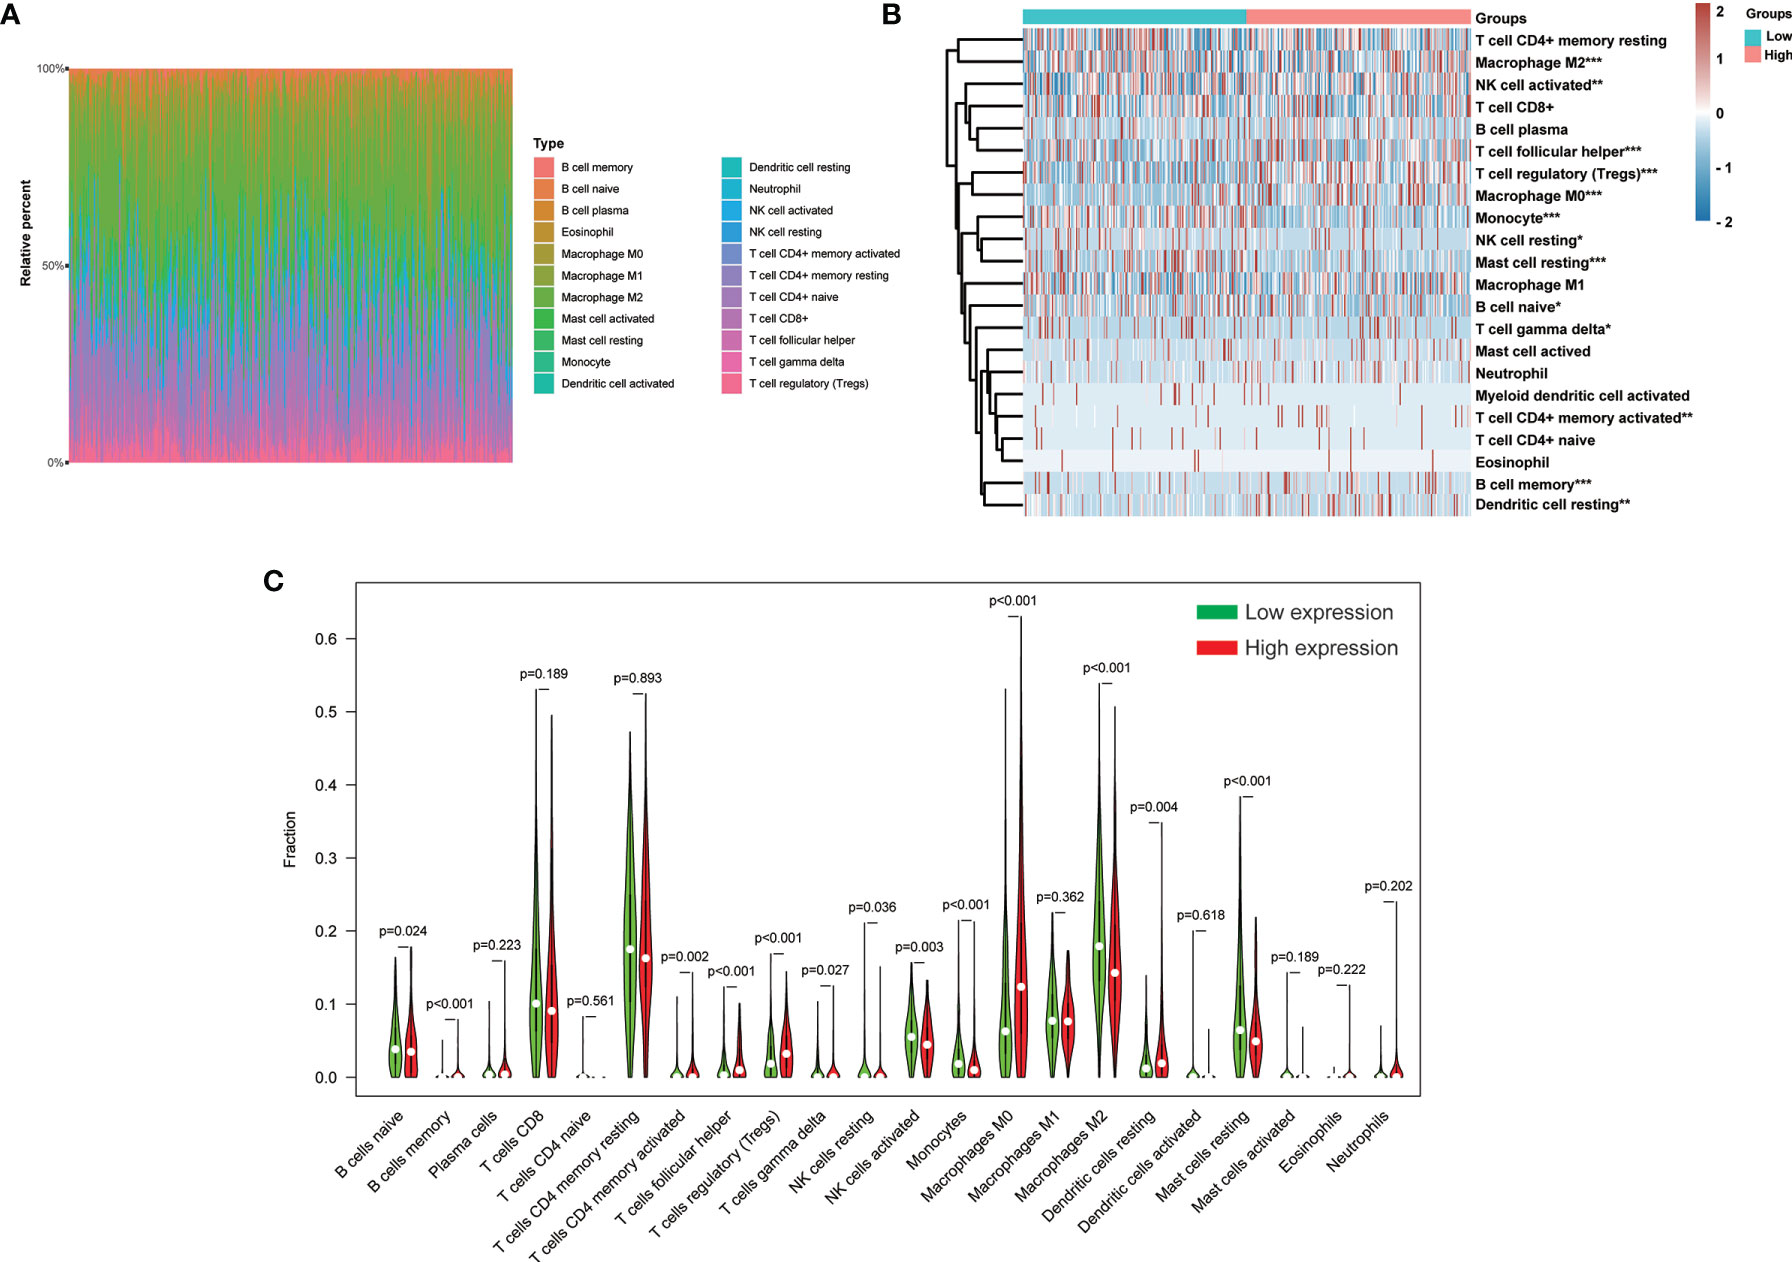
Figure 8 Correlation of H2AFY expression and 22 immune cell types in HCC based on CIBERSORT. (A) The relative fraction of 22 immune cell types in TCGA-LIHC cohort. (B) The heat map showing relative immune cell fraction of HCC patients (C) Violin plots showing the difference of 22 immune cell types between high- and low-H2AFY expression patients *P < 0.05; **P < 0.01; ***P < 0.001.
Effects of H2AFY Knockdown on Cell Proliferation and Apoptosis in HCC Cells In Vitro
The qRT-PCR assay was applied to detect H2AFY mRNA expression in different HCC cell lines. We found that H2AFY was also significantly overexpressed in HCC cell lines than normal liver cell line (Figure 9A), and selected HepG2 and Hep3B cell lines with relative higher H2AFY expression levels for subsequent experiments in vitro. H2AFY was knockdown in HepG2 and Hep3B cells by lentivirus transfection with shRNAs. Western blot assay examined the knockdown efficiency of shRNAs, the results showed that both shRNAs effectively inhibited H2AFY protein expression compared with negative control (NC) shRNA (Figure 9B). ShRNA-2 targeting H2AFY was used for the subsequent investigation.
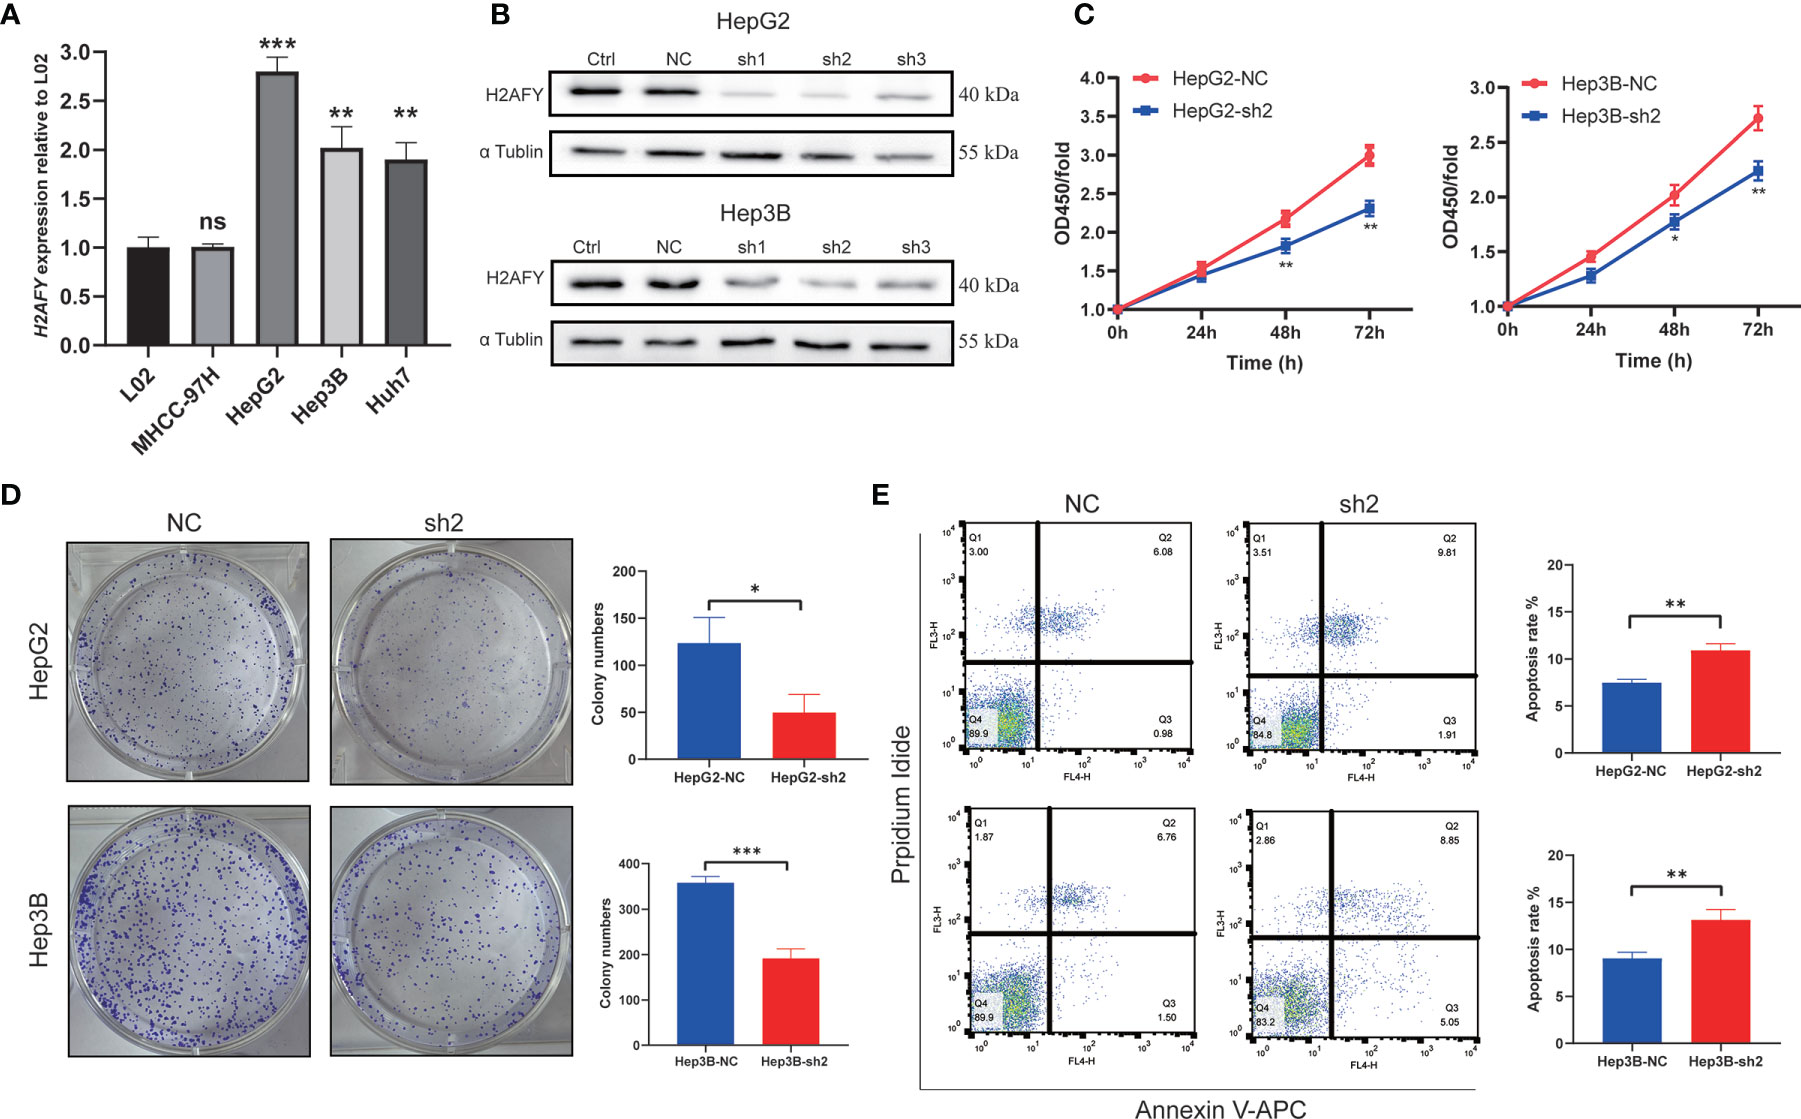
Figure 9 Effects of H2AFY knockdown on cell proliferation and apoptosis in HCC cells. (A) H2AFY mRNA expression in normal liver cell line (L02) and several HCC cell lines. (B) Evaluation of H2AFY expression in HepG2 and Hep3B cells after shRNA transfection. (C) The effect of H2AFY knockdown on cell proliferation in HepG2 and Hep3B cells examined by CCK8 assay and (D) colony formation assay. (E) The effect of H2AFY knockdown on cell apoptosis in HepG2 and Hep3B cells examined by flow cytometry ns, no significance; *P < 0.05; **P < 0.01; ***P < 0.001.
The CCK8 assays were performed to explore the effect of H2AFY knockdown HCC cell proliferation, and the results revealed that the proliferation of HepG2 and Hep3B cells was significantly decreased after H2AFY knockdown (Figure 9C). Further colony formation assays suggested that H2AFY downregulation dramatically suppressed colony formation in both HepG2 and Hep3B cell lines (P <0.05, Figure 9D). In addition, the cell apoptosis was detected by flow cytometry, and H2AFY knockdown markedly enhanced the cell apoptosis in HepG2 and Hep3B cells (Figure 9E).
Effects of H2AFY Knockdown on Cell Cycle, Migration and anti-T-Cells Killing Ability in HCC Cells In Vitro
The preceding results indicated that H2AFY may be involved in the cell cycle process, we therefore performed cell cycle analysis using flow cytometry. As showcased in Figure 10A, the H2AFY downregulation resulted in G1/S phase arrest, the percentage of cells in G1 phase significantly increased and the proportion of cells in S phase decreased in both HepG2 and Hep3B cells (P <0.05). Subsequently, to investigate the impacts of the H2AFY knockdown on HCC cell migration ability, wound-healing and transwell assays was performed to measure the migration ability following H2AFY knockdown. These assays revealed that H2AFY knockdown drastically decreased the migration ability of HepG2 and Hep3B cells, compared to NC group (Figures 10B–D). We next conducted T-cells-mediated cancer killing assay to detect the effect of H2AFY knockdown in HCC cells on anti-T-cells killing ability (36). We found that H2AFY knockdown significantly reduced the survival of HCC cells than those with NC after co-culturing with activated Jurkat cells (Figure S4). Besides, we also detected the expression of cell cycle, apoptosis and EMT related molecular markers in HCC cells with H2AFY knockdown. As expected, we observed that the expression levels of Cyclin B1, Cyclin D1, Bcl-2, and Vimentin showed significantly downward trends after suppressing H2AFY in HepG2 and Hep3B cells. Conversely, the expression of E-cadherin was significantly upregulated in HCC cells transfected with H2AFY-shRNA (Figure 10E).
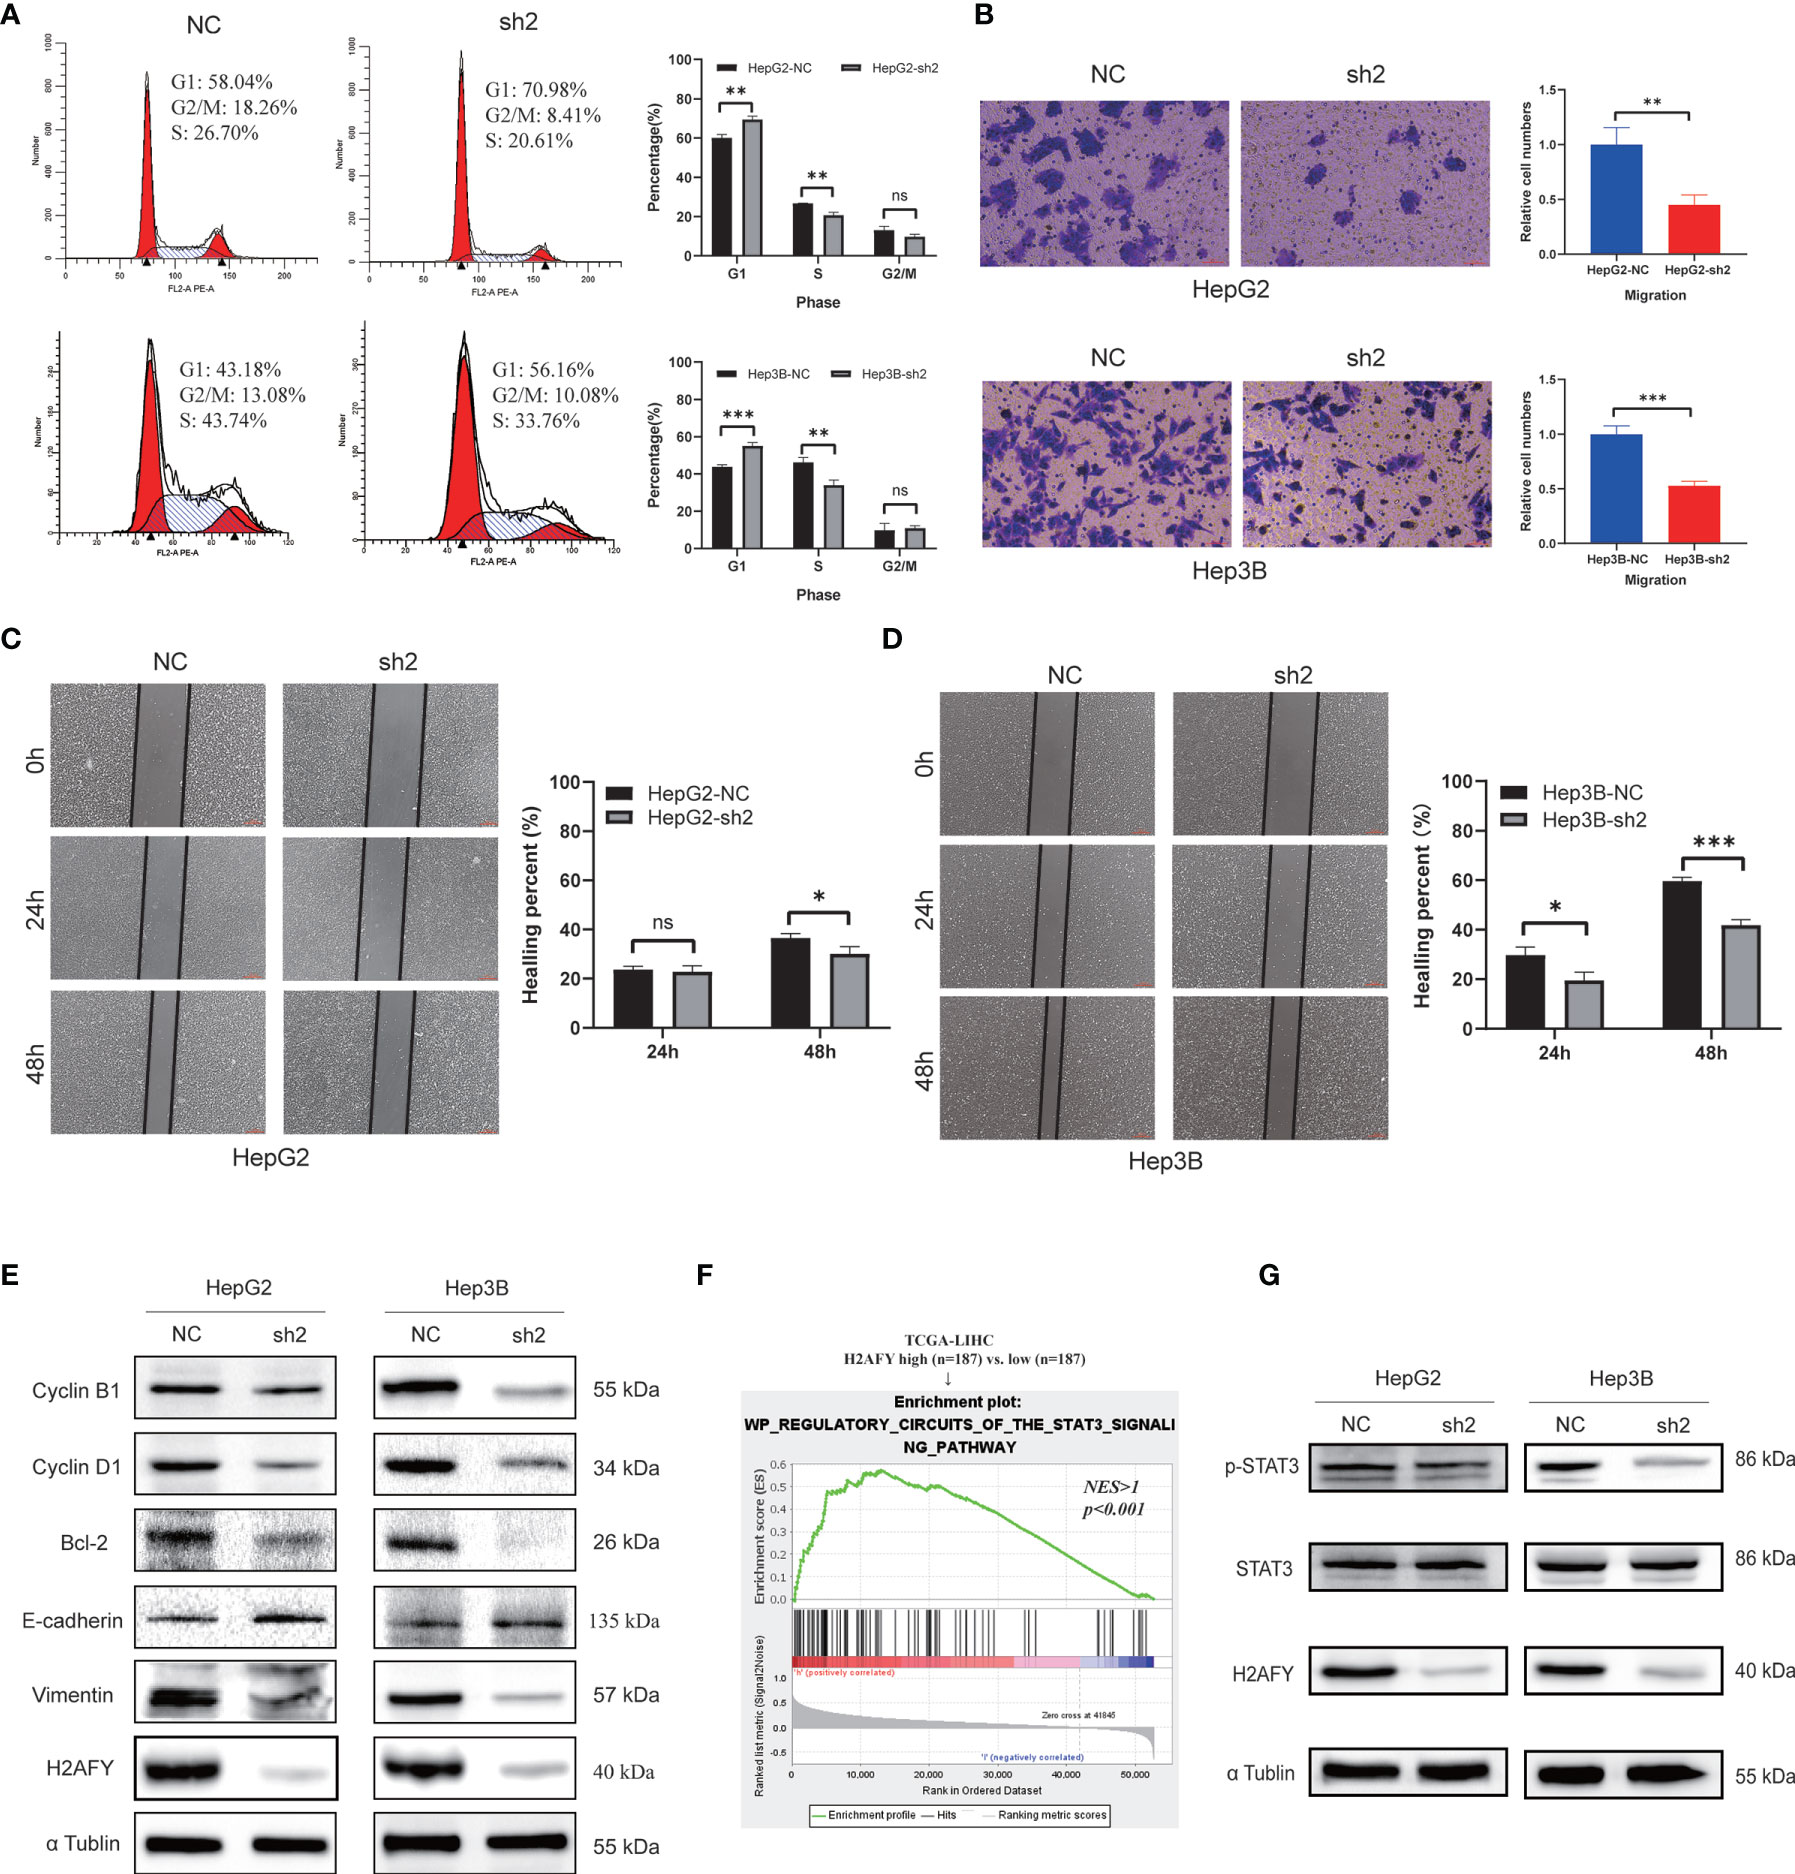
Figure 10 Effects of H2AFY knockdown on cell cycle and migration in HCC cells. (A) Cell cycle detected by flow cytometry in HepG2 and Hep3B cells after H2AFY knockdown. (B–D) Representative images of transwell (200×) and wound healing assays (40×) in HepG2 and Hep3B cells, and the quantitative result following H2AFY knockdown. (E) Western blot analysis of cell cycle, apoptosis, EMT related molecular markers in HepG2 and Hep3B cells transfected with H2AFY-shRNA or the negative control. (F) STAT3 signaling pathway was significantly enriched in high-H2AFY expression patients. (G) Evaluation of p-STAT3 and STAT3 expression in HepG2 and Hep3B cells after transfecting H2AFY-shRNA ns, no significance; *P < 0.05; **P < 0.01; ***P < 0.001.
Moreover, we noticed that H2AFY expression was positively correlated with STAT3 signaling pathway among the various pathways revealed by GSEA (Figure 10F). Some previous studies have demonstrated that the STAT3 signaling pathway was activated in HCC and associated with multiple malignant biological behaviors of HCC (37, 38). Therefore, we examined whether H2AFY might affect STAT3 signaling pathway activation in HCC cells. Western blot results indicated that H2AFY knockdown decreased the expression of phosphorylated STAT3 and inhibited STAT3 signaling pathway activation (Figure 10G). Overall, these results illustrated that H2AFY knockdown inhibited HCC progression at least partly via regulating STAT3 signaling.
Discussion
The H2AFY gene encodes for macroH2A1, a histone variant of the histone H2A that have been reported to be dysregulated in various human cancers (39, 40). Several prior published studies indicate that the decreased expression level of H2AFY was inversely correlated with cell proliferation and function as a marker for poor prognosis in lung cancer and colon cancer (14, 41). By contrast, H2AFY promoted cancer cell proliferation by interacting with HER2 and higher expression of H2AFY was associated with worse prognosis in triple-negative breast cancer (18, 19). Additionally, the expression H2AFY was reduced in metastatic cutaneous melanomas compared to benign nevi, and the loss of H2AFY promoted proliferation and migration of cutaneous melanoma cells through regulation of CDK8 (17, 42). Interestingly, however, contrary to cutaneous melanoma, the metastatic uveal melanoma has been reported to have a higher H2AFY expression level than non-metastatic uveal melanoma, and H2AFY silencing decreases the invasiveness of uveal melanoma cells by reducing mitochondrial metabolism (43). These proofs of evidence suggest that H2AFY exhibits either oncogenic function or tumor suppressor function in different tumor types, which seems to depend on the context and genetic background of the specific tumor studied. To understand more details about the potential functions and regulatory network of H2AFY in HCC, we conducted a series of bioinformatics analyses and experiments in vitro to provide new insights for HCC.
In this study, we first investigated the expression of H2AFY in HCC, and found that H2AFY mRNA expression was prominently upregulated in HCC compared to normal tissues across various public databases. Clinical association analyses demonstrated that increased H2AFY expression was correlated with higher histological grade, more advanced clinical stage and larger tumor size. Besides, we also found several genetic alterations of H2AFY in HCC, mainly amplification and missense mutation. Kaplan–Meier and Cox regression analyses further revealed that high H2AFY expression was an independent risk factor to predict poor OS for HCC patients. Therefore, our findings demonstrated that H2AFY could act as a potential diagnostic or prognostic biomarker for HCC and deserves further clinical verification.
Next, we explored the co-expression network of H2AFY and identified multiple genes co-expressed with H2AFY, which were further used for GO and KEGG enrichment analyses. The result displayed that the enrichment primarily associated with cell cycle, chromatin, mitosis, and spliceosome, and H2AFY may affect cell cycle and mitosis progression through these factors. The regulators responsible for H2AFY dysregulation were explored in HCC, and the kinase networks related to H2AFY were found, namely, PLK1, CDK1, CHEK1, AURKB, and CDK2. These kinases could regulate mitosis, cell cycle, and genome stability. All these kinase genes, except CDK2, were found to be significantly highly expressed in HCC and related to the poor OS of patients with HCC. PKL1 is a key regulator for the cell cycle progression, the main function of PLK1 is to control mitotic entry and maintain genomic stability in mitosis and DNA damage response (44). Studies have revealed the role of PLK1 in most human cancers, and established a causal association between PLK1 and hepatocarcinogenesis (45). The activity of CDK1 is often enhanced in cancer cells, it therefore has been considered as an appealing specific anti-cancer target (46). Multiple inhibitors targeting CDK1 have been developed and have entered early clinical trials for some malignancies (47). AURKB plays a crucial role for the cell cycle transition from G2 to M phase (48). In HCC, H2AFY may regulate cell cycle progression, mitosis and chromatin assembly via these interacted kinases. We also identified that the main transcription factor targets of H2AFY were E2F family members. E2F transcription factors are involved in cell cycle regulation and DNA synthesis, and the oncogenic role of the E2Fs has been reported in previous studies (49, 50). However, no miRNA targets significantly associated with H2AFY were identified, possibly because H2AFY participates in mRNA splicesome. Our results demonstrated that E2F1 is a pivotal regulator of H2AFY, and H2AFY might regulate the cell cycle and proliferation of HCC through this factor.
Furthermore, we observed many immune-related pathways significantly gathered in high-H2AFY expression phenotype, such as activation of innate immune response, lymphocyte activation of immune response, B-cell receptor signaling pathway, and T-cell receptor signaling pathway. Previous studies have manifested that infiltrating immune cells in tumor microenvironment play a major role in tumor development and metastasis, thus affecting the prognosis of cancer patients (51, 52). Recently, immunotherapeutic strategies especially immune checkpoint blockade therapy, have been considered as promising options for the treatment of various malignancies, including HCC (53, 54). Therefore, the exploration of novel immune biomarkers or immunotherapeutic targets for HCC is clinically significant. Here, we revealed a correlation between H2AFY expression and immune infiltration in HCC. H2AFY expression showed significantly positive correlations with the expression of various immune cell marker genes and immune checkpoint molecules such as PD-L1 and CTLA4. Additionally, the high-H2AFY expression patients have higher expression of these immune checkpoint genes than low-H2AFY expression patients. The upregulated PD-L1 expression is found to be associated with poor prognosis of patients with HCC, and it was an appealing immunotherapeutic target for HCC. Together, these results suggested that H2AFY may exert a vital role in modulating tumor immunity, and serve as a potential biomarker related to immune infiltration in HCC.
Furthermore, a series of functional assays in vitro verified the role of H2AFY in HCC by downregulating the H2AFY expression. The results showed that H2AFY knockdown suppressed the cell proliferation, migration and promoted apoptosis of HCC cells in vitro. In addition, we observed an increased proportion of HCC cells in G1 phase and a decreased proportion in S phase after H2AFY knockdown. The STAT3 signaling was activated in many cancers, its activation has been found to promote HCC progression (55–57). H2AFY knockdown also downregulated the phosphorylated STAT3 expression in HCC cells, and the result showed that H2AFY knockdown inhibited HCC malignant progression at least partly via regulating STAT3 signaling.
Nonetheless, several limitations in our study should be recognized. First, our finding is based on retrospective data from public databases, more prospective data and larger HCC cohorts were required to confirm its clinical suitability. Second, the role of H2AFY in tumor immune infiltration needs to be further validated in vitro or in vivo. Finally, we have demonstrated that H2AFY could regulate STAT3 signaling in HCC, but the detailed regulatory mechanism requires more functional studies to elucidate in future. Our findings should be taken with these limitations for interpretation.
In general, our study provided multi-level evidence for H2AFY as a potential biomarker and prognostic predictor for HCC. These results revealed that H2AFY was upregulated in HCC and its high expression was associated with poor prognosis of HCC patients. Moreover, H2AFY has a significantly positive correlation with immune infiltration in HCC.
Data Availability Statement
The original contributions presented in the study are included in the article/Supplementary Material. Further inquiries can be directed to the corresponding author.
Author Contributions
YH designed the study and wrote the manuscript. SH, LM, XW, LX, WQ, LL, and YW participated in data preparation and figure preparation. SH revised the manuscript. XY reviewed the manuscript. All authors contributed to the article and approved the submitted version.
Funding
This study was supported by National Natural Science Foundation of China (2018, 81773360).
Conflict of Interest
The authors declare that the research was conducted in the absence of any commercial or financial relationships that could be construed as a potential conflict of interest.
Publisher’s Note
All claims expressed in this article are solely those of the authors and do not necessarily represent those of their affiliated organizations, or those of the publisher, the editors and the reviewers. Any product that may be evaluated in this article, or claim that may be made by its manufacturer, is not guaranteed or endorsed by the publisher.
Acknowledgments
We acknowledge the following databases, TCGA (https://portal.gdc.cancer.gov/), ICGC (https://icgc.org/), Oncomine (www.oncomine.org), TIMER (https://cistrome.shinyapps.io/timer/), HCCDB (http://lifeome.net/database/hccdb/home.html), cBioPortal (http://www.cbioportal.org/), COSMIC (https://cancer.sanger.ac.uk/cosmic), GEPIA2 (http://gepia2.cancer-pku.cn/), Kaplan–Meier Plotter (http://kmplot.com), GeneMANIA (https://genemania.org/), LinkedOmics (http://linkedomics.org/login.php), and TISIDB (http://cis.hku.hk/TISIDB/index.php).
Supplementary Material
The Supplementary Material for this article can be found online at: https://www.frontiersin.org/articles/10.3389/fimmu.2021.723293/full#supplementary-material
References
1. Llovet JM, Zucman-Rossi J, Pikarsky E, Sangro B, Schwartz M, Sherman M, et al. Hepatocellular Carcinoma. Nat Rev Dis Primers (2016) 2:16018. doi: 10.1038/nrdp.2016.18
2. Bray F, Ferlay J, Soerjomataram I, Siegel RL, Torre LA, Jemal A. Global Cancer Statistics 2018: GLOBOCAN Estimates of Incidence and Mortality Worldwide for 36 Cancers in 185 Countries. CA Cancer J Clin (2018) 68:394–424. doi: 10.3322/caac.21492
3. Forner A, Reig M, Bruix J. Hepatocellular Carcinoma. Lancet (2018) 391:1301–14. doi: 10.1016/S0140-6736(18)30010-2
4. Bruix J, Gores GJ, Mazzaferro V. Hepatocellular Carcinoma: Clinical Frontiers and Perspectives. Gut. (2014) 63:844–55. doi: 10.1136/gutjnl-2013-306627
5. Zhu ZX, Huang JW, Liao MH, Zeng Y. Treatment Strategy for Hepatocellular Carcinoma in China: Radiofrequency Ablation Versus Liver Resection. Jpn J Clin Oncol (2016) 46:1075–80. doi: 10.1093/jjco/hyw134
6. Schlachterman A, Craft WJ, Hilgenfeldt E, Mitra A, Cabrera R. Current and Future Treatments for Hepatocellular Carcinoma. World J Gastroenterol (2015) 21:8478–91. doi: 10.3748/wjg.v21.i28.8478
7. Koch A, Joosten SC, Feng Z, de Ruijter TC, Draht MX, Melotte V, et al. Analysis of DNA Methylation in Cancer: Location Revisited. Nat Rev Clin Oncol (2018) 15:459–66. doi: 10.1038/s41571-018-0004-4
8. He L, Li H, Wu A, Peng Y, Shu G, Yin G. Functions of N6-Methyladenosine and its Role in Cancer. Mol Cancer (2019) 18:176. doi: 10.1186/s12943-019-1109-9
9. Vardabasso C, Hasson D, Ratnakumar K, Chung CY, Duarte LF, Bernstein E. Histone Variants: Emerging Players in Cancer Biology. Cell Mol Life Sci (2014) 71:379–404. doi: 10.1007/s00018-013-1343-z
10. Hammond CM, Stromme CB, Huang H, Patel DJ, Groth A. Histone Chaperone Networks Shaping Chromatin Function. Nat Rev Mol Cell Biol (2017) 18:141–58. doi: 10.1038/nrm.2016.159
11. Buschbeck M, Hake SB. Variants of Core Histones and Their Roles in Cell Fate Decisions, Development and Cancer. Nat Rev Mol Cell Biol (2017) 18:299–314. doi: 10.1038/nrm.2016.166
12. Martire S, Banaszynski LA. The Roles of Histone Variants in Fine-Tuning Chromatin Organization and Function. Nat Rev Mol Cell Biol (2020) 21:522–41. doi: 10.1038/s41580-020-0262-8
13. Kozlowski M, Corujo D, Hothorn M, Guberovic I, Mandemaker IK, Blessing C, et al. MacroH2A Histone Variants Limit Chromatin Plasticity Through Two Distinct Mechanisms. EMBO Rep (2018) 19:e44445. doi: 10.15252/embr.201744445
14. Sporn JC, Kustatscher G, Hothorn T, Collado M, Serrano M, Muley T, et al. Histone Macroh2a Isoforms Predict the Risk of Lung Cancer Recurrence. Oncogene (2009) 28:3423–8. doi: 10.1038/onc.2009.26
15. Park SJ, Shim JW, Park HS, Eum DY, Park MT, Mi YJ, et al. MacroH2A1 Downregulation Enhances the Stem-Like Properties of Bladder Cancer Cells by Transactivation of Lin28B. Oncogene (2016) 35:1292–301. doi: 10.1038/onc.2015.187
16. Novikov L, Park JW, Chen H, Klerman H, Jalloh AS, Gamble MJ. QKI-Mediated Alternative Splicing of the Histone Variant MacroH2A1 Regulates Cancer Cell Proliferation. Mol Cell Biol (2011) 31:4244–55. doi: 10.1128/MCB.05244-11
17. Kapoor A, Goldberg MS, Cumberland LK, Ratnakumar K, Segura MF, Emanuel PO, et al. The Histone Variant Macroh2a Suppresses Melanoma Progression Through Regulation of CDK8. Nature (2010) 468:1105–9. doi: 10.1038/nature09590
18. Broggi G, Filetti V, Ieni A, Rapisarda V, Ledda C, Vitale E, et al. MacroH2A1 Immunoexpression in Breast Cancer. Front Oncol (2020) 10:1519. doi: 10.3389/fonc.2020.01519
19. Li X, Kuang J, Shen Y, Majer MM, Nelson CC, Parsawar K, et al. The Atypical Histone Macroh2a1.2 Interacts With HER-2 Protein in Cancer Cells. J Biol Chem (2012) 287:23171–83. doi: 10.1074/jbc.M112.379412
20. Rappa F, Greco A, Podrini C, Cappello F, Foti M, Bourgoin L, et al. Immunopositivity for Histone Macroh2a1 Isoforms Marks Steatosis-Associated Hepatocellular Carcinoma. PloS One (2013) 8:e54458. doi: 10.1371/journal.pone.0054458
21. Ma X, Ding Y, Zeng L. The Diagnostic and Prognostic Value of H2AFY in Hepatocellular Carcinoma. BMC Cancer (2021) 21:418. doi: 10.1186/s12885-021-08161-4
22. Chen J, Liao Y, Fan X. Prognostic and Clinicopathological Value of BUB1B Expression in Patients With Lung Adenocarcinoma: A Meta-Analysis. Expert Rev Anticancer Ther (2021) 21:795–803. doi: 10.1080/14737140.2021.1908132
23. Rhodes DR, Yu J, Shanker K, Deshpande N, Varambally R, Ghosh D, et al. ONCOMINE: A Cancer Microarray Database and Integrated Data-Mining Platform. Neoplasia (2004) 6:1–6. doi: 10.1016/s1476-5586(04)80047-2
24. Li T, Fan J, Wang B, Traugh N, Chen Q, Liu JS, et al. TIMER: A Web Server for Comprehensive Analysis of Tumor-Infiltrating Immune Cells. Cancer Res (2017) 77:e108–10. doi: 10.1158/0008-5472.CAN-17-0307
25. Lian Q, Wang S, Zhang G, Wang D, Luo G, Tang J, et al. HCCDB: A Database of Hepatocellular Carcinoma Expression Atlas. Genomics Proteomics Bioinf (2018) 16:269–75. doi: 10.1016/j.gpb.2018.07.003
26. Gao J, Aksoy BA, Dogrusoz U, Dresdner G, Gross B, Sumer SO, et al. Integrative Analysis of Complex Cancer Genomics and Clinical Profiles Using the Cbioportal. Sci Signal (2013) 6:pl1. doi: 10.1126/scisignal.2004088
27. Forbes SA, Beare D, Gunasekaran P, Leung K, Bindal N, Boutselakis H, et al. COSMIC: Exploring the World's Knowledge of Somatic Mutations in Human Cancer. Nucleic Acids Res (2015) 43:D805–11. doi: 10.1093/nar/gku1075
28. Nagy A, Munkacsy G, Gyorffy B. Pancancer Survival Analysis of Cancer Hallmark Genes. Sci Rep (2021) 11:6047. doi: 10.1038/s41598-021-84787-5
29. Tang Z, Kang B, Li C, Chen T, Zhang Z. GEPIA2: An Enhanced Web Server for Large-Scale Expression Profiling and Interactive Analysis. Nucleic Acids Res (2019) 47:W556–60. doi: 10.1093/nar/gkz430
30. Franz M, Rodriguez H, Lopes C, Zuberi K, Montojo J, Bader GD, et al. GeneMANIA Update 2018. Nucleic Acids Res (2018) 46:W60–4. doi: 10.1093/nar/gky311
31. Vasaikar SV, Straub P, Wang J, Zhang B. LinkedOmics: Analyzing Multi-Omics Data Within and Across 32 Cancer Types. Nucleic Acids Res (2018) 46:D956–63. doi: 10.1093/nar/gkx1090
32. Subramanian A, Tamayo P, Mootha VK, Mukherjee S, Ebert BL, Gillette MA, et al. Gene Set Enrichment Analysis: A Knowledge-Based Approach for Interpreting Genome-Wide Expression Profiles. Proc Natl Acad Sci USA (2005) 102:15545–50. doi: 10.1073/pnas.0506580102
33. Ru B, Wong CN, Tong Y, Zhong JY, Zhong S, Wu WC, et al. TISIDB: An Integrated Repository Portal for Tumor-Immune System Interactions. Bioinformatics (2019) 35:4200–2. doi: 10.1093/bioinformatics/btz210
34. Newman AM, Liu CL, Green MR, Gentles AJ, Feng W, Xu Y, et al. Robust Enumeration of Cell Subsets From Tissue Expression Profiles. Nat Methods (2015) 12:453–7. doi: 10.1038/nmeth.3337
35. Liao Y, He D, Wen F. Analyzing the Characteristics of Immune Cell Infiltration in Lung Adenocarcinoma via Bioinformatics to Predict the Effect of Immunotherapy. Immunogenetics (2021) 73:369–80. doi: 10.1007/s00251-021-01223-8
36. Liu Y, Liu X, Zhang N, Yin M, Dong J, Zeng Q, et al. Berberine Diminishes Cancer Cell PD-L1 Expression and Facilitates Antitumor Immunity via Inhibiting the Deubiquitination Activity of CSN5. Acta Pharm Sin B (2020) 10:2299–312. doi: 10.1016/j.apsb.2020.06.014
37. Zhou Q, Tian W, Jiang Z, Huang T, Ge C, Liu T, et al. A Positive Feedback Loop of AKR1C3-Mediated Activation of NF-kappaB and STAT3 Facilitates Proliferation and Metastasis in Hepatocellular Carcinoma. Cancer Res (2021) 81:1361–74. doi: 10.1158/0008-5472.CAN-20-2480
38. Liu Y, Liu L, Zhou Y, Zhou P, Yan Q, Chen X, et al. CKLF1 Enhances Inflammation-Mediated Carcinogenesis and Prevents Doxorubicin-Induced Apoptosis via IL6/STAT3 Signaling in HCC. Clin Cancer Res (2019) 25:4141–54. doi: 10.1158/1078-0432.CCR-18-3510
39. Cantarino N, Douet J, Buschbeck M. MacroH2A–an Epigenetic Regulator of Cancer. Cancer Lett (2013) 336:247–52. doi: 10.1016/j.canlet.2013.03.022
40. Corujo D, Buschbeck M. Post-Translational Modifications of H2A Histone Variants and Their Role in Cancer. Cancers (Basel) (2018) 10:59. doi: 10.3390/cancers10030059
41. Sporn JC, Jung B. Differential Regulation and Predictive Potential of MacroH2A1 Isoforms in Colon Cancer. Am J Pathol (2012) 180:2516–26. doi: 10.1016/j.ajpath.2012.02.027
42. Lei S, Long J, Li J. MacroH2A Suppresses the Proliferation of the B16 Melanoma Cell Line. Mol Med Rep (2014) 10:1845–50. doi: 10.3892/mmr.2014.2482
43. Giallongo S, Di Rosa M, Caltabiano R, Longhitano L, Reibaldi M, Distefano A, et al. Loss of Macroh2a1 Decreases Mitochondrial Metabolism and Reduces the Aggressiveness of Uveal Melanoma Cells. Aging (Albany NY) (2020) 12:9745–60. doi: 10.18632/aging.103241
44. Lens SM, Voest EE, Medema RH. Shared and Separate Functions of Polo-Like Kinases and Aurora Kinases in Cancer. Nat Rev Cancer (2010) 10:825–41. doi: 10.1038/nrc2964
45. Chaisaingmongkol J, Budhu A, Dang H, Rabibhadana S, Pupacdi B, Kwon SM, et al. Common Molecular Subtypes Among Asian Hepatocellular Carcinoma and Cholangiocarcinoma. Cancer Cell (2017) 32:57–70.e3. doi: 10.1016/j.ccell.2017.05.009
46. Prevo R, Pirovano G, Puliyadi R, Herbert KJ, Rodriguez-Berriguete G, O'Docherty A, et al. CDK1 Inhibition Sensitizes Normal Cells to DNA Damage in a Cell Cycle Dependent Manner. Cell Cycle (2018) 17:1513–23. doi: 10.1080/15384101.2018.1491236
47. Wang Q, Su L, Liu N, Zhang L, Xu W, Fang H. Cyclin Dependent Kinase 1 Inhibitors: A Review of Recent Progress. Curr Med Chem (2011) 18:2025–43. doi: 10.2174/092986711795590110
48. Yan M, Wang C, He B, Yang M, Tong M, Long Z, et al. Aurora-A Kinase: A Potent Oncogene and Target for Cancer Therapy. Med Res Rev (2016) 36:1036–79. doi: 10.1002/med.21399
49. Kent LN, Leone G. The Broken Cycle: E2F Dysfunction in Cancer. Nat Rev Cancer (2019) 19:326–38. doi: 10.1038/s41568-019-0143-7
50. Polager S, Ginsberg D. E2F - at the Crossroads of Life and Death. Trends Cell Biol (2008) 18:528–35. doi: 10.1016/j.tcb.2008.08.003
51. Bindea G, Mlecnik B, Tosolini M, Kirilovsky A, Waldner M, Obenauf AC, et al. Spatiotemporal Dynamics of Intratumoral Immune Cells Reveal the Immune Landscape in Human Cancer. Immunity (2013) 39:782–95. doi: 10.1016/j.immuni.2013.10.003
52. Bremnes RM, Busund LT, Kilvaer TL, Andersen S, Richardsen E, Paulsen EE, et al. The Role of Tumor-Infiltrating Lymphocytes in Development, Progression, and Prognosis of Non-Small Cell Lung Cancer. J Thorac Oncol (2016) 11:789–800. doi: 10.1016/j.jtho.2016.01.015
53. Singh S, Hassan D, Aldawsari HM, Molugulu N, Shukla R, Kesharwani P. Immune Checkpoint Inhibitors: A Promising Anticancer Therapy. Drug Discov Today (2020) 25:223–9. doi: 10.1016/j.drudis.2019.11.003
54. Jiao Y, Yi M, Xu L, Chu Q, Yan Y, Luo S, et al. CD38: Targeted Therapy in Multiple Myeloma and Therapeutic Potential for Solid Cancers. Expert Opin Investig Drugs (2020) 29:1295–308. doi: 10.1080/13543784.2020.1814253
55. Laudisi F, Cherubini F, Monteleone G, Stolfi C. STAT3 Interactors as Potential Therapeutic Targets for Cancer Treatment. Int J Mol Sci (2018) 19:1787. doi: 10.3390/ijms19061787
56. Carpenter RL, Lo HW. STAT3 Target Genes Relevant to Human Cancers. Cancers (Basel) (2014) 6:897–925. doi: 10.3390/cancers6020897
Keywords: hepatocellular carcinoma, H2AFY, prognosis, immune infiltration, biomarker
Citation: Huang Y, Huang S, Ma L, Wang Y, Wang X, Xiao L, Qin W, Li L and Yuan X (2021) Exploring the Prognostic Value, Immune Implication and Biological Function of H2AFY Gene in Hepatocellular Carcinoma. Front. Immunol. 12:723293. doi: 10.3389/fimmu.2021.723293
Received: 10 June 2021; Accepted: 02 November 2021;
Published: 24 November 2021.
Edited by:
Yanhong Deng, The Sixth Affiliated Hospital of Sun Yat-sen University, ChinaReviewed by:
Shin-ichiro Fujii, RIKEN Center for Integrative Medical Sciences (IMS), JapanYi Liao, Affiliated Hospital of Southwest Medical University, China
Shushan Li, University of Regensburg, Germany
Copyright © 2021 Huang, Huang, Ma, Wang, Wang, Xiao, Qin, Li and Yuan. This is an open-access article distributed under the terms of the Creative Commons Attribution License (CC BY). The use, distribution or reproduction in other forums is permitted, provided the original author(s) and the copyright owner(s) are credited and that the original publication in this journal is cited, in accordance with accepted academic practice. No use, distribution or reproduction is permitted which does not comply with these terms.
*Correspondence: Xianglin Yuan, eXVhbnhpYW5nbGluQGh1c3QuZWR1LmNu
†These authors have contributed equally to this work