 Pierre-Louis Krauss1,2†
 Moritz Pfeiffenberger1,2†
 Alexandra Damerau1,2Thomas Buttgereit1,3Yuling Chen1,2
 Timo Gaber1,2‡
 Frank Buttgereit1,2*‡
- 1Department of Rheumatology and Clinical Immunology, Charité — Universitätsmedizin Berlin, corporate member of Freie Universität Berlin and Humboldt-Universität zu Berlin, Berlin, Germany
- 2German Rheumatism Research Centre (DRFZ) Berlin, a Leibniz Institute, Berlin, Germany
- 3Department of Dermatology, Venerology, and Allergology, Charité — Universitätsmedizin Berlin, corporate member of Freie Universität Berlin and Humboldt-Universität zu Berlin, Berlin, Germany
At sites of inflammation, monocytes carry out specific immune functions while facing challenging metabolic restrictions. Here, we investigated the potential of human monocytes to adapt to conditions of gradually inhibited oxidative phosphorylation (OXPHOS) under glucose free conditions. We used myxothiazol, an inhibitor of mitochondrial respiration, to adjust two different levels of decreased mitochondrial ATP production. At these levels, and compared to uninhibited OXPHOS, we assessed phagocytosis, production of reactive oxygen species (ROS) through NADPH oxidase (NOX), expression of surface activation markers CD16, CD80, CD11b, HLA-DR, and production of the inflammatory cytokines IL-1β, IL-6 and TNF-α in human monocytes. We found phagocytosis and the production of IL-6 to be least sensitive to metabolic restrictions while surface expression of CD11b, HLA-DR, production of TNF-α, IL-1β and production of ROS through NOX were most compromised by inhibition of OXPHOS in the absence of glucose. Our data demonstrate a short-term hierarchy of immune functions in human monocytes, which represents novel knowledge potentially leading to the development of new therapeutics in monocyte-mediated inflammatory diseases.
Introduction
Human monocytes use energy, mostly in the form of ATP, for housekeeping functions such as cation transport and the generation of macromolecules as well as for a variety of specific tasks. These tasks include transendothelial migration, phagocytosis (1, 2), presentation of antigens (3), differentiation into macrophages, dendritic cells (4) and osteoclasts (5), synthesis and secretion of cytokines such as interleukin-1β (IL-1β), IL-6 and tumor necrosis factor (TNF-alpha) (2), and the production of reactive oxygen species (ROS) (6). The correct execution of these tasks necessitates sufficient supply of energy and intermediates. Without energy, the function of these important immune cells would certainly fail (7). In addition, low availability or even the absence of glucose carbon will compromise a series of metabolic pathways (such as the pentose phosphate pathway, the serine synthesis pathway, and the glycerol phosphate shuttle), which results in a reduced synthesis of intermediates leading to a potentially negative influence on cellular activation (8–12). Against this background, it should be noted that monocytes face variable and demanding microenvironmental conditions (13) when migrating from the blood into multiple tissues. Because of high metabolic activity, the “battlefields” of monocytes (e.g., sites of acute and chronic tissue inflammation such as wound healing, inflamed joints, sites of ischemia and in growing tumors) are usually characterized by diverse and often extremely compromised conditions. These include very low supply of oxygen, glucose and other nutrients, low pH, and increased lactate levels – which collectively lead to less effective synthesis of ATP and intermediates both being critical for cellular activation, ultimately causing limited availability of energy and building blocks (12, 14, 15). Therefore, immune cells such as human monocytes use different metabolic programs to meet their cellular energy needs and for the generation of biomolecules, which enable them to cope with these challenging, metabolically restricted conditions (8–12). This also means that they must be metabolically highly dynamic, and that they need to prioritize their functions when energy and substrate supply is limited. In detail, cellular adaptations in energy and intermediate metabolism affect the immune response both qualitatively and quantitatively (7, 8, 13, 16–18). However, the exact quantitative consequences of such compromised conditions on the functions of monocytes are still elusive.
In this study, we therefore hypothesized metabolically compromised conditions to affect the functions of monocytes in a differential (hierarchical) manner. Thus, monocytes will reweigh or switch off their specific tasks such as ROS production, expression of surface markers, cytokine synthesis and phagocytosis one after another (depending on its importance) when subjected to compromised conditions. To test this hypothesis, we modeled metabolic restrictions by gradually reducing the mitochondrial ATP production of human monocytes under conditions of glucose deprivation in order to assess crucial immune functions at pathophysiological conditions.
Material and Methods
Antibodies and Reagents
For cell stimulation and Golgi transport block, lipopolysaccharide (LPS) and Brefeldin A (BFA) were purchased from Sigma-Aldrich (St. Louis, USA). For the analysis of oxygen consumption, Myxothiazol (MYX), Oligomycin A, and the pan- NADPH oxidase (NOX) inhibitor VAS-2870 were purchased from Sigma-Aldrich (St. Louis, USA). Flebogamma (highly purified, unmodified, human IgG: IgG1 66.6%, IgG2 28.5%, IgG3 2.7%, IgG4 2.2%) was purchased from Grifols (Frankfurt, Germany). For intracellular ROS (iROS) detection, 5-(and 6-) chloromethyl-2’,7’-dichlorodihydrofluorescein diacetate, acetyl ester (CM-H2DCFDA) was purchased from Invitrogen GmbH (Karlsruhe, Germany). For assessments of phagocytosis, FITC labeled E. coli were applied using the Phagotest™ (Glycotope, Berlin, Germany). For flow cytometry, Fc receptor block was achieved by adding Flebogamma (highly purified, unmodified, human IgG: IgG1 66.6%, IgG2 28.5%, IgG3 2.7%, IgG4 2.2%) purchased from Grifols (Frankfurt, Germany). All antibodies used are listed in Table 1. Following the European guidelines for flow cytometry, isotype controls were exclusively used in the establishment phase of staining protocol to verify effectiveness of Fc blocking by Flebogamma, since isotype controls do not control staining specificity (19).
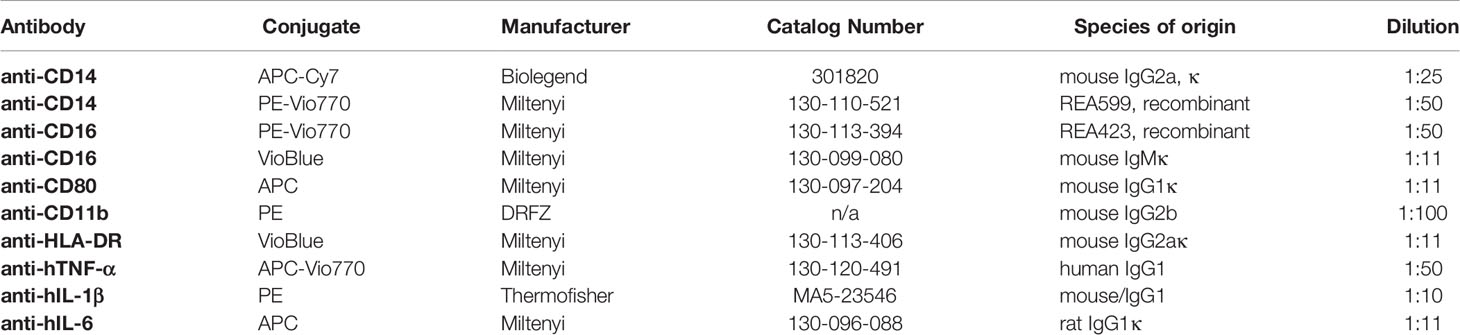
Table 1 Antibodies used for flow cytometry.
Preparation of PBMC Isolation of CD14+ Monocytes, and Cell Culture
Monocytes were isolated from heparinized peripheral blood of healthy volunteers after giving written informed consent (ethical approval EA1/207/17 Charité - Universitätsmedizin Berlin). In brief, peripheral blood mononuclear cells (PBMC) from heparinized peripheral blood were isolated by density gradient centrifugation using Ficoll-Paque™ Plus (GE Healthcare, Chicago, USA). CD14+ monocytes were enriched from PBMC with >95% purity and >95% viability (data not shown, gating strategy provided in Figure S1) by using anti-human CD14 conjugated magnetic beads (Miltenyi Biotec, Bergisch Gladbach, Germany) and then immediately used for the experiments. Monocytes were cultured at 37°C in a humidified and atmosphere with 5% CO2 (Binder, Tuttlingen, Germany) in aliquots of 300 µL at a density of 1x10⁷ cells/ml in 13 mL round bottom polypropylene tubes (Sarstedt, Nümbrecht, Germany) under orbital shaking at 120 min-1 (KS250basic, IKA-Labortechnik, Staufen, Germany) in glucose free RPMI 1640 (Thermofisher, Waltham, USA) supplemented with 10% (v/v) dialyzed (glucose-free) human AB serum (Sigma-Aldrich, St. Louis, USA).
Quantification of Oxygen Consumption
For the measurement of the oxygen consumption rate (OCR) following treatment with MYX, VAS2870, and oligomycin A (all from Sigma-Aldrich, St-Louis, USA), CD14+ monocytes were resuspended in glucose free RPMI-1640 [permits oxidative phosphorylation (OXPHOS), but not glycolysis] supplemented with 10% (v/v) dialyzed (glucose-free) human AB serum (Sigma-Aldrich, St. Louis, USA). The cells were pre-treated 2 hours with 100 ng/mL LPS derived from E. coli (Sigma-Aldrich, St. Louis, USA) or left untreated in the absence (vehicle control: 1% Dimethylsulfoxide, DMSO) or presence of 2 pmol MYX/106 cells (MYX1) or 4 pmol MYX/106 cells (MYX2), 50 µM VAS2870, 1 µM oligomycin A and 20 µM Carbonylcyanid-p-trifluoromethoxyphenylhydrazon (FCCP) (Sigma-Aldrich, St. Louis, USA), respectively. MYX irreversibly inhibits complex III of the mitochondrial respiratory chain, reducing mitochondrial biosynthesis of ATP (20). OCR was measured amperometrically in 100 µl of cell suspension (3 – 9.0 x 10⁶ cells/ml) with a SI130 microcathode Clark-type oxygen electrode and Mitocell MT200 respirometry system (Strathkelvin, Scotland, UK). After an incubation of 2 and 6 hours, basal OCR of MYX-treated cells was assessed, followed by treatment with VAS2870 and oligomycin A. OCR committed to the NADPH-Oxidase (ΔOCRV), OCR committed to the mitochondrial ATP production (ΔOCRO), VAS2870/oligomycin A insensitive OCR and mitochondrial reserve capacity were obtained by following a strictly timed protocol (shown in Figure S2)
Assessment of Cell Viability
Apoptosis and necrosis of monocytes were quantified by Annexin V (Biolegend) and 7-AAD staining (BD Biosciences, San Jose, USA) (gating strategy provided in Figure S1, reagent concentration provided in Table 2) according to the manufacturer’s instructions. Data were acquired using a BD FACSCanto™ II (BD Biosciences, San Jose, USA) and processed by FlowJo v7.6.5 (BD Biosciences, San Jose, USA).
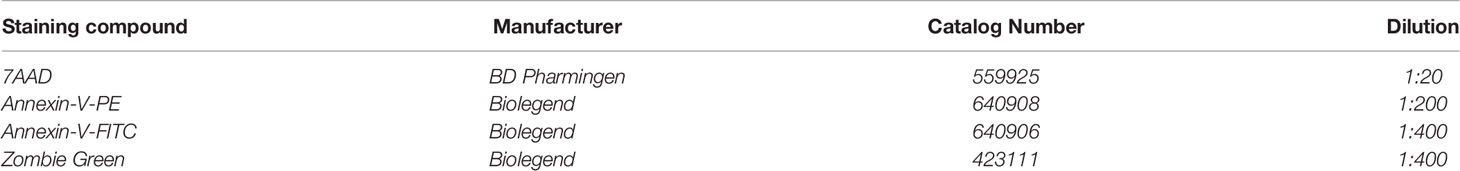
Table 2 Staining compounds used for flow cytometry.
Assessment of Fuel Oxidation
Seahorse XF Mito Fuel Flex Test was performed on XFe96 Bioanalyzer (Agilent Technology). All assays were performed following manufacture’s protocols. In brief, monocytes were cultured in a 96-well assay plate in RPMI supplemented with 10% (v/v) dialyzed, human AB serum at 105 cells per well under glucose-free conditions. Cells were stimulated for 4 h with both 100 ng/mL LPS and 2 pmol MYX/106 cells (MYX1) or 4 pmol MYX/106 cells (MYX2) or LPS alone. The Mito Fuel Flex Test inhibits the import of three metabolic substrates (pyruvate, fatty acids and glutamine) with mitochondrial pyruvate carrier inhibitor UK5099 (2 µM), carnitine palmitoyltransferase 1A inhibitor etomoxir (4 µM), or glutaminase inhibitor BPTES (3 µM). Mitochondrial stress and glycolytic parameters were measured via OCR in pmol/min/1x105 cells. Metabolic parameters were calculated according to the manufacturer’s instructions (Agilent Technology). Thus, cellular dependence on each of metabolite to fuel mitochondrial metabolism can be analyzed.
Quantification of ROS Production by Flow Cytometry
To measure cellular oxidative stress, iROS were detected using 5 (and 6) - chloromethyl-2’,7’-dichlorodihydrofluorescein diacetate, acetyl ester (CM-H2DCFDA; Invitrogen GmbH, Karlsruhe, Germany). Cells were incubated 30 min in PBS (DRFZ, Berlin, Germany) with 5 µM CM-H2DCFDA, washed with glucose-free RPMI-1640 and incubated 2 hours in glucose-free RPMI-1640 and 10% (v/v) dialyzed human AB serum, with or without 100 ng/mL LPS and with 1% DMSO, MYX1 or MYX2. After incubation, cells were washed with PBS and subsequently stained with anti-human CD14-APC-Cy7 (Biolegend, San Diego, USA). To exclude dead and apoptotic cells, cells were stained with Annexin V-PE (Biolegend, San Diego, USA) and 7-AAD (BD Biosciences, San Jose, USA) (gating strategy provided in Figure S3, reagent concentration provided in Tables 1, 2). Data were acquired using a BD FACSCanto™ II (BD Biosciences, San Jose, USA) and processed by FlowJo v7.6.5 (BD Biosciences, San Jose, USA).
Quantification of Phagocytosis
Phagocytosis was quantified using the Phagotest™ (Glycotope, Berlin, Germany) according to the manufacturer’s instructions. Data were acquired using a BD FACSCanto™ II (BD Biosciences, San Jose, USA) and processed by FlowJo v7.6.5 (BD Biosciences, San Jose, USA).
Quantification of Cellular ATP
ATP content of monocytes was assessed with the CLS II KIT (Roche, Mannheim, Germany) according to the manufacturer’s instructions. Luminescence of all samples was quantified using the SynergyHT plate-reader (BioTek, Bad Friedrichshall, Germany).
Quantification of Cytokine Production
For the intracellular measurement of TNF-α, IL-1β, and IL-6, human monocytes were pre-stimulated for 1 hour with 100 ng/mL LPS in glucose-free RPMI with 10% (v/v) dialyzed human AB serum, with or without 100 ng/mL LPS and with 1% DMSO, MYX1 or MYX2. Protein transport was blocked by adding Brefeldin A (Sigma-Aldrich, St-Louis, USA) at a concentration of 10 µg/mL for another 1 or 3 hours to achieve intracellular cytokine accumulation. Cells were stained using Zombie Green (Biolegend, San Diego, USA) according to the manufacturer’s instructions. Subsequently, cells were stained protected from light using the IC staining Kit (Miltenyi Biotech, Bergisch Gladbach, Germany) according to manufacturer´s instructions. Intracellular cytokines were stained by using antibodies against hTNF-α, hIL-1β, hIL-6 and as described above (Table 1). Data were acquired using a BD FACSCanto™ II (BD Biosciences, San Jose, USA) and processed by FlowJo v7.6.5 (BD Biosciences, San Jose, USA).
Quantification of Cytokine Secretion
Monocytes were cultured in a 96-well plate in glucose-free RPMI supplemented with 10% (v/v) dialyzed, human AB serum at 105 cells per well. Cells were stimulated for 6 h with both 100 ng/mL LPS and 2 pmol MYX/106 cells (MYX1) or 4 pmol MYX/106 cells (MYX2) or LPS alone. Subsequently, supernatants were collected and TNF-α, IL-1β, IL-6 and IL-6/IL-6 Rα complex release was measured by ELISA (R&D Systems, Minneapolis, USA) following the manufacturer’s instructions.
Quantification of Surface Marker Expression
After blocking the unspecific binding of Fc-receptor for 10 min on ice in 10 µL of a solution containing 5 mg/ml human IgG (IgG1 66.6%, IgG2 28.5%, IgG3 2.7%, IgG4 2.2%; Flebogamma, Grifols, Frankfurt, Germany), cells were washed in PBS/BSA (DRFZ, Berlin, Germany). Antibody staining was performed for 10 min at 4°C for the detection of surface marker expression using anti-CD14-FITC and anti-CD11b-PE (both from DRFZ, Berlin, Germany), anti-CD16-PE-Vio770, anti-CD80-APC and anti-HLA-DR-VioBlue (all from Miltenyi Biotech, Bergisch Gladbach, Germany; see also Table 1). Apoptosis and necrosis of monocytes were quantified by Annexin V (Biolegend, San Diego, USA) and 7-AAD staining (BD Biosciences, San Jose, USA) (gating strategy provided in Figure S1, reagent concentration provided in Tables 1, 2) according to the manufacturer’s instructions. Data were acquired using a BD FACSCanto™ II (BD Biosciences, San Jose, USA) and processed by FlowJo v7.6.5 (BD Biosciences, San Jose, USA).
Quantification of Gene Expression
Monocytes were cultured in a 96-well plate in glucose-free RPMI supplemented with 10% (v/v) dialyzed, human AB serum at 105 cells per well. Cells were stimulated for 6 h with both 100 ng/mL LPS and 2 pmol MYX/106 cells (MYX1) or 4 pmol MYX/106 cells (MYX2) or LPS alone. Subsequently, cell pellets were collected and total RNA was extracted using the RNA Isolation Kit: RNeasy Mini Kit (QIAGEN, Hilden, Germany) according to the manufacturer’s instructions. cDNAs were synthesized by reverse transcription using the TaqMan™ Reverse Transcription Kit (ThermoScientific, Waltham, USA) according to the manufacturer’s instructions. After transcription, cDNAs were stored at -20°C until further processing. Quantification of gene expression was performed by qPCR using the DyNAmo Flash SYBR Green qPCR Kit (Thermo Fisher, Waltham, USA) according to the manufacturer’s instructions and assessed in a Stratagene Mx3000P (Agilent Technologies, California, USA) using the following program: initial denaturation, 7 min at 95°C; amplification, 60 cycles with 10 s at 95°C, 7 s at 60°C and 9 s at 72°C. Melting curve analysis was assessed by a stepwise temperature increase from 50°C to 95°C every 30 s. Data were normalized to the expression of elongation-factor 1-α (EF1A) and to the respective control using the ΔΔCt-method. All primers were purchased from TIB Molbiol (Berlin, Germany) and are listed in Table 3.
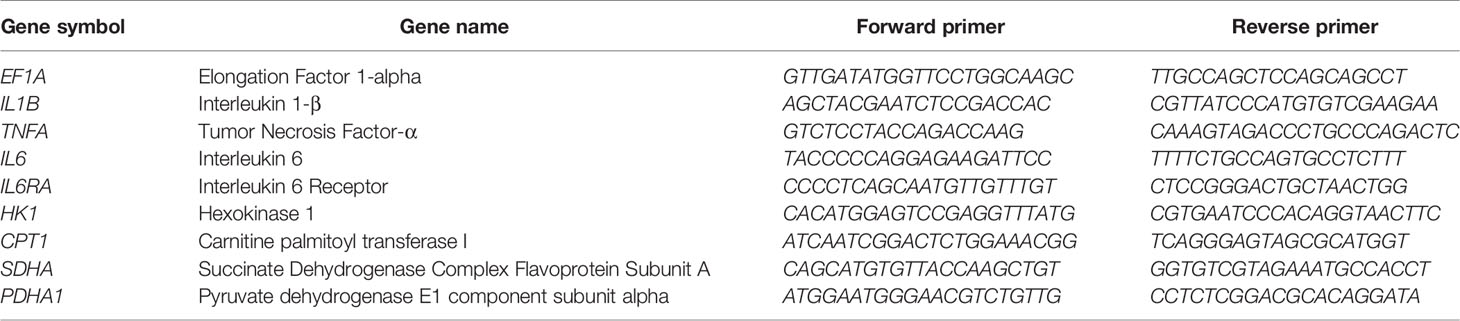
Table 3 Primer used for quantitative PCR.
Statistical Analysis
Data are depicted as mean ± SEM. Differences between independent groups were verified using the non-parametric Mann-Whitney U test. Differences between dependent samples were verified using the non-parametric Wilcoxon signed rank test. The probability values of p<0.05 were considered statistically significant.
Results
Human Monocytes Survive Strong Inhibition of Mitochondrial Respiration in the Absence of Glucose
The basal OCR of quiescent human monocytes after 2 hours of preincubation under glucose free conditions was 566 ± 11.63 pmol/min/106 cells. Treatment with increasing quantities of MYX significantly reduced the basal OCR to 419.7 ± 47.71 (2 pmol MYX/106 cells), 293.0 ± 19.81 (3 pmol/106 cells) and 189.3 ± 54.52 pmol/min/106 cells (4 pmol MYX/106 cells), which corresponded to an inhibition of roughly 25, 50 and 66% of the basal oxygen consumption rate (Figure 1A). After 6 hours of incubation under glucose free conditions, with or without LPS and/or MYX, we observed minor differences in the rates of viable cells: compared to the untreated control, 2 pmol MYX/106 cells reduced the viability rate of quiescent monocytes from 86.38 ± 5.79 to 82.12 ± 5.82 (p=0.0313), and treatment with LPS significantly reduced the viability rate of the monocytes to 75.02 ± 5.74 (p=0.0156), respectively. The combination of both, treatment with 2 and 4 pmol MYX/106 cells and stimulation with LPS, did not affect the viability of human monocytes (Figure 1B). We therefore used the MYX doses of 2 and 4 pmol/106 cells (named MYX1 and MYX2 respectively) for a maximum incubation duration of 6 hours in the subsequent experiments.
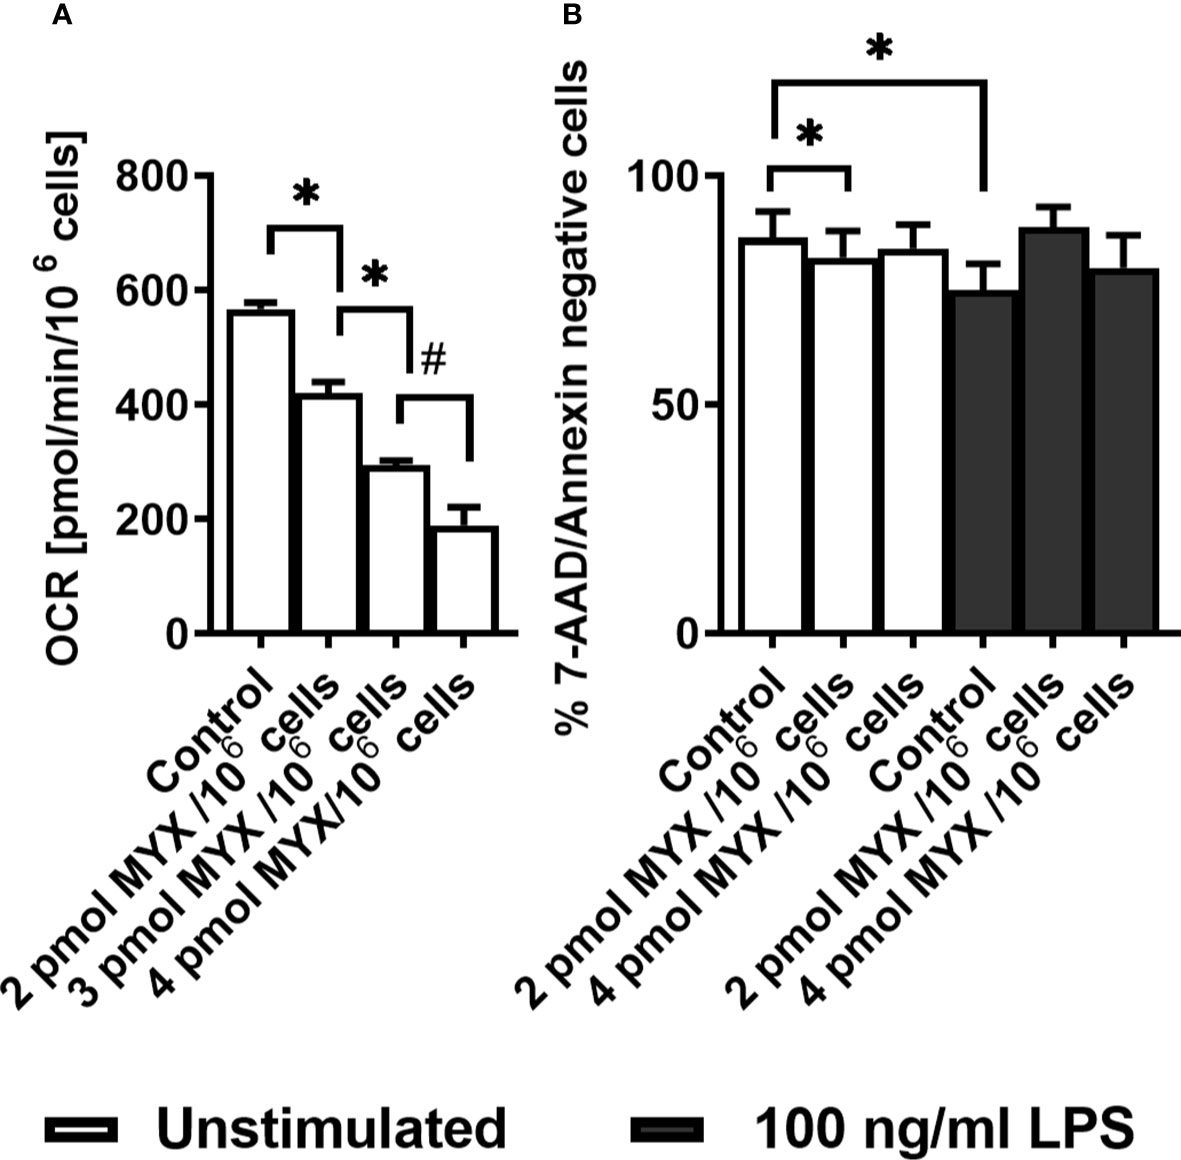
Figure 1 Human monocytes survive strong metabolic restriction. (A) Titration of Myxothiazol (MYX) in medium without glucose in the presence of MYX (pmol/106 cells) or 1% (v/v) DMSO (vehicle control) under glucose free conditions (n = 3-6). Values are expressed as mean ± SEM (*p < 0.05 Wilcoxon signed rank test, #p < 0.05 Mann-Whitney U Test). (B) Viability of quiescent and stimulated (100 ng/mL LPS) human monocytes after 6 h of incubation in the presence or absence of MYX (pmol/106 cells) or vehicle control (1% (v/v) DMSO) under glucose free conditions (n = 6). Values are expressed as mean ± SEM (*p < 0.05 Wilcoxon signed rank test).
Metabolic Restriction Alters ROS and ATP Production in Human Monocytes
Next, we investigated the OCR of human monocytes following treatment with LPS and/or MYX1 and MYX2. Since the cells showed high viability within the period of 6 hours, we chose to assess the basal OCR and the partial OCR contributing to the production of ROS through the NADPH oxidase (ΔOCRV, Figure S1) and mitochondrial production of ATP (ΔOCRO, Figure S1) after 2 and 6 hours of incubation under glucose free conditions. After 2 hours, stimulation with LPS alone significantly increased the mean basal OCR by 81.55% (p=0.001) (Figure 2A). MYX1 diminished this effect to an increase of 29.50% (p=0.0098). MYX2 abrogated the stimulating effect of LPS on the basal OCR. OCR of LPS-stimulated monocytes differed from each other (p=0.002 and p=0.001): with an increasing dose of MYX, we observed a stronger decrease in the basal OCR, indicating a dose response relationship (Figure 2A). We observed a similar dose response relationship in the ΔOCRV: the ΔOCRV of monocytes stimulated with LPS decreased with higher quantities of MYX (p=0.0195 and p=0.0186). Stimulation with LPS alone increased the mean ΔOCRV by 178.1% (p=0.0029). Upon MYX1 treatment, stimulation with LPS increased the mean ΔOCRV by 85.22%(p=0.0029). However, MYX2-treatment reduced this to 60.61% (p=0.0186) (Figure 2B). In the case of mean ΔOCRO, LPS-stimulated consumption rates were also differed from each other (p=0.002 and p=0.0322), and stimulation with LPS alone induced an increase by 51.47% (p=0.001). However, LPS did not induce any additional ΔOCRO upon MYX1 or MYX2 treatment. (Figure 2C). After 6 hours of incubation under the same conditions, stimulation with LPS alone induced an increase only in mean basal OCR (by 55.40%, p=0.0078) and in ΔOCRV (by 154.5%, p=0.0195). ΔOCRO of stimulated monocytes showed a dose dependent decrease, but the stimulation itself did not induce any additional ΔOCRO (Figures 2A–C). Additionally, stimulation with LPS decreased the mitochondrial reserve capacity of the monocytes at all metabolic levels investigated, with no difference between control, MYX1 and MYX2 (data not shown). However, unstimulated cells showed a decrease of mitochondrial reserve capacity compared to the control only upon MYX2-treatment. Treatment with LPS or MYX had no significant impact on NOX or ATPase independent OCR (data not shown).
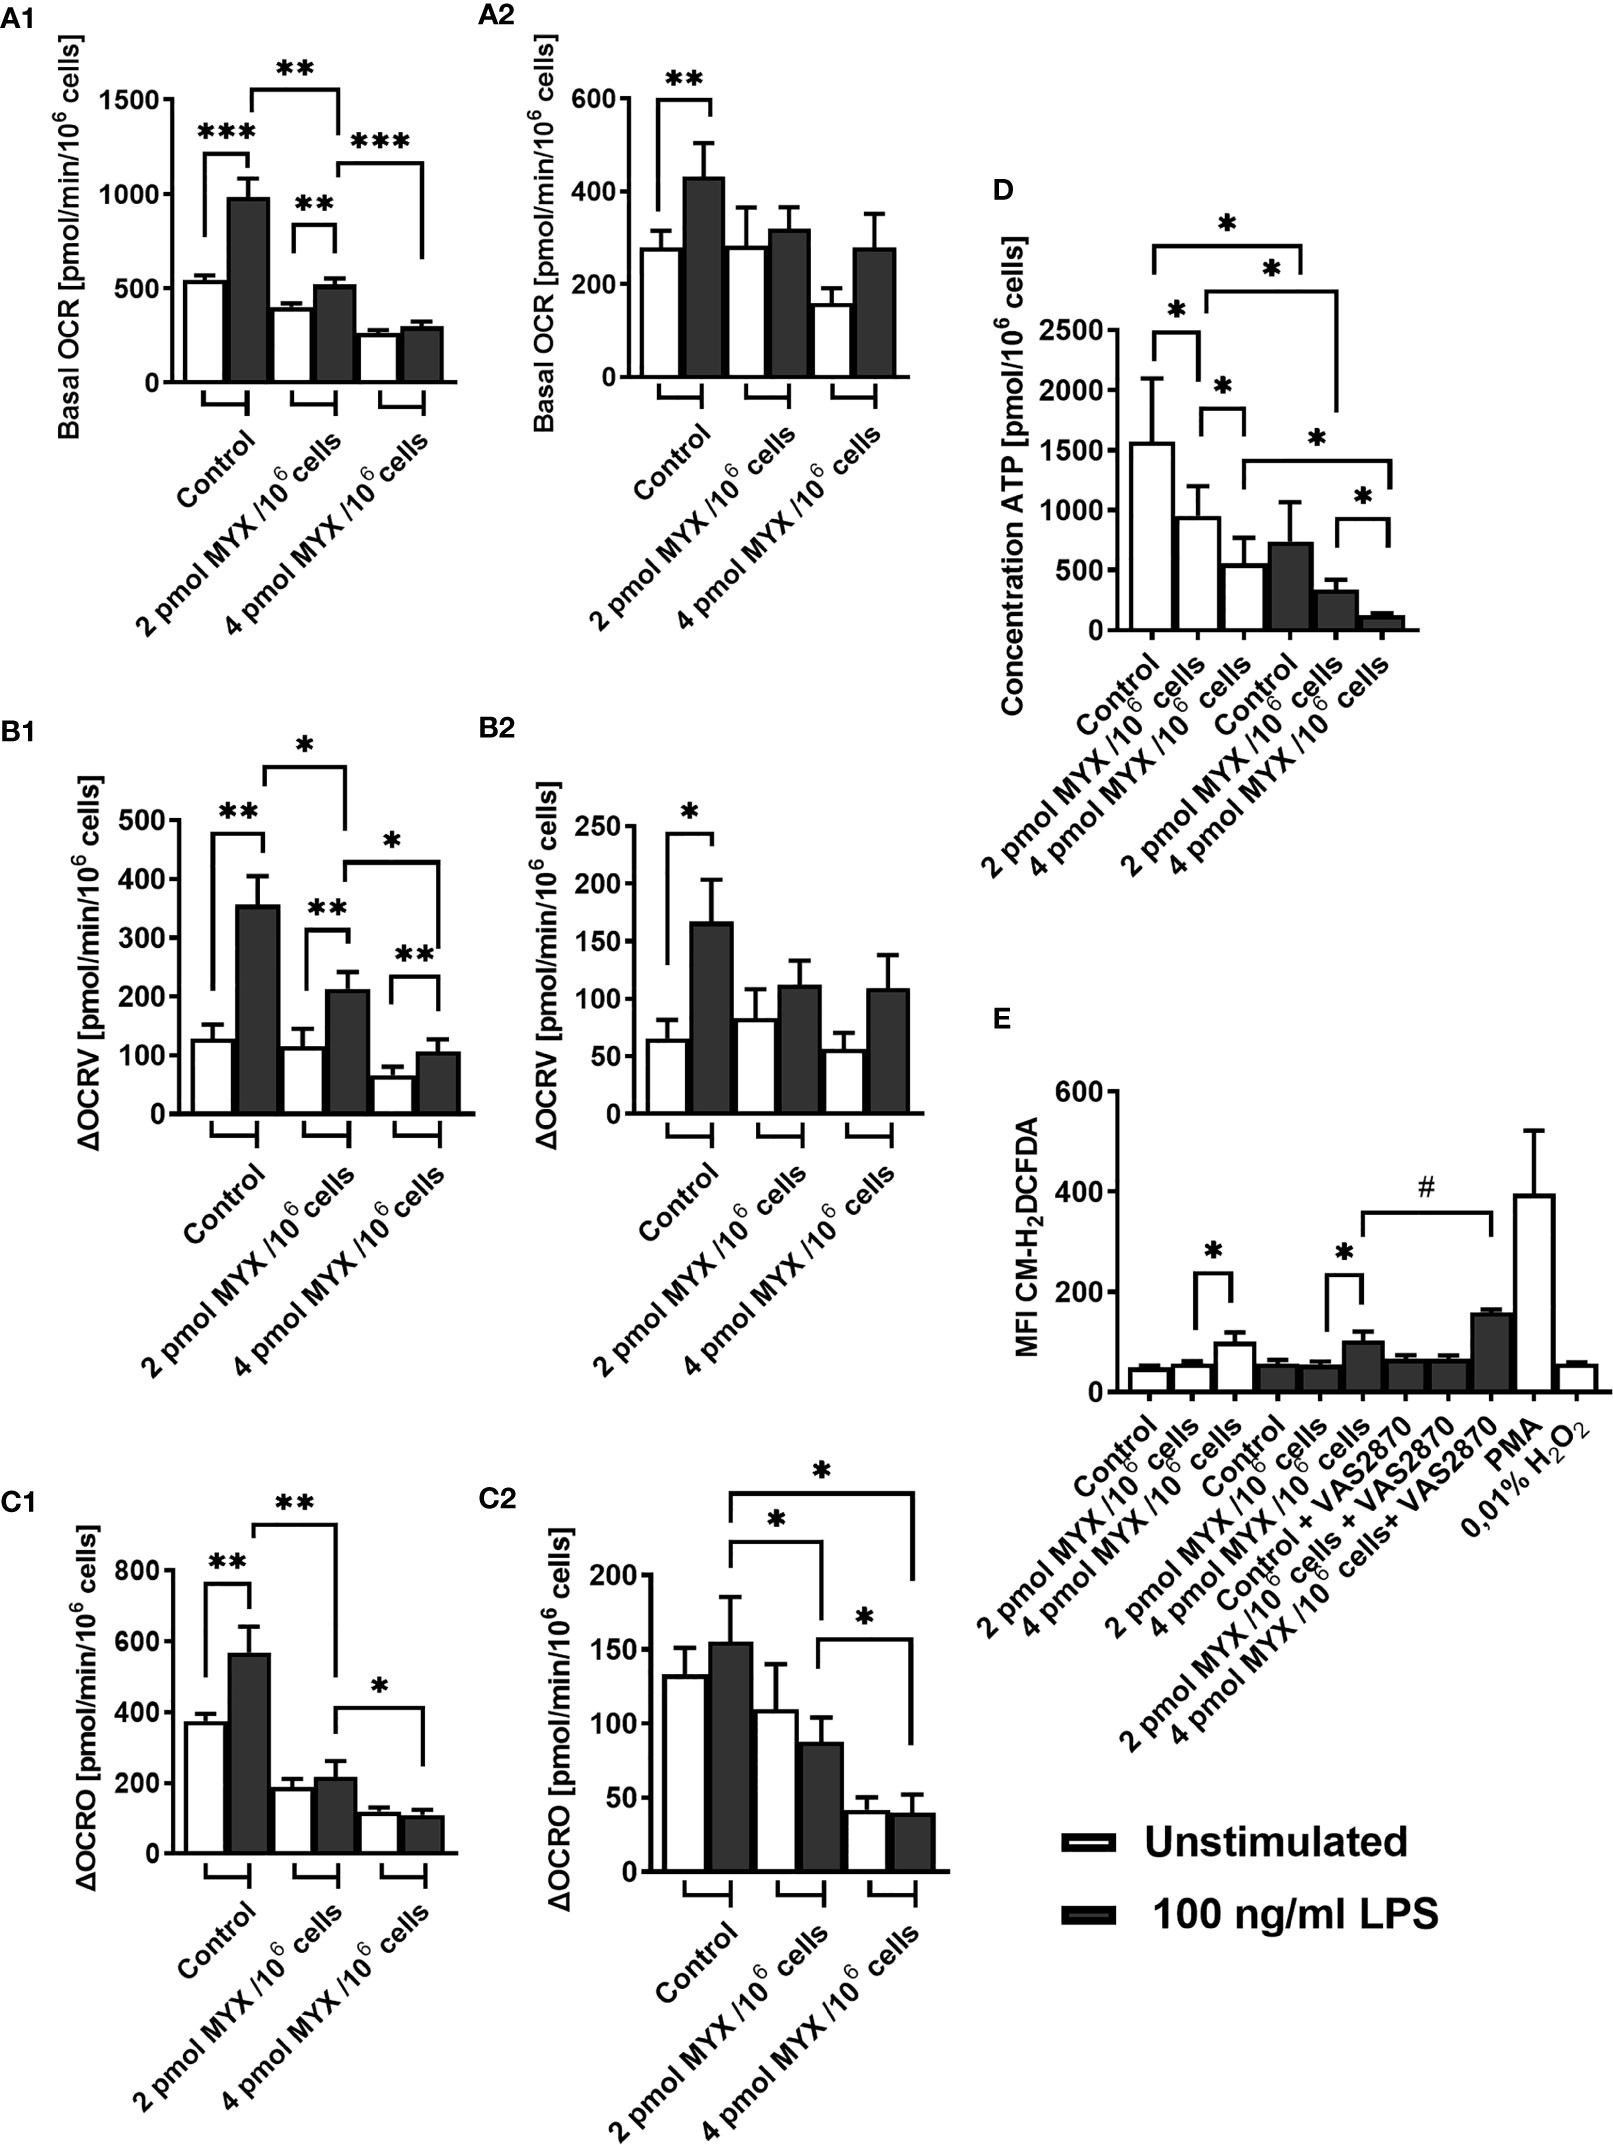
Figure 2 Metabolic restriction with MYX alters ROS and ATP production in human monocytes in the absence of glucose. (A–C) Oxygen consumption rate (OCR) and inhibitor sensitive oxygen consumption rate (ΔOCR) of quiescent and stimulated (100 ng/mL LPS) human monocytes after 2 h (A1-C1) 6 h (A2-C2) of incubation in the presence or absence of Myxothiazol (MYX) (pmol/106 cells) or 1% (v/v) DMSO (vehicle control) under glucose free conditions. After preincubation, (A) basal OCR, (B) VAS2870 sensitive OCR (ΔOCRV) and (C) oligomycin sensitive OCR (ΔOCRO) were assessed (mean ± SEM; n = 9 – 10). (D) Intracellular ATP content of quiescent and stimulated (100 ng/mL LPS) human monocytes after 3 h of incubation in the presence or absence of MYX (pmol/106 cells) or 1% (v/v) DMSO (vehicle control) under glucose free conditions was measured by bioluminescence (mean ± SEM; n = 6). (E) Median fluorescence intensity of quiescent and stimulated (100 ng/mL LPS) human monocytes after 2 h of incubation in the presence or absence of MYX (pmol/106 cells) or 1% (v/v) DMSO (vehicle control) and/or 50 µM VAS2870, or 100ng/ml PMA or H2O2 under glucose free conditions, stained with CM-H2DCFDA (mean ± SEM; n = 3 – 5); *p < 0.05, **p < 0.01, ***p < 0.001. Wilcoxon signed rank test. #p < 0.05; Mann-Whitney U Test.
In addition to ΔOCRO and ΔOCRV, we analyzed cellular ATP and iROS levels of primary human monocytes (Figures 2D, E). The cellular ATP content of the monocytes decreased following stimulation with LPS (p=0.0156). However, LPS combined with MYX treatment reduced the ATP content compared to unstimulated controls (both p=0.0156), and there was also a difference between MYX1 and MYX2 in the stimulated group (p=0.0313) ATP concentration of LPS stimulated cells upon MYX2 treatment was roughly 8% compared to the unstimulated control (Figure 2D). LPS stimulation did not increase the overall ROS content in monocytes as demonstrated by flow cytometry using monocytes stained with CM-H2DCFDA (Figure 2E). Additionally, MYX1 did not have any effect on overall ROS content, in both unstimulated and stimulated cells. However, MYX2 treatment raised the ROS content irrespective of LPS stimulation (p=0.0313 and p=0.0269). Since MYX reduced ΔOCRV as measured by the Clark-type electrode (Figure 2B), we expected an overall decrease in ROS content rather than an increase. We therefore treated the monocytes with VAS2870. Inhibition of monocyte NOX with VAS2870 further raised ROS content upon MYX2 treatment (p=0.0357). In order to evaluate the impact of metabolic restriction on common activation markers, we analyzed the expression of CD14, CD16, CD80, HLA-DR, and CD11b on human monocytes after treatment with MYX. (Figure 3). At all levels of mitochondrial inhibition investigated, CD14 expression was reduced following treatment with LPS (data not shown). In the stimulated populations, MYX2 increased the proportion of CD16 positive cells (p=0.0469). Stimulation with LPS in the DMSO group reduced the CD16 positive population (p=0.0469). MYX mostly affected the expression of HLA-DR and CD11b. Following stimulation with LPS, there was an induction of HLA-DR in the group without MYX treatment (statistical trend, p=0.0781). However, in the stimulated group, MYX1 reduced the HLA-DR positive population as well as the median fluorescence intensity (MFI) (both p=0.0156), while MYX2 had no further effect compared to MYX1 treatment. The expression of CD11b was upregulated following the stimulation with LPS in the control cells (p=0.0156) and upon MYX1-treatment (p=0.0313). However, there was no increase following MYX2 treatment, and MYX1 reduced the expression in the stimulated group (p=0.0156).
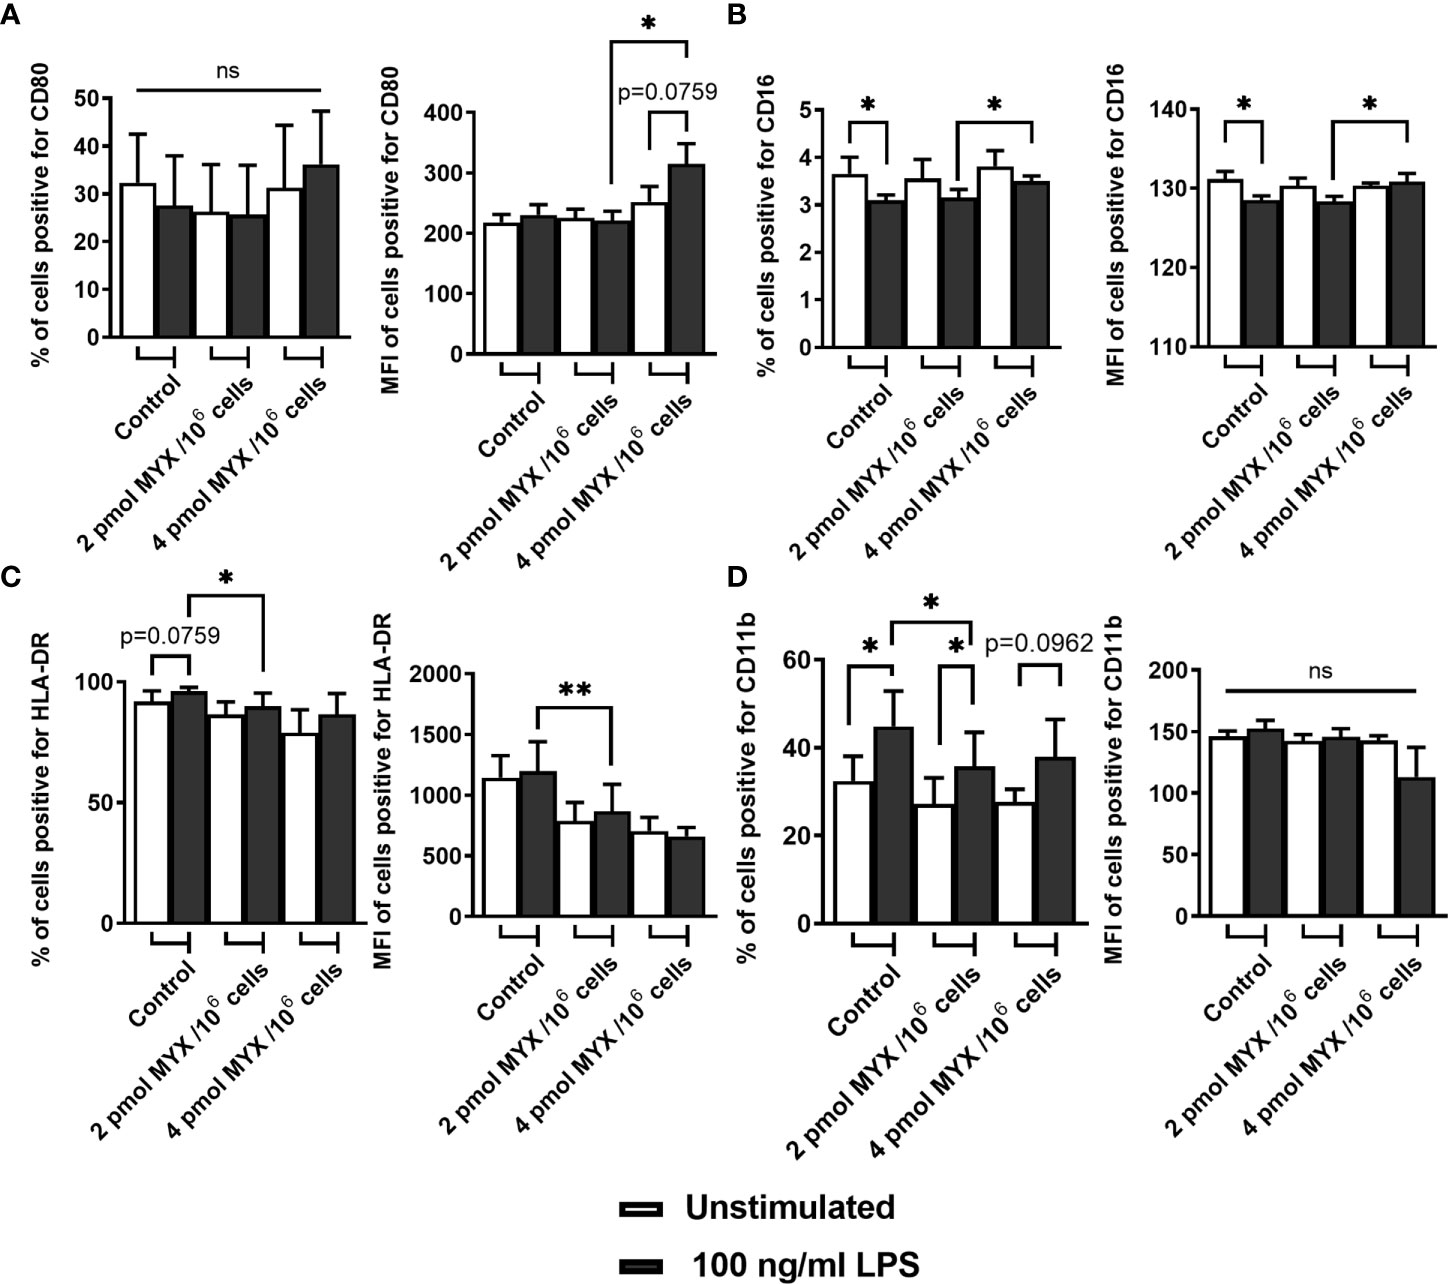
Figure 3 Metabolic restriction with MYX modifies expression of surface markers of activation. (A-D) Percentage and median fluorescence intensity of quiescent and stimulated (100 ng/mL LPS) human monocytes positive for staining of surface (A) CD80, (B) CD16, (C) HLA-DR and (D) CD11b in the presence or absence of MYX (pmol/106 cells) or vehicle control (1% (v/v) DMSO) under glucose free conditions. Cells were incubated for 4 hours. (mean ± SEM; n = 6; *p < 0.05; **p < 0.01; Wilcoxon signed rank test). ns, not significant.
Metabolic Restriction Modifies Kinetics of Inflammatory Cytokines, But Has No Effect on Phagocytosis
Next, we assessed the capacity of human monocytes to produce inflammatory cytokines under metabolically restricted conditions. To this end, cells were stained for TNF-α, IL-1β and IL-6 after 1 hour of pre-stimulation with LPS and subsequent 1 or 3 hours of blocking with BFA (Figures 4A–C). After 1 hour, cells stimulated with LPS had higher proportions of cells positive for all three cytokines compared to unstimulated cells and this was still true after 3 hours of incubation (data not shown). At the first time point of 2 hours, both the proportion and the MFI of positive cells for staining with IL-6 and IL-1β (both p= 0.0156 and p=0.0313 for % of positive and MFI respectively) was reduced upon MYX2-treatment. For IL-6, after 4 hours, there was no difference between stimulated groups for % of positive cells. Following MYX2-treatment, monocytes reached the same levels as stimulated control (Figure 4C). For IL-1β, after 4 hours, the difference between MYX1- and MYX2-treatment vanished: instead, the reduction of both proportion and MFI of positive cells now occurred between control and MYX1-treatment (both p=0.0156) (Figure 4B). Regarding TNF-α, the increase of positive cells from 2 to 4 hours of incubation was abrogated for MYX1- and MYX2-treatment. The increase of the MFI, however, was significant for DMSO and following MYX-treatment, even though the maximum reached upon MYX-treatment was lower than the control (p=0.0313) (Figure 4A). Analyzing secreted amounts of TNF-α, IL-1β and IL-6 after 6 hours of incubation, we observed (i) a significantly gradual decline in secreted amounts of TNF-α, (ii) a numerical (not significant) decline in secreted amounts of IL-1β and (iii) a significantly gradual increase in secreted amounts of IL-6 (Figure 4D). Interestingly, the observed changes in cytokine production and secretion were not accompanied by a significant increase/decrease of TNF-α, IL-1β and IL-6 gene expression indicating a rapid translational instead of a sustained transcriptional adaption process (Figure 4E).
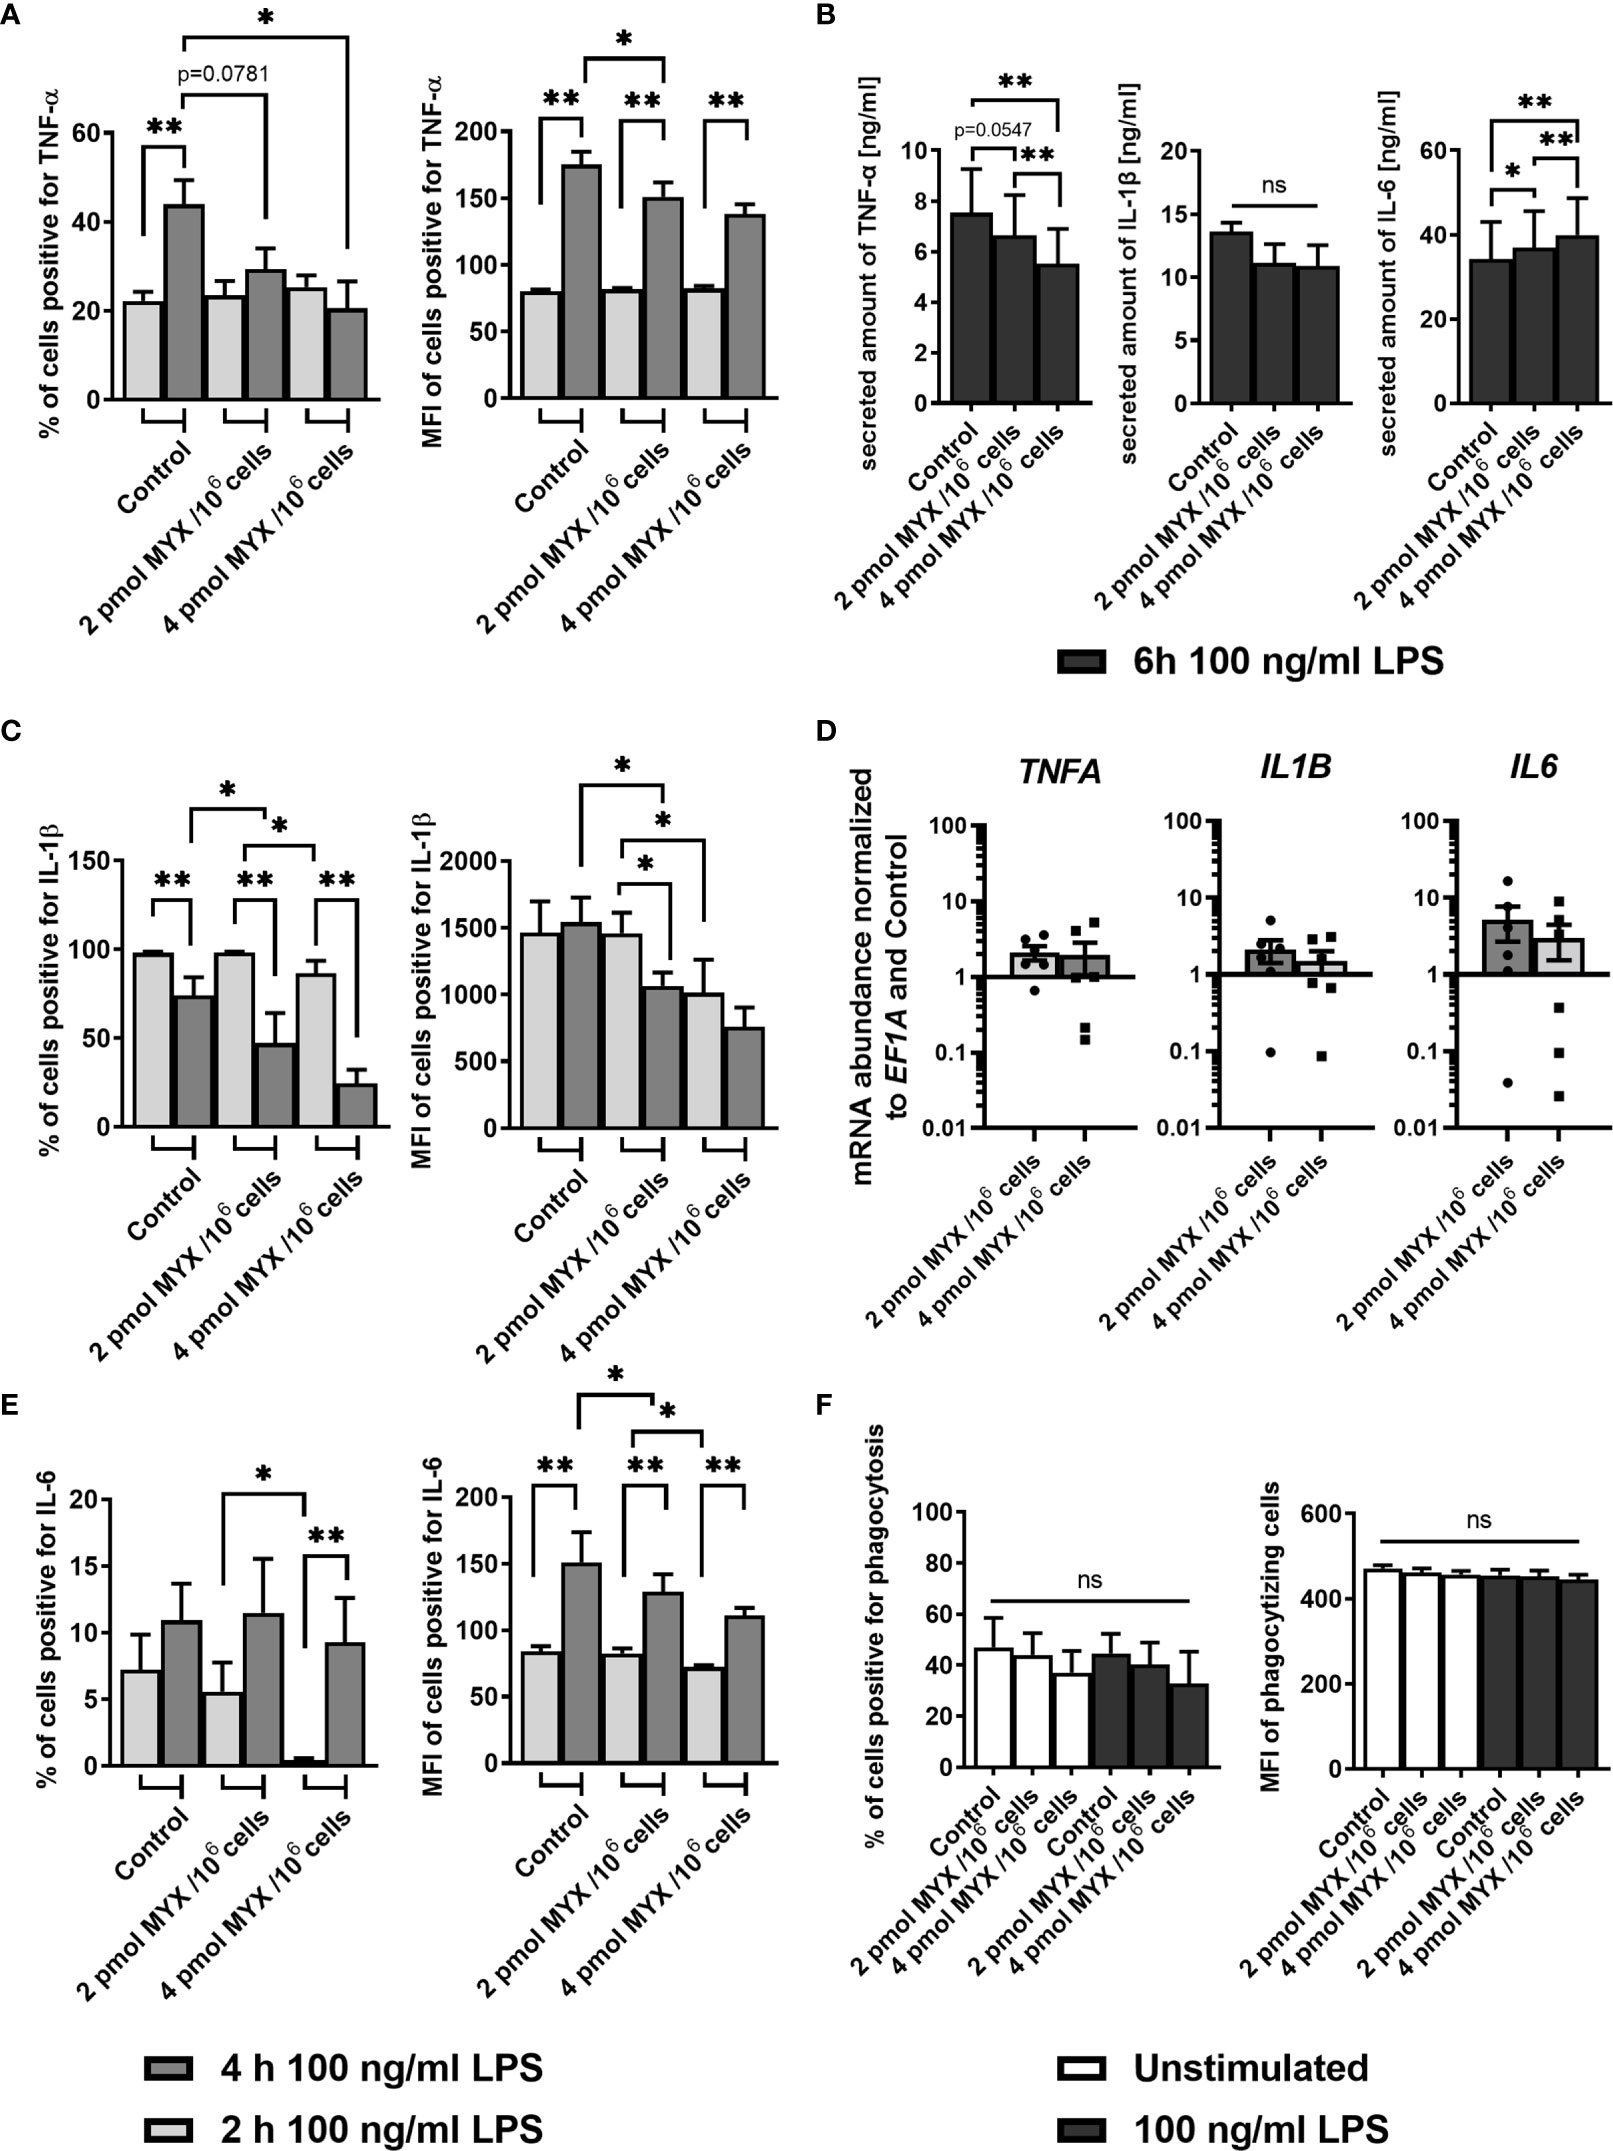
Figure 4 Metabolic restriction with MYX modifies the kinetics of the production of inflammatory cytokines but has no effect on phagocytosis. (A–C) Percentage and median fluorescence intensity of quiescent and stimulated (100 ng/mL LPS) human monocytes positive for intracellular staining of (A) TNF-α, (B) IL-1β and (C) IL-6 in the presence or absence of MYX (pmol/106 cells) or vehicle control (1% (v/v) DMSO) under glucose free conditions. After 1 h of pre-stimulation with or without LPS, cells were treated with Brefeldin A (10 µg/mL) and stained following further 1 or 3 h of incubation (mean ± SEM; n = 6; *p < 0.05; **p < 0.01; Wilcoxon signed rank test and Mann Whitney U test). (D, E) Monocytes were cultured in glucose-free conditions stimulated for 6 h with both 100 ng/mL LPS and 2 pmol MYX/106 cells (MYX1) or 4 pmol MYX/106 cells (MYX2) or LPS alone. (D) Secreted amounts of TNF-α, IL-1β, and IL-6 were determined using ELISA (mean ± SEM; n = 8; *p < 0.05; **p < 0.01; Wilcoxon signed rank test). (E) Gene expression of TNFA, IL1B and IL6 was normalized to the expression of EF1A and to the respective control (mean ± SEM; n = 6; *p < 0.05; **p < 0.01; Wilcoxon signed rank test). (F) Percentage and median fluorescence intensity (MFI) of monocytes positive for FITC-labeled E. coli bacteria after 1 h incubation in the presence or absence of LPS (100 ng/mL) and MYX (pmol/106 cells) or 1% (v/v) DMSO (vehicle control) under glucose free conditions (mean ± SEM; n = 6; Wilcoxon signed rank test). ns, not significant.
Since phagocytosis is a key function of human monocytes, we analyzed the effect of MYX-treatment on the phagocytosis of E. coli with or without LPS as a co-stimulation. MYX had no significant effect on the phagocytosis function of human monocytes (Figure 4F).
Metabolic Restriction Increased the Capacity and Dependency of Monocytes for the Use of Fatty Acids But Reduced the Use of Glycolysis
Next, we analyzed if metabolic restriction of LPS stimulated human monocytes impacts their capacity, dependency and flexibility to use certain cellular fuels namely glucose, glutamine and fatty acids in order to adapt and maintain cellular functions such as IL-6 production and phagocytosis (Figure 5). After initial LPS stimulation (100 ng/ml for 1 hour) and 4 hours of incubation, we analyzed if the cells’ mitochondria were able to compensate for the metabolic restriction by oxidizing other fuels (Figure 5A). Therefore, we added UK5009, BPTES, and etomoxir to block glucose oxidation, glutamine oxidation, and fatty acid oxidation (FAO), respectively. As expected, when gradually increasing the OXPHOS inhibition in the absence of glucose monocyte mitochondria reduced their capacity and flexibility to use glucose but also the use of glutamine. Interestingly, we observed that monocyte mitochondria were capable of compensating for the inhibition of glycolysis by increasing their capacity and dependency on FAO but not on glutaminolysis. To analyze if monocytes adapt to metabolic restrictions by transcriptional induction of key enzymes for the (i) first step of glycolysis (hexokinase 1; HK1), (ii) link of the glycolytic pathway and the tricarboxylic cycle (TCA) (pyruvate dehydrogenase complex E1 subunit α; PDHA1), (iii) connection of TCA and OXPHOS (Succinate dehydrogenase complex, subunit A of complex II of the electron transport chain; SDHA) and (iv) link of fatty acid oxidation to TCA and the generation of acetyl-CoA (carnitine palmitoyltransferase I; CPT1). As a result, we observed a significant increase of gene expression for SDHA and the mitochondrial long chain fatty acid transporter CPT1 at MYX2 while HK1 and PDHA1 remained unaffected by metabolic restriction (Figure 5B).
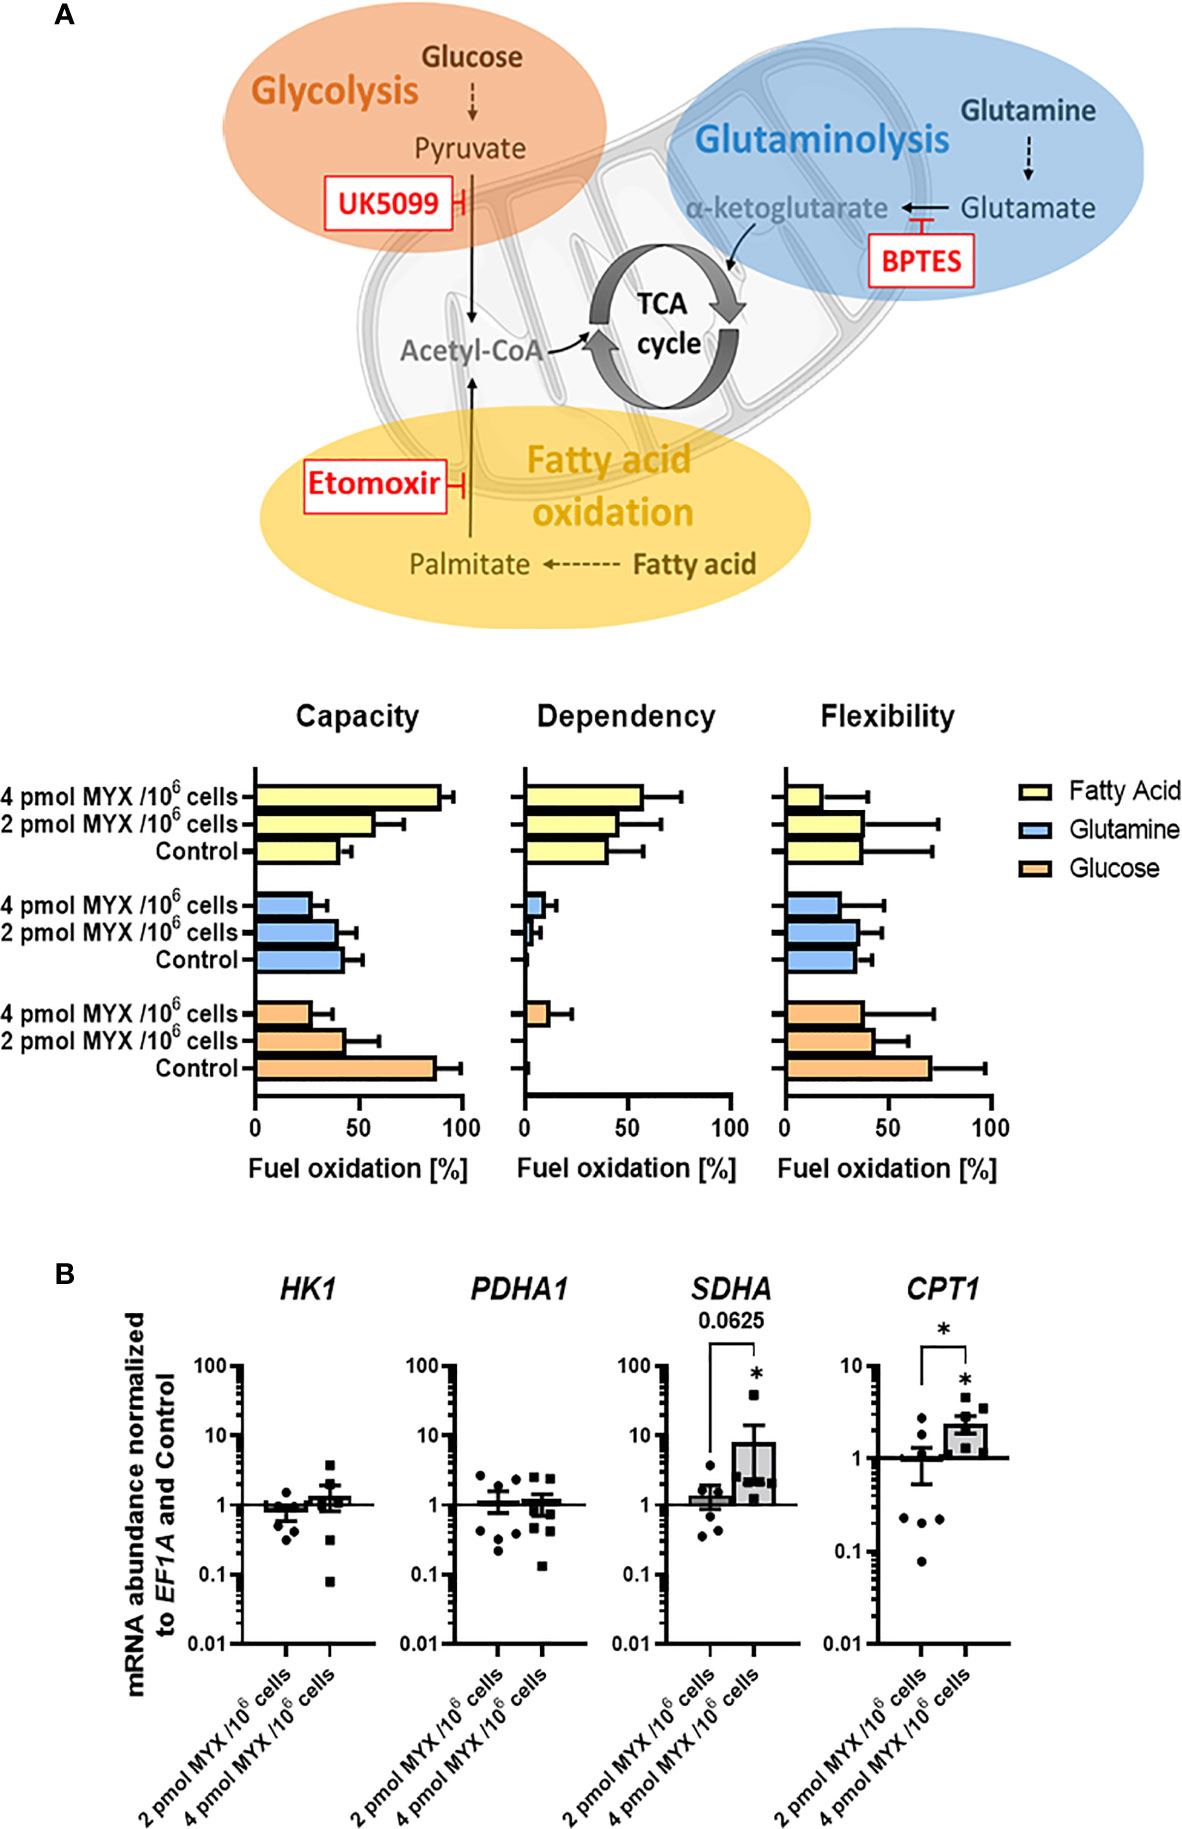
Figure 5 Metabolic restriction increased the capacity and dependency of monocytes for the use of fatty acids but reduced the use of glycolysis. (A) Seahorse XF Mito Fuel Flex Test was performed using 2 µM UK5099, 3 µM BPTES, and 4 µM etomoxir to block glucose oxidation, glutamine oxidation, and fatty acid oxidation, respectively (n = 3). Mitochondrial stress and glycolytic parameters were measured via OCR in pmol/min/1x105 cells and are shown as percentage of max values and depicted as bars (mean ± SEM). (B) Gene expression of HK1, PDHA1, SDHA, and CPT1 was normalized to the expression of EF1A and to the respective Control (mean ± SEM; n = 6; *p < 0.05; Wilcoxon signed rank test).
Discussion
In this study, we established a model of metabolically restricted conditions to mimic “battlefields” of human monocytes such as at sites of inflammation. A hallmark of these “battlefields” is the low availability of substrates such as oxygen and glucose (13). Additionally, low pH and increased levels of metabolites such as lactate render less effective synthesis of ATP and biosynthetic substrates, which are essential for cell activation (12, 14, 15). To reproduce those pathophysiological conditions in vitro, we cultivated the cells in medium without glucose and gradually reduced mitochondrial ATP production by inhibiting OXPHOS using myxothiazol (21). Myxothiazol is a specific inhibitor of respiratory chain complex III (CIII) that binds to the ubiquinol oxidation site Qo of CIII and blocks electron transfer from ubiquinol to cytochrome b, inhibiting CIII activity (21–24). Due to the competitive nature of this molecule, dimming the effect of OXPHOS inhibition without altering survival or mitochondrial ROS production provides the experimental prerequisite to analyze the metabolic effects after gradual inhibition of OXPHOS. Under these conditions, the pentose phosphate pathway, the serine synthesis pathway and the glycerol phosphate shuttle are heavily compromised since they critically depend on glucose carbon. This represents an important and pathophysiologically relevant restriction, since these pathways are known to be most important for metabolically active cells (13).
We first provide evidence that under such conditions the viability of the cells is not critically reduced. Next, we demonstrate MYX to effectively reduce the basal OCR of monocytes in the absence of glucose (Figures 1, 2). The inhibitory effect of MYX on ΔOCRO was significant, even after a period of 6 hours. This indicates that the cells were on different and stable metabolic restriction levels in all functional experiments carried out during this period. It is known that monocytes can compensate for loss of glycolysis as a source of ATP production under conditions of glucose deprivation by an increase of the AMP/ATP ratio and enhanced FAO (25). Therefore, we measured the steady-state ATP content of cells, in order to confirm the different energy levels of the cells. Cells stimulated with LPS displayed lower ATP content than the unstimulated control, while the ΔOCRO was significantly higher in stimulated cells (Figure 2). This is likely because stimulation with LPS causes either higher ATP consumption by the cells or higher flux of carbon bodies into metabolic pathways to synthesize intermediates critical for cell activation or both, without a corresponding higher energy generation (25). Obviously, the decrease of ATP available could not be compensated by increased mitochondrial ATP production or by an increase in the AMP/ATP ratio resulting in an increased glycolytic energy supply mediated by AMP-activated protein kinase (AMPK) (26). The latter is explained by the fact that our model did not permit glycolysis. Instead, we demonstrate that monocytes were capable of compensating for the inhibition of glycolysis and gradual inhibition of OXPHOS by increasing their capacity and dependency on FAO but not on glutaminolysis confirming previous reports (25) (Figure 5). However, our study demonstrates the ability of monocytes to maintain the investigated immune functions to varying degrees even in the complete absence of glucose. Although glucose carbon is critical for metabolic pathways, which are involved in cell activation by providing intermediates, human LPS-stimulated monocytes (without MYX treatment) remain functional under conditions of glucose deprivation. The basal OCR and basal OCR for LPS-stimulated monocytes measured in our study is comparable to values found in the literature (25, 27). Additionally, NOX dependent OCR of the monocytes in our study was similar to that of Raulien and colleagues, corresponding to approximately one third of total OCR following LPS stimulation (25). This indicates that the relative production of ROS through NOX was probably similar in both studies. Regardless of NOX, there are two possible explanations for the comparable iROS levels in control and upon MYX1-treatment: First, either mechanisms protecting against ROS such as the glutathione peroxidase system were no longer sufficiently effective [biosynthesis of glutathione requiring ATP (28)], and/or NOX independent iROS were produced following MYX1 treatment (29). Indeed, MYX2 raised iROS higher than both MYX1 and untreated control cells regardless of LPS treatment, while blocking NOX by using VAS-2870 increased this effect significantly (Figure 2) indicating a NOX-independent mitochondrial ROS production (29, 30). Increased iROS, as observed in our study, has been demonstrated to interfere with the MAPK-p38 activation following LPS stimulation (31); a process which has recently been attributed to non-mitochondrial iROS (32). Second, the loss of effectiveness of protection mechanisms against iROS as induced by the metabolically compromised conditions increased NOX independent iROS. We see a possible explanation for this in the glutathione peroxidase system, whose biosynthesis is dependent on ATP and intermediates of the glycolysis feeding the pentose phosphate pathway (28). Furthermore, glutathione is a known off-target for the pan-NOX inhibitor VAS-2870 used in our study (33, 34), which also may explain the significant increase in iROS (Figure 2) following VAS-2870 treatment, even with blocked NOX as source of ROS.
Further, we demonstrate that phagocytosis and the LPS-induced production of IL-6 to remain functional even under extremely comprised metabolic conditions. Thus, IL-6 signaling and phagocytosis emerge to be of central importance to human monocytes where glycolysis, metabolic pathways that diverge from glycolysis, and OXPHOS are very much restricted or – in complete absence of glucose – even absent. In contrast, we show that the production of iROS and the expression of surface markers are dispensable at very restricted metabolic conditions as those were the first to become negatively affected. To the best of our knowledge, this is the first report emphasizing such hierarchy of monocyte functions under gradually metabolically restricted conditions mimicking “real-world” pathophysiological scenarios.
We found phagocytosis to be metabolically seen the most important immune process of human monocytes. Monocytes belong to the professional phagocytes, the group of cells with a broad range of particles that can be taken up (35). Our results concerning metabolic restriction and phagocytosis matches previous work by our lab, confirming the validity of our model (36). Previously, we revealed that phagocytosis by human monocytes under glucose-free conditions could only be influenced, by MYX quantities reducing the basal OCR to 20% compared to the untreated control (36). Therefore, it is not surprising that phagocytosis remained fully functional, since in this study the lowest basal OCR was 33% compared to the control (Figure 4). The expression of CD11b and HLA-DR markers are commonly used in the assessment of antigen presentation and transendothelial migration capacity of human monocytes (2, 37, 38) (Figure 3). MYX treatment reduced the expression of CD11b and HLA-DR in human monocytes. Both the low availability of ATP and the reduction of intermediates are likely to compromise the cell adhesion, signaling, migration and presentation of antigens, while phagocytosis remains fully functional (37, 38) (Figure 3).
A general feature of monocytes is the production of cytokines in response to a variety of stimuli, such as found in the inflamed joint of RA patients (39). Furthermore, it is well established that monocytes contribute to the pathogenesis of sepsis by secreting inflammatory cytokines such as TNF-α, which peaks in the first two hours and falls to undetectable levels after 6 hours. The resulting “cytokine storm” is thought to be of central importance in the pathogenesis of sepsis and seen as a potential therapeutic target (40). Upon stimulation with LPS, human monocytes show a near linear increase for cellular IL-1β, IL-6 and TNF- α during the first 6 hours of incubation, as shown by others (41). Therefore, mainly ATP and carbon body availability should determine differential production kinetics for these cytokines in our study. IL-1β production was the most affected by reduced ATP availability and lack of glucose supply although the amount secreted remained unchanged (Figure 4). In the case of TNF-α, shortage of ATP and lack of glucose had a similar effect on the percentage of TNF-α-positive cells over time. However, monocytes at all metabolic levels investigated could still increase cellular TNF-α levels over time, but to a lesser extent under high metabolic stress finally leading to a gradual decline of secreted amounts of TNF-α. Interestingly, the induction of IL-6 showed a strong compensatory reaction over time in response to shortage of ATP and glucose and increased in the levels secreted after 6 hours. Our data for IL-6 demonstrate that after 4 hours, monocytes can still produce the same amount of IL-6, regardless of ATP and glucose availability. Of note, secretion of TNFα and IL-1β rely on prior proteolytic steps whereas secretion of IL-6 does not, which might contribute to differences in the secretion profile of these cytokines (42, 43). Although these data are consistent with our observations using flow cytometry and are therefore likely to be directly related to the amounts of cytokines produced, we cannot completely exclude proteolytic steps of TNFα and IL-1β that were influenced by the applied metabolic stress. On the other hand, proinflammatory properties of IL-6 are mainly based on the IL-6 trans-signaling mechanism, in which IL-6 bound to the soluble IL-6R that can stimulate virtually all cells in the human body, whereas only a few cells also respond to IL-6 alone (44). Interestingly, secreted amounts of the IL-6/IL-6Rα complex in the medium of isolated monocytes cultured under glucose-free conditions for up to 6 hours were almost undetectable and not inducible by LPS or affected by metabolic stress (data not shown). Thus, we suggest that either another signal is necessary of or IL-6/IL-6Rα complex is in general induced when glycolysis is available. Finally, IL-6/IL-6Rα complex has facilitates a long-lasting IL-6 availability and activation of target cells which follows a different kinetic (44). Nevertheless, our results underline the importance of TNF-α and IL-6 in human monocytes. Since TNF-α is known to mediate the IL-6 production by human monocytes in the arthritic joint, both, anti-IL-6 receptor and anti-TNF-α targeted antibodies proved to be very effective in the treatment of RA (45, 46).
Our model sought to heavily interfere with the energy and intermediate household of human monocytes in order to test their compensation limits and to assess the metabolic-dependent effects on their functionality. Modeling restricted energy and intermediate supply and decreased mitochondrial reserve capacity in human monocytes with mitochondria as primary ATP source such as established in our study could provide useful information in pathophysiology of human monocyte mediated inflammatory diseases such as rheumatoid arthritis (RA) (47) and atherosclerosis (48). It should be noted that the prevalence of both diseases increases with age (49, 50), while ageing impairs mitochondrial reserve capacity of monocytes (51).
It should be noted finally, that we intentionally chose not to use differential rates of glycolysis in our model. Establishing a model with a similar goal to ours, but including gradual inhibition of glycolysis, would have interfered with the transcription process of TNF-α mRNA (52) and CD11b expression (32). The informative value of those outcomes would have been reduced. Moreover, the role of the glycolytic pathway in human monocytes/macrophages remains a subject of debate. Several recent studies using different metabolic assessment methods depict monocytes/macrophages as rather glycolytic cells. However, other recent studies contradict these results by using different methods and/or studying human instead of murine cells (11, 53–57). The limitative value of an absent glycolysis might therefore remain of minor extent for the scope of our study.
Conclusion
Our results demonstrate a clear hierarchy of the LPS-induced immune processes in human monocytes as induced by metabolically restricted conditions mimicking pathophysiological conditions. Of the assessed processes, phagocytosis and the production of IL-6 were the highest in the hierarchy, followed by ROS production through NOX, expression of surface markers and the production of TNF-α and IL-1β. By applying our method to cells of patients with diseases under conditions of metabolic restrictions, future projects could identify most critical and, therefore, most promising therapeutic targets, and could obtain a better and more translational understanding of monocyte-mediated diseases.
Data Availability Statement
The raw data supporting the conclusions of this article will be made available by the authors, without undue reservation.
Ethics Statement
The studies involving human participants were reviewed and approved by EA1/207/17 Charité—Universitätsmedizin Berlin. The patients/participants provided their written informed consent to participate in this study.
Author Contributions
P-LK, MP, TG, and FB designed the study. P-LK, MP, AD, TB, YC, TG, and FB collected, analyzed and interpreted the experimental data on the in vitro model. P-LK, MP, TB, TG, and FB prepared the main manuscript text. All authors contributed to writing or reviewing the manuscript and final approval.
Funding
This work was supported by the Charité internal research funding. The work of TG was funded by the Deutsche Forschungsgemeinschaft (project no. 353142848). AD was supported by the Studienstiftung des deutschen Volkes and by the Joachim Herz Foundation (Add-on Fellowship 2020).
Conflict of Interest
The authors declare that the research was conducted in the absence of any commercial or financial relationships that could be construed as a potential conflict of interest.
Publisher’s Note
All claims expressed in this article are solely those of the authors and do not necessarily represent those of their affiliated organizations, or those of the publisher, the editors and the reviewers. Any product that may be evaluated in this article, or claim that may be made by its manufacturer, is not guaranteed or endorsed by the publisher.
Acknowledgments
The authors would like to thank Manuela Jakstadt for excellent technical assistance.
Supplementary Material
The Supplementary Material for this article can be found online at: https://www.frontiersin.org/articles/10.3389/fimmu.2021.730672/full#supplementary-material
References
1. Doring M, Cabanillas Stanchi KM, Erbacher A, Haufe S, Schwarze CP, Handgretinger R, et al. Phagocytic Activity of Monocytes, Their Subpopulations and Granulocytes During Post-Transplant Adverse Events After Hematopoietic Stem Cell Transplantation. Immunobiology (2015) 220(5):605–13. doi: 10.1016/j.imbio.2014.12.002
2. Dale DC, Boxer L, Liles WC. The Phagocytes: Neutrophils and Monocytes. Blood (2008) 112(4):935–45. doi: 10.1182/blood-2007-12-077917
3. Lee J, Tam H, Adler L, Ilstad-Minnihan A, Macaubas C, Mellins ED. The MHC Class II Antigen Presentation Pathway in Human Monocytes Differs by Subset and is Regulated by Cytokines. PloS One (2017) 12(8):e0183594. doi: 10.1371/journal.pone.0183594
4. Sander J, Schmidt SV, Cirovic B, McGovern N, Papantonopoulou O, Hardt AL, et al. Cellular Differentiation of Human Monocytes Is Regulated by Time-Dependent Interleukin-4 Signaling and the Transcriptional Regulator Ncor2. Immunity (2017) 47(6):1051–66 e12. doi: 10.1016/j.immuni.2017.11.024
5. Kylmaoja E, Nakamura M, Turunen S, Patlaka C, Andersson G, Lehenkari P, et al. Peripheral Blood Monocytes Show Increased Osteoclast Differentiation Potential Compared to Bone Marrow Monocytes. Heliyon (2018) 4(9):e00780. doi: 10.1016/j.heliyon.2018.e00780
6. Muller-Calleja N, Manukyan D, Canisius A, Strand D, Lackner KJ. Hydroxychloroquine Inhibits Proinflammatory Signalling Pathways by Targeting Endosomal NADPH Oxidase. Ann Rheum Dis (2017) 76(5):891–7. doi: 10.1136/annrheumdis-2016-210012
7. Buttgereit F, Burmester GR, Brand MD. Bioenergetics of Immune Functions: Fundamental and Therapeutic Aspects. Immunol Today (2000) 21(4):192–9. doi: 10.1016/S0167-5699(00)01593-0
8. O’Neill LA, Kishton RJ. Rathmell J. A Guide to Immunometabolism for Immunologists. Nat Rev Immunol (2016) 16(9):553–65. doi: 10.1038/nri.2016.70
9. Mills EL, Kelly B, O’Neill LAJ. Mitochondria are the Powerhouses of Immunity. Nat Immunol (2017) 18(5):488–98. doi: 10.1038/ni.3704
10. Corcoran SE, O’Neill LA. HIF1alpha and Metabolic Reprogramming in Inflammation. J Clin Invest (2016) 126(10):3699–707. doi: 10.1172/JCI84431
11. Vijayan V, Pradhan P, Braud L, Fuchs HR, Gueler F, Motterlini R, et al. Human and Murine Macrophages Exhibit Differential Metabolic Responses to Lipopolysaccharide - A Divergent Role for Glycolysis. Redox Biol (2019) 22:101147. doi: 10.1016/j.redox.2019.101147
12. Cho SH, Raybuck AL, Blagih J, Kemboi E, Haase VH, Jones RG, et al. Hypoxia-Inducible Factors in CD4(+) T Cells Promote Metabolism, Switch Cytokine Secretion, and T Cell Help in Humoral Immunity. Proc Natl Acad Sci USA (2019) 116(18):8975–84. doi: 10.1073/pnas.1811702116
13. Gaber T, Strehl C, Buttgereit F. Metabolic Regulation of Inflammation. Nat Rev Rheumatol (2017) 13(5):267–79. doi: 10.1038/nrrheum.2017.37
14. Gaber T, Haupl T, Sandig G, Tykwinska K, Fangradt M, Tschirschmann M, et al. Adaptation of Human CD4+ T Cells to Pathophysiological Hypoxia: A Transcriptome Analysis. J Rheumatol (2009) 36(12):2655–69. doi: 10.3899/jrheum.090255
15. Kotas ME, Medzhitov R. Homeostasis, Inflammation, and Disease Susceptibility. Cell (2015) 160(5):816–27. doi: 10.1016/j.cell.2015.02.010
16. Hoff P, Maschmeyer P, Gaber T, Schutze T, Raue T, Schmidt-Bleek K, et al. Human Immune Cells’ Behavior and Survival Under Bioenergetically Restricted Conditions in an. Vitro Fracture Hematoma Model Cell Mol Immunol (2013) 10(2):151–8. doi: 10.1038/cmi.2012.56
17. Gaber T, Chen Y, Krauss PL, Buttgereit F. Metabolism of T Lymphocytes in Health and Disease. Int Rev Cell Mol Biol (2019) 342:95–148. doi: 10.1016/bs.ircmb.2018.06.002
18. Carroll RG, Timmons GA, Cervantes-Silva MP, Kennedy OD, Curtis AM. Immunometabolism Around the Clock. Trends Mol Med (2019) 25(7):612–25. doi: 10.1016/j.molmed.2019.04.013
19. Cossarizza A, Chang HD, Radbruch A, Acs A, Adam D, Adam-Klages S, et al. Guidelines for the Use of Flow Cytometry and Cell Sorting in Immunological Studies (Second Edition). Eur J Immunol (2019) 49(10):1457–973. doi: 10.1002/eji.201970107
20. Wyatt CN, Buckler KJ. The Effect of Mitochondrial Inhibitors on Membrane Currents in Isolated Neonatal Rat Carotid Body Type I Cells. J Physiol (2004) 556(Pt 1):175–91. doi: 10.1113/jphysiol.2003.058131
21. Davoudi M, Kallijärvi J, Marjavaara S, Kotarsky H, Hansson E, Levéen P, et al. A Mouse Model of Mitochondrial Complex III Dysfunction Induced by Myxothiazol. Biochem Biophys Res Commun (2014) 446(4):1079–84. doi: 10.1016/j.bbrc.2014.03.058
22. Thierbach G, Reichenbach H. Myxothiazol, a New Inhibitor of the Cytochrome B-C1 Segment of the Respiratory Chain. Biochim Biophys Acta (BBA) - Bioenergetics (1981) 638(2):282–9. doi: 10.1016/0005-2728(81)90238-3
23. Buttgereit F, Brand MD. A Hierarchy of ATP-Consuming Processes in Mammalian Cells. Biochem J (1995) 312(Pt 1):163–7. doi: 10.1042/bj3120163
24. Tripmacher R, Gaber T, Dziurla R, Häupl T, Erekul K, Grützkau A, et al. Human CD4+ T Cells Maintain Specific Functions Even Under Conditions of Extremely Restricted ATP Production. Eur J Immunol (2008) 38(6):1631–42. doi: 10.1002/eji.200738047
25. Raulien N, Friedrich K, Strobel S, Rubner S, Baumann S, von Bergen M, et al. Fatty Acid Oxidation Compensates for Lipopolysaccharide-Induced Warburg Effect in Glucose-Deprived Monocytes. Front Immunol (2017) 8:609. doi: 10.3389/fimmu.2017.00609
26. Marsin AS, Bouzin C, Bertrand L, Hue L. The Stimulation of Glycolysis by Hypoxia in Activated Monocytes is Mediated by AMP-Activated Protein Kinase and Inducible 6-Phosphofructo-2-Kinase. J Biol Chem (2002) 277(34):30778–83. doi: 10.1074/jbc.M205213200
27. Yarbro JR, Pence BD. Classical Monocytes From Older Adults Maintain Capacity for Metabolic Compensation During Glucose Deprivation and Lipopolysaccharide Stimulation. Mech Ageing Dev (2019) 183:111146. doi: 10.1016/j.mad.2019.111146
28. Forman HJ, Zhang H, Rinna A. Glutathione: Overview of its Protective Roles, Measurement, and Biosynthesis. Mol Aspects Med (2009) 30(1-2):1–12. doi: 10.1016/j.mam.2008.08.006
29. Starkov AA, Fiskum G. Myxothiazol Induces H(2)O(2) Production From Mitochondrial Respiratory Chain. Biochem Biophys Res Commun (2001) 281(3):645–50. doi: 10.1006/bbrc.2001.4409
30. Orr AL, Vargas L, Turk CN, Baaten JE, Matzen JT, Dardov VJ, et al. Suppressors of Superoxide Production From Mitochondrial Complex III. Nat Chem Biol (2015) 11(11):834–6. doi: 10.1038/nchembio.1910
31. Carter AB, Monick MM, Hunninghake GW. Both Erk and p38 Kinases are Necessary for Cytokine Gene Transcription. Am J Respir Cell Mol Biol (1999) 20(4):751–8. doi: 10.1165/ajrcmb.20.4.3420
32. Lee MKS, Al-Sharea A, Shihata WA, Bertuzzo Veiga C, Cooney OD, Fleetwood AJ, et al. Glycolysis Is Required for LPS-Induced Activation and Adhesion of Human CD14(+)CD16(-) Monocytes. Front Immunol (2019) 10:2054. doi: 10.3389/fimmu.2019.02054
33. Sun QA, Hess DT, Wang B, Miyagi M, Stamler JS. Off-Target Thiol Alkylation by the NADPH Oxidase Inhibitor 3-Benzyl-7-(2-Benzoxazolyl)thio-1,2,3-triazolo[4,5-d]pyrimidine (VAS2870). Free Radic Biol Med (2012) 52(9):1897–902. doi: 10.1016/j.freeradbiomed.2012.02.046
34. Reis J, Massari M, Marchese S, Ceccon M, Aalbers FS, Corana F, et al. A Closer Look Into NADPH Oxidase Inhibitors: Validation and Insight Into Their Mechanism of Action. Redox Biol (2020) 32:101466. doi: 10.1016/j.redox.2020.101466
35. Rabinovitch M. Professional and Non-Professional Phagocytes: An Introduction. Trends Cell Biol (1995) 5(3):85–7. doi: 10.1016/s0962-8924(00)88955-2
36. Tripmacher R. Untersuchungen Zu Wirkungen Einer Eingeschränkten Energiesynthese Auf Funktionen Von Humanen Immunzellen. Humboldt Universität zu Berlin Medizinische Fakultät - Universitätsklinikum Charité (2005) 1:81–3. doi: 10.18452/15260
37. Schittenhelm L, Hilkens CM, Morrison VL. beta2 Integrins As Regulators of Dendritic Cell, Monocyte, and Macrophage Function. Front Immunol (2017) 8:1866. doi: 10.3389/fimmu.2017.01866
38. Tamulyte S, Kopplin J, Brenner T, Weigand MA, Uhle F. Monocyte HLA-DR Assessment by a Novel Point-Of-Care Device Is Feasible for Early Identification of ICU Patients With Complicated Courses-A Proof-Of-Principle Study. Front Immunol (2019) 10:432. doi: 10.3389/fimmu.2019.00432
39. Roberts CA, Dickinson AK, Taams LS. The Interplay Between Monocytes/Macrophages and CD4(+) T Cell Subsets in Rheumatoid Arthritis. Front Immunol (2015) 6:571. doi: 10.3389/fimmu.2015.00571
40. Chousterman BG, Swirski FK, Weber GF. Cytokine Storm and Sepsis Disease Pathogenesis. Semin Immunopathol (2017) 39(5):517–28. doi: 10.1007/s00281-017-0639-8
41. Schuerwegh AJ, Stevens WJ, Bridts CH, De Clerck LS. Evaluation of Monensin and Brefeldin A for Flow Cytometric Determination of Interleukin-1 Beta, Interleukin-6, and Tumor Necrosis Factor-Alpha in Monocytes. Cytometry (2001) 46(3):172–6. doi: 10.1002/cyto.1102
42. Broz P, Dixit VM. Inflammasomes: Mechanism of Assembly, Regulation and Signalling. Nat Rev Immunol (2016) 16(7):407–20. doi: 10.1038/nri.2016.58
43. Lisi S, D’Amore M, Sisto M. ADAM17 at the Interface Between Inflammation and Autoimmunity. Immunol Lett (2014) 162(1 Pt A):159–69. doi: 10.1016/j.imlet.2014.08.008
44. Rose-John S. IL-6 Trans-Signaling via the Soluble IL-6 Receptor: Importance for the Pro-Inflammatory Activities of IL-6. Int J Biol Sci (2012) 8(9):1237–47. doi: 10.7150/ijbs.4989
45. Zheng Y, Sun L, Jiang T, Zhang D, He D, Nie H. TNFalpha Promotes Th17 Cell Differentiation Through IL-6 and IL-1beta Produced by Monocytes in Rheumatoid Arthritis. J Immunol Res (2014) 2014:385352. doi: 10.1155/2014/385352
46. Vivar N, Van Vollenhoven RF. Advances in the Treatment of Rheumatoid Arthritis. F1000Prime Rep (2014) 6:31. doi: 10.12703/P6-31
47. Smiljanovic B, Radzikowska A, Kuca-Warnawin E, Kurowska W, Grun JR, Stuhlmuller B, et al. Monocyte Alterations in Rheumatoid Arthritis are Dominated by Preterm Release From Bone Marrow and Prominent Triggering in the Joint. Ann Rheum Dis (2018) 77(2):300–8. doi: 10.1136/annrheumdis-2017-211649
48. Moroni F, Ammirati E, Norata GD, Magnoni M, Camici PG. The Role of Monocytes and Macrophages in Human Atherosclerosis, Plaque Neoangiogenesis, and Atherothrombosis. Mediators Inflammation (2019) 2019:7434376. doi: 10.1155/2019/7434376
49. van Onna M, Boonen A. The Challenging Interplay Between Rheumatoid Arthritis, Ageing and Comorbidities. BMC Musculoskelet Disord (2016) 17:184. doi: 10.1186/s12891-016-1038-3
50. Wang JC, Bennett M. Aging and Atherosclerosis: Mechanisms, Functional Consequences, and Potential Therapeutics for Cellular Senescence. Circ Res (2012) 111(2):245–59. doi: 10.1161/CIRCRESAHA.111.261388
51. Pence BD, Yarbro JR. Aging Impairs Mitochondrial Respiratory Capacity in Classical Monocytes. Exp Gerontol (2018) 108:112–7. doi: 10.1016/j.exger.2018.04.008
52. Millet P, Vachharajani V, McPhail L, Yoza B, McCall CE. GAPDH Binding to TNF-Alpha mRNA Contributes to Posttranscriptional Repression in Monocytes: A Novel Mechanism of Communication Between Inflammation and Metabolism. J Immunol (2016) 196(6):2541–51. doi: 10.4049/jimmunol.1501345
53. Murugina NE, Budikhina AS, Dagil YA, Maximchik PV, Balyasova LS, Murugin VV, et al. Glycolytic Reprogramming of Macrophages Activated by NOD1 and TLR4 Agonists: No Association With Proinflammatory Cytokine Production in Normoxia. J Biol Chem (2020) 295(10):3099–114. doi: 10.1074/jbc.RA119.010589
54. Suzuki H, Hisamatsu T, Chiba S, Mori K, Kitazume MT, Shimamura K, et al. Glycolytic Pathway Affects Differentiation of Human Monocytes to Regulatory Macrophages. Immunol Lett (2016) 176:18–27. doi: 10.1016/j.imlet.2016.05.009
55. Liu TF, Vachharajani V, Millet P, Bharadwaj MS, Molina AJ, McCall CE. Sequential Actions of SIRT1-RELB-SIRT3 Coordinate Nuclear-Mitochondrial Communication During Immunometabolic Adaptation to Acute Inflammation and Sepsis. J Biol Chem (2015) 290(1):396–408. doi: 10.1074/jbc.M114.566349
56. Tannahill GM, Curtis AM, Adamik J, Palsson-McDermott EM, McGettrick AF, Goel G, et al. Succinate is an Inflammatory Signal That Induces IL-1beta Through HIF-1alpha. Nature (2013) 496(7444):238–42. doi: 10.1038/nature11986
Keywords: immunometabolism, bioenergetics, IL-6, phagocytosis, human monocytes, energy, ATP, lack of glucose availability
Citation: Krauss P-L, Pfeiffenberger M, Damerau A, Buttgereit T, Chen Y, Gaber T and Buttgereit F (2021) Production of IL-6 and Phagocytosis Are the Most Resilient Immune Functions in Metabolically Compromised Human Monocytes. Front. Immunol. 12:730672. doi: 10.3389/fimmu.2021.730672
Received: 25 June 2021; Accepted: 01 October 2021;
Published: 19 October 2021.
Edited by:
Giamila Fantuzzi, University of Illinois at Chicago, United StatesReviewed by:
Stefan Rose-John, University of Kiel, GermanySina Tavakoli, University of Pittsburgh, United States
Copyright © 2021 Krauss, Pfeiffenberger, Damerau, Buttgereit, Chen, Gaber and Buttgereit. This is an open-access article distributed under the terms of the Creative Commons Attribution License (CC BY). The use, distribution or reproduction in other forums is permitted, provided the original author(s) and the copyright owner(s) are credited and that the original publication in this journal is cited, in accordance with accepted academic practice. No use, distribution or reproduction is permitted which does not comply with these terms.
*Correspondence: Frank Buttgereit, ZnJhbmsuYnV0dGdlcmVpdEBjaGFyaXRlLmRl
†These authors have contributed equally to this work and share first authorship
‡These authors have contributed equally to this work and share last authorship