 Shihao Xu1†
 Jing Luo2†
 Chengwei Zhu3†Jiachun Jiang1Hui Cheng3Ping Wang3Jingwei Hong3Jinxia Fang4Jingjing Pan5
 Matthew A. Brown6Xiaochun Zhu3
 Xiaobing Wang3,7*
- 1Department of Ultrasonography, The First Affiliated Hospital of Wenzhou Medical University, Wenzhou, China
- 2Beijing Tsinghua Changgung Hospital, School of Clinical Medicine, Tsinghua University, Beijing, China
- 3Department of Rheumatology, The First Affiliated Hospital of Wenzhou Medical University, Wenzhou, China
- 4Department of Rheumatology, Taizhou Hospital of Zhejiang University, Linhai, China
- 5Department of Laboratory Medicine, The First Affiliated Hospital of Wenzhou Medical University, Wenzhou, China
- 6Department of Medicine, Guy’s and St Thomas’ Hospital NHS Trust and King’s College London NIHR Biomedical Research Centre, London, United Kingdom
- 7Department of Rheumatology and Immunology, Shanghai Changzheng Hospital, Second Affiliated Hospital of Naval Medical University, Shanghai, China
Major salivary gland ultrasonography (SGUS) is increasingly being recognized as having critical roles in differentiating primary Sjögren’s syndrome (pSS) from other connective tissue disorders. Contrast-enhanced ultrasonography (CEUS) has been reported to evaluate microvascularity of lesions in different tissues with objective angiographic index, eliminating the observer-dependent defect of ultrasonography. However, there are few relevant studies concentrating on the application of CEUS in the diagnosis and assessment for pSS, and their clinical utility prospect remains uncertain. In this study, a total of 227 eligible patients were enrolled, including 161 pSS and 66 non-pSS patients with comprehensive ultrasonographic evaluation of the parotid and submandibular glands, including grayscale ultrasonography, color Doppler sonography (CDS), and CEUS. Compared with non-pSS, pSS patients had significantly higher grayscale ultrasound (US) scores and CDS blood grades in the parotid gland and significantly higher grayscale US and CEUS scores in the submandibular glands. Diagnostic model combining ultrasonographic signatures, anti-SSA/Ro60, and keratoconjunctivitis sicca (KCS) tests showed a remarkable discrimination [mean area under the curve (AUC)0.963 in submandibular glands and 0.934 in parotid glands] for pSS, and the nomogram provided excellent prediction accuracy and good calibration in individualized prediction of pSS. A combination of multiple ultrasonographical examinations of the major salivary glands (SGs) is a promising technique that may be used as a practical alternative to minor SG biopsy in the detection of pSS.
Introduction
Primary Sjögren’s syndrome (pSS) is a common chronic systemic autoimmune disease characterized by focal lymphocytic infiltration of the exocrine glands, especially in the salivary and tear glands, mainly presenting as xerostomia, xerophthalmia, and other extraglandular involvements (1). With a population prevalence of 0.05%–0.6% and a nearly 14:1 female/male ratio, pSS mostly affects middle-aged females between 30 and 50 years at the time of diagnosis (2, 3). Detection of pSS is a challenge due to the complex nature and heterogeneity of the disease and no gold standard test. An average of 7 years is required from onset of symptoms to final diagnosis (4). Current classification criteria (5, 6) have greatly improved this situation, with histopathology of minor salivary gland biopsy (MSGB) a dominant factor. However, the invasive nature of MSGB, with high risks of several complications such as persistent sensory deprivation caused by local nerve injury and pyogenic granuloma (7, 8), means it is still not accepted by all patients. Hence, there is an urgent unmet need for improved and non-invasive methods to facilitate the detection of pSS.
As a low-cost, non-invasive, repeatable, and effective technique without ionizing radiation, major salivary gland ultrasonography (SGUS) assists in differentiating pSS from non-immune-mediated sicca syndrome and other connective tissue disorders, with good sensitivity and high specificity (9–12). Recently, massive studies have demonstrated that grayscale ultrasound (US) could clearly display a subtle sonographic abnormality of the salivary glands (SGs) in pSS, including the glandular border, echostructure, and acoustic effects (13, 14). Furthermore, color Doppler sonography (CDS) could reflect changes in glandular hemodynamics by evaluating microvascular vascularity index values in pSS (15). Although ultrasonographical techniques are highly operator- and observer-dependent, various scoring systems, including De Vita score (16), Hocevar score (17), Salaffi score (18), Jousse-Joulin score (10), and OMERACT semiquantitative score (19), have been used to evaluate the typical SGUS changes of pSS, and many efforts have been made in the assessment of consensus and reliability of these scores for pSS, even in European Union (EU)-funded projects (20). However, their clinical utility prospect for the detection of pSS remains to be further investigated (21).
Contrast-enhanced ultrasonography (CEUS) has been reported to evaluate microvascularity of lesions in different tissues with objective angiographic index, eliminating the observer-dependent defect of US. CEUS has been applied to display the different characterizations of benign and malignant tumors and further estimate the therapeutic efficacy after chemotherapy, especially in hepatocellular carcinoma (22, 23). In addition, it was demonstrated that CEUS may play a significant role in detection of cancer in other non-hepatic organs (24). Moreover, several studies found CEUS valuable to evaluate dynamic microcirculation for localization of pathological glands, including the parathyroid (25) and SGs, especially for the differential diagnosis of benign and malignant lesions (26). Giuseppetti et al. (27) also demonstrated that the time–intensity curves (TICs) of contrast-enhanced US could provide useful information for sicca characterization and severity assessment. However, there are few relevant studies concentrating on the application of CEUS in the diagnosis of and assessment for pSS.
Currently, no classification criteria for pSS include US of the SGs, despite the increasing evidence that this technique might add diagnostic value for pSS (28). In this study, we explored the feasibility of using routine US techniques (grayscale and CDS), and first applied CEUS, to evaluate the structural and microvascular lesions of the parotid and submandibular glands. Moreover, a clinical prediction model was constructed, combined with US techniques and serological index, without an MSGB test.
Materials and Methods
Patients and Data Preparation
A total of 250 consecutive clinically suspected pSS candidates with xerostomia and/or xerophthalmia were enrolled from the Rheumatology Department of the First Affiliated Hospital of Wenzhou Medical University between January 1, 2019, and July 1, 2020. Fifteen candidates with severe cardiovascular and pulmonary diseases and eight with unstable vital signs or regional SG nodules or tumors, were excluded. The remaining 227 patients, all older than 18 years, underwent a comprehensive workup including physical examination, serological testing, MSGB, keratoconjunctivitis sicca (KCS) detection, and US examination of the parotid and submandibular glands. The KCS detection was performed by an experienced ophthalmologist including ocular staining, Schirmer’s test, and breakup time of tear film (BUT). These patients were subsequently divided into 161 pSS and 66 non-pSS subgroups based on the 2016 American College of Rheumatology (ACR)/European League Against Rheumatism (EULAR) (6) or 2012 ACR criteria (5). Detailed clinical information was recorded, and EULAR Sjögren’s Syndrome Disease Activity Index (ESSDAI) scores based on 2010 EULAR criteria (29) were used to reflect disease activity and systemic involvement. This study was approved by the ethics committee of the First Affiliated Hospital of Wenzhou Medical University, and written informed consent was received from all participants.
Assessment of Multimodal Ultrasound
Examinations of US were performed by two experienced sonographers. The LOGIQ E9 ultrasonographic scanner (GE Healthcare, Madison, WI, USA) equipped with an ML6-15-D linear array probe (6–15 MHz, GE Healthcare, Madison, WI, USA) was used to perform gray scale and CDS. The patient was placed in a supine position with overextension of the neck and the head turned to the opposite side. The bilateral parotid and submandibular glands were examined in the longitudinal and transverse planes. The semiquantitative SGUS score (0–16) was acquired by summing scores (0–4) of each parotid and submandibular gland according to the criteria of De Vita et al. (16). Intensity of blood flow in the SGs was evaluated by CDS with 7.5 MHz and classified as followsgrade 0, absence of blood flow; grade I, focal blood flow; grade II, marked blood flow (26).
A second-generation US contrast medium (sulfur hexafluoride, SonoVue; Bracco, Milan, Italy) was intravenously administered at a dose of 4.8 ml as a bolus and was subsequently flushed with 10 ml of saline. The examination was documented with a 90-s clip, starting at the beginning of the bolus injection. Data acquisition lasted approximately 10 min per patient, and kinetic analysis of the CEUS parameter was performed with dedicated software (VueBox; Bracco Suisse SA, Geneva, Switzerland). CEUS parameters were recorded and analyzed frame by frame using the fitting TIC quantification software by a well-trained sonographer with more than 5 years’ experience who was blinded to the results of diagnosis and disease status. A region of interest (ROI) was manually drawn on the target gland, and the following quantitative micro perfusion parameters were obtained with the fitting TIC that was constructed for the ROIarea under the curve (AUC) (Area), maximum ascending gradient (Grad), arrive time (Atm), time to peak (TtoP), peak intensity (PI), and intensity difference (ID).
Association Between Clinical Features and Ultrasound Characteristics
We performed a comparison of multiple US indices between pSS and non-pSS subgroups with Wilcoxon or chi-square test. Moreover, we further grouped the pSS and non-pSS cohorts into opposing groups based on different clinical phenotypes to explore their US characteristics. For example, based on the ESSDAI scores, the pSS cohorts were divided into I~III groups (I/mild, 0–4; II/medium, 5–13; III/severe, ≥14), and pathologically positive groups were identified as the patients with focus score ≥1 foci/4 mm2 in MSGB. Besides, in pSS patients, we also analyzed the lymphadenopathy and glandular ESSDAI domains (no, low, moderate) with the different US techniques. In addition, the relationship between CEUS signatures and pSS was investigated using a univariate logistic analysis to preliminarily screen pSS-associated indices, followed by further multivariate logistic regression. Candidate parameters with significant statistical values (p < 0.05) were selected to identify representative CEUS scores used for the establishment of a diagnostic model. The CEUS signatures of each patient were determined using:
where “val” represents values of CEUS parameters, and “β” represents the regression coefficient. In this study, six quantitative CEUS parameters of the parotid and submandibular glands were chosen to conduct univariate logistic regression analysis, including TtoP, Grad, Area, PI, Atm, and ID, and four submandibular CEUS parameters (Area, Grad, PI, and ID) were further screened for subsequent multivariable logistic regression analysis (Supplementary Table S1). Ultimately, submandibular Grad, PI, and ID were chosen to identify the final CEUS score as followsCEUS score = 13.087-0.003*Grad-0.811*ID-0.164PI.
Construction and Evaluation of Diagnostic Model for Primary Sjögren’s Syndrome
The randomForest package (30) was used to conduct random forest models with 100 runs of cross-validation, which predicted pSS based on multiple ultrasonographic indices and other key clinical features, including anti-SSA/Ro60, ocular staining, and Schirmer’s test, with or without MSGB. For each cross-validation, the 227 patients were randomly separated into a training set (n = 159) and a validation set (n = 68) according to the 7:3 ratio. Receiver operating characteristic (ROC) curves and significant indices including optimal cutoff point, AUC, sensitivity, and specificity were identified using the “ROCR” package to evaluate the efficiency of models (31). Furthermore, the probability of disease (POD) value was calculated to estimate accuracy, and the mean decrease of Gini coefficient was used to assess the impact of each variable in the random forest models. We also built different diagnostic models based on individual ultrasonographic signatures and clinical features to make a direct comparison of the discriminatory power using AUC value.
Two submaxillary US signatures (including grayscale US and CEUS scores) and classical clinical diagnostic indices (including anti-SSA/Ro60 and KCS examination) with significant diagnostic values (p < 0.05) were chosen to construct convenient and efficient nomograms for individualized prediction of pSS by using rms package (32). Significant parotid US parameters (including grayscale US scores and CDS blood grades) were also chosen to construct effective nomograms combined with the above clinical diagnostic index. Calibration curves of the nomogram in its corresponding training and validation sets were plotted to compare prediction and real observation in diagnosis of pSS through a bootstrapping method with 1,000 resamples. The C-index was also measured to evaluate the discriminatory power of the model. The clinical usefulness of the diagnostic nomogram model was determined by the decision curve analysis (DCA) after calculating the net benefits for patients at different risk threshold probabilities (33). Moreover, according to the DCA, clinical impact curves (CICs) were plotted to help us more intuitively assess the nomogram model’s diagnostic value for pSS.
Statistical Analysis
All statistical analyses were performed in R software (version 4.0.1, https://www.r-project.org/). Continuous and classified variables were presented as mean ± standard deviation and number (percentages), respectively. Wilcoxon signed-rank test was used to compare continuous variables, and chi-square test was applied to compare categorical variables. The two-tailed p-value <0.05 was considered statistically significant.
Results
Clinical Characteristics of Study Population
The overall workflow of the study is shown in Figure 1, and the clinical characteristics of the study cohorts are displayed in Table 1. In the pSS group, 149 (92.50%) patients were female and the average age was 48.07 years, ranging from 36.00–60.14, with a mean ESSDAI score of 8 (range, 4–15). There was no significant difference between the pSS and non-pSS groups in age and gender. pSS patients had similar prevalence of xerostomia (51.60% vs. 51.50%) and xerophthalmia (43.50% vs. 37.90%) but significantly higher rates of MSGB positivity (75.80% vs. 18.20%), KCS positivity (78.90% vs. 43.90%), antinuclear antibody (ANA) positivity (95.00% vs. 68.20%), anti-SSA/Ro60 positivity (82.60% vs. 13.60%), anti-SSA/Ro52 positivity (68.90% vs. 24.20%), RF positivity (28% vs. 18.20%), hypergamma-globulinemia (60.90% vs. 24.30%), and higher erythrocyte sedimentation rate levels (25.75 ± 21.60 mm/h vs. 13.64 ± 11.83 mm/h) compared with the non-pSS subgroup (p < 0.05 for all between-group comparisons).
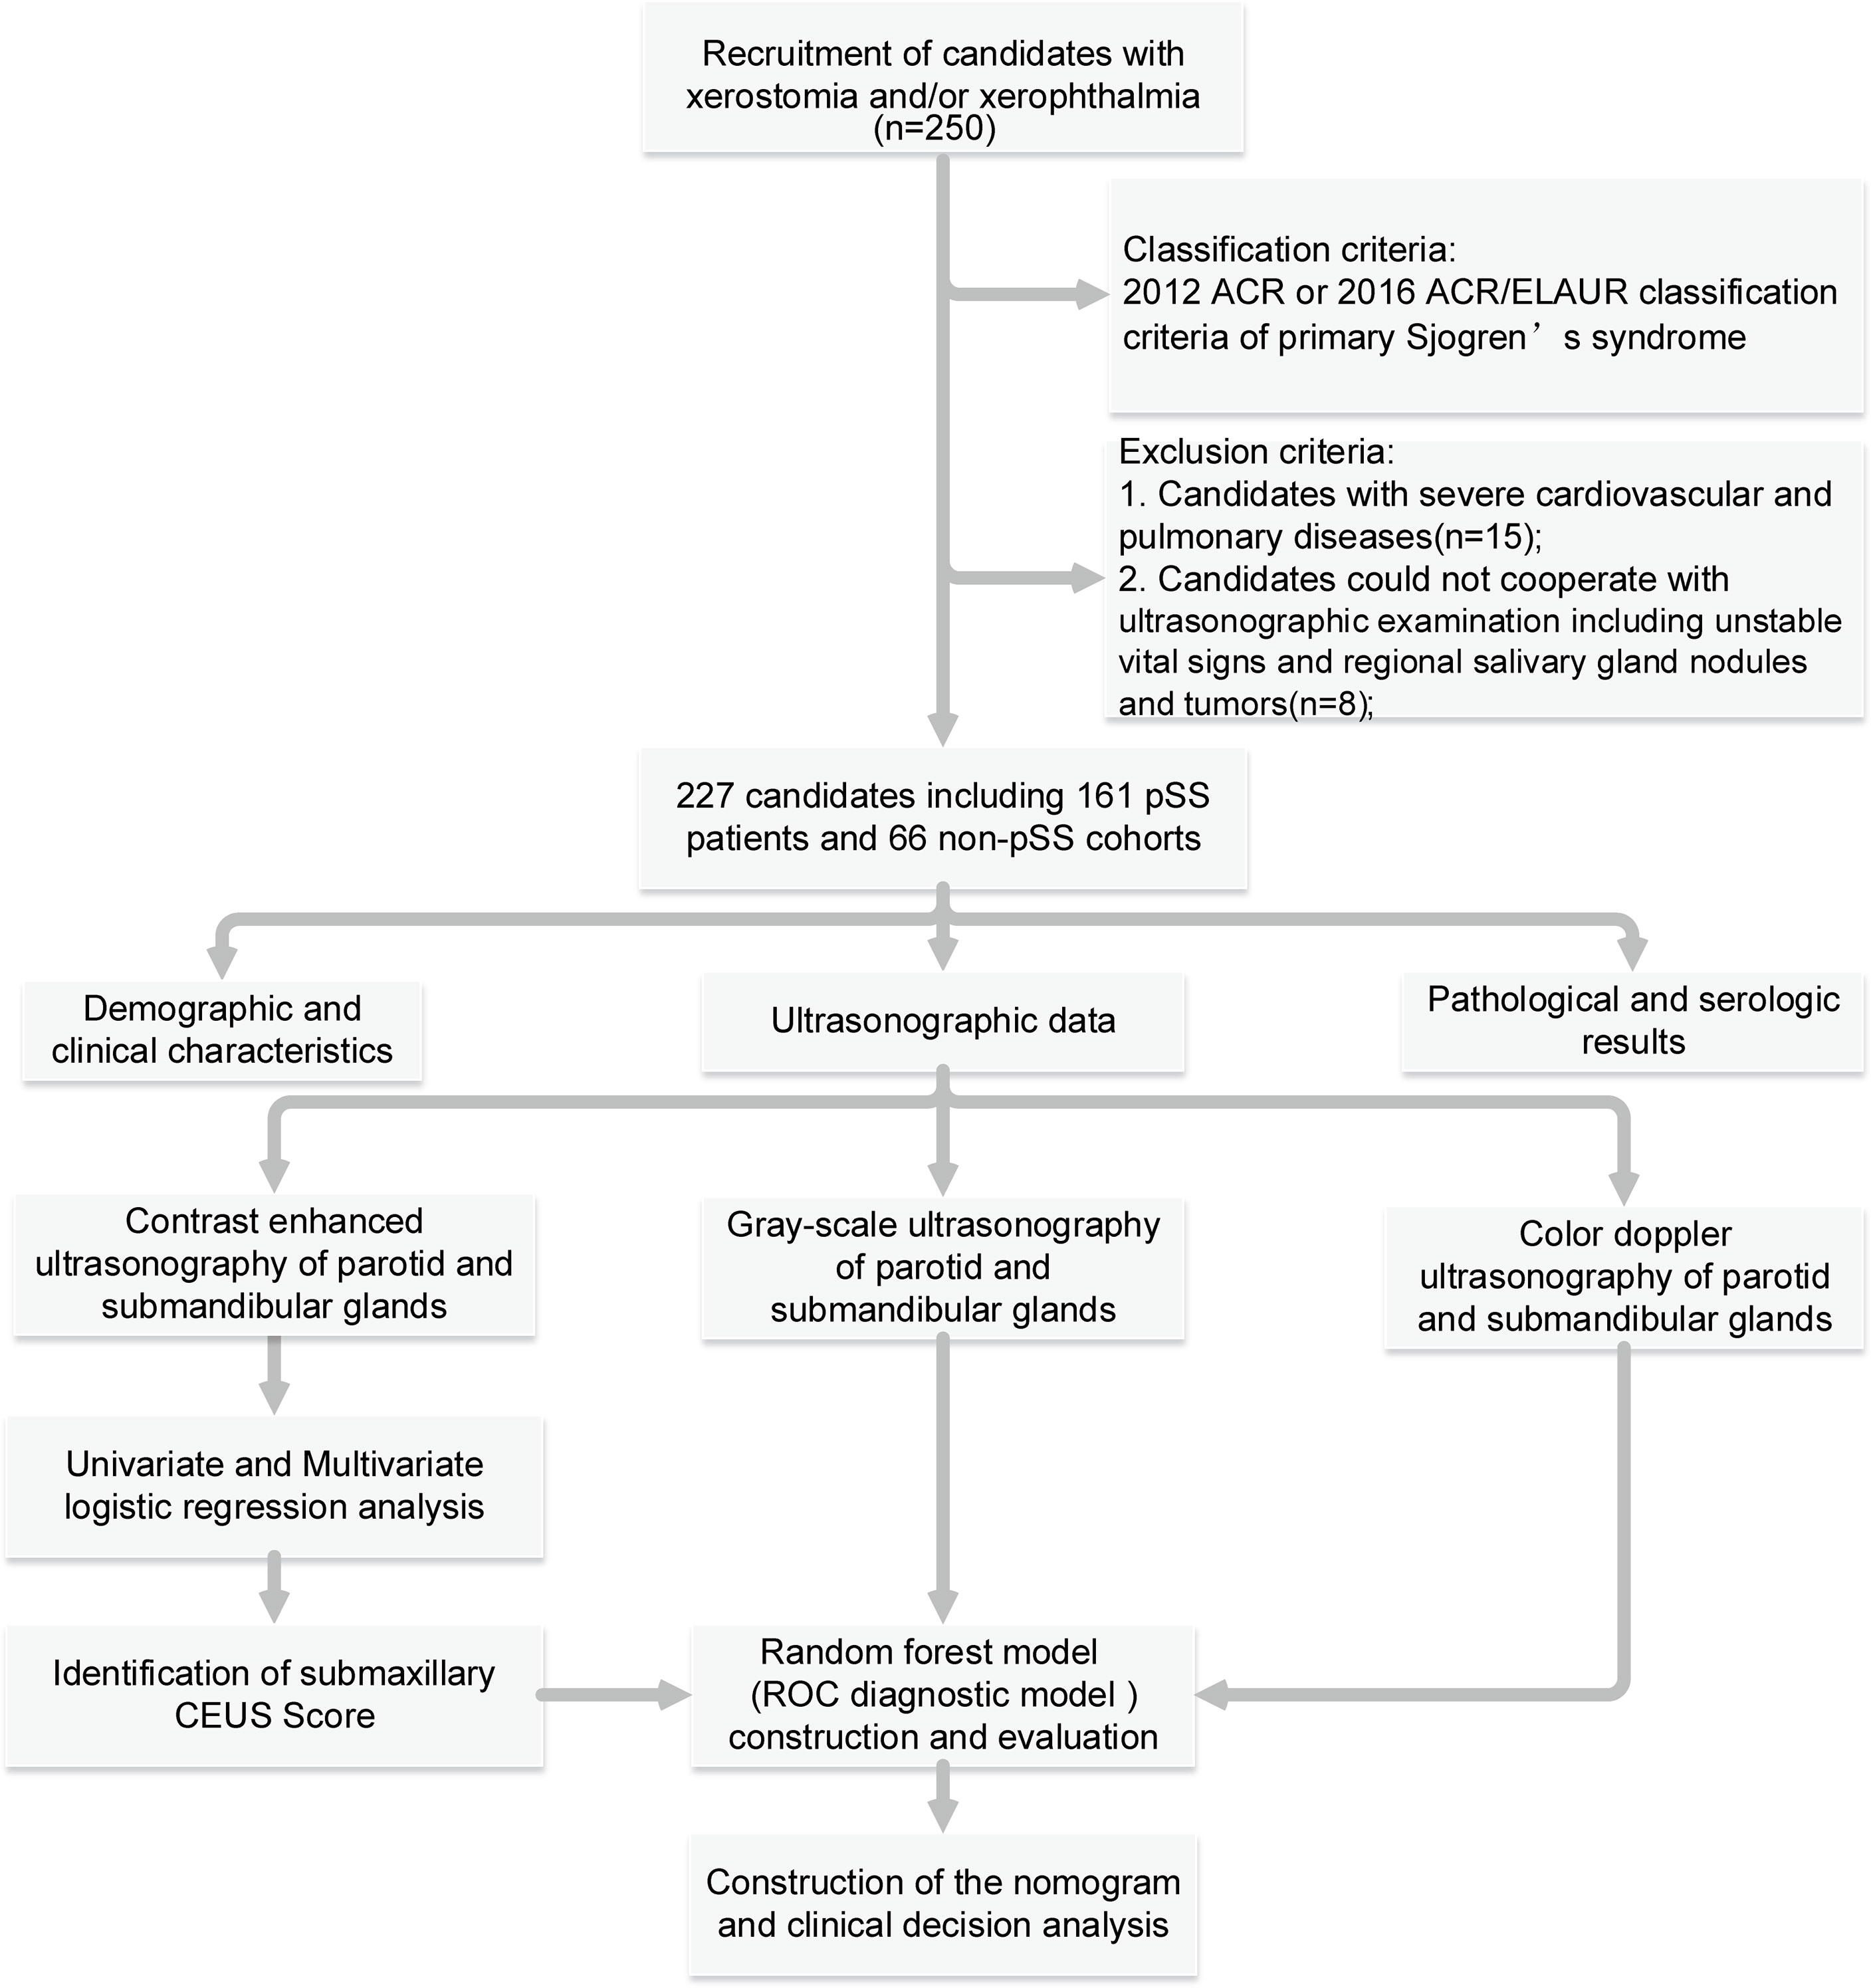
Figure 1 Summary and description of the study workflow.
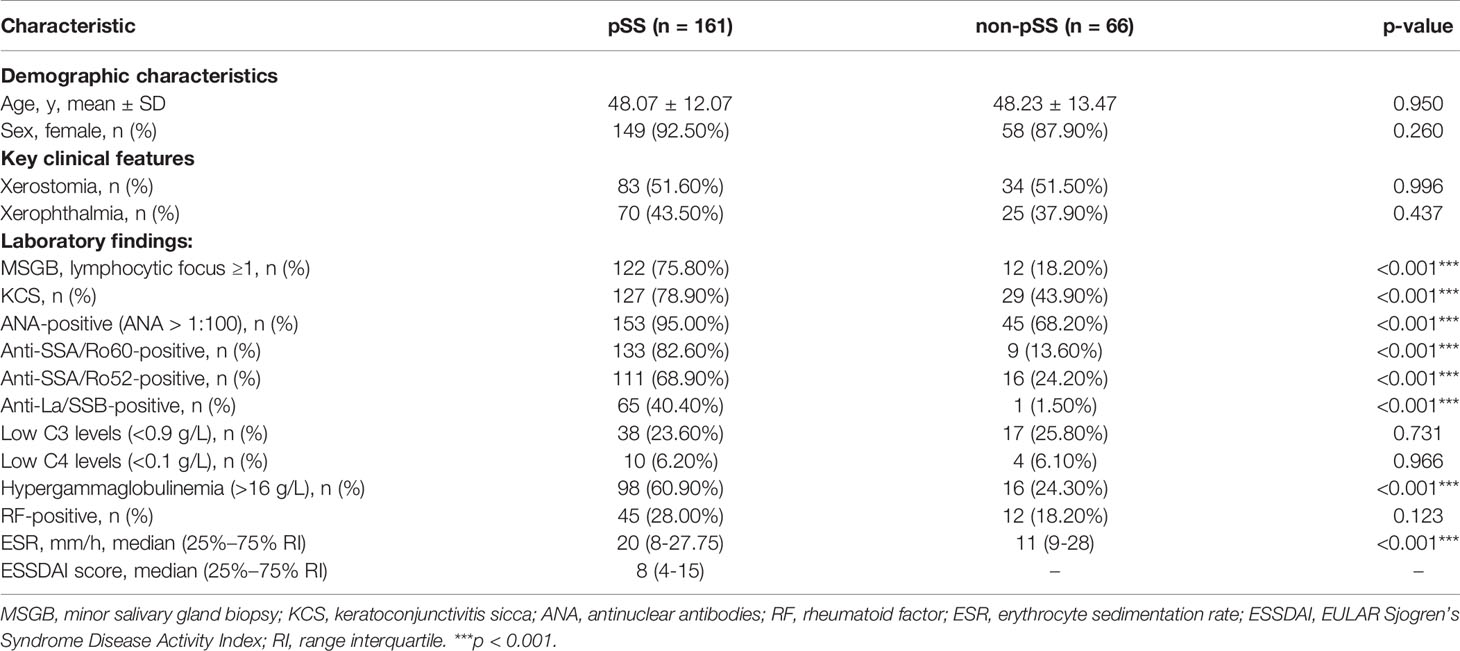
Table 1 Demographic and clinical characteristics of pSS and non-pSS patients.
Characteristics of Imaging Abnormalities in Primary Sjögren’s Syndrome
The multimodal US imaging characteristics are illustrated in Figure 2. The grayscale US exhibited homogeneous parenchyma in both the parotid and submandibular glands in the non-pSS cohort, while diffuse inhomogeneity with anechoic or hypoechoic areas was significantly detected in these glands in the pSS group (Figures 2A, B-a, d). Abundant hypervascularization was detected by CDS in the parotid and submandibular glands of pSS patients. Similar vascularization was found in the submandibular glands and less vascularization in the parotid glands of the non-pSS subgroup (Figures 2A, B-b, e). Furthermore, obvious larger echo-free areas without contrast enhancement and delayed peak time after contrast media injection were detected by CEUS in the submandibular glands, but not the parotid glands, of the pSS group (Figures 2A, B-c, f).
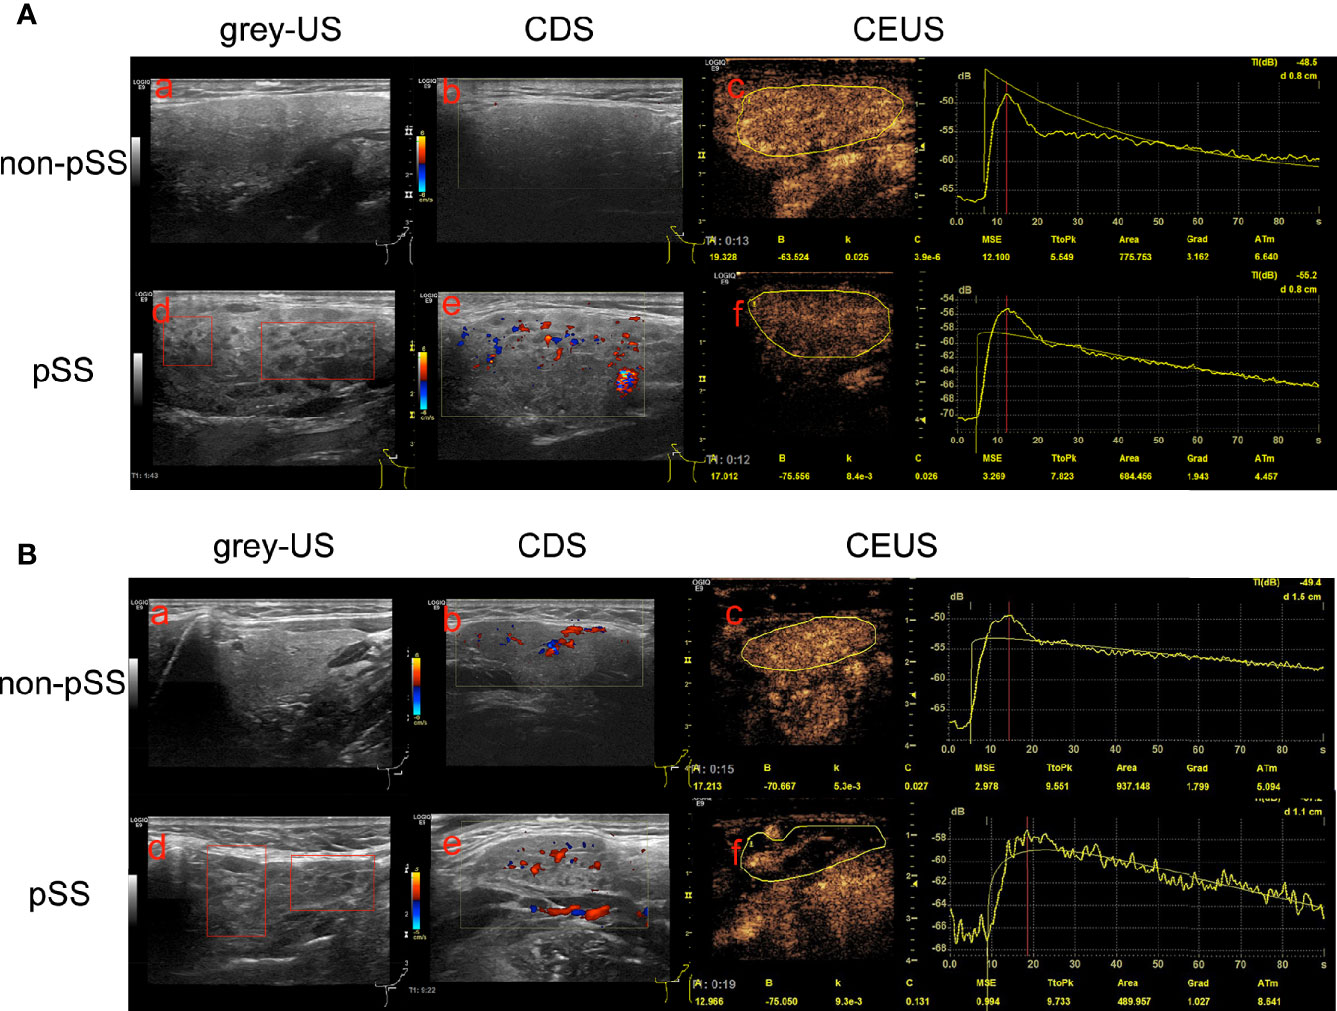
Figure 2 Multimodal ultrasonographic imaging characteristics of the parotid and submandibular glands between the primary Sjögren’s syndrome (pSS) and non-pSS subgroups. (A) Parotid glands: (a) homogeneous parenchyma without anechoic or hypoechoic areas in the non-pSS cohort; (d) diffuse inhomogeneity with anechoic or hypoechoic areas in pSS patients; CDS identified abundant hypervascularization in pSS cohorts (e) with poor vascularization in non-pSS groups (b); (c, f) No echo-free areas and delay TtoP in the parotid glands of pSS compared with non-pSS cohorts. (B) Submandibular glands: (a) homogeneous parenchyma without anechoic or hypoechoic areas in the non-pSS cohort; (d) diffuse inhomogeneity with anechoic or hypoechoic areas in pSS patients; (b, e) abundant hypervascularization detected in both pSS and non-pSS patients; (c, f) massive echo-free areas without contrast enhancement and significant delay TtoP after contrast media injection in pSS patients compared with non-pSS cohorts. US, Ultrasonography; CDS, Color Doppler sonography; CEUS, Contrast-enhanced ultrasonography; pSS, primary Sjögren’s syndrome.
The grayscale US scores of bilateral parotid and submandibular glands were significantly more elevated in the pSS subgroup than those in the non-pSS subgroup (p < 0.001) (Figure 3A). Regarding the blood intensity of the parotid glands detected by CDS, pSS patients demonstrated grade I changes (71% grade I, 29% grade II) more often compared with non-pSS patients (91% grade 1, 9% grade II; p = 0.004). However, there was no significant difference in the blood intensity of submandibular glands between pSS (grade I, 37% patients; grade II, 63% patients) and non-pSS subgroups (grade I, 24% patients; grade II, 76% patients) (p = 0.059) (Figure 3B). Notably, CEUS parameters, including Grad, Area, PI, and ID, were significantly decreased in the submandibular glands of pSS patients compared to non-pSS patients (p < 0.0001); however, no significant differences in CEUS parameters were found in the parotid glands between the two groups (Figure 3C, Supplementary Figure S1A).
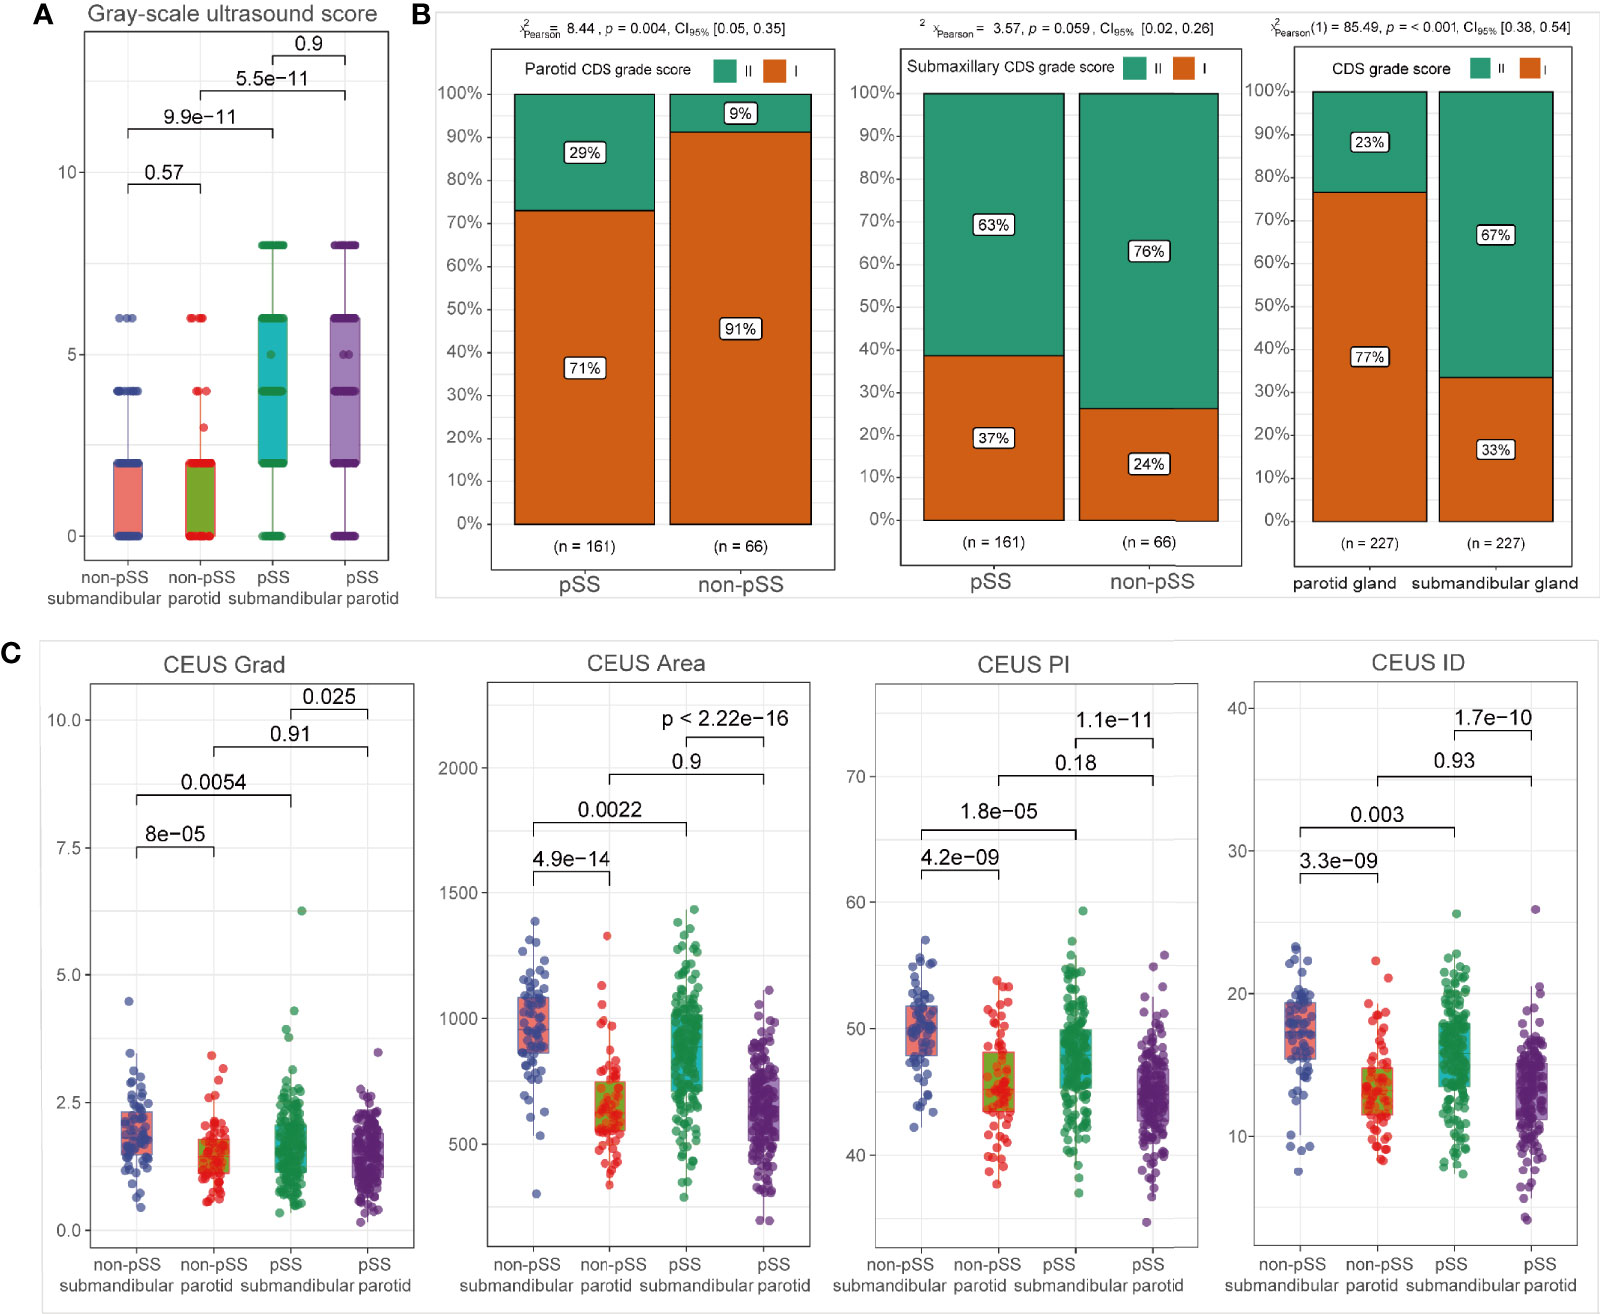
Figure 3 Ultrasonographic abnormalities in the salivary glands of primary Sjögren’s syndrome (pSS). Comparison of grayscale ultrasound (US) scores (A); CDS grade scores (B); and CEUS parameters (C) between subgroups, including pSS vs. non-pSS and parotid vs. submandibular glands.
Ultrasound Differences Between the Parotid and Submandibular Salivary Glands
As shown in Figure 3A, there was no significant difference in grayscale US scores between the parotid gland and submandibular glands in neither pSS nor non-pSS groups. However, blood intensity detected by CDS was significantly higher in the submandibular gland than that in the parotid gland (Figure 3B; p = 0.001). According to CEUS indices, higher levels of Grad, Area, PI, and ID were detected in the submandibular glands compared to the parotid glands both in the pSS and non-pSS cohorts (Figure 3C), and there was no significant difference in TtoP and Atm (Supplementary Figure S1A). To further evaluate whether ultrasonographic scores of unilateral glands were sufficient for the application of ultrasonographic diagnosis in pSS, we also performed the comparison of grayscale US scores between left and right parotid and submandibular glands. No significant statistical difference was observed between the two sides of parotid and submandibular glands for grayscale US scores in both pSS and non-pSS subgroups (Supplementary Figure S1B).
Association Between Ultrasonographic Features and Clinical Manifestations of Primary Sjögren’s Syndrome
To further investigate the correlation between ultrasonographic features and clinical manifestations of pSS, we divided the cohort into different subgroups based on the clinical manifestations and compared the ultrasonographic difference according to grayscale US scores, CDS blood grades, and CEUS scores. Both in parotid and submandibular glands, it turned out that the grayscale US scores were higher in SG pathology-positive patients, high-IgG level group, and anti-SSA/Ro60-positive groups than their corresponding control groups (p < 0.001), while there was no significant difference in the grayscale US scores among patients with different ESSDAI grades (Figures 4A, C). In addition, higher rate of CDS blood intensity grade II in parotid glands was found in pathologically positive group (p = 0.005) and high-IgG groups (p = 0.003), while there was no significant difference between subgroups for submandibular glands in neither ESSDAI nor anti-SSA/Ro60 phenotypes (p > 0.05; Figure 4B). Moreover, higher CEUS scores in submandibular glands were not only found in pathologically positive group (p = 0.016), high-IgG group (p = 0.025), and anti-SSA/Ro60-positive group (p < 0.001), but also in patients with higher ESSDAI grades (p < 0.05; Figure 4D). In addition, there was no significant statistical difference of CDS characteristics among distinct severities of both lymphadenopathy and glandular ESSDAI domain involvements. Interestingly, there was no significant difference in grayscale US score among different severities of lymphadenopathy ESSDAI domain involvements, while the grayscale US scores were higher in the moderate group than that in the group without glandular involvement in both parotid and submandibular glands (p = 0.023 and p = 0.038, respectively). Notably, as to glandular ESSDAI domain involvements, the CEUS scores were significantly positively associated with the severity of glandular abnormality, and there was no difference in lymphadenopathy ESSDAI domain involvements (Supplementary Figures S1C, D).
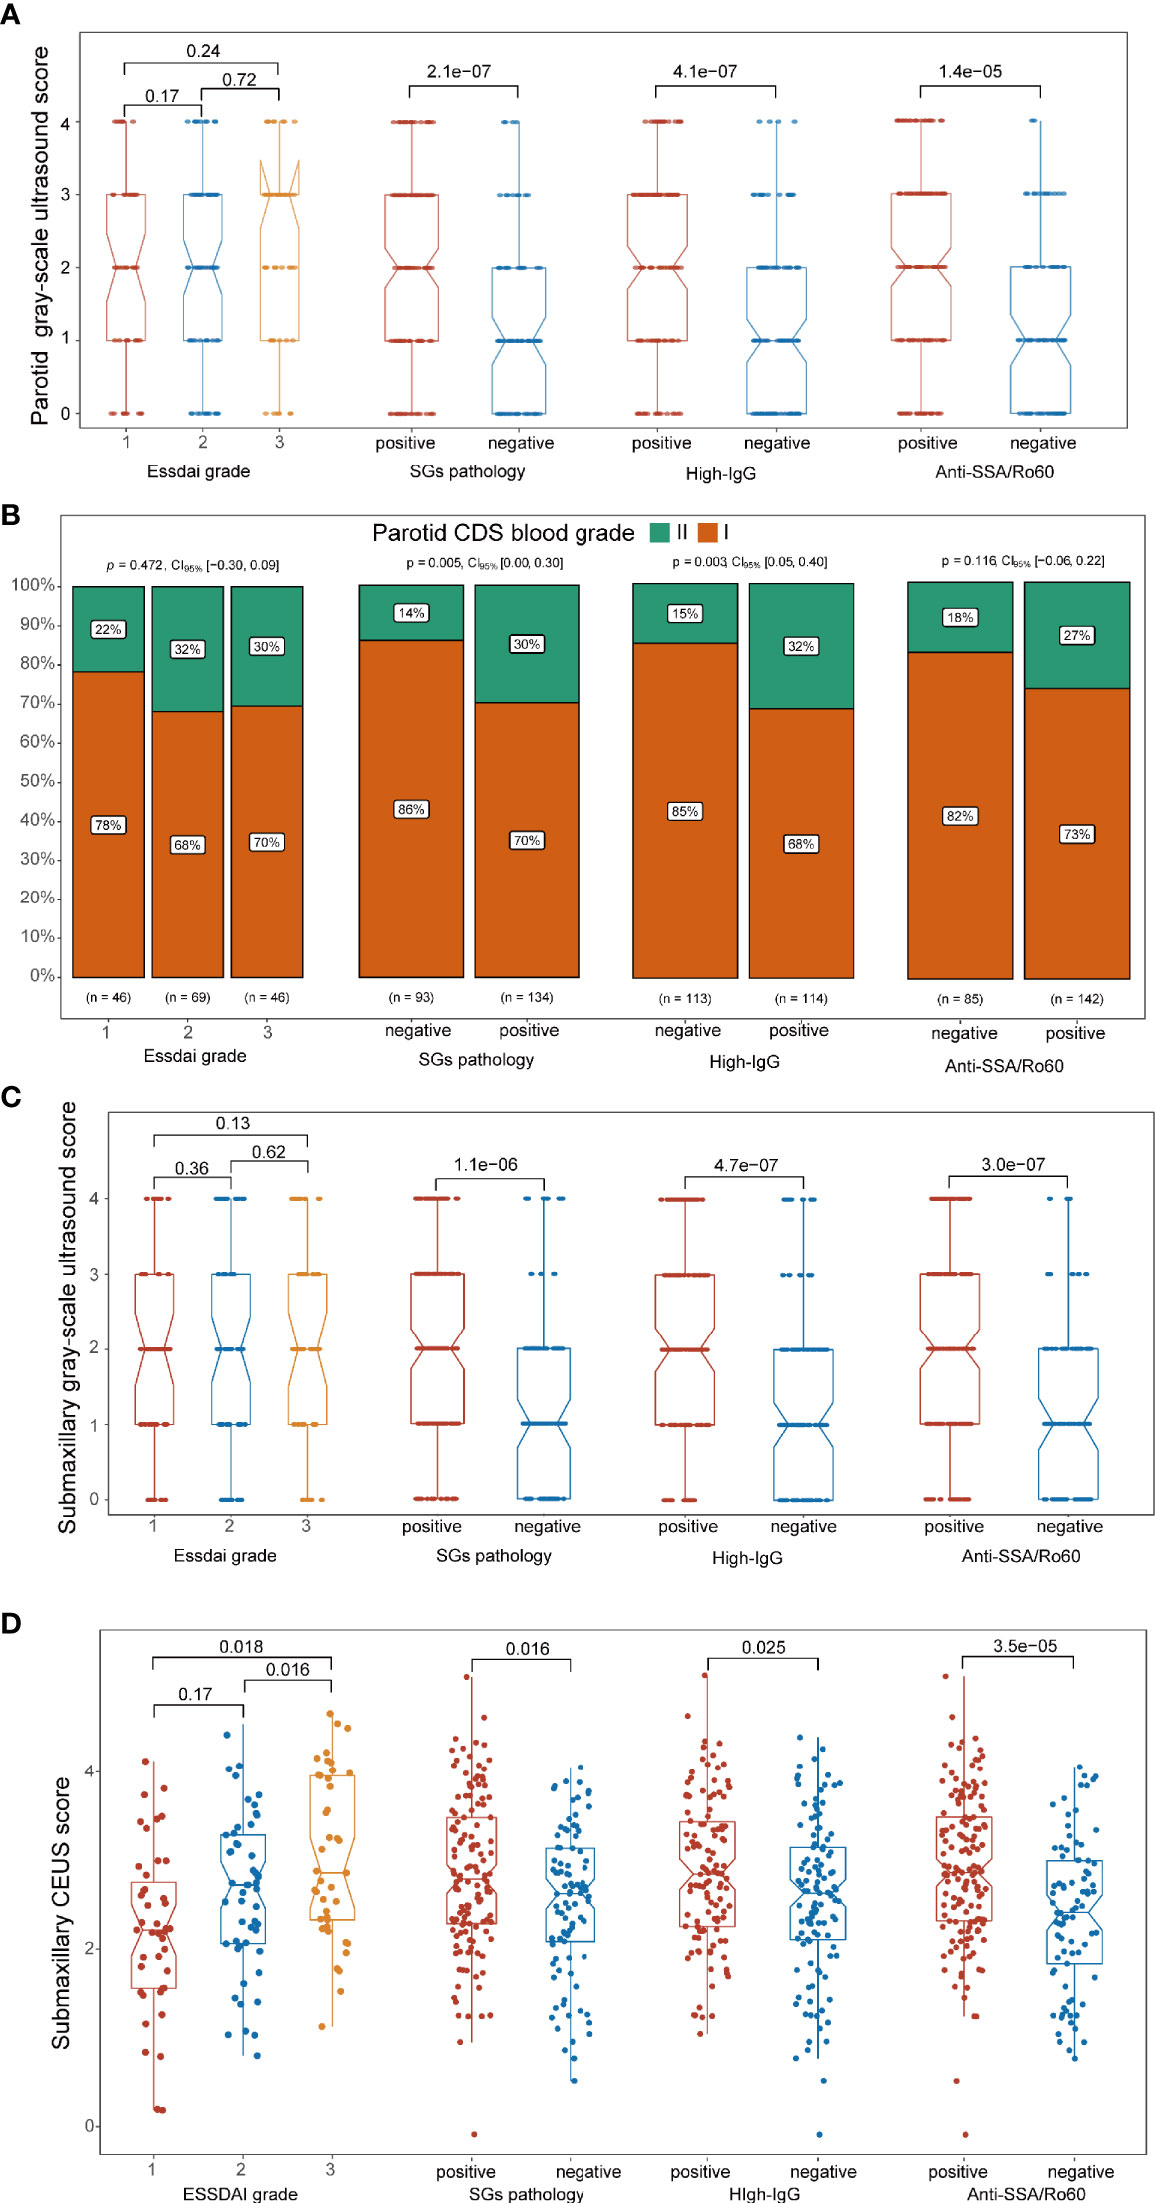
Figure 4 Association between ultrasonographic signatures and significant clinical phenotypes of primary Sjögren’s syndrome (pSS). (A, C) In both the parotid and submandibular glands, the grayscale ultrasound (US) scores were higher in pathologically positive, high IgG-positive, and anti-SSA/Ro60-positive groups (p < 0.001) than their corresponding groups, while there was no significant correlation in ESSDAI grade groups. (B) Higher rate of CDS grade II in the parotid glands was found in the pathologically positive group (p = 0.005) and high-IgG groups (p = 0.003), while there was no significant difference between subgroups in ESSDAI and anti-SSA/Ro60 phenotypes (p > 0.05). (D) Higher CEUS scores in submandibular glands were found in the pathologically positive group (p = 0.016), high-IgG group (p = 0.025), anti-SSA/Ro60-positive group (p < 0.001), and higher ESSDAI grades (p < 0.05).
Diagnostic Value of Ultrasound Signatures for Primary Sjögren’s Syndrome
In the submandibular glands, we revealed that ultrasonographic signatures manifested a high discriminatory capability in distinguishing pSS from non-pSS, with a mean AUC value of 0.807 for grayscale US scores and 0.764 for CEUS scores. However, CDS blood grades displayed poor discriminative capability with a mean AUC value of 0.565 (Table 2). In contrast, grayscale US scores and CDS blood grades also performed a good discriminatory capability, with mean AUC values of 0.809 and 0.639, respectively, in the parotid glands. However, the discriminative capability of the US model was significantly increased when grayscale US scores were combined with CEUS scores in the submandibular glands (mean AUC = 0.843) and with CDS blood grades in the parotid glands (mean AUC = 0.829). Notably, using ultrasonographic signatures (grayscale US and CEUS scores in the parotid glands, grayscale US and CDS blood grades in the submandibular glands) to replace the SG pathology, combined with anti-SSA/Ro60 and KCS positivity phenotypes, the model still showed a high discriminative accuracy for pSS, with mean AUC values of 0.963 and 0.934, respectively (Figure 5A).
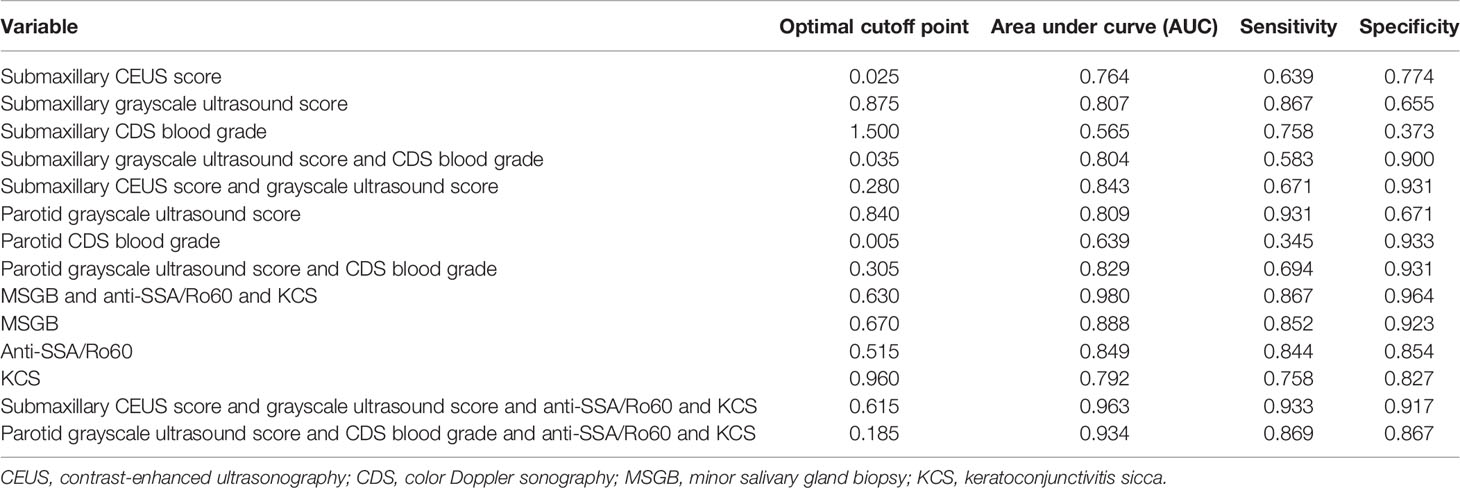
Table 2 Diagnostic models of parotid and submaxillary ultrasound and clinical index for pSS.
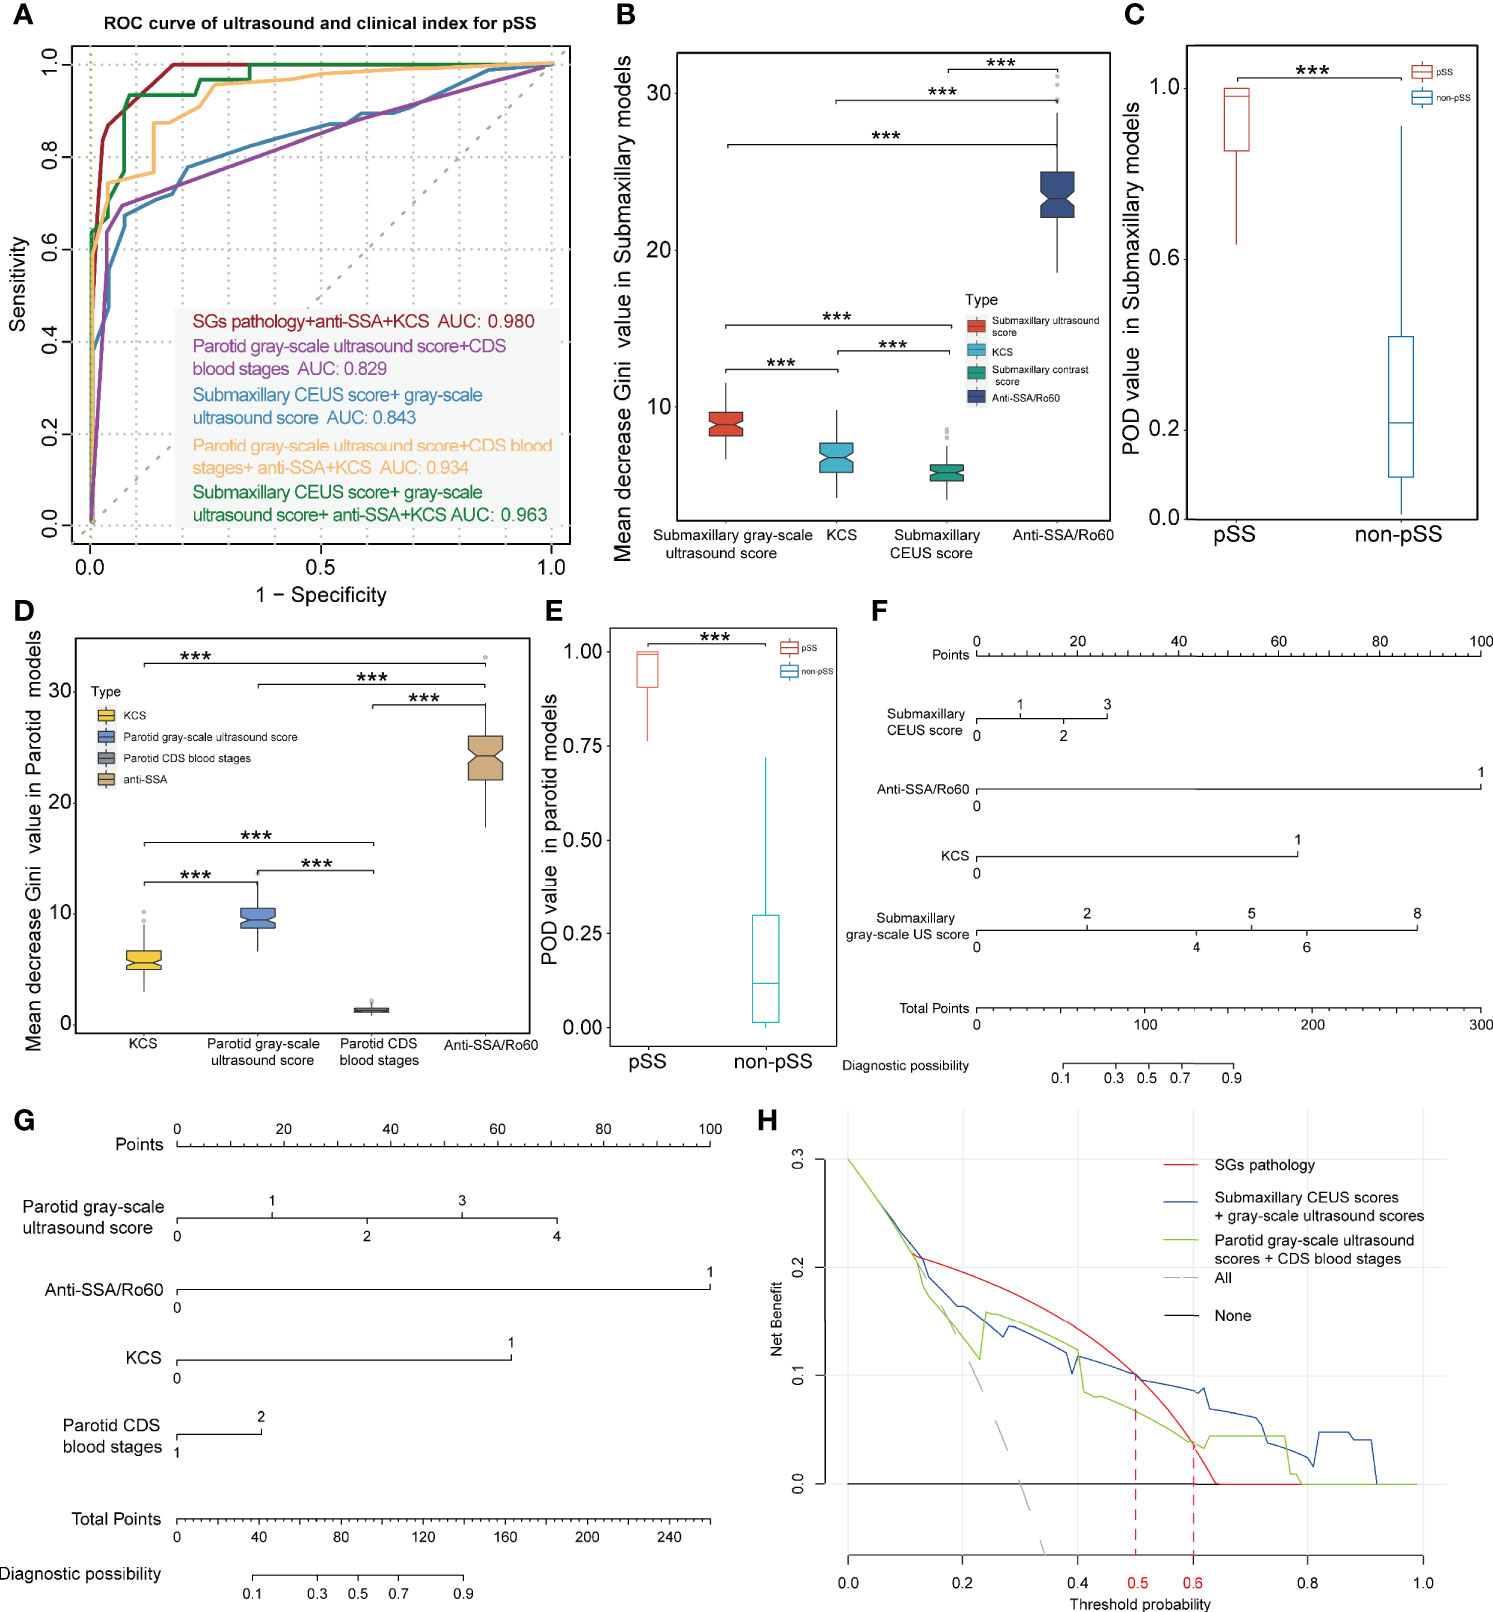
Figure 5 Diagnostic capacity of ultrasonographic signatures for primary Sjögren’s syndrome (pSS). (A) ROC curve of pSS prediction using the random forest models; red lines indicate the diagnostic capacity of clinical indices with MSGB (AUC 0.980); purple lines indicate the diagnostic capacity of the model with parotid grayscale ultrasound score and CDS blood stages (AUC 0.829); blue lines indicate the diagnostic capacity of the model with submaxillary CEUS score and grayscale ultrasound score (AUC 0.843); yellow lines indicate the diagnostic capacity of the model combining clinical indices and parotid ultrasonographic signatures without MSGB (AUC 0.934); and green lines indicate the diagnostic capacity of the model combining clinical indices and submaxillary ultrasonographic signatures without MSGB (AUC 0.963). (B, D) Mean decrease Gini coefficient represents the specific diagnostic capabilities of variables in the construction of the predicting model. Variable importance of ultrasonographic signatures is lower than anti-SSA/Ro60 positivity but significantly higher than KCS. (C, E) The combined models without MSGB reveal a high predictive accuracy with higher POD value for pSS in both the parotid and submandibular glands. Nomograms were developed to aid in predicting risk of pSS using the four prognostic factors in parotid (F) and submandibular glands (G). (H) DCA reveals the threshold probability of a patient was >50%/>60%. Using submandibular/parotid ultrasonographic examination adds more net benefit than using pathological results of the salivary glands for the prediction of pSS. ***p < 0.001.
To further estimate the contribution of each index to the overall classification ability, an random forest model with runs of cross-validation was conducted. The mean decrease in Gini coefficient of parotid and submaxillary US scores was lower than that of anti-SSA/Ro60 positivity while significantly higher than KCS (Figures 5B, D). In addition, CEUS scores also played a role in the model, although the mean decrease in Gini coefficient was lower than KCS. Furthermore, the accuracy of the prediction model was evaluated through calculating the POD value for pSS and demonstrated a significant difference in 1,000 random sampling (p < 0.001; Figures 5C, E). To investigate the potential relationship between CEUS scores and grayscale US scores in the submaxillary glands, the correlation analysis demonstrated that the correlation coefficient of submandibular grayscale US scores and CEUS scores was quite low (R = 0.22), although the p-value was 0.001 (Supplementary Figure S1F). We further divided the subjects into different subgroups according to the submandibular grayscale US scores (0–4 grades), and a comparison of submandibular CEUS scores between pSS and non-pSS at the identical grayscale US grade was performed. Interestingly, the CEUS scores of pSS were significantly higher than those of non-pSS in grayscale US grades 1 and 2 (p = 0.044, p = 0.040), while they had the same grayscale US grades (p > 0.05) (Supplementary Figure S1E).
Development and Validation of Nomogram for Individual Prediction in Primary Sjögren’s Syndrome
Nomograms were developed to aid in predicting risk of pSS using the four prognostic factors in parotid and submandibular glands (Figures 5F, G). The calibration curves exhibited high homogeneity between the prediction results and the observations in the training and validation cohorts, with the C-index of 0.9383 and 0.9088 in the parotid glands, and 0.9680 and 0.9070 in the submandibular glands, respectively (Supplementary Figures S1I–L). DCA for the nomogram using pathological examination of salivary, parotid, or submandibular ultrasonographic examination is demonstrated in Figure 5H. This revealed that if the threshold probability of a patient was >50%, using submandibular ultrasonographic examination adds more net benefit than using the pathological result of SGs for the prediction of pSS. In addition, when the threshold probability was more than 60%, using parotid ultrasonographic examination adds more net benefit (Figure 5H). In addition, CIC analysis for predicting pSS showed that threshold probabilities of >0.5 in submandibular and >0.6 in parotid detection were the most accurate for diagnosing pSS, consistent with the results of DCA (Supplementary Figures S1G, H).
Discussion
Recently, increasing interest has arisen for SGUS as a useful tool for the assessment of major salivary gland involvement in pSS. Major SGs were usually examined by grayscale and color Doppler US in most ultrasonographic evaluations of pSS (34, 35). Despite the effectiveness of grayscale US and color-coded duplex examinations, they can barely assess tissues that are deeply sited or obscured by bone, including the deep lobe of the parotid and deeply sited lymph nodes (36). In addition, its dependence on operator experience and lack of objective quantitative parameters reduce the reliability and stability in detection of pSS. These defects could be well supplemented by CEUS through drawing TICs, and CEUS parameters could qualitatively display the ultrasonographic changes of glands, including TtoP, Grad, Area, PI, Atm, and ID (37).
In this study, we are the first to combine these three ultrasonographic examinations for the detection of pSS. We have described the ultrasonographic signatures in the parotid and submandibular glands from various angles in pSS patients compared with non-pSS individuals. We found typical hypoechoic gland architecture and higher grayscale US scores in both the parotid and submandibular glands of pSS patients, which is consistent with previous studies (38, 39). Notably, there was no significant difference of grayscale US scores between parotid vs. submandibular glands in neither pSS nor non-pSS, indicating that the SGUS changes of either parotid or submandibular glands could be used for distinguishing pSS from non-pSS. However, Takagi et al. (40) identified that the diagnostic ability of submandibular US in discriminating pSS was significantly higher than that of parotid US. We also performed the comparison of grayscale US scores between left and right glands, and no significant difference was found. Therefore, unilateral examination is sufficient for the assessment of SG involvement in pSS, as reported previously (41).
CDS examinations were further applied to assess the blood flow velocity of the major SGs in a non-invasive and safe way. The parotid glands of pSS patients displayed more abundant blood intensity than that of non-pSS individuals. This is in accordance with the study by Steiner et al. (42), who used color codex duplex sonography and not only detected marked increased perfusion in pSS but also identified the correlation between blood perfusion and disease activity. A marked hyperemia always accompanies the increase of saliva secretion, which might be interpreted as a compensatory mechanism in pSS patients with xerostomia symptoms (43). Moreover, the hypervascular pattern in SGs appears to be directly associated with conspicuous parenchymal changes, including parenchymal heterogeneity changes and the increase of cyst-like structures, agreeing with the results of grayscale US (44). However, there was no significant difference of CDS grades in the submandibular glands between the pSS and non-pSS cohorts, although CDS grades in the submandibular glands in both groups were higher than that of the parotid glands. This may be due to the significantly abundant blood supply of the submandibular glands, as the parotid glands are traversed vertically by the retromandibular vein and maxillary artery, while the submandibular glands are supplied by the facial artery and vein (36). This results in reduced discriminative ability of CDS in the submandibular glands, as most of the participants showed high baseline levels of CDS blood grades with little distinction. Hence, we infer that abundant blood signals in the submandibular glands might disturb CDS to detect the blood flow changes in pSS, and the parotid glands might be more suitable for discriminating pSS from non-pSS by CDS.
Through conducting quantitative analysis of TIC, CEUS has been widely used in the differential diagnosis of benign and malignant diseases and assessment of treatment responses, such as for lymphoma (45), prostate cancer (46), and thyroid nodules (47). From the TIC, we gain two major types of information, including time-related parameters (Atm and TtoP) and intensity-dependent parameters (PI, Area, and Grad). In this study, CEUS examination indicated that lower levels of CEUS parameters (including Area, Grad, PI, and ID) were found in the submandibular glands of pSS than the non-pSS subgroup, implying potential dispersion dysfunction and reduced glandular activity in pSS patients. Cao et al. (48) found similar CEUS parameter changes in tumors after neoadjuvant chemotherapy, including reduced PI and washing slope. Indeed, peak signal intensity was directly related to blood volume and microbubble concentration (45), while these two elements would be distinctly decreased due to gland dysfunction caused by diseases. In pSS patients, massive structural abnormalities of SGs were demonstrated by histological biopsy, including local vasculitis, germinal center-like structure formation, and lymphocyte infiltration (49, 50). All these structural abnormalities would lead to the decrease of CEUS parameters in pSS patients. To better clarify the most efficient quantitative parameters for CEUS examination, CEUS score was identified in our study based on univariate and multivariate logistic regression analysis, including three essential CEUS parametersGrad, PI, and difference.
A close association between clinical features and US manifestations was revealed by our study. Not only were grayscale US scores significantly positively correlated with SG pathology, anti-SSA/Ro60 positivity, and hyperimmuno-globulinemia, as demonstrated in the study by La Paglia et al. (51), but higher CDS grade scores were also associated with SG pathology positivity. It is noteworthy that, besides significant correlation with the above clinical phenotypes, CEUS scores were also significantly positively associated with ESSDAI grades of pSS, suggesting that CEUS scores might reflect the disease activity of pSS.
As for the discriminative capability for pSS, the mean AUC value of independent grayscale US of submandibular glands was 0.807, while that of combined grayscale US and CEUS scores of submandibular glands, together with anti-SSA/Ro60 and KCS test, independent of SG pathology, was up to 0.963, with a sensitivity of 93.3% and specificity of 91.7%. Meanwhile, combined grayscale US and CDS of parotid glands had a mean AUC value of 0.934, together with anti-SSA/Ro60 and KCS test, with a sensitivity of 86.9% and specificity of 86.7%. Both multi-ultrasonographic combinations showed promising prospects in classification of pSS from non-pSS without performing MSGB. This opens the potential for applying this method to detect pSS patients in clinical practice and providing a new non-invasive tool to map the structure-function change of SGs in this population. Interestingly, we found that submaxillary CEUS scores play a role in discriminating pSS from non-pSS, even in the same grayscale US grades, indicating that CEUS scores could be used as an auxiliary tool to help improve the diagnostic accuracy of pSS by grayscale US as for submandibular glands; however, CDS is a good supplement to grayscale US for the parotid glands.
The nomogram established by incorporating the corresponding submaxillary ultrasonographic signatures and anti-SSA/Ro60 and KCS, except for SG pathology, could be used in clinical practice. This was confirmed by excellent calibration between prediction and observation, which achieved satisfactory discrimination in the training and validation cohorts, with high C-indices, respectively. These results further support that parotid and submaxillary ultrasonographic signatures could be used to facilitate the individualized prediction for the diagnosis of pSS.
There were several limitations of this study. First, all patients were recruited from a single center. Therefore, the study population size was limited. Besides, we used non-pSS as control group rather than healthy control, whose normal labial SGs we were unable to obtain because of ethical concern. However, a small part of the non-pSS, although cannot meet either of the classification criteria at present stage, might develop into pSS, which might potentially influence the classification ability of the model. In addition, the diagnostic value of ultrasonographic signatures for pSS still needs to be validated using multicenter research with a larger patient population. Furthermore, the detailed pathophysiological mechanism of different ultrasonographic signatures of parotid and submaxillary glands in pSS remains to be investigated by further studies.
Conclusion
In conclusion, we detected and summarized the ultrasonographic signatures of the parotid and submaxillary glands in pSS and evaluated the correlation between ultrasonographic signatures and clinical characteristics. Moreover, we identified compositive CEUS scores to represent the features of CEUS parameters and successfully constructed a combined diagnostic model consisting of submaxillary or parotid gland ultrasonographic signatures and classical clinical characteristics to facilitate accurate individual prediction for pSS. Glandular US examination is a promising alternative to MSGB and a safe and efficient tool for the detection of pSS.
Data Availability Statement
The original contributions presented in the study are included in the article/Supplementary Material. Further inquiries can be directed to the corresponding author.
Ethics Statement
This study involving human participants was approved by the Ethics Committee of the First Affiliated Hospital of Wenzhou Medical University (2016024), and written informed consent was received from all participants for their enrollment. The patients/participants provided their written informed consent to participate in this study.
Author Contributions
SX and JJ contributed to ultrasonographical examinations. JL and CZ contributed to the data analysis and drafting of the article. HC and PW contributed to the data analysis. JF and JP contributed to the subject recruitment and clinical information collection. JH contributed to minor salivary gland biopsy. MB and XZ contributed to clinical evaluation. XW contributed to design of the study and revision of the article. All authors contributed to the article and approved the submitted version.
Funding
This study was supported by the Medical and Health Science and Technology project of Zhejiang Province grants (2021RC090), the Medical and Health Science and Technology project of Zhejiang Province grants (2021KY789), and Wenzhou Science and Technology Project (Y20190680).
Conflict of Interest
The authors declare that the research was conducted in the absence of any commercial or financial relationships that could be construed as a potential conflict of interest.
Publisher’s Note
All claims expressed in this article are solely those of the authors and do not necessarily represent those of their affiliated organizations, or those of the publisher, the editors and the reviewers. Any product that may be evaluated in this article, or claim that may be made by its manufacturer, is not guaranteed or endorsed by the publisher.
Acknowledgments
The authors acknowledge the contribution of the patients who participated in this study.
Supplementary Material
The Supplementary Material for this article can be found online at: https://www.frontiersin.org/articles/10.3389/fimmu.2021.777322/full#supplementary-material
References
1. Ramos-Casals M, Brito-Zeron P, Seror R, Bootsma H, Bowman SJ, Dorner T, et al. Characterization of Systemic Disease in Primary Sjogren’s Syndrome: EULAR-SS Task Force Recommendations for Articular, Cutaneous, Pulmonary and Renal Involvements. Rheumatol (Oxford) (2015) 54(12):2230–8. doi: 10.1093/rheumatology/kev200
2. Brito-Zeron P, Acar-Denizli N, Zeher M, Rasmussen A, Seror R, Theander E, et al. Influence of Geolocation and Ethnicity on the Phenotypic Expression of Primary Sjogren’s Syndrome at Diagnosis in 8310 Patients: A Cross-Sectional Study From the Big Data Sjogren Project Consortium. Ann Rheum Dis (2017) 76(6):1042–50. doi: 10.1136/annrheumdis-2016-209952
3. Maldini C, Seror R, Fain O, Dhote R, Amoura Z, De Bandt M, et al. Epidemiology of Primary Sjogren’s Syndrome in a French Multiracial/Multiethnic Area. Arthritis Care Res (Hoboken) (2014) 66(3):454–63. doi: 10.1002/acr.22115
4. Segal B, Bowman SJ, Fox PC, Vivino FB, Murukutla N, Brodscholl J, et al. Primary Sjogren’s Syndrome: Health Experiences and Predictors of Health Quality Among Patients in the United States. Health Qual Life Outcomes (2009) 7:46. doi: 10.1186/1477-7525-7-46
5. Shiboski SC, Shiboski CH, Criswell L, Baer A, Challacombe S, Lanfranchi H, et al. American College of Rheumatology Classification Criteria for Sjogren’s Syndrome: A Data-Driven, Expert Consensus Approach in the Sjogren’s International Collaborative Clinical Alliance Cohort. Arthritis Care Res (Hoboken) (2012) 64(4):475–87. doi: 10.1002/acr.21591
6. Shiboski CH, Shiboski SC, Seror R, Criswell LA, Labetoulle M, Lietman TM, et al. 2016 American College of Rheumatology/European League Against Rheumatism Classification Criteria for Primary Sjogren’s Syndrome: A Consensus and Data-Driven Methodology Involving Three International Patient Cohorts. Arthritis Rheumatol (2017) 69(1):35–45. doi: 10.1002/art.39859
7. Colella G, Cannavale R, Vicidomini A, Itro A. Salivary Gland Biopsy: A Comprehensive Review of Techniques and Related Complications. Rheumatol (Oxford) (2010) 49(11):2117–21. doi: 10.1093/rheumatology/keq225
8. Lida Santiago M, Seisdedos MR, Garcia Salinas RN, Secco A, Marino Claverie L, Techera L, et al. Frequency of Complications and Usefulness of the Minor Salivary Gland Biopsy. Reumatol Clin (2012) 8(5):255–8. doi: 10.1016/j.reumae.2012.07.004
9. Milic V, Petrovic R, Boricic I, Radunovic G, Marinkovic-Eric J, Jeremic P, et al. Ultrasonography of Major Salivary Glands Could be an Alternative Tool to Sialoscintigraphy in the American-European Classification Criteria for Primary Sjogren’s Syndrome. Rheumatol (Oxford) (2012) 51(6):1081–5. doi: 10.1093/rheumatology/ker431
10. Cornec D, Jousse-Joulin S, Pers JO, Marhadour T, Cochener B, Boisrame-Gastrin S, et al. Contribution of Salivary Gland Ultrasonography to the Diagnosis of Sjogren’s Syndrome: Toward New Diagnostic Criteria? Arthritis Rheum (2013) 65(1):216–25. doi: 10.1002/art.37698
11. Baldini C, Luciano N, Tarantini G, Pascale R, Sernissi F, Mosca M, et al. Salivary Gland Ultrasonography: A Highly Specific Tool for the Early Diagnosis of Primary Sjogren’s Syndrome. Arthritis Res Ther (2015) 17:146. doi: 10.1186/s13075-015-0657-7
12. Luciano N, Ferro F, Bombardieri S, Baldini C. Advances in Salivary Gland Ultrasonography in Primary Sjogren’s Syndrome. Clin Exp Rheumatol (2018) 36 Suppl 114(5):159–64.
13. Sezer I, Erdem Toslak I, Yagci B, Erbasan F, Ayan A, Karasu U. The Role of Real-Time Tissue Elastography and Gray-Scale Ultrasound Histogram Analysis in the Diagnosis of Patients With Sjogren’s Syndrome. Arch Rheumatol (2019) 34(4):371–9. doi: 10.5606/ArchRheumatol.2019.7120
14. Jousse-Joulin S, Nowak E, Cornec D, Brown J, Carr A, Carotti M, et al. Salivary Gland Ultrasound Abnormalities in Primary Sjogren’s Syndrome: Consensual US-SG Core Items Definition and Reliability. RMD Open (2017) 3(1):e000364. doi: 10.1136/rmdopen-2016-000364
15. Ustabasioglu FE, Korkmaz S, Ilgen U, Solak S, Kula O, Turan S, et al. Quantitative Assessment of Salivary Gland Parenchymal Vascularization Using Power Doppler Ultrasound and Superb Microvascular Imaging: A Potential Tool in the Diagnosis of Sjogren’s Syndrome. Balkan Med J (2020) 37(4):203–7. doi: 10.4274/balkanmedj.galenos.2020.2019.11.91
16. De Vita S, Lorenzon G, Rossi G, Sabella M, Fossaluzza V. Salivary Gland Echography in Primary and Secondary Sjogren’s Syndrome. Clin Exp Rheumatol (1992) 10(4):351–6.
17. Hocevar A, Ambrozic A, Rozman B, Kveder T, Tomsic M. Ultrasonographic Changes of Major Salivary Glands in Primary Sjogren’s Syndrome. Diagnostic Value of a Novel Scoring System. Rheumatol (Oxford) (2005) 44(6):768–72. doi: 10.1093/rheumatology/keh588
18. Salaffi F, Argalia G, Carotti M, Giannini FB, Palombi C. Salivary Gland Ultrasonography in the Evaluation of Primary Sjogren’s Syndrome. Comparison With Minor Salivary Gland Biopsy. J Rheumatol (2000) 27(5):1229–36.
19. Finzel S, Jousse-Joulin S, Costantino F, Hanova P, Hocevar A, Iagnocco A, et al. Patient-Based Reliability of the Outcome Measures in Rheumatology (OMERACT) Ultrasound Scoring System for Salivary Gland Assessment in Patients With Sjogren’s Syndrome. Rheumatol (Oxford) (2021) 60(5):2169–76. doi: 10.1093/rheumatology/keaa471
20. Zabotti A, Zandonella Callegher S, Tullio A, Vukicevic A, Hocevar A, Milic V, et al. Salivary Gland Ultrasonography in Sjogren’s Syndrome: A European Multicenter Reliability Exercise for the HarmonicSS Project. Front Med (Lausanne) (2020) 7:581248. doi: 10.3389/fmed.2020.581248
21. Delli K, Dijkstra PU, Stel AJ, Bootsma H, Vissink A, Spijkervet FK. Diagnostic Properties of Ultrasound of Major Salivary Glands in Sjogren’s Syndrome: A Meta-Analysis. Oral Dis (2015) 21(6):792–800. doi: 10.1111/odi.12349
22. Kang HJ, Lee JM, Yoon JH, Lee K, Kim H, Han JK. Contrast-Enhanced US With Sulfur Hexafluoride and Perfluorobutane for the Diagnosis of Hepatocellular Carcinoma in Individuals With High Risk. Radiology (2020) 297(1):108–16. doi: 10.1148/radiol.2020200115
23. Claudon M, Dietrich CF, Choi BI, Cosgrove DO, Kudo M, Nolsoe CP, et al. Guidelines and Good Clinical Practice Recommendations for Contrast Enhanced Ultrasound (CEUS) in the Liver–Update 2012: A WFUMB-EFSUMB Initiative in Cooperation With Representatives of AFSUMB, AIUM, ASUM, FLAUS and ICUS. Ultraschall Med (2013) 34(1):11–29. doi: 10.1055/s-0032-1325499
24. Cantisani V, Bertolotto M, Weskott HP, Romanini L, Grazhdani H, Passamonti M, et al. Growing Indications for CEUS: The Kidney, Testis, Lymph Nodes, Thyroid, Prostate, and Small Bowel. Eur J Radiol (2015) 84(9):1675–84. doi: 10.1016/j.ejrad.2015.05.008
25. Hornung M, Jung EM, Stroszczynski C, Schlitt HJ, Agha A. Contrast-Enhanced Ultrasonography (CEUS) Using Early Dynamic in Microcirculation for Localization of Pathological Parathyroid Glands: First-Line or Complimentary Diagnostic Modality? Clin Hemorheol Microcirc (2011) 49(1-4):83–90. doi: 10.3233/CH-2011-1459
26. Wei X, Li Y, Zhang S, Li X, Wang H, Yong X, et al. Evaluation of Microvascularization in Focal Salivary Gland Lesions by Contrast-Enhanced Ultrasonography (CEUS) and Color Doppler Sonography. Clin Hemorheol Microcirc (2013) 54(3):259–71. doi: 10.3233/CH-131732
27. Giuseppetti GM, Argalia G, Salera D, Ranaldi R, Danieli G, Cappelli M. Ultrasonographic Contrast-Enhanced Study of Sicca Syndrome. Eur J Radiol (2005) 54(2):225–32. doi: 10.1016/j.ejrad.2004.04.018
28. Carotti M, Salaffi F, Di Carlo M, Barile A, Giovagnoni A. Diagnostic Value of Major Salivary Gland Ultrasonography in Primary Sjogren’s Syndrome: The Role of Grey-Scale and Colour/Power Doppler Sonography. Gland Surg (2019) 8(Suppl 3):S159–67. doi: 10.21037/gs.2019.05.03
29. Seror R, Ravaud P, Bowman SJ, Baron G, Tzioufas A, Theander E, et al. EULAR Sjogren’s Syndrome Disease Activity Index: Development of a Consensus Systemic Disease Activity Index for Primary Sjogren’s Syndrome. Ann Rheum Dis (2010) 69(6):1103–9. doi: 10.1136/ard.2009.110619
30. RColorBrewer S, Liaw MA. Package ‘Randomforest’. Berkeley, CA, USA: University of California, Berkeley (2018).
31. Sing T, Sander O, Beerenwinkel N, Lengauer T. ROCR: Visualizing Classifier Performance in R. Bioinformatics (2005) 21(20):3940–1. doi: 10.1093/bioinformatics/bti623
32. Alderden J, Pepper GA, Wilson A, Whitney JD, Richardson S, Butcher R, et al. Predicting Pressure Injury in Critical Care Patients: A Machine-Learning Model. Am J Crit Care (2018) 27(6):461–8. doi: 10.4037/ajcc2018525
33. Kerr KF, Brown MD, Zhu K, Janes H. Assessing the Clinical Impact of Risk Prediction Models With Decision Curves: Guidance for Correct Interpretation and Appropriate Use. J Clin Oncol (2016) 34(21):2534–40. doi: 10.1200/JCO.2015.65.5654
34. Jousse-Joulin S, Devauchelle-Pensec V, Morvan J, Guias B, Pennec Y, Pers JO, et al. Ultrasound Assessment of Salivary Glands in Patients With Primary Sjogren’s Syndrome Treated With Rituximab: Quantitative and Doppler Waveform Analysis. Biologics (2007) 1(3):311–9.
35. Carotti M, Salaffi F, Manganelli P, Argalia G. Ultrasonography and Colour Doppler Sonography of Salivary Glands in Primary Sjogren’s Syndrome. Clin Rheumatol (2001) 20(3):213–9. doi: 10.1007/s100670170068
36. Bhatia KSS, Dai YL. Routine and Advanced Ultrasound of Major Salivary Glands. Neuroimaging Clin N Am (2018) 28(2):273–93. doi: 10.1016/j.nic.2018.01.007
37. David E, Cantisani V, De Vincentiis M, Sidhu PS, Greco A, Tombolini M, et al. Contrast-Enhanced Ultrasound in the Evaluation of Parotid Gland Lesions: An Update of the Literature. Ultrasound (2016) 24(2):104–10. doi: 10.1177/1742271X15626611
38. Milic VD, Petrovic RR, Boricic IV, Radunovic GL, Pejnovic NN, Soldatovic I, et al. Major Salivary Gland Sonography in Sjogren’s Syndrome: Diagnostic Value of a Novel Ultrasonography Score (0-12) for Parenchymal Inhomogeneity. Scand J Rheumatol (2010) 39(2):160–6. doi: 10.3109/03009740903270623
39. Niemela RK, Takalo R, Paakko E, Suramo I, Paivansalo M, Salo T, et al. Ultrasonography of Salivary Glands in Primary Sjogren’s Syndrome. A Comparison With Magnetic Resonance Imaging and Magnetic Resonance Sialography of Parotid Glands. Rheumatol (Oxford) (2004) 43(7):875–9. doi: 10.1093/rheumatology/keh187
40. Takagi Y, Kimura Y, Nakamura H, Sasaki M, Eguchi K, Nakamura T. Salivary Gland Ultrasonography: Can It be an Alternative to Sialography as an Imaging Modality for Sjogren’s Syndrome? Ann Rheum Dis (2010) 69(7):1321–4. doi: 10.1136/ard.2009.123836
41. Mossel E, Arends S, van Nimwegen JF, Delli K, Stel AJ, Kroese FGM, et al. Scoring Hypoechogenic Areas in One Parotid and One Submandibular Gland Increases Feasibility of Ultrasound in Primary Sjogren’s Syndrome. Ann Rheum Dis (2018) 77(4):556–62. doi: 10.1136/annrheumdis-2017-211992
42. Steiner E, Graninger W, Hitzelhammer J, Lakits A, Petera P, Franz P, et al. Color-Coded Duplex Sonography of the Parotid Gland in Sjogren’s Syndrome. Rofo (1994) 160(4):294–8. doi: 10.1055/s-2008-1032427
43. Hilton SM, Lewis GP. The Cause of the Vasodilatation Accompanying Activity in the Submandibular Salivary Gland. J Physiol (1955) 128(2):235–48. doi: 10.1113/jphysiol.1955.sp005302
44. Martinoli C, Derchi LE, Solbiati L, Rizzatto G, Silvestri E, Giannoni M. Color Doppler Sonography of Salivary Glands. AJR Am J Roentgenol (1994) 163(4):933–41. doi: 10.2214/ajr.163.4.8092039
45. Xin L, Yan Z, Zhang X, Zang Y, Ding Z, Xue H, et al. Parameters for Contrast-Enhanced Ultrasound (CEUS) of Enlarged Superficial Lymph Nodes for the Evaluation of Therapeutic Response in Lymphoma: A Preliminary Study. Med Sci Monit (2017) 23:5430–8. doi: 10.12659/MSM.907293
46. Maxeiner A, Fischer T, Schwabe J, Baur ADJ, Stephan C, Peters R, et al. Contrast-Enhanced Ultrasound (CEUS) and Quantitative Perfusion Analysis in Patients With Suspicion for Prostate Cancer. Ultraschall Med (2019) 40(3):340–8. doi: 10.1055/a-0594-2093
47. Zhou X, Zhou P, Hu Z, Tian SM, Zhao Y, Liu W, et al. Diagnostic Efficiency of Quantitative Contrast-Enhanced Ultrasound Indicators for Discriminating Benign From Malignant Solid Thyroid Nodules. J Ultrasound Med (2018) 37(2):425–37. doi: 10.1002/jum.14347
48. Cao X, Xue J, Zhao B. Potential Application Value of Contrast-Enhanced Ultrasound in Neoadjuvant Chemotherapy of Breast Cancer. Ultrasound Med Biol (2012) 38(12):2065–71. doi: 10.1016/j.ultrasmedbio.2012.07.027
49. Theander E, Mandl T. Primary Sjogren’s Syndrome: Diagnostic and Prognostic Value of Salivary Gland Ultrasonography Using a Simplified Scoring System. Arthritis Care Res (Hoboken) (2014) 66(7):1102–7. doi: 10.1002/acr.22264
50. Konttinen YT, Porola P, Konttinen L, Laine M, Poduval P. Immunohistopathology of Sjogren’s Syndrome. Autoimmun Rev (2006) 6(1):16–20. doi: 10.1016/j.autrev.2006.03.003
51. La Paglia GMC, Sanchez-Pernaute O, Alunno A, Martinez-Becerra MJ, Romero-Bueno F, Recuero S, et al. Ultrasound Salivary Gland Involvement in Sjogren’s Syndrome vs. Other Connective Tissue Diseases: Is It Autoantibody and Gland Dependent? Clin Rheumatol (2020) 39(4):1207–15. doi: 10.1007/s10067-019-04780-2
Keywords: primary Sjögren’s syndrome, grayscale ultrasonography, color Doppler sonography, contrast-enhanced ultrasonography, diagnostic model
Citation: Xu S, Luo J, Zhu C, Jiang J, Cheng H, Wang P, Hong J, Fang J, Pan J, Brown MA, Zhu X and Wang X (2021) Performance Evaluation of Multiple Ultrasonographical Methods for the Detection of Primary Sjögren’s Syndrome. Front. Immunol. 12:777322. doi: 10.3389/fimmu.2021.777322
Received: 15 September 2021; Accepted: 01 November 2021;
Published: 22 November 2021.
Edited by:
Luca Quartuccio, University of Udine, ItalyReviewed by:
Soledad Retamozo, Consorci Corporació Sanitària Parc Taulì (Parc Taulì Hospital Universitari), SpainIvan Giovannini, Università degli Studi di Udine, Italy
Copyright © 2021 Xu, Luo, Zhu, Jiang, Cheng, Wang, Hong, Fang, Pan, Brown, Zhu and Wang. This is an open-access article distributed under the terms of the Creative Commons Attribution License (CC BY). The use, distribution or reproduction in other forums is permitted, provided the original author(s) and the copyright owner(s) are credited and that the original publication in this journal is cited, in accordance with accepted academic practice. No use, distribution or reproduction is permitted which does not comply with these terms.
*Correspondence: Xiaobing Wang, Z2FsZTgyMDkwN0AxNjMuY29t; orcid.org/0000-0002-4302-2213
†These authors have contributed equally to this work