 Gundula Rösch1
 Dominique Muschter2
 Shahed Taheri3Karima El Bagdadi1
 Christoph Dorn4Andrea Meurer1
 Frank Zaucke1
 Arndt F. Schilling3
 Susanne Grässel2Rainer H. Straub5
 Zsuzsa Jenei-Lanzl1*
- 1Dr. Rolf M. Schwiete Research Unit for Osteoarthritis, Department of Orthopedics (Friedrichsheim), University Hospital Frankfurt, Goethe University, Frankfurt am Main, Germany
- 2Department of Orthopedic Surgery, Experimental Orthopedics, Centre for Medical Biotechnology, University of Regensburg, Regensburg, Germany
- 3Department of Trauma Surgery, Orthopedic Surgery and Plastic Surgery, Universitätsmedizin Göttingen, Göttingen, Germany
- 4Institute of Pharmacy, University of Regensburg, Regensburg, Germany
- 5Laboratory of Experimental Rheumatology and Neuroendocrine Immunology, Department of Internal Medicine, University Hospital Regensburg, Regensburg, Germany
Purpose: Recent studies demonstrated a contribution of adrenoceptors (ARs) to osteoarthritis (OA) pathogenesis. Several AR subtypes are expressed in joint tissues and the β2-AR subtype seems to play a major role during OA progression. However, the importance of β2-AR has not yet been investigated in knee OA. Therefore, we examined the development of knee OA in β2-AR-deficient (Adrb2-/-) mice after surgical OA induction.
Methods: OA was induced by destabilization of the medial meniscus (DMM) in male wildtype (WT) and Adrb2-/- mice. Cartilage degeneration and synovial inflammation were evaluated by histological scoring. Subchondral bone remodeling was analyzed using micro-CT. Osteoblast (alkaline phosphatase - ALP) and osteoclast (cathepsin K - CatK) activity were analyzed by immunostainings. To evaluate β2-AR deficiency-associated effects, body weight, sympathetic tone (splenic norepinephrine (NE) via HPLC) and serum leptin levels (ELISA) were determined. Expression of the second major AR, the α2-AR, was analyzed in joint tissues by immunostaining.
Results: WT and Adrb2-/- DMM mice developed comparable changes in cartilage degeneration and synovial inflammation. Adrb2-/- DMM mice displayed elevated calcified cartilage and subchondral bone plate thickness as well as increased epiphyseal BV/TV compared to WTs, while there were no significant differences in Sham animals. In the subchondral bone of Adrb2-/- mice, osteoblasts activity increased and osteoclast activity deceased. Adrb2-/- mice had significantly higher body weight and fat mass compared to WT mice. Serum leptin levels increased in Adrb2-/- DMM compared to WT DMM without any difference between the respective Shams. There was no difference in the development of meniscal ossicles and osteophytes or in the subarticular trabecular microstructure between Adrb2-/- and WT DMM as well as Adrb2-/- and WT Sham mice. Number of α2-AR-positive cells was lower in Adrb2-/- than in WT mice in all analyzed tissues and decreased in both Adrb2-/- and WT over time.
Conclusion: We propose that the increased bone mass in Adrb2-/- DMM mice was not only due to β2-AR deficiency but to a synergistic effect of OA and elevated leptin concentrations. Taken together, β2-AR plays a major role in OA-related subchondral bone remodeling and is thus an attractive target for the exploration of novel therapeutic avenues.
Introduction
Osteoarthritis (OA) is the most prevalent chronic degenerative joint disease that affected worldwide 303 million people in 2017 (1). OA pathogenesis involves the whole joint with destruction of cartilage, inflammation of synovium, formation of osteophytes, sclerosis of subchondral bone as well as degeneration of ligaments and menisci. (2). These pathological processes lead to the major symptoms joint stiffness and pain, which result not only in limited movement and reduced quality of life but also in immense socio-economic costs. (3). Although OA has been already known for more than 250 years, the exact underlying complex molecular mechanisms of its progression are still unclear (4). Currently, there is still no causal therapy that effectively addresses joint degeneration and inflammation, only symptomatic treatments exist aiming to reduce pain (5). As a result, joint replacement is often the last effective therapy (6). In order to develop novel therapeutic options, it is essential to better understand the multifactorial pathophysiology of OA.
In recent years, the contribution of neurotransmitters and receptors of the sympathetic nervous system (SNS) to the pathophysiology of OA became more and more evident (7–9). The SNS is responsible for the body’s fight or flight response mediated by the neurotransmitters epinephrine (E) and norepinephrine (NE) among others (10). NE was detected in the synovial fluid of OA patients in physiologically relevant concentrations, whereas E was not measurable (11). NE mediates its effects via the adrenergic receptors (ARs), which are subdivided into several groups: α1-AR (α1a, α1b, and α1d), α2-AR (α2a, α2b, and α2c) and β-AR (β1, β2, and β3) (12).
Different α- and β-AR subtypes were detected in various tissues related to OA development such as synovium, cartilage, and subchondral bone (8, 13–16). The effects mediated by these ARs have been investigated with regard to OA in different cell types of the joint in vitro. Activated α1-ARs increase both the proliferation and apoptosis of human OA chondrocytes (17) as well as proliferation of osteoblasts and activity of osteoclasts (13). Thus, the net effect of α1-ARs seems to be balanced between anabolic and catabolic influences. In contrast, α2a-ARs act mainly in a catabolic manner by decreasing the synthesis of type II collagen and sulphated glycosaminoglycans (GAGs) in human synovial stem cells undergoing chondrogenesis (18). Similarly, in rat chondrocytes, aggrecan expression decreased and MMP-3 and MMP-13 expression increased after α2-AR activation (19).The catabolic effect of the α2-AR on cartilage was confirmed in a temporomandibular joint (TMJ) OA model in rats (19). Moreover, a similar catabolic effect was observed in the subchondral bone of the TMJ after α2-AR activation (19). The β2-AR mediated mainly anabolic effects in human OA chondrocyte cultures by inhibiting the gene expression of MMP13 and IL-8 as well as inducing sGAG and COL2A1 gene expression (17). Furthermore, in the above-mentioned TMJ OA model, activation of the β2-AR resulted in subchondral bone loss (20). In synovial tissue, targeting α2- or β2-ARs exerts dual effects depending on the neurotransmitter concentration. In high concentrations, NE inhibited TNF as well as IL-8 via β2-AR but in low concentrations NE increased TNFα release via α2-AR (21, 22). However, at present no study exists so far that investigated the influence of the distinct AR subtypes on synovium, cartilage and bone in the knee joint at the same time in the living organism.
Our intention was to analyze the contribution of one of the major ARs, the β2-AR, to OA progression in vivo using β2-AR-deficient (Adrb2-/-) mice. We hypothesized that the lack of β2-AR results in accelerated articular cartilage degeneration, subchondral bone thickening as well as increased synovial inflammation. In order to test this hypothesis, OA was induced in the knee joints of Adrb2-/- mice by the destabilization of the medial meniscus and disease progression was analyzed.
Materials and Methods
Animals
Ten weeks old male C57BL/6J mice were purchased from Janvier Laboratories (Le Genest St. Isle, France). Male Adrb2-/- mice of the same age and with C57BL/6J background were kindly provided by the group of Prof. Susanne Grässel (Dept. of Orthopedic Surgery, University of Regensburg, Germany). According to the strict animal welfare rules and regulations (the principles of the 3Rs), we mated homozygous Adrb2-/- mice for breeding of the needed male Adrb2-/- mice and male WT animals at the same age were purchased commercially. Thus, no littermates were used in this study. Mice were housed at 5 animals per cage, were allowed to adapt to animal laboratory conditions for 2 weeks, and kept under standard housing conditions on a 12-hour light/dark cycle with unrestricted access to standard food and water. All experiments were approved by and conducted according to institutional and governmental regulations for experimental animal usage (Ethical Review Committee, Government of Unterfranken, 55.2-2532-2-368).
OA Induction
Mice were assigned into 4 groups: WT Sham, WT DMM, Adrb2-/- Sham, Adrb2-/- DMM. On day 0, mice underwent DMM surgery to induce knee OA or Sham surgery as described previously (23). Mice were randomly chosen for DMM or Sham surgeries by a technician (this person performed the necessary preparations such as weighing or shaving of the knees before surgery). Mice were anaesthetized by intraperitoneal injection of ketamine-hydrochloride (90-120 mg/g body weight; Medistar Arzneimittelvertrieb GmbH, Ascheberg, Germany) and xylazine (6-8 mg/g/body weight; Serumwerk Bernburg, Bernburg, Germany). DMM or Sham surgery was performed on the right knee joints. In the Sham groups, the joint capsule was opened without transecting the medial meniscotibial ligament (23). After operation, mice were administered subcutaneous analgesia (buprenorphine in 0.9% NaCl solution, 0.1 mg/g body weight; Buprenovet®, Bayer Vital GmbH, Leverkusen, Germany). After 2, 4, 8 and 12 weeks (various termination time points), animals were sacrificed by asphyxiation with CO2. Body length, body weight, and spleen weight were determined, and limbs were harvested for histological and for micro-CT examinations. We analyzed 8 animals per group for each time point (2, 4, 8 and 12 weeks; histology and immunostainings, as well as weighing and spleen analysis) except for µCT which was only performed 8 weeks after surgery and therefore 5 additional animals were needed at this time point (n=13 per group for the 8 week time point).
OARSI and Synovitis Scoring
To evaluate OA severity, a standardized histopathological assessment of cartilage degeneration was applied according to the standards suggested by the Osteoarthritis Research Society International (OARSI) (24). According to this scoring system, 6 sections per mouse at 80 μm intervals were stained with DMMB. Features of synovial inflammation were scored in the same sections in defined regions of interest, modified after Krenn et al. (25). From each mouse, 3 stained sections were selected to assess synovitis features by counting the cells in the stroma and characterizing the lining layer enlargement with a scale from none (0), slight (1) and moderate (2) to strong (3). After summarizing the values of both features, the following classification was obtained: 0-1, no synovitis; 2-3, mild synovitis; 4-6, severe synovitis. OARSI and synovitis scoring was performed blinded with respect to the treatment groups by independent observers. The scores are average scores of 6 sections per animal and averages from the three investigators involved in scoring.
Micro-CT Measurements
For image acquisition, paraformaldehyde(PFA)-fixed complete knee joints were placed in 70% ethanol and scanned in a micro-CT device (Scanco µCT 50, Brüttisellen, Switzerland) with the following settings: isotropic voxel size = 3.4 µm, source voltage = 90 kVp, intensity = 88 µA, integration time = 1500 ms, projections/180° = 1000, and a 0.5 mm aluminum filter as the attenuating substance for beam hardening. Tomograms were then reconstructed in Scanco’s OpenVMS software for general three-dimensional visualization.
To extract the calcified cartilage (CC) layer from its underlying subchondral bone plate, a semi-automatic segmentation process was implemented, where two initial point clouds were created by setting the thresholds values at 396.0 and 933.0 mg hydroxyapatite (HA)/cm3, respectively. This provides an initial rough estimation of the layers, which can be enhanced by an interactive step based on a modified Seeded Region Growing technique (26). The calculated bins of values were then used to create histograms, and subsequent colormaps of the CC thickness in each condyle. Colormaps were scaled to a maximum value of 80 μm for all samples. Moreover, the thickness of the subchondral bone plate was measured by the ImageJ software (version 1.52a, NIH, Bethesda, MD, USA) in three equally-spaced coronal cross-sections of the joint. The intercondylar eminence was excluded from measurement, while the final reported value for each condyle was the mean ± SEM of 60 spots in the three coronal planes.
The medial condyle length was measured as an indicator for the osteophyte formation. This was defined as the distance from the center of the condyle in proximity of the trochlear groove to the medial prominence (27). The bone morphometry indices were calculated in two volumes of interest: (1) a ≈ 0.2 mm3 region within the medial epiphysis located between the lower margin of the subchondral bone plate and the epiphyseal line, and (2) a ≈ 1.2 mm3 volume of interest (VOI) located 300 μm distally from the epiphyseal line for measurement of the sub-articular trabecular morphometry. For both VOIs, an optimal threshold settings according to Scanco’s OpenVMS software (lower threshold: 685.3 mg HA/cm³, upper threshold: 3000 mg HA/cm³, Gauss Sigma: 0.8, Gauss Support: 1) was implemented, while the manually-drawn contouring excluded the endocortical surface in accordance with standard guidelines (28). To characterize the heterotopic ossification of the meniscus before and after the DMM surgery, the anterior meniscal ossicles were manually contoured and segmented. The VOIs in Sham and DMM mice were ≈ 0.4 mm3 and 1.0 mm3, respectively, owing to the post-traumatic irregular surface expansion of the ossicles at the site of the injury. Hence, the bone volume (BV), bone mineral density (BMD), bone surface (BS), and the BS/BV of the anterior meniscus were measured and compared for the WT and β2-AR deficient mice before and after the surgery.
Histology and Immunohistochemistry of Joint Tissues
Limbs were fixed in 4% PFA [in 1x phosphate-buffered saline (PBS)] overnight, washed in 1x PBS for 24 h, decalcified in 10% Tris-ethylenediaminetetraacetic acid (EDTA) for 10-14 days, and embedded in paraffin in frontal orientation. Serial sections (8 µm) were stained with 1,9-dimethyl-methylene blue (DMMB, Sigma-Aldrich, Munich, Germany) for OARSI (Osteoarthritis Research Society International) (24) and synovitis scorings (25).
The expression of the most relevant AR besides β2-AR, namely the α2A-AR, in region of osteophytes, cartilage and synovium as well as markers of osteoblast (alkaline phosphatase (ALP)) and osteoclast activity (Cathepsin K (CatK)) in the subchondral bone were analyzed by immunostaining. Controls for β2-AR deficiency were performed by β2-AR staining. Sections were blocked using 2.5% normal horse serum blocking solution for 20 min at room temperature (Cat.No: S-2012, Vector Laboratories, Burlingame, USA) followed by incubation with primary antibodies over night at 4°C (α2A-AR – 14266-1-AP 1:100, Proteintech, Rosemont, US; β2-AR - 1:100, PA5-14117, Thermo Fisher, Rockford, USA; CatK – 1:200 PA05-109605, Thermo Fisher Scientific, Waltham US; and ALP - 1:200 AF2910, RnDsystems, Minneapolis, USA). Primary antibodies were detected using ImmPRESS® HRP-Anti-Rabbit and HRP-Anti-Goat IgG (Peroxidase) Polymer Detection Kit (Vector Laboratories, Burlingame, USA).
Quantification of AR-, ALP-, and CatK-Positive Stainings
In order to determine the number of cells expressing α2A-AR, sections were stained as described above. AR-positive cells were counted in comparable regions as shown in Supplementary Figure 1 and by independent observers.
ALP and CatK localization were quantified by pixel area count and reported as a percentage of the total tissue area specified (Supplementary Figure 1) using the software Image J (NIH Image, Bethesda, USA) (29). ALP- and CatK-positive cells were quantified by determining the positively stained area because due to the cutting plane in tissue sections it is not always clear, whether stained areas originated from one or more cells.
Determination of Splenic NE Levels
The spleen is richly innervated by sympathetic nerve fibers (30, 31). Therefore, in order to compare the sympathetic activity of WT and Adrb2-/- mice, the concentration of the NE was measured in spleen homogenates by HPLC with electrochemical detection as previously described by us (32). The collection of the spleens was performed in the morning between 8:00 and 11:00 to avoid variability due to circadian rhythm.
Serum Leptin Quantification by ELISA
To investigate, whether the effects of β2-AR deficiency on the subchondral bone were mediated by adipose tissue-derived factors, the concentration of the most relevant adipokine leptin (33) was determined in serum samples using Mouse/Rat Leptin Quantikine ELISA Kit (MOB00B, RnDsystems, Minneapolis, USA according to the manufacturer´s protocol. The collection of the serum was performed in the morning between 8:00 and 11:00 to avoid variability due to circadian rhythm.
Statistical Analysis
Experimental group sizes were calculated using the G*Power Software (34). The statistical power of our study was determined based on the readout parameter, cartilage degradation. A minimum of 8 mice per group were needed to observe a minimum 30% difference in means at a power of 80% (σ = 0.2, α = 0.05). For statistical analyses, we used Prism XY (Graph Pad Software, La Jolla, USA). In the text, data are presented as mean ± SEM. p-values of <0.05 were considered significant. For Figures 1, 6, 5 and Supplementary Figure 5 we performed a three-way ANOVA with the factors surgery, Adrb2-/- deficiency and time point followed by Bonferroni correction for multiple comparison. Normality was visually checked by the QQ-plot of the residuals (Supplementary Figure 2). The data in Figure 3B and Supplementary Figure 4 are not normally distributed. The data were log-transformed and analyzed by a three-way ANOVA with Bonferroni correction for multiple comparison. Normality was visually checked by the QQ-plot of the residuals of the transformed data (Supplementary Figure 2). For Figures 2, 3A, 4 we performed a two-way ANOVA with the factors surgery and Adrb2-/- deficiency, followed by Bonferroni correction for multiple comparison, Normality was visually checked by the QQ-plot of the residuals (Supplementary Figure S2). The correlation between OARSI score and synovitis score (Figure 1C), as well as serum leptin concentration and body weight (Figure 6E) was investigated using linear regression.
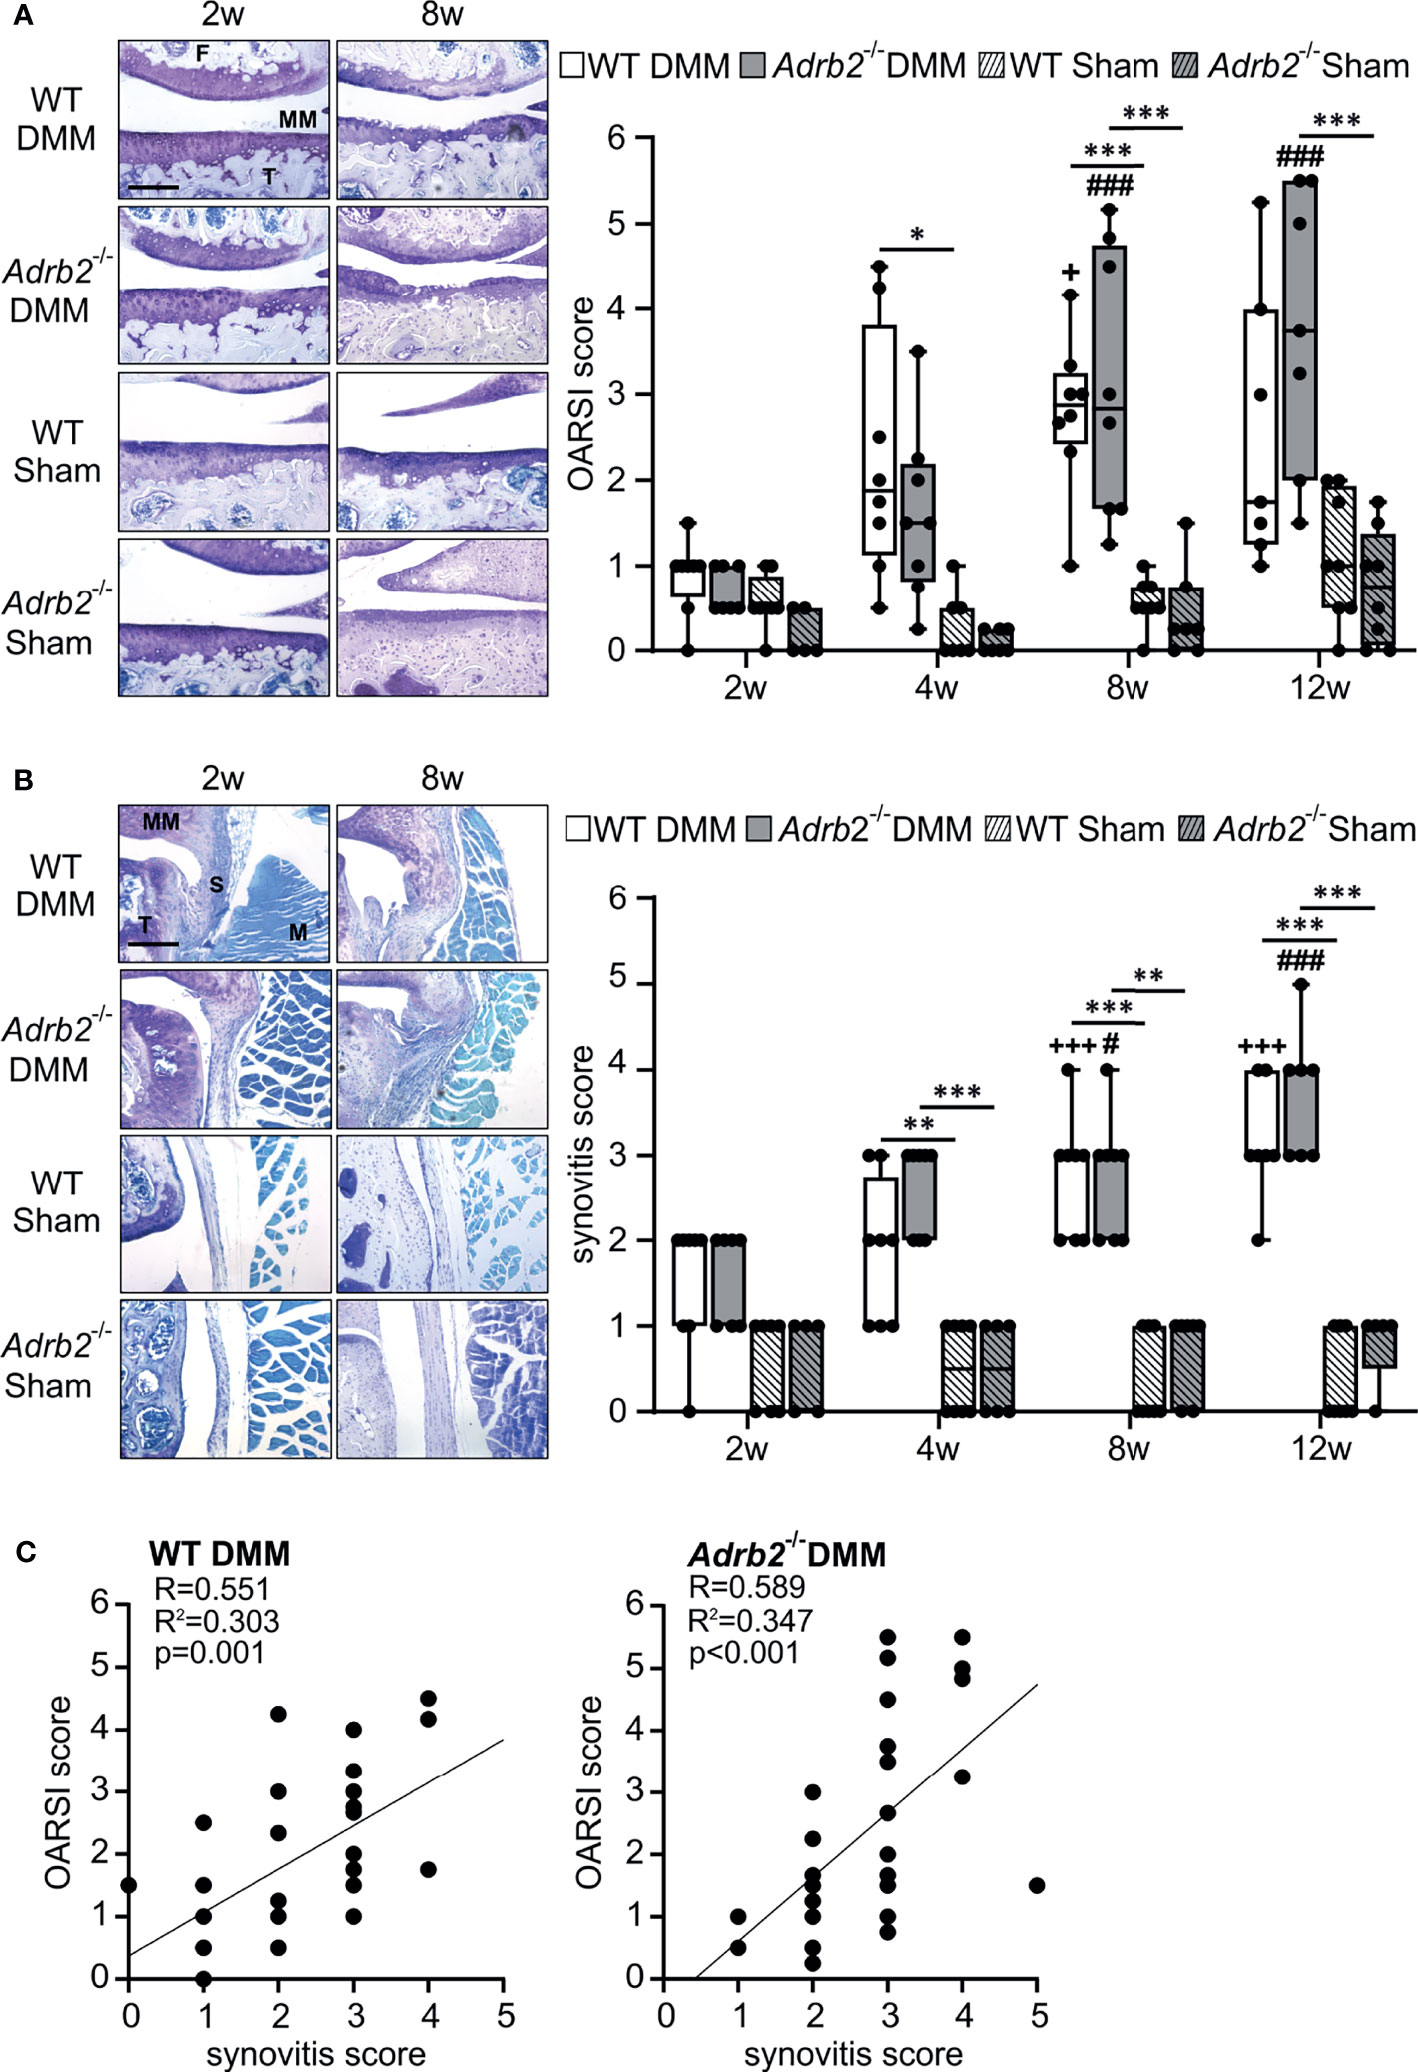
Figure 1 Time course of cartilage degeneration and synovial inflammation following DMM. (A) Histological analysis and OARSI scores of the medial tibiofemoral articular cartilage contact area using DMMB staining in WT and Adrb2-/- mice 2, 4, 8, and 12 weeks after DMM or Sham surgery (bar: 200 µm). p≤0.001 when compared to 2 weeks WT DMM. Data are presented as box plots with whiskers. Each black circle represents an individual mouse (n=5-8 per group). Significant p-values are presented as * p ≤ 0.05, ***p ≤ 0.001 for comparisons between groups at one time point; ###p ≤ 0.001 when compared to 2 weeks Adrb2-/- DMM. No significance differences observed between WT DMM and Adrb2-/- DMM. (B) Histological appearance of the synovial tissue and synovitis score in WT and Adrb2-/- mice 2, 4, 8, and 12 weeks after DMM or Sham surgery (DMMB staining, T: tibia, S: synovium, MM: medial meniscus, M: muscle; bar: 200 µm). Data are presented as box plots with whiskers. Each black circle represents an individual mouse (n=5-8 per group). Significant p-values are presented as **p ≤ 0.01, ***p ≤ 0.001 for comparisons between groups at one time point; +++p ≤ 0.001 when compared to 2 weeks WT DMM; #p ≤ 0.05, ###p ≤ 0.001 when compared to 2 weeks Adrb2-/- DMM. (C) Linear regression of articular cartilage damage (OARSI score) and synovial inflammation (synovitis score) in WT and Adrb2-/- mice 2, 4, 8, and 12 weeks after DMM surgery.
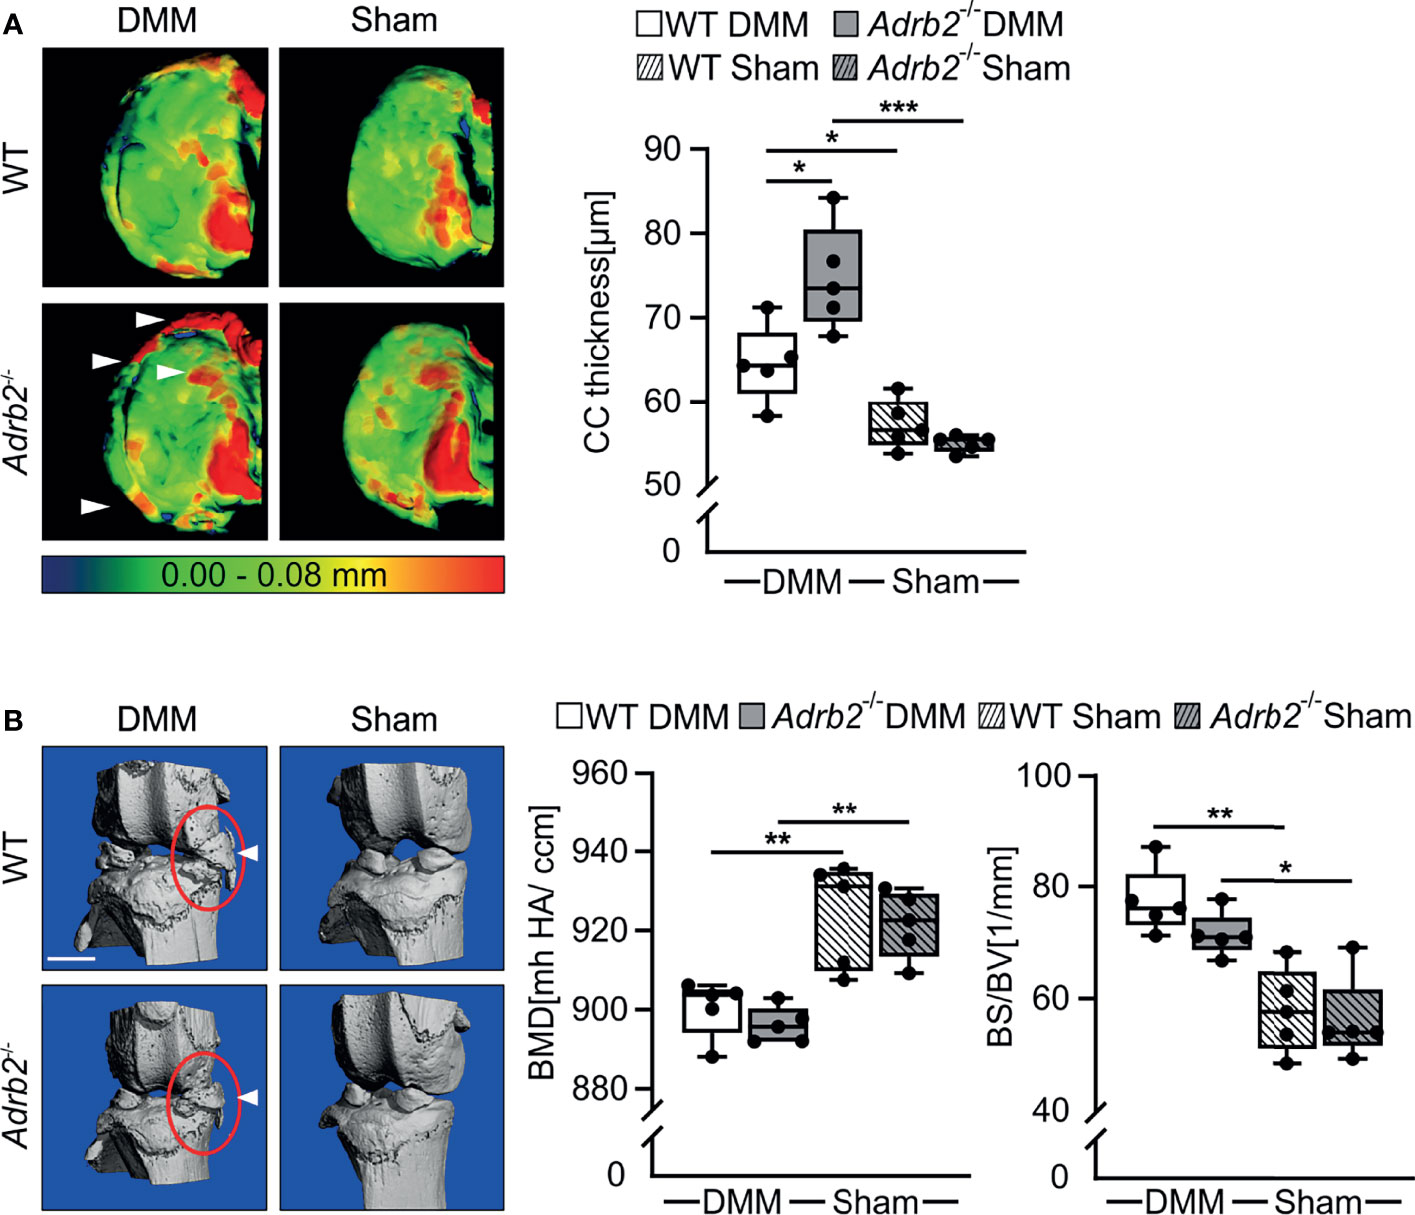
Figure 2 Micro-CT analysis of the calcified cartilage (CC) thickness and meniscal ossicles. (A) Representative color-densitometry micro-CT images and quantification of the CC thickness in WT and Adrb2-/- mice 8 weeks after DMM or Sham surgery. Data are presented as box plots with whiskers. Each black circle represents an individual mouse (n=5 per group). Significant p-values are presented as *p ≤ 0.05, **p ≤ 0.01, ***p ≤ 0.001 for comparisons between groups. (B) Representative pictures of meniscal ossicles as well as quantitative differences of their bone specific surface (BS/BV) and bone mineral density (BMD) in WT and Adrb2-/- mice 8 weeks after DMM or Sham surgery. Data are presented as box plots with whiskers. Each black circle represents an individual mouse (n=5 per group). Significant p-values are presented as *p ≤ 0.05, **p ≤ 0.01, for comparisons between groups.
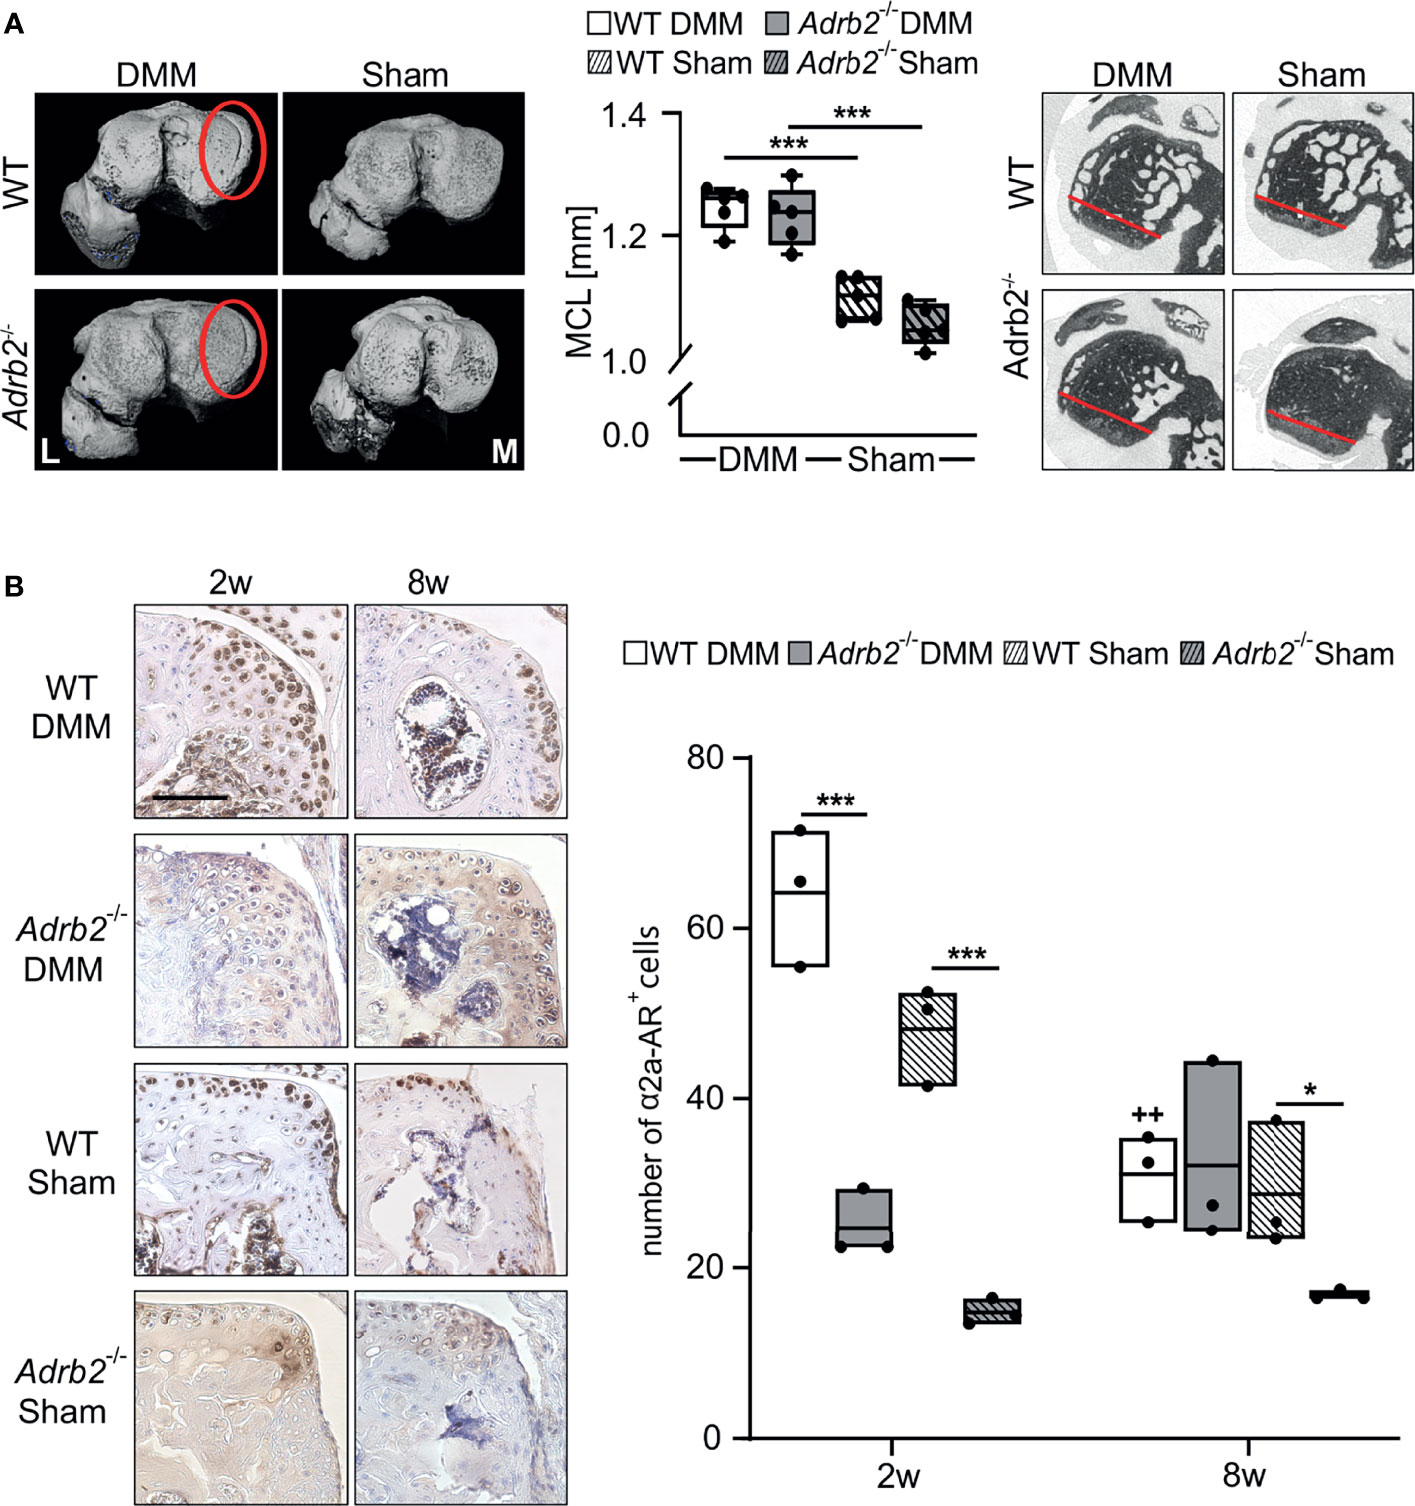
Figure 3 Analysis of the region of osteophyte formation in the medial condyles. (A) Representative micro-CT images of the medial condyles with (DMM groups) or without (Sham groups) osteophytes 8 weeks after surgery. The quantification of the medial condyle lengths in WT and Adrb2-/- mice 8 weeks after surgery and representative micro-CT images display the medial condyle. Data are presented as box plots with whiskers. Each black circle represents an individual mouse (n=5 per group). Significant p-values are presented as ***p ≤ 0.001 for comparisons between groups. (B) Immunohistochemical detection and quantification of α2A-AR (dark brown) in the region of osteophyte formation in WT and Adrb2-/- mice 2 and 8 weeks after DMM or Sham surgery (bar: 100 µm). Nuclei are counterstained with hematoxylin (in dark blue). Data are presented as box plots with whiskers. Each black circle represents an individual mouse (n=3 per group). Significant p-values are presented as *p ≤ 0.05, ***p ≤ 0.001 for comparisons between groups. ++p≤0.01 when compared to 2 weeks WT DMM.
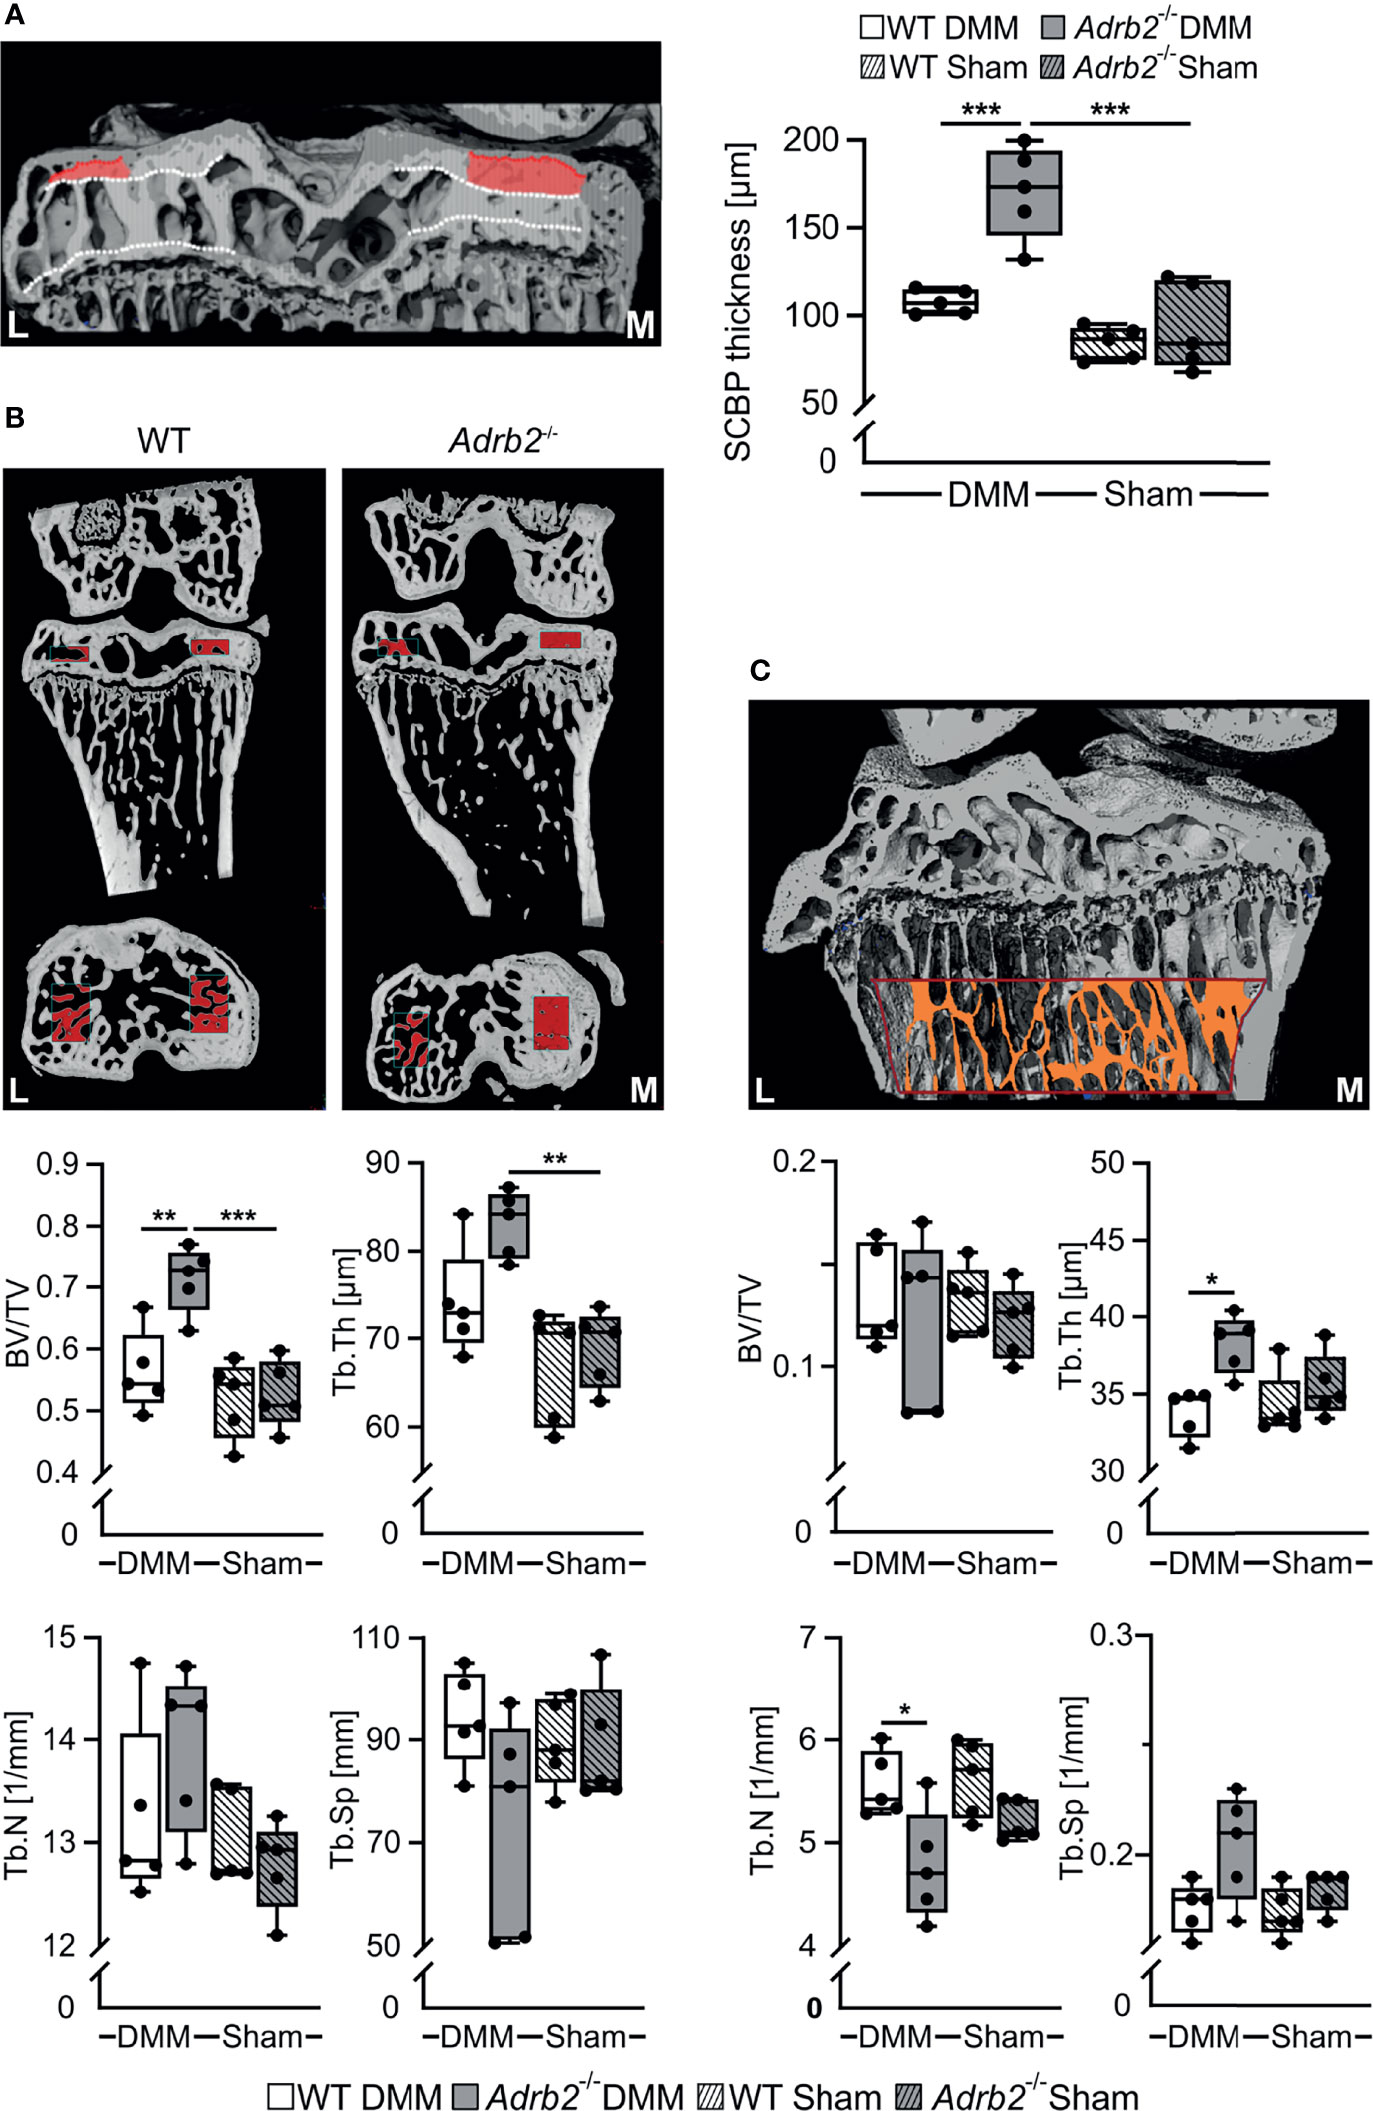
Figure 4 Analysis of the subhcondral bone and subarticular trabecular bone. (A) Representative image of subchondral bone plate (SCBP) with the VOI and quantification of the SCBP thickness in WT and Adrb2-/- mice 8 weeks after DMM or Sham surgery. (B) Representative micro-Ct images displaying the volume of interest (VOI, indicated by red rectangles) in the medial epiphysis and quantitative 3D analysis of bone volume to total tissue volume (BV/TV), trabecular spacing (Tb.Sp), trabecular number (Tb.N), and trabecular thickness (Tb.Th) within the VOI in WT and Adrb2-/- mice 8 weeks after DMM or Sham surgery. (C) Representative micro-Ct image displaying the volume of interest (VOI, indicated by red-orange rectangle) in the subarticular trabecular bone and quantitative 3D analysis of bone volume to total tissue volume (BV/TV), trabecular spacing (Tb.Sp), trabecular number (Tb.N), and trabecular thickness (Tb.Th) within the VOI in WT and Adrb2-/- mice 8 weeks after DMM or Sham surgery. Data are presented as box plots with whiskers. Each black circle represents an individual mouse (n=5 per group). Significant p-values between the treatment groups are presented as *p ≤ 0.05 and **p ≤ 0.01 and ***p ≤ 0.001.
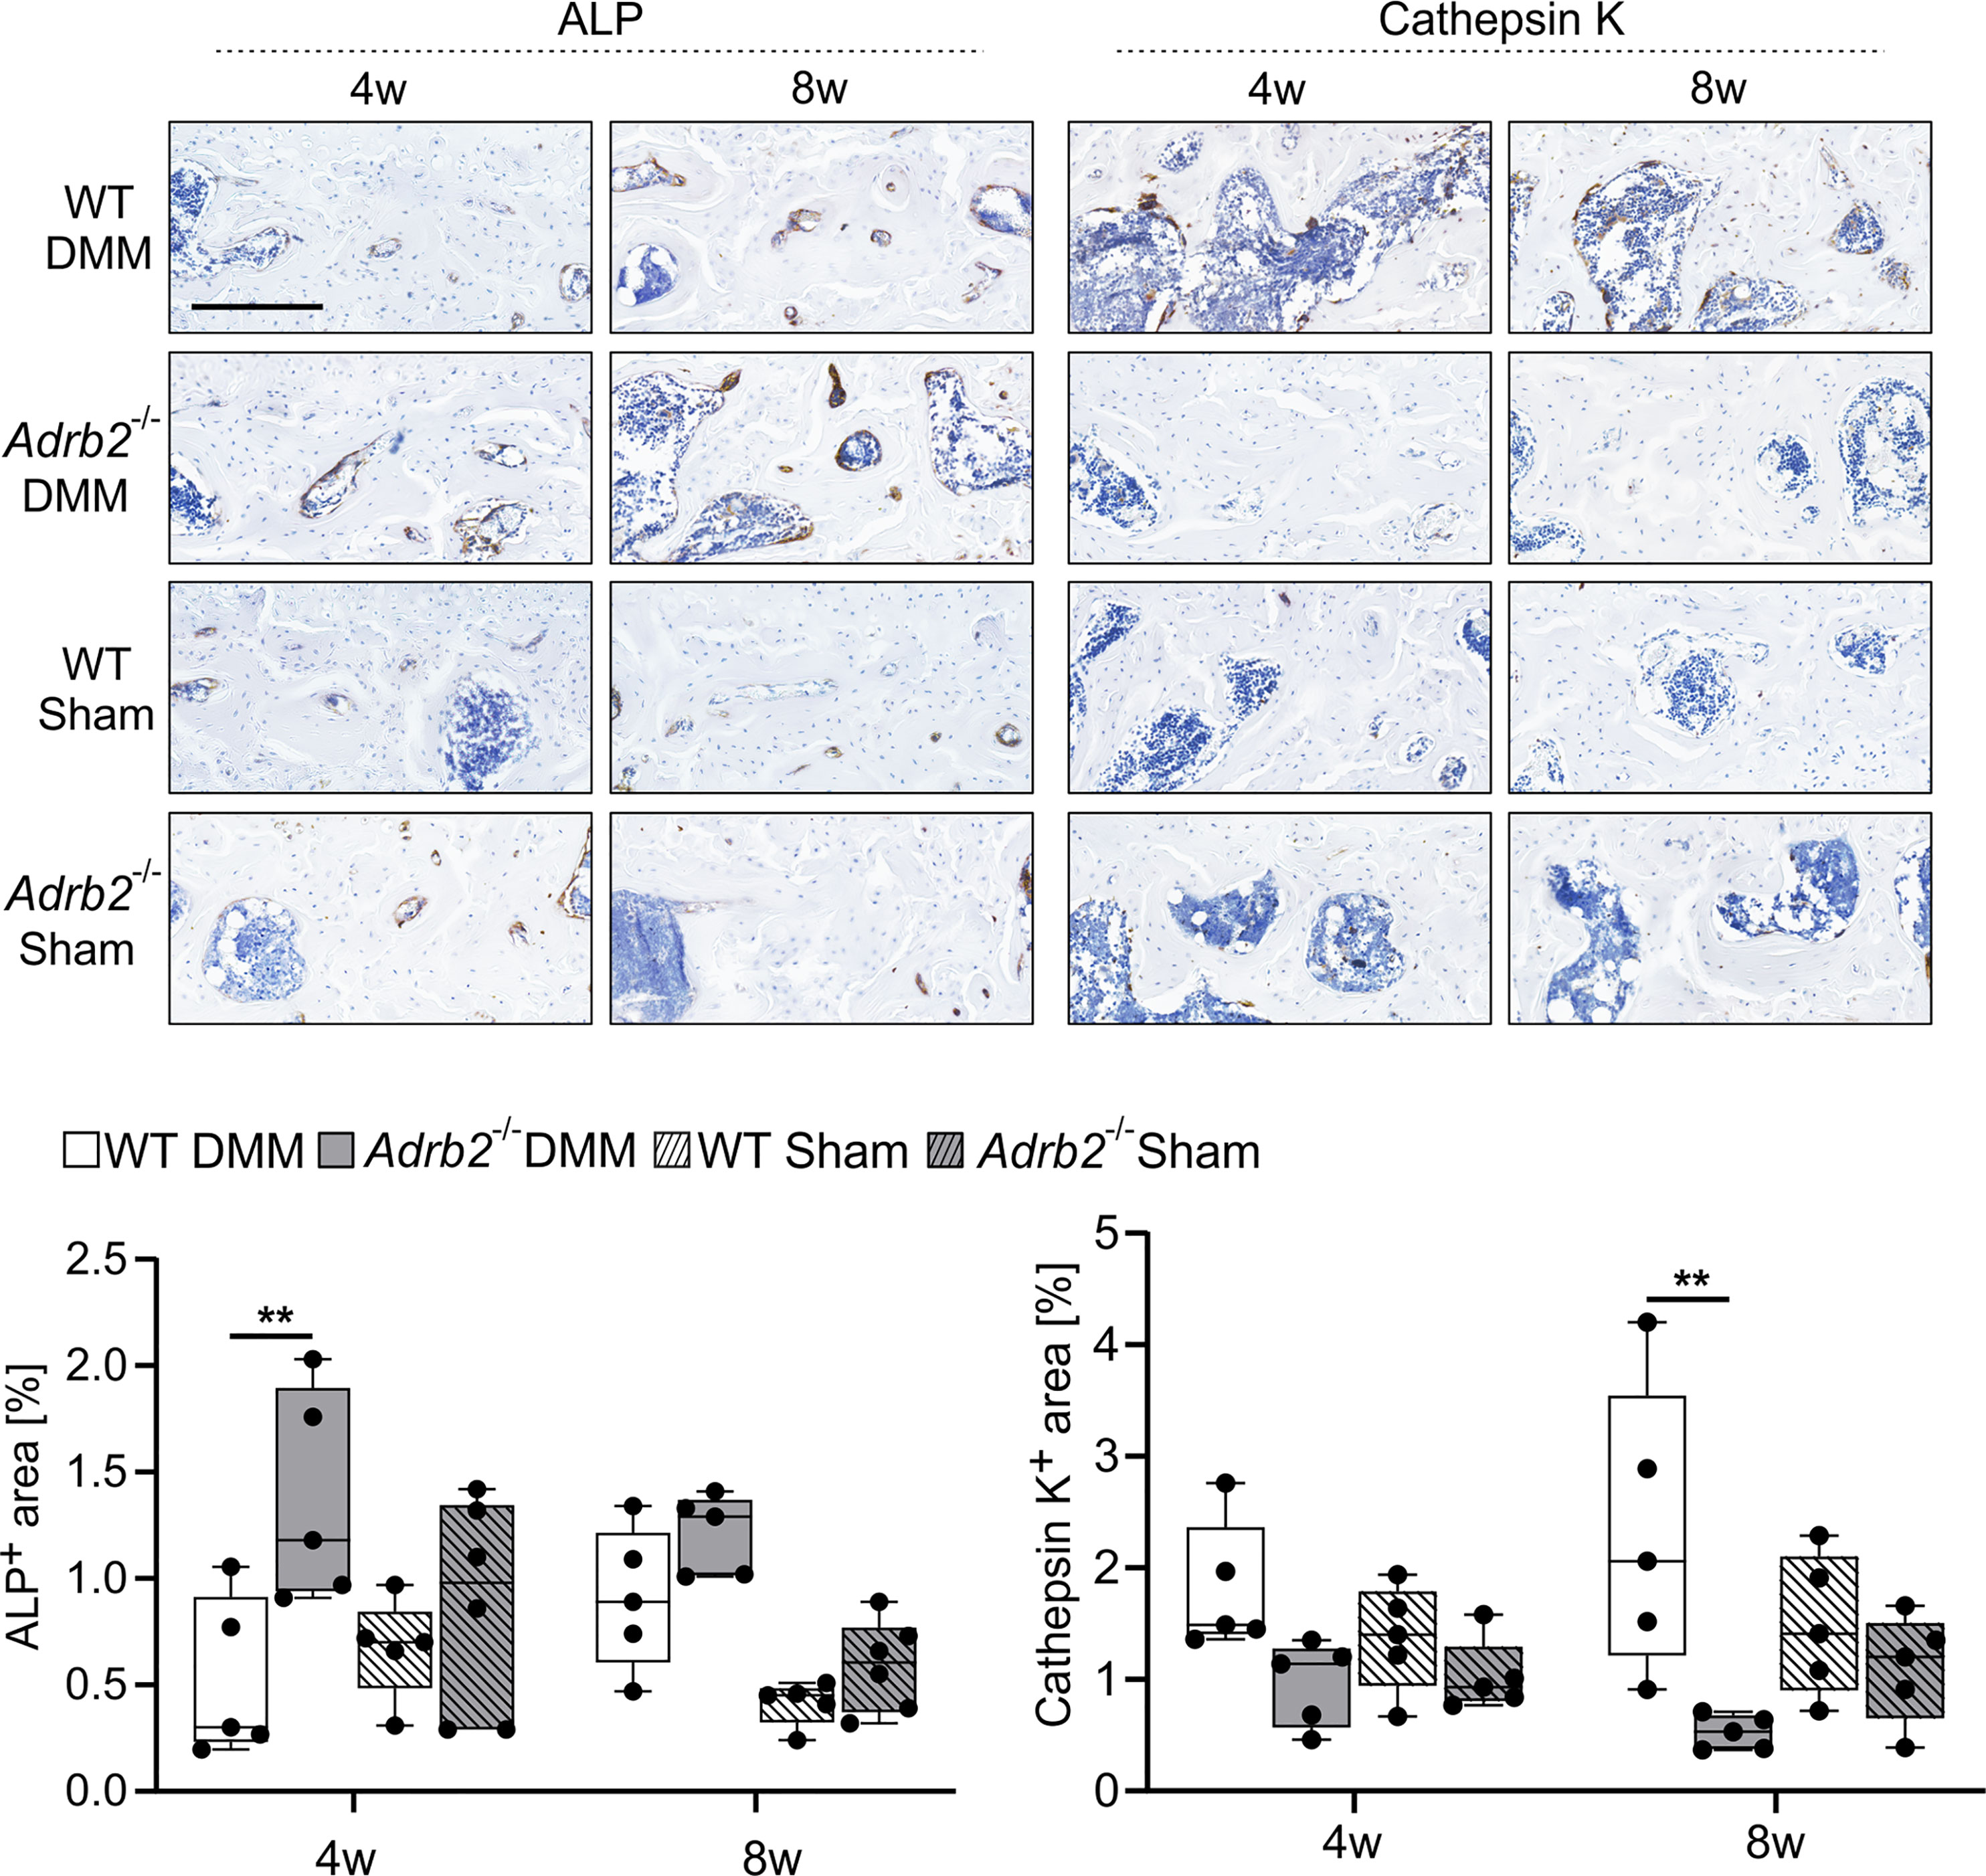
Figure 5 Analysis of the osteoblast and osteoclast activity in the subhcondral bone. Immunohistochemical detection and quantification of ALP (dark brown) and Cathepsin K (dark brown) in the subchondral bone of WT and Adrb2-/- mice 4 and 8 weeks after DMM or Sham surgery (bar: 200 µm). Nuclei are counterstained with hematoxylin (in dark blue). Data are presented as box plots with whiskers. Each black circle represents an individual mouse (n=5 per group). Significant p-values are presented as **p ≤ 0.01 for comparisons between groups.
Results
β2-AR Deficiency Did Not Affect Cartilage Degeneration and Synovial Inflammation
First, β2-AR deficiency was confirmed in healthy Adrb2-/- mice by immunohistological staining (Supplementary Figure S3A).
Then, we analyzed the influence of the β2-AR deficiency on the OA-progression in cartilage and synovium. The progression of cartilage degeneration in the medial tibiofemoral articular cartilage was analyzed by histological staining (Figure 1A). As expected, the OARSI score of WT DMM increased (0.875 ± 0.157 to 2.536 ± 0.606) over the observation time from 2 weeks to 12 weeks. Similarly, the OARSI scores in Adrb2-/- DMM increased (0.714 ± 0.101 to 3.786 ± 0.618) without significant differences compared to WT DMM mice at the respective time points (Figure 1A). The OARSI scores of WT and Adrb2-/- Sham-operated mice were significantly lower compared to the respective DMM mice 4 weeks (only WT p=0.012), 8 weeks (WT p<0.001; Adrb2-/- p<0.001), and 12 weeks (only Adrb2-/- p<0.001) after surgery (Figure 1A). There was no difference between WT Sham and Adrb2-/- Sham mice at any time point.
In addition to the OARSI score, synovial inflammation was also determined and revealed a similar pattern as the OARSI score. After DMM surgery, the synovitis scores in WT (1.50 ± 0.267 to 3.143 ± 0.261) as well as Adrb2-/- animals increased significantly until week 12 (1.571 ± 0.202 to 3.714 ± 0.286) without significant differences between these groups (Figure 1B). WT and Adrb2-/- Sham animals had significantly lower synovitis scores at the 4 week (WT p=0.003; Adrb2-/- p<0.001), 8 week (WT p<0001; Adrb2-/- p<0.001) and 12 week (WT p<0001; Adrb2-/- p<0.001) time points compared to the respective DMM animals (Figure 1B). There was no difference between the Sham groups at any time point.
Accordingly, there was a positive correlation between OARSI scores and synovitis scores in both WT DMM (R=0.551, R2 = 0.303, p=0.001) and Adrb2-/- DMM mice (R=0.589, R2 = 0.347, p<0.001) (Figure 1C). As expected, in Sham-operated animals, no association was detected, neither in WT- nor in Adrb2-/- mice (data not shown).
Furthermore, the number of cells expressing the α2a-ARs was examined 2 and 8 weeks after surgeries to investigate, whether β2-AR deficiency resulted in any compensatory changes in the expression in the medial tibial cartilage and synovial tissue. In the cartilage, no difference between Adrb2-/- and WT DMM mice was detectable at any time point, while α2a-AR numbers were significantly higher in both Adrb2-/- and WT Sham mice compared to the respective DMM groups (2w WT p=0.019; Adrb2-/- p=0.049; 8w WT p<0.001; Adrb2-/- p<0.001). In contrast, significantly less α2a-AR-positive cells were counted in the synovial tissue of Adrb2-/- DMM mice than in WT mice (p=0.042). At the 2 week time point, no differences could be detected between DMM and Sham animals. However, 8 weeks after surgery, significantly higher α2a-AR numbers were counted in the synovium of Adrb2-/- DMM mice compared to Adrb2-/- Sham mice (Supplementary Figure 4, p=0.003).
Increased Calcified Cartilage Thickness in Adrb2-/- DMM Mice
Micro-CT analyses of calcified cartilage (CC) thickness revealed that DMM surgery led to a thicker CC in both WT (p=0.041) and in Adrb2-/- (p<0.001) mice compared to the respective Sham animals as expected (Figure 2A). In Adrb2-/- DMM animals, the thickness of CC was significantly higher compared to the WT DMM mice (Figure 2A, p=0.010).
In addition, meniscal ossicles formation in DMM mice was markedly pronounced compared to the Sham groups (Figure 2B), although all experimental groups developed ectopic bone in the menisci at the injury site. Both DMM groups had decreased bone mineral density (BMD) (WT p=0.004; Adrb2-/- p=0.002), as well as a significantly higher bone specific surface (BS/BV) (WT p=0.001; Adrb2-/- p=0.010) in the meniscal ossicles compared to the respective Sham groups.
β2-AR Deficiency Did Not Affect Osteophyte Formation But Reduced the Number of α2A-AR-Expressing Cells in This Region
Osteophytes were detected in all WT DMM and Adrb2-/- DMM mice (5 osteophytes per 5 analyzed mice), while Sham animals did not develop osteophytes (0 osteophytes in 5 examined samples). Osteophyte development in both WT DMM and Adrb2-/- DMM mice resulted in a significantly increased medial condyle length (MCL) compared to the respective Sham-operated mice (WT p<0.001; Adrb2-/- p<0.001). No difference in MCL between WT Sham and Adrb2-/- Sham animals were detected (Figure 3A).
The number of α2a-AR-positive cells was examined post-operatively at 2 and 8 weeks. The number of α2a-AR-expressing cells was higher in WT DMM mice 2 weeks after surgery compared to Adrb2-/- DMM mice (p<0.001) in the region of osteophyte formation. Similarly, in WT Sham compared to Adrb2-/- Sham mice (p<0.001) (Figure 3B). The number of α2a-AR-positive cells in both WT DMM and WT Sham was significantly lower 8 weeks compared to the 2 week time point (Figure 3B, p=0.004). Though, after 8 weeks, no significant differences between WT and Adrb2-/- after Sham or DMM surgery were detectable.
Increased Subchondral Bone Thickness in Adrb2-/- DMM Mice
We used micro-CT to investigate the effect of β2-AR deficiency on the subchondral bone as well as the subarticular trabecular bone in the tibiae of WT and Adrb2-/- animals. First, we examined the changes in the thickness of the subchondral bone plate (SCBP). Adrb2-/- DMM animals exhibited a significantly thicker SCBP in the medial condyle of the tibia (p<0.001) when compared to WT DMM mice, while there was no increase in Adrb2-/- Sham animals compared to WT Sham animals (Figure 4A). Moreover, Adrb2-/- DMM mice had significantly increased BV/TV (p=0.006), but no significant differences in Tb.Th, Tb.N and Tb.Sp compared to WT DMM mice 8 weeks after surgery (Figure 4B). No differences in any of the parameters were found between Adrb2-/- Sham and WT Sham animals.
In order to better assess the influence of β2-AR and/or DMM on bone, we also examined the above-described parameters in the subarticular trabecular bone (Figure 4C). DMM surgery in Adrb2-/- mice significantly decreased Tb.Th (p=0.012) and Tb.N (p=0.026) compared to WT DMM mice, while there were no significant changes in BV/TV and in Tb.Sp. (Figure 4C). In addition, no significant differences in any of the parameters were detected between Adrb2-/- and WT Sham animals.
β2-AR Deficiency Resulted in Increased Osteoblast But Decreased Osteoclast Activity
We analyzed the activity of osteoblasts (ALP) and osteoclasts (CatK) to understand, which processes at the cellular level are responsible for the changes in the subchondral bone (Figure 5). Adrb2-/- DMM animals had a larger ALP positive area by trend compared to WT DMM mice 4 weeks after OA induction. There was no significant difference between the Sham groups at this time point. In contrast, after 8 weeks, the ALP positive area in the medial subchondral bone was unaffected by genotype (WT or Adrb2-/-) or surgery (DMM or Sham) (Figure 5).
Regarding the CatK positive area, the opposite was observed. After 4 weeks, there was no significant difference between WT and Adrb2-/- DMM, as well as WT Sham and Adrb2-/- Sham animals. However, 8 weeks after surgery, CatK positive area was significantly higher in WT DMM mice than in Adrb2-/- DMM mice (Figure 5, p=0.002).
Increased Body and Spleen Weight as Well as Decreased Sympathetic Tone in Adrb2-/- Mice
To further assess whether there might be relations between body mass and bone structure, changes of body weight were analyzed (Figure 6A). There was a strong body weight increase in Adrb2-/- mice and a less pronounced increase in WT over time. A significant difference between WT and Adrb2-/- mice appeared 8 weeks (p<0.001) and 12 weeks after DMM (p<0.001), as well as 8 weeks (p=0.001) and 12 weeks (p<0.001) after Sham surgery (Figure 6A).
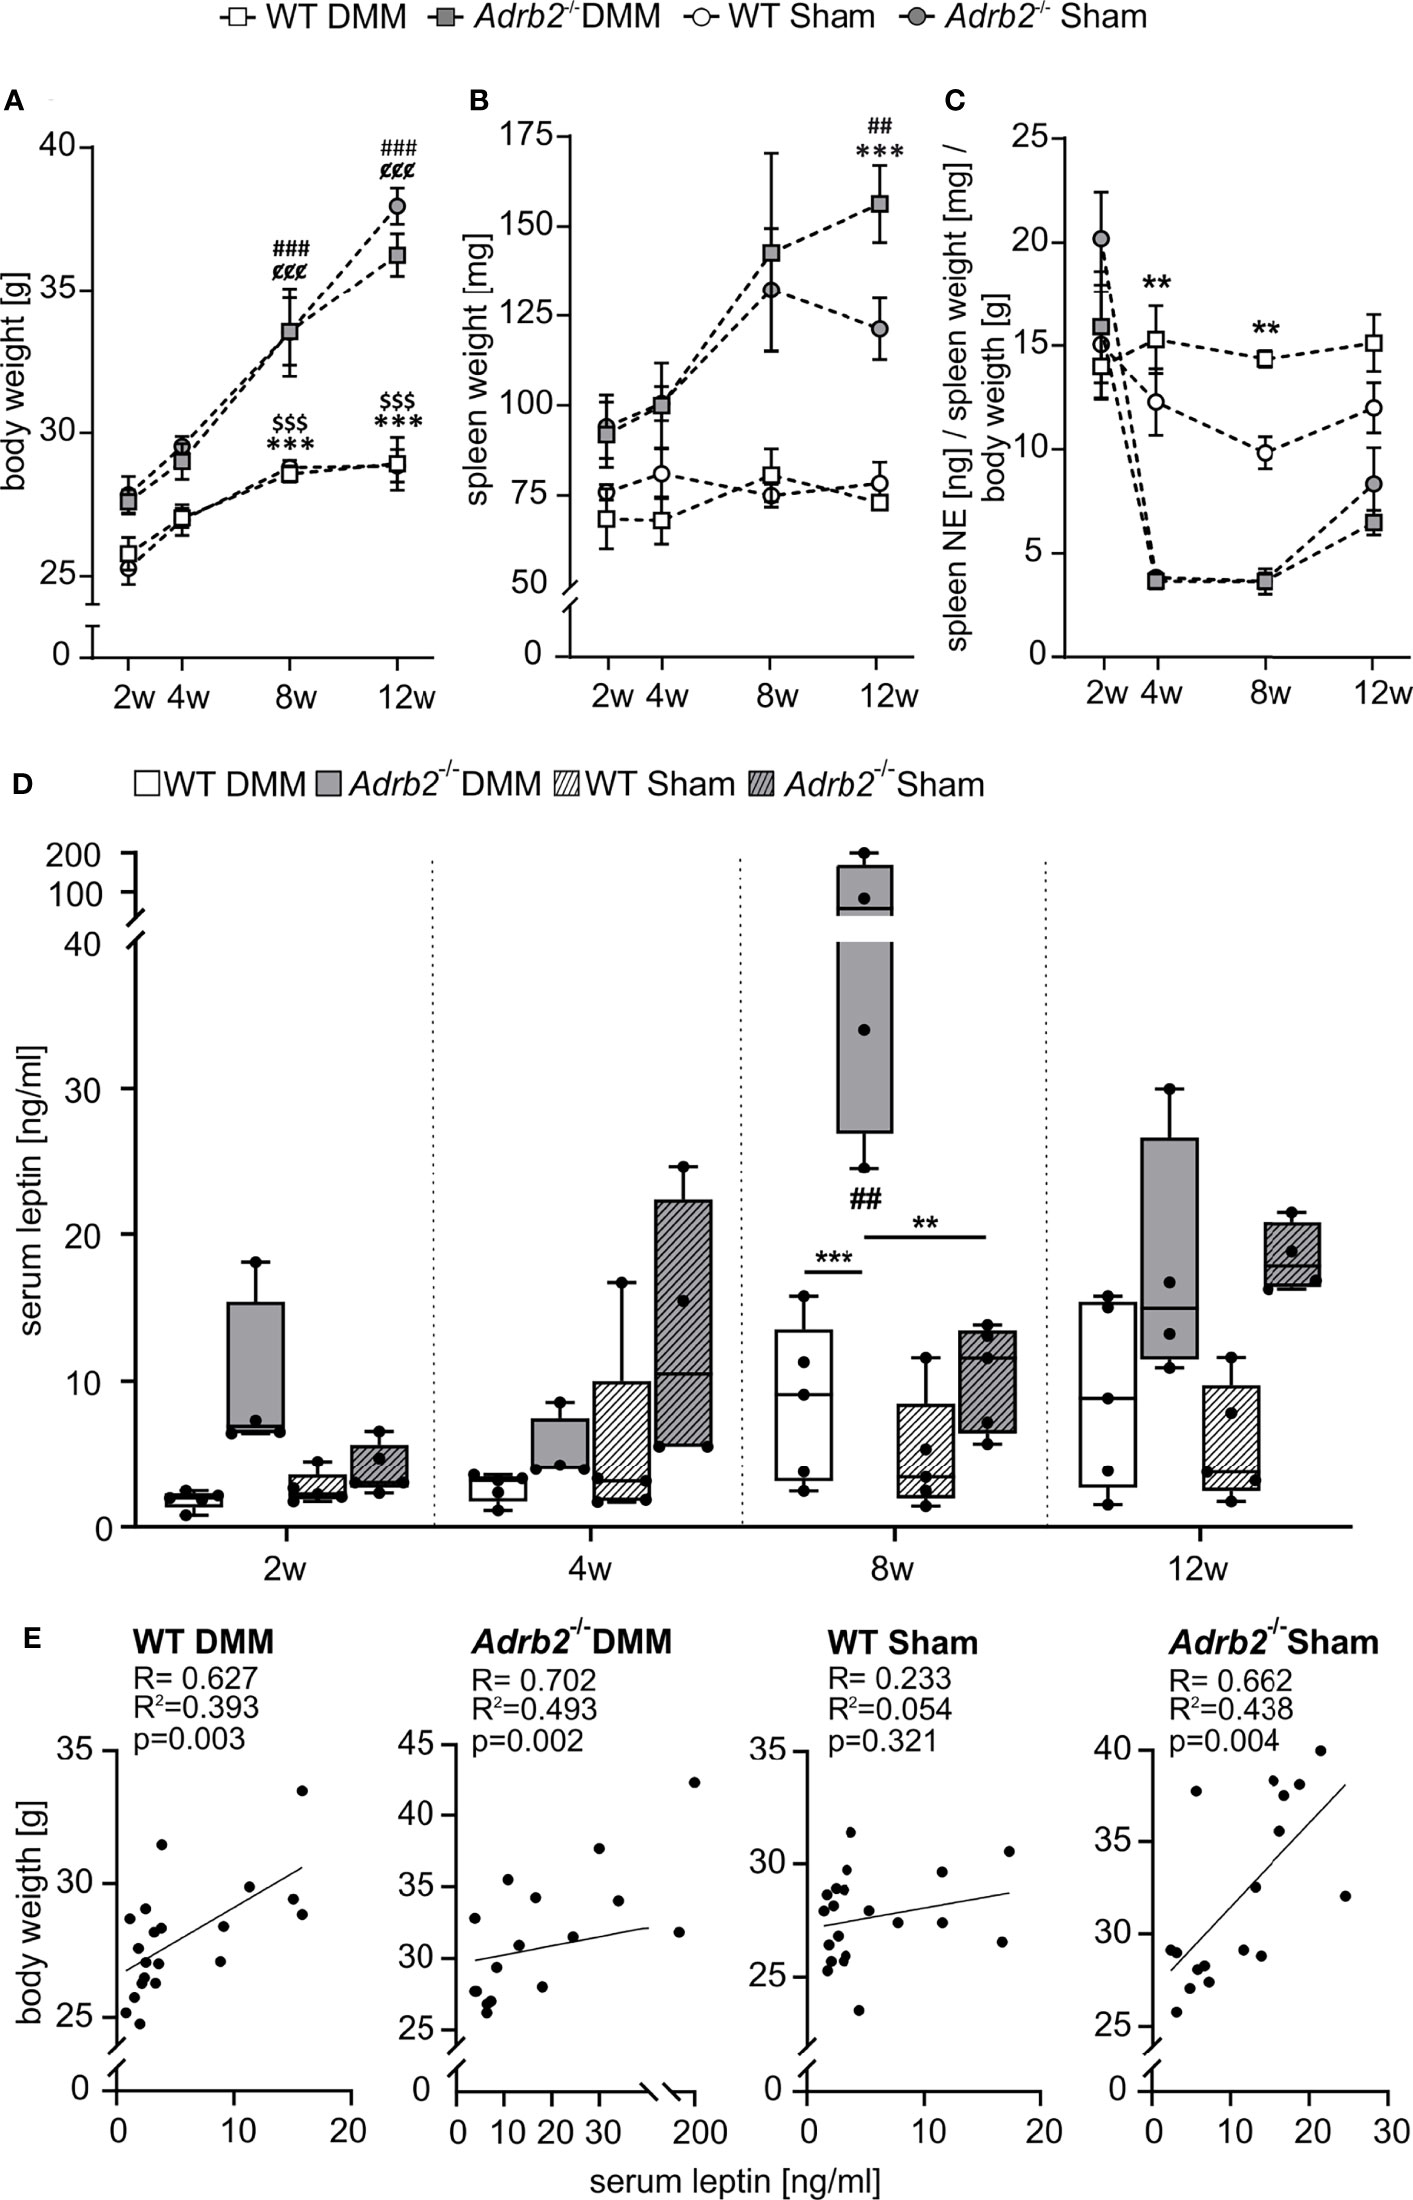
Figure 6 Body weight, spleen weight, splenic NE concentration and serum leptin level. (A) Body weight data are represented as means +/- SEM (n=8-10 per group). Significant p-values are presented as ###p ≤ 0.001 when compared to 2 weeks Adrb2-/- DMM; $$$p < 0.001 when compared to 2 weeks WT Sham; ¢¢¢p ≤ 0.001 when compared to 2weeks Adrb2-/- Sham; ***p ≤ 0.001 when WT DMM compared to Adrb2-/- DMM; $$$p ≤ 0.001 when WT Sham compared to Adrb2-/- Sham. (B) Spleen weight data are represented as means +/- SEM (n=8-10 per group). Significant p-values are presented as ##p ≤ 0.01 when compared to 2 weeks Adrb2-/- DMM; ***p ≤ 0.001 when WT DMM compared to Adrb2-/- DMM. (C) Relative splenic NE concentration data are represented as means +/- SEM (n=3 per group). Significant p-values are presented as **p ≤ 0.01 when WT DMM compared to Adrb2-/- DMM; ¢p ≤ 0.05, ¢¢¢p ≤ 0.001 when compared to 2weeks Adrb2-/- Sham. (D) Serum leptin concentration data are presented as box plots with whiskers. Each black circle represents an individual mouse (n=5 per group). Significant p-values are presented as **p ≤ 0.01, ***p ≤ 0.001 for comparisons between groups. (E) Linear regression of serum leptin concentrations and body weight in WT and Adrb2-/- mice 2, 4, 8, and 12 weeks after DMM and Sham surgery.
In addition to the increased body weight, we also observed an increase in spleen weight in Adrb2-/- mice 12 weeks after DMM and Sham (p=0.001) compared to the respective WT animals (Figure 6B).
To analyse the influence of β2-AR deficiency on the sympathetic tone, we examined the concentration of splenic NE (Figure 6C and Supplementary Figure 5C). Regarding absolute splenic NE concentrations, there were no significant differences between WT and Adrb2-/- mice, except after 2 weeks between Adrb2-/- Sham and WT Sham (Supplementary Figure 5C, p=0.017). However, when splenic NE was normalized to spleen and body weights, both Adrb2-/- DMM and Sham mice had significantly lower NE levels 4, and 8 weeks after surgery compared to the respective WT groups (Figure 6C, 4w p=0.002; 8w p=0.007).
Additionally, we examined the body weights of non-operated control WT and non-operated control Adrb2-/- mice at the respective time points of surgery. The body weights of both WT and Adrb2-/- mice increased over time, however, at 12 week time point, Adrb2-/- mice exhibited significantly higher body weights than WT mice (p<0.001, Supplementary Figure 5A). In order to figure out, whether increased body weight is associated with changes in size of the mice, body length was also determined. No significant differences between WT and Adrb2-/- mice were detected at any time point (Supplementary Figure 5B). However, we observed that Adrb2-/- mice developed markedly higher abdominal fat mass compared to WT mice (Supplementary Figure S5D). To the attentive and critical observer, no obvious differences in behaviour and activity were detected.
Serum Leptin Levels in Adrb2-/- DMM Mice
In order to examine, whether the effects on the subchondral bone were mediated by adipose tissue-derived factors, the concentration of the leptin in serum samples was measured. β2-AR deficiency led to a significant increase of serum leptin concentrations 8 weeks after DMM compared to the Adrb2-/- Sham mice (p=0.009) (Figure 6D) as well as compared to WT DMM mice (p<0.001) (Figure 6D). There was no difference regarding serum leptin levels between WT DMM and WT sham animals. Moreover, there was a strong positive correlation between body weight and blood leptin concentrations in WT DMM mice (R=0.627, R2 = 0.393, p=0.003), in Adrb2-/- DMM mice (R=0.702, R2 = 0.493, p=0.002), as well as in Adrb2-/- Sham mice (R=0.662, R2 = 0.438, p=0.003), while there was no association in WT Sham mice (R=0.233; R2 = 0.054, p=0.321) (Figure 6E).
Discussion
Various β2-AR-mediated effects of the SNS on chondrocytes, synoviocytes or cells of the subchondral bone regarding OA pathogenesis have been described by recent studies (9). Most of these studies were performed in vitro in monocultures (13, 17, 18), only one investigated the TMJ in vivo (20). Therefore, the overall role of β2-AR during OA progression in all involved joint tissues at the same time is still unclear, either in animal or in human OA. The present study analyzed cartilage degeneration, synovial inflammation and subchondral bone remodeling in Adrb2-/- mice. We demonstrated that although β2-AR deficiency had no influence on articular cartilage degradation and OA-related synovitis, the thickness of calcified cartilage and OA-related subchondral bone changes were aggravated compared to the respective WT control animals.
In order to explore the effects of β2-AR deficiency on OA progression, experimental OA was induced by DMM and at first, cartilage degeneration was evaluated using the OARSI scoring system. Surprisingly, we observed no differences between Adrb2-/- DMM and WT DMM mice at any time point, although in vitro studies performed in human OA chondrocyte culture reported that β2-AR activation resulted predominantly in anabolic effects (17), while in contrast to that, in healthy murine chondrocytes, β2-AR mediated mainly catabolic effects (35). In fact, we expected that in the absence of β2-AR, the above-described catabolic effects of α2-AR should be dominant. However, articular cartilage tissue of Adrb2-/- mice did not show a higher degree of degeneration. One reason for this phenomenon might be the lower expression of α2-AR in the cartilage of Adrb2-/- mice, although most existing studies investigating murine AR knockout models rather described that the deficiency of one AR subtype is not compensated by the up- or downregulation of other AR subtypes (36–39).
Since the synovial tissue is one major contributor to OA pathogenesis, the influence of β2-AR deficiency on synovitis progression was also analyzed. The synovial inflammation was progressive with continuously increasing synovitis scores in WT DMM animals as already described in previous studies (40). Interestingly, no differences were detected at any time point between Adrb2-/- DMM and WT DMM mice. This result was quite surprising because β2-AR activation led to clear anti-inflammatory, while α2-AR activation to pro-inflammatory effects in synovial cell cultures of OA patients (21, 22). Therefore, we expected that β2-AR deficiency results in enhanced synovitis scores due to dominant pro-inflammatory effects mediated by α2-AR. Similar to the situation in articular cartilage, lower numbers of α2-AR were detected in the synovial tissue of both DMM and Sham Adrb2-/- mice compared to the respective WT mice 2 weeks after surgery. This effect disappeared until week 8 because Adrb2-/- mice upregulated the synovial expression of α2-ARs, while α2-AR numbers did not change over time. A similar phenomenon was never described before. Therefore, we speculate, that the cells being deficient for one AR subtype try to compensate the lacking effects by regulating other AR subtypes (41). The reason, why Adrb2-/- mice did not exhibit higher synovitis scores might be that the inflammation is already at its maximum.
We observed an increased thickness of calcified cartilage in WT DMM compared to WT Sham animals knowing that calcification at the interface of cartilage and subchondral bone is clearly associated with cartilage degeneration during OA progression (42). Although the uncalcified zones of articular cartilage were not stronger degenerated in β2-AR-deficienct animals, the microCT analyses revealed that the thickness of calcified cartilage increased in Adrb2-/- DMM compared to WT DMM mice. There are no existing studies at present describing any effect of the β2-AR on the process of cartilage calcification but in a rat OA model of the TMJ, the α2-AR has been shown to mediate the induction of calcification (19). However, the expression of α2-AR was not higher in the hypertrophic zone of Adrb2-/- mice suggesting that α2-AR is not involved in this process. Therefore, it is likely that due to the opposing intracellular signaling pathways of α2-AR and β2-AR, the β2-AR acts as a functional antagonist to the α2-AR (10). This seems to be a good reason why Adrb2-/- DMM mice have increased calcified cartilage thickness.
Further OA-associated events such as increased subchondral bone plate thickness as well as elevated epiphyseal bone volume (43) were detected in the absence of β2-ARs. One possible explanation would be that bone formation increases in Adrb2-/- DMM mice (44). In fact, the number or activity of osteoblasts increased in these mice indicated by increased ALP-positive regions already 4 weeks post-surgery. This confirms earlier studies demonstrating that the non-selective beta blocker propranolol increased the bone mass in mice and rats (45, 46). In contrast, the non-selective beta-agonist isoproterenol or the β2AR selective agonists clenbuterol or salbutamol decreased the bone mass in mice (46, 47). Another reason for increased bone mass in Adrb2-/- DMM mice could be reduced bone resorption (44) due to decreased osteoclast activity indicated by less CatK staining after 8 weeks. A specific β2-AR activation has been described to increase rat osteoclast differentiation and activity in vitro (20, 48) suggesting that β2-AR-deficiency might be related to suppressed osteoclast differentiation. Other studies reported a significantly increased bone volume in vertebrae and long bones in unchallenged β2-AR knockout mice compared to the respective WT animals supporting our data (49). We believe that the time-dependent differences in osteoblast and osteoclast activities are a result of the differential response of these cells to leptin. We assume that leptin first increases osteoblast proliferation and activity (50), then, osteoblasts secrete factors (OPG or IL-6 among others) that in turn activate osteoclastogenesis and activity (50, 51) (see explanations to leptin below).
Weight gain was faster in Adrb2-/- mice, although body size did not increase. This was unexpected because an earlier study by Pierroz et al. comparing bone phenotypes in Adrb2-/- mice did not detect any differences in body weight gain in 4 months old animals when compared to WT (52). As this study was terminated after 4 months, no information on body weight gain in Adrb2-/- mice at higher ages exist. We detected that an increased body fat mass tissue volume was responsible for the elevated body weight of Adrb2-/- mice. Furthermore, one study in OA patients described that the expression of the ADRB2 gene was significantly lower in the adipose tissue of obese patients than in tissues of normal-weight individuals (53). It is known that α- and β-ARs play an important an opposing role in lipolysis. α-ARs, especially the α2-AR, inhibit lipolysis, while β-ARs elicit lipolysis (54). Therefore, the major reason for the increased body fat mass in Adrb2-/- mice is on the one hand the lack of β2-AR-mediated lipolysis and the other hand the still existing fat deposition by α2-ARs (54, 55). Therefore, besides direct effects of β2-AR-deficiency, elevated subchondral bone mass might be the result of the increased body mass and accordingly higher mechanical loading of the knee joints in Adrb2-/- mice (56). However, the described subchondral bone effects were not observed in Adrb2-/- Sham mice.
In addition, elevated serum leptin concentrations of Adrb2-/- mice might also be responsible for the thickening of the subchondral bone. Although previous studies by the Elefteriou and Karsenty groups demonstrated that increased serum leptin concentrations dramatically reduced bone mass in the vertebral body of mice by inhibiting osteoblast activity and enhancing osteoclast activity (57, 58), other and more recent studies observed the opposite. For example, obese Ob/Ob mice being unable to produce leptin have a reduced bone mass (59). Similarly, leptin treatment of rats resulted in new bone formation, higher bone density and reduction in fracture risk by increasing the proliferation of osteoblasts and inhibiting osteoclastogenesis (60). And finally, in human osteoblasts derived from OA patients, leptin stimulated the proliferation and increased the levels of ALP and type I collagen (61). This fits to the most recent findings demonstrating that adipose tissue plays a critical role in the pathophysiology of OA. The authors described that leptin-mediated effects, rather than body weight, play a predominant role in joint degeneration (62). Interestingly, leptin levels were only elevated in Adrb2-/- DMM but not in Adrb2-/- Sham mice, although body weight and fat mass were not different. The reason for this phenomenon is most likely the OA-associated presence of proinflammatory cytokines in Adrb2-/- DMM mice in contrast to the respective Sham animals. Recent studies investigating obese mice as well as humans described that IL-1β, the major proinflammatory cytokine during OA progression (63), induced the release of leptin from the adipose tissue (64, 65). Thus, the increased bone mass might be a synergistic effect of β2-AR deficiency (directly), β2-AR deficiency-associated increased body fat mass (reduced lipolysis) and serum leptin concentration (indirectly) as well as OA induction itself.
Interestingly, the Adrb2-/- mice in our study had enlarged spleens. The mouse repository https://www.mousephenotype.org/data/genes/MGI:87938#phenotypesTab described the same phenomenon but without specifying the reason for it. However, one recent study demonstrated that peripheral sympathectomy in mice with type II collagen-induced arthritis led to the retention of immune cells in the spleen (66). Such an immune cell retention in secondary lymphoid organs is mediated by the β2-AR (67, 68). Therefore, increased spleen weight might be the reason of β2-AR deficiency-dependent immune cell accumulation in the spleens of Adrb2-/- mice.
Since the spleen is richly innervated by sympathetic nerve fibers (30, 31), sympathetic activity can be determined by measuring splenic NE levels Relative NE levels were markedly lower in both Adrb2-/- DMM and Adrb2-/- Sham mice compared to the respective WT groups suggesting that β2-AR deficiency resulted in a suppressed peripheral sympathetic activity. This result is not surprising, since previous studies described that the β2-AR induces the presynaptic NE release (69, 70). In addition, DMM itself led to an increased sympathetic activity in WT animals indicated by elevated splenic NE levels, which is most obviously due to SNS activation by OA-related local inflammation. This additional activation of the SNS by DMM can induce the release of NE in secondary lymphoid organs such as the spleen, as already shown in humans with rheumatoid arthritis (10).
Moreover, it has to kept in mind that only male mice were investigated in this study because DMM is a male-dominant model (71). Thus, estrous cyclicity, which would also increase variability and accordingly experimental group sizes (72), can be excluded.
In conclusion, this study demonstrated that β2-AR deficiency might contribute to OA progression by aggravating OA-related calcification at the interface of cartilage and subchondral bone and subchondral bone remodelling, while articular cartilage surface degeneration and synovial inflammation remained unaffected. Although OA is a disease of the whole joint, not all tissues were affected by β2-AR deficiency. According to the saying “Which came first, the chicken or the egg?”, it seems that effects in the calcified layer of cartilage and in the subchondral bone are the driving forces in our model. In fact, it was observed most recently that “subchondral bone changes might occur at the same time as (and possibly earlier than) cartilage changes” (43). We believe that the degeneration of articular cartilage in Adrb2-/- mice would be more severe at later time points as included into our observation. Thus, our chosen time course might be a limitation of the standard DMM model this study. The thickening of calcified cartilage and subchondral bone in Adrb2-/- mice is on the one hand directly β2-AR-dependent and mediated by increasing osteoblast and suppressed osteoclast activities. On the other hand, β2-AR deficiency resulted in increased body weight and fat deposition and accordingly in elevated serum leptin levels. Both high serum leptin concentration due to increased body fat mass and the elevated leptin release caused by OA-associated inflammation aggravate the OA-related thickening of subchondral bone in the same way by increasing osteoblast and inhibiting osteoclast activities. Another limitation of the present study is that the contribution of other AR subtypes, except for some work on the α2-AR, was not considered. The present findings clearly demonstrated a major role of β2-AR in OA-related cartilage calcification and subchondral bone changes. Therefore, targeting the β2-AR might represent a novel future treatment option, which might help to develop tissue-specific therapeutic drugs for the prevention of pathological subchondral bone remodeling in OA patients.
Data Availability Statement
The original contributions presented in the study are included in the article/Supplementary Material. Further inquiries can be directed to the corresponding author.
Ethics Statement
The animal study was reviewed and approved by Ethical Review Committee, Government of Unterfranken, 55.2-2532-2-368. Written informed consent was obtained from the owners for the participation of their animals in this study.
Author Contributions
ZJ-L and RS contributed to conception and design of the study. DM, ST, CD, AM, FZ, AS, and SG provided study tools and techniques. GR, DM, ST, KEB, CD, and ZJ-L generated the data. GR, ST, KEB, and ZJ-L generated draft figures. GR, ST, and KEB organized the database. GR and ST performed the statistical analysis. GR and ZJ-L wrote the first draft of the manuscript. ST wrote sections of the manuscript. All authors contributed to manuscript revision, read, and approved the submitted version.
Funding
This study was supported by grants of the Deutsche Forschungsgemeinschaft (to ZJ-L and RS (JE 642/4-1, JE 642/4-2; project number 277277765), to SG (GR 1301/19-2; project number 277277765), and to AS (SCHI 857/9-1, project number 277277765) within the DFG Research Unit FOR2407 ExCarBon, and to FZ (ZA 561/3-1; project number 407168728) within the DFG Research Unit FOR2722).
Conflict of Interest
The authors declare that the research was conducted in the absence of any commercial or financial relationships that could be construed as a potential conflict of interest.
Publisher’s Note
All claims expressed in this article are solely those of the authors and do not necessarily represent those of their affiliated organizations, or those of the publisher, the editors and the reviewers. Any product that may be evaluated in this article, or claim that may be made by its manufacturer, is not guaranteed or endorsed by the publisher.
Acknowledgments
The authors thank Madlen Melzer, Anja Pasoldt, Inna Schaible, and Birgit Striegl for excellent technical assistance.
Supplementary Material
The Supplementary Material for this article can be found online at: https://www.frontiersin.org/articles/10.3389/fimmu.2021.801505/full#supplementary-material
Supplementary Figure 1 | Areas of interests in the right murine knee joint. (A) Areas of interest for the analyses indicated by red rectangles for articular cartilage (I), synovium (II), subhcondral bone (III) and region of osteophytes (IV). DMMB staining (bar: 500 µm).
Supplementary Figure 2 | Quantile-quantile (QQ) plots of residuals present the theoretical quantiles predicted to check the normal distribution for ANOVA.
Supplementary Figure 3 | Confirmation of β2-AR deficiency and controls for the immunohistochemical stainings (A) Staining of knee joints of β2-AR in WT and Abdrb2-/- mice with a magnification of 10x for the whole joint (bar: 1,5 mm) and a magnification of 20x for the region of osteophyte formation (bar: 100 µm, F – femur, T – tibia, M - meniscus). (B) Negative and isotype controls for the immunohistochemical stainings in the region of osteophyte formation (bar: 100µm).
Supplementary Figure 4 | AR expression in the articular cartilage and in the synovium. (A) Immunohistochemical detection and quantification of α2A- and β2-AR (dark brown) in the articular cartilage in the medial tibia plateau of WT and Adrb2-/- mice 2 and 8 weeks after DMM or Sham surgery (bar: 100 µm) and (B) in the medial synovium of WT and Adrb2-/- mice 2 and 8 weeks after DMM or Sham surgery (bar: 200 µm) Nuclei are counterstained with hematoxylin (dark blue). Data are presented as box plots with whiskers. Each black circle represents an individual mouse (n=3 per group). Significant p-values are presented as *p ≤ 0.05, **p ≤ 0.01, ***p ≤ 0.001 for comparisons between groups at one time point. +++p ≤ 0.001 when compared to 4 weeks WT DMM; ## p ≤ 0.01 when compared to 4 weeks Adrb2-/- DMM.
Supplementary Figure 5 | Body weight, body length at the same time points in healthy non-operated WT and Adrb2-/- mice like 2, 4, 8 and 12 weeks after DMM or Sham surgery in WT and Adrb2-/- DMM mice. (A) Body weight data are represented as means +/- SEM (n=5 per group). Significant p-values are presented as ***p ≤ 0.001, when WT DMM compared to Adrb2-/- DMM. (B) Body length data are represented as means +/- SEM (n=5 per group). (C) Concentration of absolute splenic NE data are represented as means +/- SEM (n=3 per group). Significant p-values are presented as **p ≤ 0.01, when WT DMM compared to Adrb2-/- DMM. (D) Representative images displaying the abdomen of 6 months old unchallenged WT and Adrb2-/- mice (H - hearth, L - liver, AF – abdominal fat).
References
1. Kloppenburg M, Berenbaum F. Osteoarthritis Year in Review 2019: Epidemiology and Therapy. Osteoarthritis Cartilage (2020) 28(3):242–8. doi: 10.1016/j.joca.2020.01.002
2. Loeser RF, Goldring SR, Scanzello CR, Goldring MB. Osteoarthritis: A Disease of the Joint as an Organ. Arthritis Rheum (2012) 64(6):1697–707. doi: 10.1002/art.34453
3. Hoy DG, Smith E, Cross M, Sanchez-Riera L, Blyth FM, Buchbinder R, et al. Reflecting on the Global Burden of Musculoskeletal Conditions: Lessons Learnt From the Global Burden of Disease 2010 Study and the Next Steps Forward. Ann Rheum Dis (2015) 74(1):4–7. doi: 10.1136/annrheumdis-2014-205393
4. Dobson GP, Letson HL, Grant A, McEwen P, Hazratwala K, Wilkinson M, et al. Defining the Osteoarthritis Patient: Back to the Future. Osteoarthritis Cartilage (2018) 26(8):1003–7. doi: 10.1016/j.joca.2018.04.018
5. Litwic A, Edwards MH, Dennison EM, Cooper C. Epidemiology and Burden of Osteoarthritis. Br Med Bull (2013) 105:185–99. doi: 10.1093/bmb/lds038
6. Grassel S, Muschter D. Recent Advances in the Treatment of Osteoarthritis. F1000Res (2020) 9. doi: 10.12688/f1000research.22115.1
7. Courties A, Sellam J, Berenbaum F. Role of the Autonomic Nervous System in Osteoarthritis. Best Pract Res Clin Rheumatol (2017) 31(5):661–75. doi: 10.1016/j.berh.2018.04.001
8. Rösch G, El Bagdadi K, Muschter D, Taheri S, Dorn C, Meurer A, et al. Sympathectomy Aggravates Subchondral Bone Changes During Osteoarthritis Progression in Mice Without Affecting Cartilage Degeneration or Synovial Inflammation. Osteoarthritis Cartilage (2021). doi: 10.1016/j.joca.2021.11.016
9. Sohn R, Rosch G, Junker M, Meurer A, Zaucke F, Jenei-Lanzl Z. Adrenergic Signalling in Osteoarthritis. Cell Signal (2021) 82:109948. doi: 10.1016/j.cellsig.2021.109948
10. Pongratz G, Straub RH. The Sympathetic Nervous Response in Inflammation. Arthritis Res Ther (2014) 16(6):504. doi: 10.1186/s13075-014-0504-2
11. Jenei-Lanzl Z, Grassel S, Pongratz G, Kees F, Miosge N, Angele P, et al. Norepinephrine Inhibition of Mesenchymal Stem Cell and Chondrogenic Progenitor Cell Chondrogenesis and Acceleration of Chondrogenic Hypertrophy. Arthritis Rheumatol (2014) 66(9):2472–81. doi: 10.1002/art.38695
12. Hein L. Adrenoceptors and Signal Transduction in Neurons. Cell Tissue Res (2006) 326(2):541–51. doi: 10.1007/s00441-006-0285-2
13. Huang HH, Brennan TC, Muir MM, Mason RS. Functional Alpha1- and Beta2-Adrenergic Receptors in Human Osteoblasts. J Cell Physiol (2009) 220(1):267–75. doi: 10.1002/jcp.21761
14. Jenei-Lanzl Z, Zwingenberg J, Lowin T, Anders S, Straub RH. Proinflammatory Receptor Switch From Gαs to Gαi Signaling by β-Arrestin-Mediated PDE4 Recruitment in Mixed RA Synovial Cells. Brain Behavior Immun (2015) 50:266–74. doi: 10.1016/j.bbi.2015.07.020
15. Hamajima K, Hamamura K, Chen A, Yokota H, Mori H, Yo S, et al. Suppression of Osteoclastogenesis via Alpha2-Adrenergic Receptors. BioMed Rep (2018) 8(5):407–16. doi: 10.3892/br.2018.1075
16. Speichert S, Molotkov N, El Bagdadi K, Meurer A, Zaucke F, Jenei-Lanzl Z. Role of Norepinephrine in IL-1beta-Induced Chondrocyte Dedifferentiation Under Physioxia. Int J Mol Sci (2019) 20(5). doi: 10.3390/ijms20051212
17. Lorenz J, Schafer N, Bauer R, Jenei-Lanzl Z, Springorum RH, Grassel S. Norepinephrine Modulates Osteoarthritic Chondrocyte Metabolism and Inflammatory Responses. Osteoarthritis Cartilage (2016) 24(2):325–34. doi: 10.1016/j.joca.2015.08.007
18. El Bagdadi K, Zaucke F, Meurer A, Straub RH, Jenei-Lanzl Z. Norepinephrine Inhibits Synovial Adipose Stem Cell Chondrogenesis via Alpha2a-Adrenoceptor-Mediated ERK1/2 Activation. Int J Mol Sci (2019) 20(13). doi: 10.3390/ijms20133127
19. Jiao K, Zeng G, Niu LN, Yang HX, Ren GT, Xu XY, et al. Activation of Alpha2a-Adrenergic Signal Transduction in Chondrocytes Promotes Degenerative Remodelling of Temporomandibular Joint. Sci Rep (2016) 6:30085. doi: 10.1038/srep30085
20. Jiao K, Niu LN, Li QH, Ren GT, Zhao CM, Liu YD, et al. Beta2-Adrenergic Signal Transduction Plays a Detrimental Role in Subchondral Bone Loss of Temporomandibular Joint in Osteoarthritis. Sci Rep (2015) 5:12593. doi: 10.1038/srep12593
21. Straub RH, Gunzler C, Miller LE, Cutolo M, Scholmerich J, Schill S. Anti-Inflammatory Cooperativity of Corticosteroids and Norepinephrine in Rheumatoid Arthritis Synovial Tissue In Vivo and In Vitro. FASEB J (2002) 16(9):993–1000. doi: 10.1096/fj.02-0085com
22. Capellino S, Cosentino M, Wolff C, Schmidt M, Grifka J, Straub RH. Catecholamine-Producing Cells in the Synovial Tissue During Arthritis: Modulation of Sympathetic Neurotransmitters as New Therapeutic Target. Ann Rheum Dis (2010) 69(10):1853–60. doi: 10.1136/ard.2009.119701
23. Glasson SS, Blanchet TJ, Morris EA. The Surgical Destabilization of the Medial Meniscus (DMM) Model of Osteoarthritis in the 129/SvEv Mouse. Osteoarthritis Cartilage (2007) 15(9):1061–9. doi: 10.1016/j.joca.2007.03.006
24. Glasson SS, Chambers MG, Van Den Berg WB, Little CB. The OARSI Histopathology Initiative - Recommendations for Histological Assessments of Osteoarthritis in the Mouse. Osteoarthritis Cartilage (2010) 18 Suppl3:S17–23. doi: 10.1016/j.joca.2010.05.025
25. Krenn V, Morawietz L, Burmester GR, Kinne RW, Mueller-Ladner U, Muller B, et al. Synovitis Score: Discrimination Between Chronic Low-Grade and High-Grade Synovitis. Histopathology (2006) 49(4):358–64. doi: 10.1111/j.1365-2559.2006.02508.x
26. Fan M, Lee TCM. Variants of Seeded Region Growing. IET Image Process (2015) 9(6):478–85. doi: 10.1049/iet-ipr.2014.0490
27. Muschter D, Fleischhauer L, Taheri S, Schilling AF, Clausen-Schaumann H, Grassel S. Sensory Neuropeptides Are Required for Bone and Cartilage Homeostasis in a Murine Destabilization-Induced Osteoarthritis Model. Bone (2020) 133:115181. doi: 10.1016/j.bone.2019.115181
28. Bouxsein ML, Boyd SK, Christiansen BA, Guldberg RE, Jepsen KJ, Muller R. Guidelines for Assessment of Bone Microstructure in Rodents Using Micro-Computed Tomography. J Bone Miner Res (2010) 25(7):1468–86. doi: 10.1002/jbmr.141
29. Sawyer A, Lott P, Titrud J, McDonald J. Quantification of Tartrate Resistant Acid Phosphatase Distribution in Mouse Tibiae Using Image Analysis. Biotech Histochem (2003) 78(5):271–8. doi: 10.1080/10520290310001646668
30. Felten DL, Ackerman KD, Wiegand SJ, Felten SY. Noradrenergic Sympathetic Innervation of the Spleen: I. Nerve Fibers Associate With Lymphocytes and Macrophages in Specific Compartments of the Splenic White Pulp. J Neurosci Res (1987) 18(1):28–36, 118-121. doi: 10.1002/jnr.490180107
31. Bellinger DL, Felten SY, Lorton D, Felten DL. Origin of Noradrenergic Innervation of the Spleen in Rats. Brain Behav Immun (1989) 3(4):291–311. doi: 10.1016/0889-1591(89)90029-9
32. Harle P, Pongratz G, Albrecht J, Tarner IH, Straub RH. An Early Sympathetic Nervous System Influence Exacerbates Collagen-Induced Arthritis via CD4+CD25+ Cells. Arthritis Rheum (2008) 58(8):2347–55. doi: 10.1002/art.23628
33. Azamar-Llamas D, Hernandez-Molina G, Ramos-Avalos B, Furuzawa-Carballeda J. Adipokine Contribution to the Pathogenesis of Osteoarthritis. Mediators Inflammation (2017) 2017:5468023. doi: 10.1155/2017/5468023
34. Faul F, Erdfelder E, Lang AG, Buchner A. G*Power 3: A Flexible Statistical Power Analysis Program for the Social, Behavioral, and Biomedical Sciences. Behav Res Methods (2007) 39(2):175–91. doi: 10.3758/bf03193146
35. Mitchell J, Lai LP, Peralta F, Xu Y, Sugamori K. Beta2-Adrenergic Receptors Inhibit the Expression of Collagen Type II in Growth Plate Chondrocytes by Stimulating the AP-1 Factor Jun-B. Am J Physiol Endocrinol Metab (2011) 300(4):E633–639. doi: 10.1152/ajpendo.00515.2010
36. Tanoue A, Nasa Y, Koshimizu T, Shinoura H, Oshikawa S, Kawai T, et al. The Alpha(1D)-Adrenergic Receptor Directly Regulates Arterial Blood Pressure via Vasoconstriction. J Clin Invest (2002) 109(6):765–75. doi: 10.1172/JCI14001
37. Sanders VM, Kasprowicz DJ, Swanson-Mungerson MA, Podojil JR, Kohm AP. Adaptive Immunity in Mice Lacking the β2-Adrenergic Receptor. Brain Behavior Immun (2003) 17(1):55–67. doi: 10.1016/s0889-1591(02)00056-9
38. Chernogubova E, Hutchinson DS, Nedergaard J, Bengtsson T. Alpha1- and Beta1-Adrenoceptor Signaling Fully Compensates for Beta3-Adrenoceptor Deficiency in Brown Adipocyte Norepinephrine-Stimulated Glucose Uptake. Endocrinology (2005) 146(5):2271–84. doi: 10.1210/en.2004-1104
39. Kaidonis X, Niu W, Chan AY, Kesteven S, Wu J, Iismaa SE, et al. Adaptation to Exercise-Induced Stress Is Not Dependent on Cardiomyocyte Alpha1a-Adrenergic Receptors. J Mol Cell Cardiol (2021) 155:78–87. doi: 10.1016/j.yjmcc.2021.02.010
40. Kuang L, Wu J, Su N, Qi H, Chen H, Zhou S, et al. FGFR3 Deficiency Enhances CXCL12-Dependent Chemotaxis of Macrophages via Upregulating CXCR7 and Aggravates Joint Destruction in Mice. Ann Rheum Dis (2020) 79(1):112–22. doi: 10.1136/annrheumdis-2019-215696
41. Susulic VS, Frederich RC, Lawitts J, Tozzo E, Kahn BB, Harper ME, et al. Targeted Disruption of the Beta 3-Adrenergic Receptor Gene. J Biol Chem (1995) 270(49):29483–92. doi: 10.1074/jbc.270.49.29483
42. Stack J, McCarthy GM. Cartilage Calcification and Osteoarthritis: A Pathological Association? Osteoarthritis Cartilage (2020) 28(10):1301–2. doi: 10.1016/j.joca.2020.06.010
43. Fang H, Huang L, Welch I, Norley C, Holdsworth DW, Beier F, et al. Early Changes of Articular Cartilage and Subchondral Bone in The DMM Mouse Model of Osteoarthritis. Sci Rep (2018) 8(1):2855. doi: 10.1038/s41598-018-21184-5
44. Donell S. Subchondral Bone Remodelling in Osteoarthritis. EFORT Open Rev (2019) 4(6):221–9. doi: 10.1302/2058-5241.4.180102
45. Takeda S, Elefteriou F, Levasseur R, Liu X, Zhao L, Parker KL, et al. Leptin Regulates Bone Formation via the Sympathetic Nervous System. Cell (2002) 111(3):305–17. doi: 10.1016/s0092-8674(02)01049-8
46. Elefteriou F. Regulation of Bone Remodeling by the Central and Peripheral Nervous System. Arch Biochem Biophys (2008) 473(2):231–6. doi: 10.1016/j.abb.2008.03.016
47. Bonnet N, Brunet-Imbault B, Arlettaz A, Horcajada MN, Collomp K, Benhamou CL, et al. Alteration of Trabecular Bone Under Chronic Beta2 Agonists Treatment. Med Sci Sports Exerc (2005) 37(9):1493–501. doi: 10.1249/01.mss.0000177592.82507.95
48. Muschter D, Schafer N, Stangl H, Straub RH, Grassel S. Sympathetic Neurotransmitters Modulate Osteoclastogenesis and Osteoclast Activity in the Context of Collagen-Induced Arthritis. PloS One (2015) 10(10):e0139726. doi: 10.1371/journal.pone.0139726
49. Elefteriou F, Ahn JD, Takeda S, Starbuck M, Yang X, Liu X, et al. Leptin Regulation of Bone Resorption by the Sympathetic Nervous System and CART. Nature (2005) 434(7032):514–20. doi: 10.1038/nature03398
50. Gordeladze JO, Drevon CA, Syversen U, Reseland JE. Leptin Stimulates Human Osteoblastic Cell Proliferation, De Novo Collagen Synthesis, and Mineralization: Impact on Differentiation Markers, Apoptosis, and Osteoclastic Signaling. J Cell Biochem (2002) 85(4):825–36. doi: 10.1002/jcb.10156
51. Simonet WS, Lacey DL, Dunstan CR, Kelley M, Chang MS, Lüthy R, et al. Osteoprotegerin: A Novel Secreted Protein Involved in the Regulation of Bone Density. Cell (1997) 89(2):309–19. doi: 10.1016/s0092-8674(00)80209-3
52. Pierroz DD, Bonnet N, Bianchi EN, Bouxsein ML, Baldock PA, Rizzoli R, et al. Deletion of Beta-Adrenergic Receptor 1, 2, or Both Leads to Different Bone Phenotypes and Response to Mechanical Stimulation. J Bone Miner Res (2012) 27(6):1252–62. doi: 10.1002/jbmr.1594
53. Kurylowicz A, Jonas M, Lisik W, Jonas M, Wicik ZA, Wierzbicki Z, et al. Obesity Is Associated With a Decrease in Expression But Not With the Hypermethylation of Thermogenesis-Related Genes in Adipose Tissues. J Transl Med (2015) 13:31. doi: 10.1186/s12967-015-0395-2
54. Carey GB. Mechanisms Regulating Adipocyte Lipolysis. Adv Exp Med Biol (1998) 441:157–70. doi: 10.1007/978-1-4899-1928-1_15
55. Cero C, Razzoli M, Han R, Sahu BS, Patricelli J, Guo Z, et al. The Neuropeptide TLQP-21 Opposes Obesity via C3aR1-Mediated Enhancement of Adrenergic-Induced Lipolysis. Mol Metab (2017) 6(1):148–58. doi: 10.1016/j.molmet.2016.10.005
56. Adebayo OO, Ko FC, Wan PT, Goldring SR, Goldring MB, Wright TM, et al. Role of Subchondral Bone Properties and Changes in Development of Load-Induced Osteoarthritis in Mice. Osteoarthritis Cartilage (2017) 25(12):2108–18. doi: 10.1016/j.joca.2017.08.016
57. Elefteriou F, Takeda S, Ebihara K, Magre J, Patano N, Kim CA, et al. Serum Leptin Level is a Regulator of Bone Mass. Proc Natl Acad Sci USA (2004) 101(9):3258–63. doi: 10.1073/pnas.0308744101
58. Karsenty G. Convergence Between Bone and Energy Homeostases: Leptin Regulation of Bone Mass. Cell Metab (2006) 4(5):341–8. doi: 10.1016/j.cmet.2006.10.008
59. Batt RA. Abnormal Dentition and Decrease in Body Weight in the Genetically Obese Mouse (Genotype, Ob/Ob). Int J Obes (1978) 2(4):457–62.
60. Cornish J, Callon KE, Bava U, Lin C, Naot D, Hill BL, et al. Leptin Directly Regulates Bone Cell Function In Vitro and Reduces Bone Fragility In Vivo. J Endocrinol (2002) 175(2):405–15. doi: 10.1677/joe.0.1750405
61. Zhang P, Zhong ZH, Yu HT, Liu B. Significance of Increased Leptin Expression in Osteoarthritis Patients. PloS One (2015) 10(4):e0123224. doi: 10.1371/journal.pone.0123224
62. Collins KH, Lenz KL, Pollitt EN, Ferguson D, Hutson I, Springer LE, et al. Adipose Tissue Is a Critical Regulator of Osteoarthritis. Proc Natl Acad Sci USA (2021) 118(1). doi: 10.1073/pnas.2021096118
63. Jenei-Lanzl Z, Meurer A, Zaucke F. Interleukin-1beta Signaling in Osteoarthritis - Chondrocytes in Focus. Cell Signal (2019) 53:212–23. doi: 10.1016/j.cellsig.2018.10.005
64. Faggioni R, Fantuzzi G, Fuller J, Dinarello CA, Feingold KR, Grunfeld C. IL-1 Beta Mediates Leptin Induction During Inflammation. Am J Physiol (1998) 274(1):R204–208. doi: 10.1152/ajpregu.1998.274.1.R204
65. Bruun JM, Pedersen SB, Kristensen K, Richelsen B. Effects of Pro-Inflammatory Cytokines and Chemokines on Leptin Production in Human Adipose Tissue In Vitro. Mol Cell Endocrinol (2002) 190(1-2):91–9. doi: 10.1016/s0303-7207(02)00007-2
66. Klatt S, Stangl H, Kunath J, Lowin T, Pongratz G, Straub RH. Peripheral Elimination of the Sympathetic Nervous System Stimulates Immunocyte Retention in Lymph Nodes and Ameliorates Collagen Type II Arthritis. Brain Behav Immun (2016) 54:201–10. doi: 10.1016/j.bbi.2016.02.006
67. Nakai A, Hayano Y, Furuta F, Noda M, Suzuki K. Control of Lymphocyte Egress From Lymph Nodes Through β2-Adrenergic Receptors. J Exp Med (2014) 211(13):2583–98. doi: 10.1084/jem.20141132
68. Grisanti LA, Gumpert AM, Traynham CJ, Gorsky JE, Repas AA, Gao E, et al. Leukocyte-Expressed β2-Adrenergic Receptors Are Essential for Survival After Acute Myocardial Injury. Circulation (2016) 134(2):153–67. doi: 10.1161/circulationaha.116.022304
69. Chang PC, Kriek E, van der Krogt JA, Blauw GJ, van Brummelen P. Stimulation of Norepinephrine Release by Peripheral Presynaptic Beta-Adrenoceptors. Clin Exp Hypertens A (1989) 11 Suppl1:311–21. doi: 10.3109/10641968909045436
70. Goshima Y, Nakamura S, Misu Y. L-Dopa Facilitates the Release of Endogenous Norepinephrine and Dopamine via Presynaptic Beta 1- and Beta 2-Adrenoceptors Under Essentially Complete Inhibition of L-Aromatic Amino Acid Decarboxylase in Rat Hypothalamic Slices. Jpn J Pharmacol (1990) 53(1):47–56. doi: 10.1254/jjp.53.47
71. Ma HL, Blanchet TJ, Peluso D, Hopkins B, Morris EA, Glasson SS. Osteoarthritis Severity Is Sex Dependent in a Surgical Mouse Model. Osteoarthritis Cartilage (2007) 15(6):695–700. doi: 10.1016/j.joca.2006.11.005
Keywords: osteoarthritis, β2-adrenoceptor, subchondral bone, cartilage, synovium, leptin
Citation: Rösch G, Muschter D, Taheri S, El Bagdadi K, Dorn C, Meurer A, Zaucke F, Schilling AF, Grässel S, Straub RH and Jenei-Lanzl Z (2022) β2-Adrenoceptor Deficiency Results in Increased Calcified Cartilage Thickness and Subchondral Bone Remodeling in Murine Experimental Osteoarthritis. Front. Immunol. 12:801505. doi: 10.3389/fimmu.2021.801505
Received: 25 October 2021; Accepted: 22 December 2021;
Published: 13 January 2022.
Edited by:
Koichi Matsuo, Keio University School of Medicine, JapanReviewed by:
Federico Diaz-Gonzalez, University of La Laguna, SpainMarie-Astrid Boutet, U1229 Médecine Régénératrice et Squelette (RMeS)(INSERM), France
Copyright © 2022 Rösch, Muschter, Taheri, El Bagdadi, Dorn, Meurer, Zaucke, Schilling, Grässel, Straub and Jenei-Lanzl. This is an open-access article distributed under the terms of the Creative Commons Attribution License (CC BY). The use, distribution or reproduction in other forums is permitted, provided the original author(s) and the copyright owner(s) are credited and that the original publication in this journal is cited, in accordance with accepted academic practice. No use, distribution or reproduction is permitted which does not comply with these terms.
*Correspondence: Zsuzsa Jenei-Lanzl, enN1enNhLmplbmVpLWxhbnpsQGtndS5kZQ==