 George Georgoulias
 Apostolos Zaravinos
- 1Department of Life Sciences, School of Sciences, European University Cyprus, Nicosia, Cyprus
- 2Cancer Genetics, Genomics and Systems Biology laboratory, Basic and Translational Cancer Research Center (BTCRC), Nicosia, Cyprus
Skin melanoma cells are tightly interconnected with their tumor microenvironment (TME), which influences their initiation, progression, and sensitivity/resistance to therapeutic interventions. An immune-active TME favors patient response to immune checkpoint inhibition (ICI), but not all patients respond to therapy. Here, we assessed differential gene expression in primary and metastatic tumors from the TCGA-SKCM dataset, compared to normal skin samples from the GTEx project and validated key findings across 4 independent GEO datasets, as well as using immunohistochemistry in independent patient cohorts. We focused our attention on examining the expression of various immune receptors, immune-cell fractions, immune-related signatures and mutational signatures across cutaneous melanomas with diverse tumor mutation burdens (TMB). Globally, the expression of most immunoreceptors correlated with patient survival, but did not differ between TMBhigh and TMBlow tumors. Melanomas were enriched in “naive T-cell”, “effector memory T-cell”, “exhausted T-cell”, “resting Treg T-cell” and “Th1-like” signatures, irrespective of their BRAF, NF1 or RAS mutational status. Somatic mutations in IDO1 and HLA-DRA were frequent and could be involved in hindering patient response to ICI therapies. We finally analyzed transcriptome profiles of ICI-treated patients and associated their response with high levels of IFNγ, Merck18, CD274, CD8, and low levels of myeloid-derived suppressor cells (MDSCs), cancer-associated fibroblasts (CAFs) and M2 macrophages, irrespective of their TMB status. Overall, our findings highlight the importance of pre-existing T-cell immunity in ICI therapeutic outcomes in skin melanoma and suggest that TMBlow patients could also benefit from such therapies.
Introduction
Cutaneous melanomas are among the most immunogenic cancers (1), with an increasing incidence rate worldwide (2). They have an increased mutation rate as a result of exposure to UV radiation (2, 3) and are very heterogenous with different mutational subtypes, being mainly sorted according to the mutational status of BRAF, NRAS and NF1 (4–6). Additionally, skin melanomas can be classified across five main immune subtypes; wound healing, IFN-γ dominant, inflammatory, lymphocyte depleted and TGF-β dominant; whereas very few of them are immunologically quiet (7).
The tumor microenvironment (TME) is the ecosystem surrounding a tumor and includes the extracellular matrix, blood vessels and stromal cells. It also encompasses a diverse number of immune cells, such as dendritic cells (DCs), neutrophils, natural killer (NK) cells, T-cells and B-cells, as well as immunosuppressors, including myeloid-derived suppressor cells (MDSCs), regulatory T (Treg) cells, tumor-associated macrophages (TAMs) or cancer-associated fibroblasts (CAFs). All these, constitute an ecosystem where they interact with the tumor cells bidirectionally, modulating the malignant phenotype (8). An immune-active TME has been shown to favor clinical response to immune checkpoint inhibition (ICI) therapies with anti-CTLA-4 and anti-PD-1 mAbs (9–11). The absence of tumor-infiltrating lymphocytes (TILs) in the TME on the other hand, predicts sentinel lymph node metastasis and survival (12). Combination immunotherapy or dual ICI (anti-PD-1 plus anti-CTLA-4) has recently shown impressive response rates in metastatic patients. However, half of them had significant toxicity from the treatment regimen (13, 14).
The tumor’s relationship with immune cells within the TME can remarkably influence cancer cell proliferation, progression, and metastasis (15). This unique immunogenicity renders skin melanoma as a paradigm for tumor-immune interactions and is driven by a high mutational burden (TMB), which can increase the tumor’s probability to generate immunogenic neoantigens, making it easier for the immune system to recognize cancer cells and elicit effective immune responses against them (16–18). Patients with high TMB are also likely to be more responsive to immunotherapy (19, 20). However, despite the promising therapeutic outcome that most ICI therapies provide to metastatic patients, most of them will not respond, exhibiting early (primary) or late (adaptive) resistance and relapse (21).
Here, we delved into the expression of a group of activating and inhibitory immune receptors in the TME of skin melanoma patients with diverse TMB. We also examined immune-related signatures, fractions of immune-cells and mutational signatures across tumors with a low or high TMB. Our results indicate that elevated expression levels of TIGIT, IDO1 and LAG3, other than PD-1, PD-L1/2 and CTLA-4, associate with the patients’ overall and disease-free survival, but not with the TMB, corroborating that immunogenicity in these tumors is affected by other factors as well. In addition, we found that skin melanomas are significantly enriched in the “naive T-cell”, “effector memory T-cell”, “exhausted T-cell”, “resting Treg T-cell” and “Th1-like” signatures, irrespective of their BRAF, NF1 and RAS mutational status. We also show that despite the similar immune-cell fractions between TMBhigh and TMBlow tumors, the first have a higher ratio of M1/M2 macrophages. Our data further support that somatic mutations in IDO1 and HLA-DRA are frequent and could be involved in hindering patient response to ICI therapies. We finally provide evidence that TMB alone is not the best predictor of immunotherapy response and therefore, anti-PD-1/anti-CTLA-4 monotherapy or combination ICI therapy could also be applied to TMBlow patients.
Materials and methods
NGS data extraction and analysis
We extracted whole exome and RNA-seq data from the TCGA-SKCM dataset, containing 461 primary and metastatic skin melanoma samples, in total. All data, including patient clinicopathological information and MAF files, were assessed from GDC Data Portal (https://portal.gdc.cancer.gov/). Apart from one matched blood sample from the TCGA cohort that was used as control, we included normal skin samples from the GTEx project (https://gtexportal.org/) for differential gene expression analysis, totaling to 557 controls. TCGA and GTEx samples were re-aligned to the hg38 genome and were processed using a uniform bioinformatic pipeline, to eliminate batch effects.
Differential gene expression was identified between skin melanoma and matched TCGA normal and GTEx normal skin data, using limma with cut-off |log2FC>2| for upregulation and |log2FC<1| for downregulation, along with adjusted p<0.05. The B-statistic was used to sort the differentially expressed genes. We then performed Gene Ontology (GO) enrichment analysis for the top 250 up- and down-regulated genes in primary (or metastatic) skin melanomas, respectively, using Enrichment Analysis Visualization Appyter. Similar gene sets from GO analysis were clustered together using Uniform Manifold Approximation and Projection (UMAP) (22) and the significantly enriched (adjusted p<0.05) GO terms for biological processes (GO-BP), molecular function (GO-MF) and cellular component (GO-CC) were highlighted.
We focused on the expression of some well-known immune checkpoints, including PD-1, PD-L1/2, CTLA-4, TIGIT, IDO1/2 and other prospective immunoreceptors (LAG3, VTCN1, VISTA, ILT2 and ILT4). To calculate each gene’s expression, we used one-way ANOVA, and the disease state (skin melanoma or matched TCGA normal and GTEx normal skin samples) as variable to calculate differential expression. The expression data were first log2(TPM+1) transformed for differential analysis and the |log2FC| was defined as median (skin melanoma) - median (matched TCGA normal and GTEx samples), as explained before (23, 24).
Validation of deregulated genes using independent GEO datasets
Four independent studies from the Gene Expression Omnibus (GEO) repository were analyzed for subsequent validation of the top deregulated genes in primary (or metastatic) melanomas against their adjacent normal skin samples, or between primary and metastatic melanomas, depending on the study. In specific, we obtained microarray data from the studies with the following GEO accession numbers: GSE8401, containing 31 primary and 52 metastatic melanomas (25, 26); GSE7553, 2 in-situ melanomas, 14 primary, 40 metastatic melanomas and 4 normal skin samples (27); GSE46517, 31 primary, 73 metastatic melanomas and 7 normal skin samples (28); and GSE15605, composed of 46 primary and 12 metastatic melanomas, as well as 16 normal skin samples. Data were analyzed using limma with vooma transformation in R (29). P-values were adjusted using Benjamini & Hochberg (FDR) and the significance threshold was set at p<0.05. The top 250 differentially expressed genes (ranked by p-value) were obtained either between primary and metastatic melanomas, or between each of those and their corresponding normal skin samples. UMAP, boxplots, and expression density plots were retrieved to assess normalization status and sample groupings. Volcano plots and mean difference (MD) plots were used to visualize differentially expressed genes. Adjusted p-value histograms were generated using hist to view the distribution of the p-values in the analysis results. Moderated t-statistic quantile-quantile (q-q) plots were used to check the variation in the data.
Immune-related gene signatures
We compared immune-related gene signatures between cutaneous melanoma and control samples (matched TCGA and GTEx normal data), as well as between BRAF hotspot mutants (BRAFmut, n=147), NF1 mutants (NF1mut, n=27), RAS hotspot mutants (RASmut, n=91) and triple-wild type (TripleWT, n=47) tumors, using GEPIA2 (30). The signatures were specific for naive T-cells (CCR7, LEF1, TCF7 and SELL); effector T-cells (CX3CR1, FGFBP2 and FCGR3A); effector memory T-cells (PDCD1, DUSP4, GZMK, GZMA and IFNG); central memory T-cells (CCR7, SELL and IL7R); resident memory T-cells (CD69, ITGAE, CXCR6 and MYADM); exhausted T-cells (HAVCR2, TIGIT, LAG3, PDCD1, CXCL13 and LAYN); resting Tregs (FOXP3, IL2RA); effector Tregs (FOXP3, CTLA-4, CCR8 and TNFRSF9); and Th1-like cells (CXCL13, HAVCR2, IFNG, CXCR3, BHLHE40 and CD4). The |log2FC>1| and p<0.01 (ANOVA) were used to assess differences with statistical significance between groups. Principal component analysis (PCA) was used to automatically perform dimensionality reduction on data from the TCGA-SKCM dataset and normal suprapubic skin (not exposed to the sun), based on the expression of these signatures in the samples. The expression of specific immune-checkpoints was also explored individually across the different molecular or immune subtypes (C1, wound healing; C2, IFN-gamma dominant; C3, inflammatory; C4, lymphocyte depleted; C5, immunologically quiet; C6, TGF-b dominant) (7).
Commutation analysis and comparison of immunostimulators and immunoinhibitors between TMBhigh and TMBlow tumors
We used iCoMut Beta 0.21 for FireBrowse to categorize skin melanomas into three TMB subgroups, based on the mutational distribution quartiles. The lower quartile contained tumors with a low mutation rate, i.e., <7.4 synonymous and non-synonymous (total) mutations/Mb or <5.14 non-synonymous mutations/MB (also termed as “TMBlow”). The upper quartile involved tumors with an increased rate of mutation, i.e., >30 total mutations/Mb or >20 non-synonymous mutations/MB (“TMBhigh”). Among the TMBhigh subgroup, 18 tumors with >81 total mutations/Mb were considered as “extremely hypermutated”. The rest 50% of samples was termed “TMB-intermediate” (TMBint, >7.42 & <30 total mut/Mb). Tumor stratification based on their TMB (synonymous and non-synonymous mutations) was also reflected on their neoantigen burden, being significantly higher among TMBhigh tumors (68,263 neoantigens, 734.5 ± 695.7; median ± SD) versus TMBint (34,473 neoantigens, 211 ± 151.2) and TMBlow tumors (4,929 neoantigens 57 ± 52.3). Maftools (31) was also used to compare oncoplots between TMBhigh and TMBlow tumors.
The mutation rate was then correlated with the expression of either activating or inhibitory immune receptors within each TMB subgroup. In specific, we compared the expression of 49 immunostimulators (BTNL2, C10orf54, CD27, CD274, CD276, CD28, CD40, CD40LG, CD48, CD70, CD80, CD86, CXCL12, CXCR4, ENTPD1, HHLA2, ICOS, ICOSLG, IL2RA, IL6, IL6R, KLRC1, KLRK1, LTA, MICA, MICB, NT5E, PDCD1LG2, PVR, RAET1E, TMEM173, TMIGD2, TNFRSF13B, TNFRSF13C, TNFRSF14, TNFRSF17, TNFRSF18, TNFRSF25, TNFRSF4, TNFRSF8, TNFRSF9, TNFSF13, TNFSF13B, TNFSF14, TNFSF15, TNFSF18, TNFSF4, TNFSF9 and ULBP1) and 23 immunoinhibitors (ADORA2A, BTLA, CD160, CD244, CD96, CSF1R, CTLA4, HAVCR2, IDO1, IL10, IL10RB, KDR, KIR2DL1, KIR2DL2, KIR2DL3, LAG3, LGALS9, PDCD1, PVRL2, TGFB1, TGFBR1, TIGIT and VTCN1) across TMBhigh, TMBint and TMBlow melanoma tumors.
Mutational signatures and cancer driver genes
We extracted and analyzed single base substitutions (SBS) and doublet base substitutions (DBS) using SigProfiler’s MatrixGenerator and Extractor, as previously described in detail (32, 33). SBS signatures were identified using 96 different contexts, considering also the bases 5’ and 3’ from the mutated base. DBS signatures were generated after the concurrent modification of two consecutive nucleotide bases (34). The extracted mutational signatures were then compared against the ones found in COSMIC v3.2 (https://cancer.sanger.ac.uk/signatures/). Each signature’s contribution was calculated separately for primary and metastatic skin melanomas. Cancer driver mutations were identified using IntOGen (35).
Cell-type fractions
We analyzed each tumor’s cell type fraction by extracting data from the Cancer Immunome Database (TCIA) (36). The absolute values and the quanTIseq computational pipeline were used to quantify tumoral immune contexture (37), focusing on B cells, M1/M2 macrophages, neutrophils, monocytes, NK cells, non-regulatory CD4+ and CD8+ T cells, regulatory CD4+ T cells (Tregs) and dendritic cells.
Immunohistochemistry and evaluation of TIL load
An independent cohort of 11 skin melanoma samples from the Human Protein Atlas (https://www.proteinatlas.org/) (38) and tissue microarrays (TMAs), containing 40 cases of malignant melanoma, plus 30 adjacent normal skin tissue and 10 skin tissue (ME803b, US Biomax, Inc.) were used to validate protein expression using IHC and evaluate the TIL load with hematoxylin and eosin (H&E) staining. In brief, FFPE sections (4μm) were heated at 50°C overnight. Then, they were deparaffinized in xylene and rehydrated in graded ethanol to distilled water. During hydration, a 5 min blocking for endogenous peroxidase was done in 0.3% H2O2 in 95% ethanol. Prior to immunostaining, the sections were immersed in 10mM citrate buffer (pH 6.0), rinsed in Tris-buffered saline (TBS) and subjected to heat-induced epitope retrieval (HIER) using a pressure boiler. Sections were then incubated overnight at 4°C with mouse monoclonal antibodies (mAbs) against IDO1 (1:150, Sigma-Aldrich Cat# HPA023149, RRID : AB_1846221), PD-1 (1:250, Sigma-Aldrich Cat# HPA035981, RRID : AB_10669664), PD-L1, a marker specific for T-cells, B-cells and tumor cells (1:50 dilution, clone 22C3, Dako, CA), LAG3 (1:15, Sigma-Aldrich), the cytotoxic T-cell markers CD8A The image used in Figures 1-3 has part labels; however, the description is missing in the caption. Could you clarify this? Provide revised files if necessary.and CD8B (CDA, 1:400 dilution, clone C8/144B, Dako, CA; CD8, 1:100, Sigma-Aldrich Cat# HPA029164), and the Treg-specific marker FOXP3 (1:200 dilution, clone 236A/E7, ThermoFischer Scientific). The UltraVision LP HRP polymer®, Ultra V Block and DAB quanto substrate system® (Thermo scientific, CA) were used for detection. Finally, slides were rinsed in tap water, counterstained with hematoxylin, dehydrated in grade ethanol and coverslipped. Slides were then independently assessed by two observers. Sections of hyper-reactive tonsils were used as positive controls for anti-PD-L1 and anti-CD8 staining and preimmune rabbit serum as a negative control for nonspecific staining. Protein staining was scored as 2+ (high (>75% positive cells) or medium (50-75% positive cells) staining), l+ (low staining, 5-25% positive cells) and 0 (staining not detected or <5% positive cells) with strong, medium, weak or negative intensity. The percentage (%) of TILs (200x magnification) in the was also scored. Slide scanning was performed on a VENTANA iScan HT slide scanner v1.1.1 (Roche).
Somatic mutations in the IFN-γ gene expression signature and immune checkpoint genes
We evaluated gene expression along with the detection of SNVs and Indels across an IFN-γ-related signature, composed of IDO1, CXCL10, CXCL9, HLA-DRA, STAT1 and IFNG (39). We also assessed somatic mutations in the IFN-γ pathway genes IFNGR1/2, JAK1/2 and IRF1, as well as across BRAF, NRAS, NF1, PTEN and B2M in the TCGA-SKCM dataset. The analysis of somatic mutations was performed using MuTect2 Variant Aggregation and Masking (v.4.1) and gene expression was measured in log2(FPKM-UQ+1) values using the UCSC Xena platform (40). MuPIT Interactive (http://mupit.icm.jhu.edu/) was used to map the SNVs on the crystal structure of each protein, in 3D (hg38).
Detection of immunophenoscores
We calculated IPS scores in TMBhigh and TMBlow tumors (ranging from 0-10) based on the expression of immunomodulators, effector T-cells, effector memory T-cells and immunosuppressors. Their immunophenotypes were visualized using immunophenograms, as previously described (41, 42).
Patient response to immunotherapy
Tumor Immune Dysfunction and Exclusion (TIDE, http://tide.dfci.harvard.edu/) (43, 44) was used to predict patient response to anti-PD1 or combined anti-PD-1 and anti-CTLA-4 therapy across seven independent skin melanoma datasets (Van Allen et al., 2015 (45), Hugo et al., 2016 (GSE78220) (41), Nathanson et al., 2017 (46), Prat et al., 2017 (GSE93157) (47), Lauss et al., 2017 (GSE100797) (48), Riaz et al., 2017 (GSE91061) (49) and Gide TN, et al., 2019 [PRJEB23709) (50)]. Pre-treatment melanoma tumor expression profiles of patients (log2(TPM+1) values) were downloaded and normalized towards the control samples. Each gene was normalized by subtracting the expression value in the reference control samples. Higher TIDE values indicate that the patient has higher potentials of tumor immune evasion and is, therefore, less likely to benefit from the corresponding immune-checkpoint blockade. The IFNG values indicate the IFNγ response biomarkers of IFNγ, ACAT1, IDO1, CXCL10, CXCL9 and HLA-DRA. From the analysis we also deduced the expression of CD274 (PD-L1), the average expression from CD8A and CD8B genes, the levels of cytotoxic T-lymphocytes, each patient’s dysfunction of the tumor, exclusion potential of the tumor, as well as the Pearson’s correlation between gene expression and MDSCs, CAFs and M1/M2 TAMs.
Statistical analysis
Differences in gene expression between high and low activating (or inhibitory) immune receptor-expressing tumors or between TMBhigh and TMBlow tumors, were assessed using the nonparametric Mann-Whitney test. Gene expression (log2(TPM+1) values were profiled using violin plots across different pathological stages of the tumors. Multivariate analysis of variance (MANOVA) with the F statistic was used to estimate differences across the different stages. We used Kaplan-Meier curves to plot overall and disease-free survival in patients with high or low expression of immune checkpoints or different multi-gene signatures, using the median expression as cut-off. The log-rank test with HR and 95% CI was used for analysis. Adjusted p-values <0.05 were considered statistically significant. Correlations between each patient’s TIL or TMB load and the expression of immune receptors were assessed using Pearson’s test. All statistical analyses were performed using GraphPad Prism v9.0.0.121. Clusters of similar GO terms were computed using the Leiden algorithm (51) and points were plotted on the first two UMAP dimensions using BokehJS 2.3.2.
Results
Deregulated genes and functional analysis in skin melanoma
We initially detected the significantly deregulated genes, having a broad distribution across all chromosomes, in primary and metastatic skin melanoma (Table S1), and focused on the top 250 up-/down-regulated genes within each subgroup. The upregulated genes in primary melanomas were enriched in regulation of immune response; cytokine-mediated signaling pathway; antigen receptor-mediated signaling pathway; cellular response to interferon-gamma; regulation of T cell proliferation; regulation of T cell activation; T cell receptor signaling pathway; positive regulation of lymphocyte proliferation; positive regulation of T cell activation; and cellular response to cytokine stimulus (GO-BP), in MHC class II receptor activity; MHC class II protein complex binding; CXCR3 chemokine receptor binding; chemokine activity; and cytokine receptor activity (GO-MF), as well as in MHC class II protein complex; T cell receptor complex; lumenal side of endoplasmic reticulum membrane; and integral component of lumenal side of endoplasmic reticulum membrane, among other GO-CC terms (Table S2 and Figure S1).
On the other hand, the top 250 down-regulated genes were enriched in regulation of extrinsic apoptotic signaling pathway; positive regulation of protein localization to cell periphery; maintenance of protein location in nucleus; response to cytokine; positive regulation of protein localization to plasma membrane; regulation of protein localization to plasma membrane; ribosome biogenesis; and positive regulation of NF-kappaB transcription factor activity, among other GO-BP terms. They were also enriched in cytoskeleton-nuclear membrane anchor activity; chloride channel inhibitor activity; nucleoside-diphosphatase activity; chloride channel regulator activity, among other GO-MF terms, as well as in (cytosolic) large ribosomal subunit; melanosome membrane; and chitosome; pigment granule membrane, among other GO-CC terms (Table S3 and Figure S2).
Among metastatic melanomas, the upregulated genes were enriched in regulation of immune response; cytokine-mediated signaling pathway; antigen receptor-mediated signaling pathway; cellular response to interferon-gamma; regulation of T cell proliferation; regulation of T cell activation; and T cell receptor signaling pathway, among other GO-MF terms. Similar to primary tumors, they were also enriched in MHC class II receptor activity; MHC class II protein complex binding; MHC protein binding; CXCR3 chemokine receptor binding; chemokine activity; and cytokine receptor activity, among other GO-MF terms, as well as in MHC protein complex; MHC class II protein complex; T cell receptor complex; lumenal side of endoplasmic reticulum membrane; and integral component of lumenal side of endoplasmic reticulum membrane, among other GO-CC terms (Table S4 and Figure S3).
Finally, the top 250 down-regulated genes in metastatic melanomas were enriched in the same GO terms as in the primary tumors (Table S5 and Figure S4). Key findings were also validated across four independent GEO datasets (GSE8401, GSE7553, GSE46517 and GSE46517). The top 250 deregulated genes in each dataset were mainly enriched in the GO-BP terms epidermis & skin development, keratinocyte & epidermal cell differentiation, among others.
High expression of immune-checkpoints associates with the TIL load and can be used as a prognostic marker in melanoma
Focusing on immune checkpoints, we found higher expression for PD-1, PD-L1, CTLA-4, IDO1, LAG3, HAVCR2, TIGIT and ILT4, as well as for CD8 in skin melanomas against the normal samples, reflecting the immunosuppressive TME in these tumors. On the other hand, VISTA and VTCN1 were downregulated in skin melanoma, whereas, IDO2, PD-L2 and ADORA2A did not differ between melanomas and normal samples (Figure 1). Interestingly, the expression of CD8 and the given immunoreceptors, did not differ stage-wise (Figure S5).
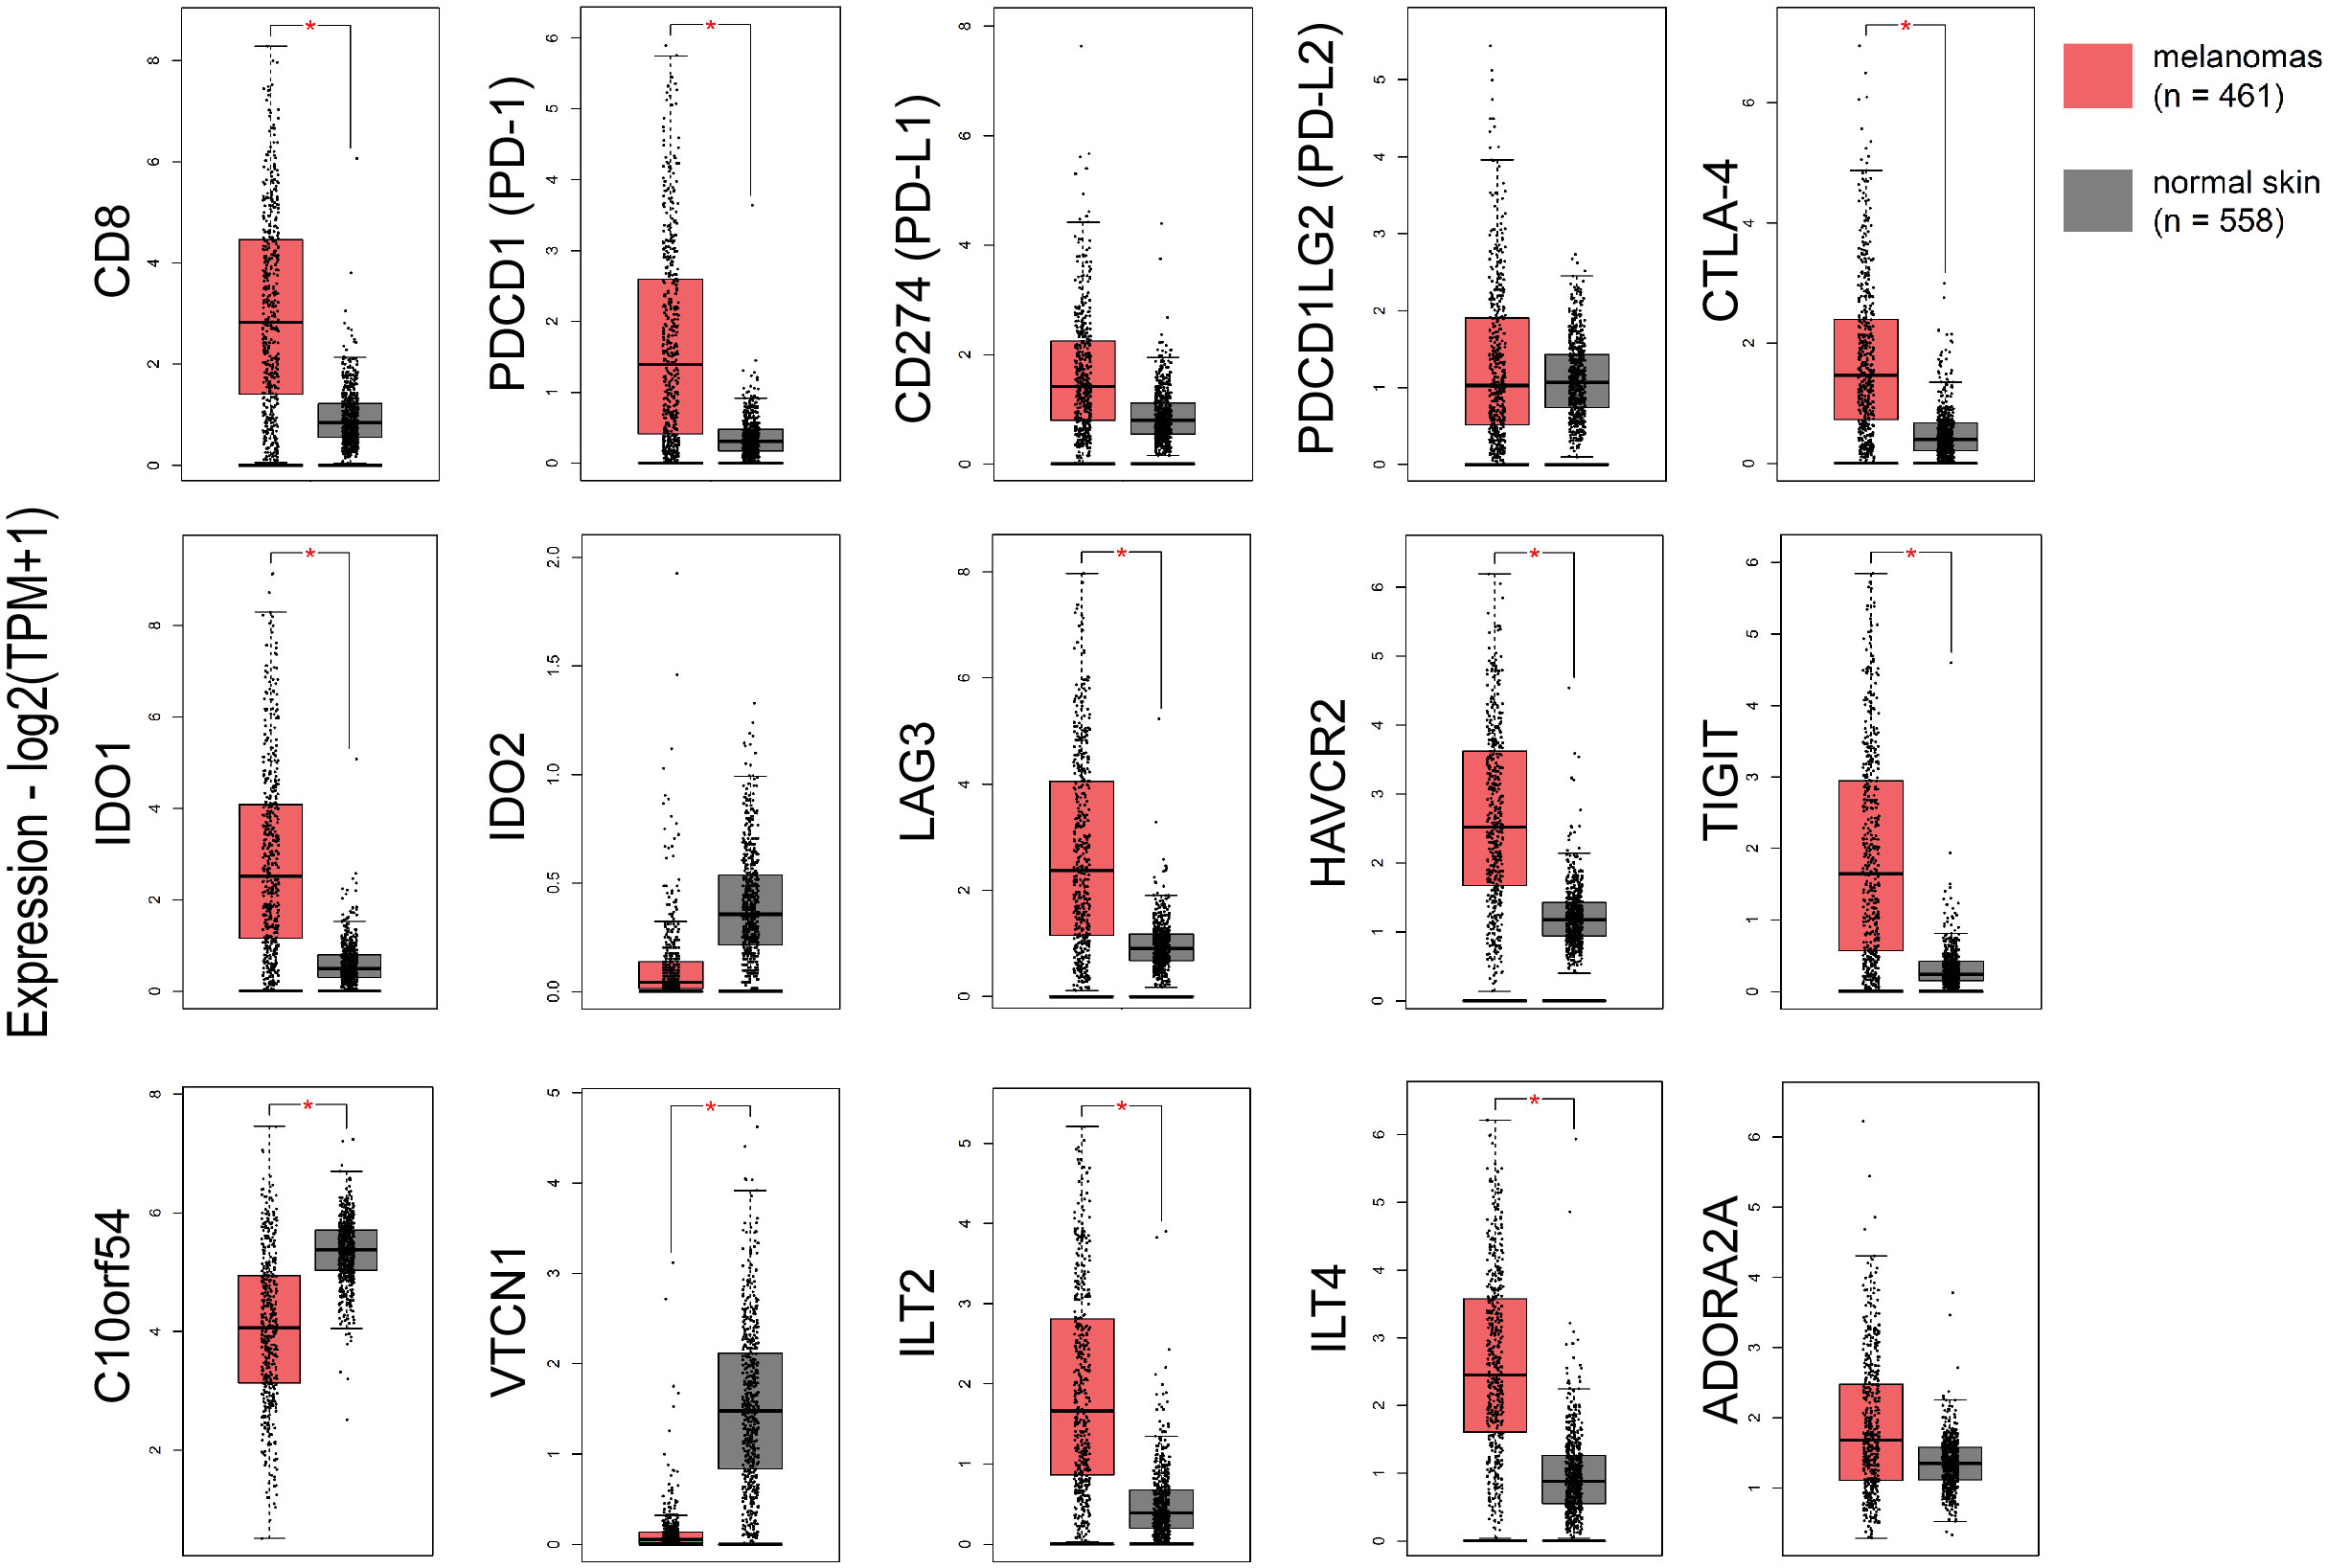
Figure 1 The expression of CD8, PD-1, CTLA-4, IDO1, LAG3, HAVCR2, TIGIT, ILT2 and ILT4 was significantly higher in skin melanomas; whereas, C10orf54 (VISTA) and VTCN1, were expressed at markedly lower levels in the tumor samples compared to normal skin samples. Red asterisks (*) denote significant differences (|log2FC>1| and p<0.01) between skin melanomas from the TCGA-SKCM dataset and matched normal samples from TCGA and GTEx. One-way ANOVA, using disease state (skin melanoma or normal sample) was used to calculate differential expression. The expression data were first log2(TPM+1) transformed for differential analysis and the log2FC was defined as median (skin melanoma) - median (normal skin).
In addition, skin melanoma patients expressing highly CD8, PDCD1, CD274, PDCD1LG2, CTLA-4, C10orf54 (VISTA), LAG3, HAVCR2, TIGIT, ILT2, ILT4, ADORA2A, IDO1 and IDO2 had better overall survival versus low-expressing patients. What’s more, patients with higher levels of CD8, VISTA, PD-L2, LAG3, ADORA2A, IDO1, IDO2 and ILT2 had markedly improved disease-free survival, suggesting that their expression can be used as a prognostic marker, with high levels being favorable in melanoma (Figure S6).
The TIL load is a predictive biomarker for patient response to anti-PD1/PD-L1 immunotherapy (52). We hypothesized that TILs associate with the expression of further immune checkpoints in the TME. To verify this assumption, we conducted Pearson’s correlation test with the expression of 11 immune receptors and found that, similar to other cancers (53, 54), the TIL load significantly correlates with TIGIT (r=0.503, p=0.05), IDO1 (r=0.545, p=0.037), LAG3 (r=0.589, p=0.023) and ADORA2A (r=0.589, p=0.037) in skin melanomas, irrespective of their mutation rate.
Furthermore, CD274 (PD-L1) expression correlated significantly with the rest immune checkpoints (apart from VTCN1) in skin melanoma compared to normal skin (not exposed to the sun), especially with PD-L2, ILT2, HAVCR2 and TIGIT (Figure S7A). This finding supports previous evidence that immune response is driven by different immunosuppressive mechanisms within the TME in skin melanoma, which could be tackled using combination immunotherapies, especially in metastatic patients (55, 56). Adding to that, CD8A expression correlated significantly with CD274, PDCD1, PDCD1LG2, IDO1, LAG3, ILT2, HAVCR2, TIGIT, ADORA2A and ILT4 expression in the tumor compared to unexposed normal skin, reiterating that CD8 expression is of paramount significance for a successful response to ICI therapies (57, 58) (Figure S7B).
Immune-signatures are activated in skin melanomas irrespective of their molecular subtype
Recent evidence shows that immune signatures are associated with disease prognosis. We thus, investigated 9 immune-related gene signatures in skin melanoma against the normal counterparts, and found a significant enrichment in the “naive T-cell”, “effector memory T-cell”, “exhausted T-cell”, “resting Treg T-cell” and “Th1-like” gene signatures. Naïve T cells are precursors for effector and memory T cell subsets (59). Exhausted T cells are dysfunctional and arise during chronic infection and cancer. Their state is defined by poor effector function, sustained expression of inhibitory receptors and a transcriptional state distinct from that of functional effector or memory T cells (60). Resting Treg cells differentiate as activated Tregs after the antigen exposition (61), whereas, Th1-like cells play a role on inflammatory and autoimmune disorders (62).
On the other hand, the “effector T-cell”, “resident memory T-cell”, “central memory T-cell” and “effector Treg T-cell” signatures did not differ significantly between melanoma and normal samples, despite being higher in the former. Effector T-cells steer the immune responses to execute immune functions. While they were initially found to promote immunity, recent studies unraveled negative regulatory functions of effector T-cells in modulating adaptive, but also innate immunity (63). Resident memory T-cells are critical for maintaining antitumor immunity (63), whereas central memory T-cells mediate a faster, stronger, and more effective response to secondary challenge from a pathogen, compared to naive T-cells. As for Treg cells, they are quite heterogeneous with distinct phenotypical and functional subsets. Naïve-like thymus-derived Tregs, once stimulated, can differentiate into effector Tregs and migrate to peripheral tissues to control immune homeostasis (64). Interestingly, none of the above immune signatures differed between BRAFmut, NF1mut, RASmut and TripleWT tumors (Figure S8). In addition, PCA analysis for the “effector memory T-cell” and “naïve T-cell” signatures discriminated best skin melanomas from the non-sun-exposed (suprapubic) normal skin (Figure 2). Collectively, these findings strongly suggest the activation of several immune-related gene signatures in skin melanoma, irrespective of its molecular subtype, reflecting their link with the disease prognosis.
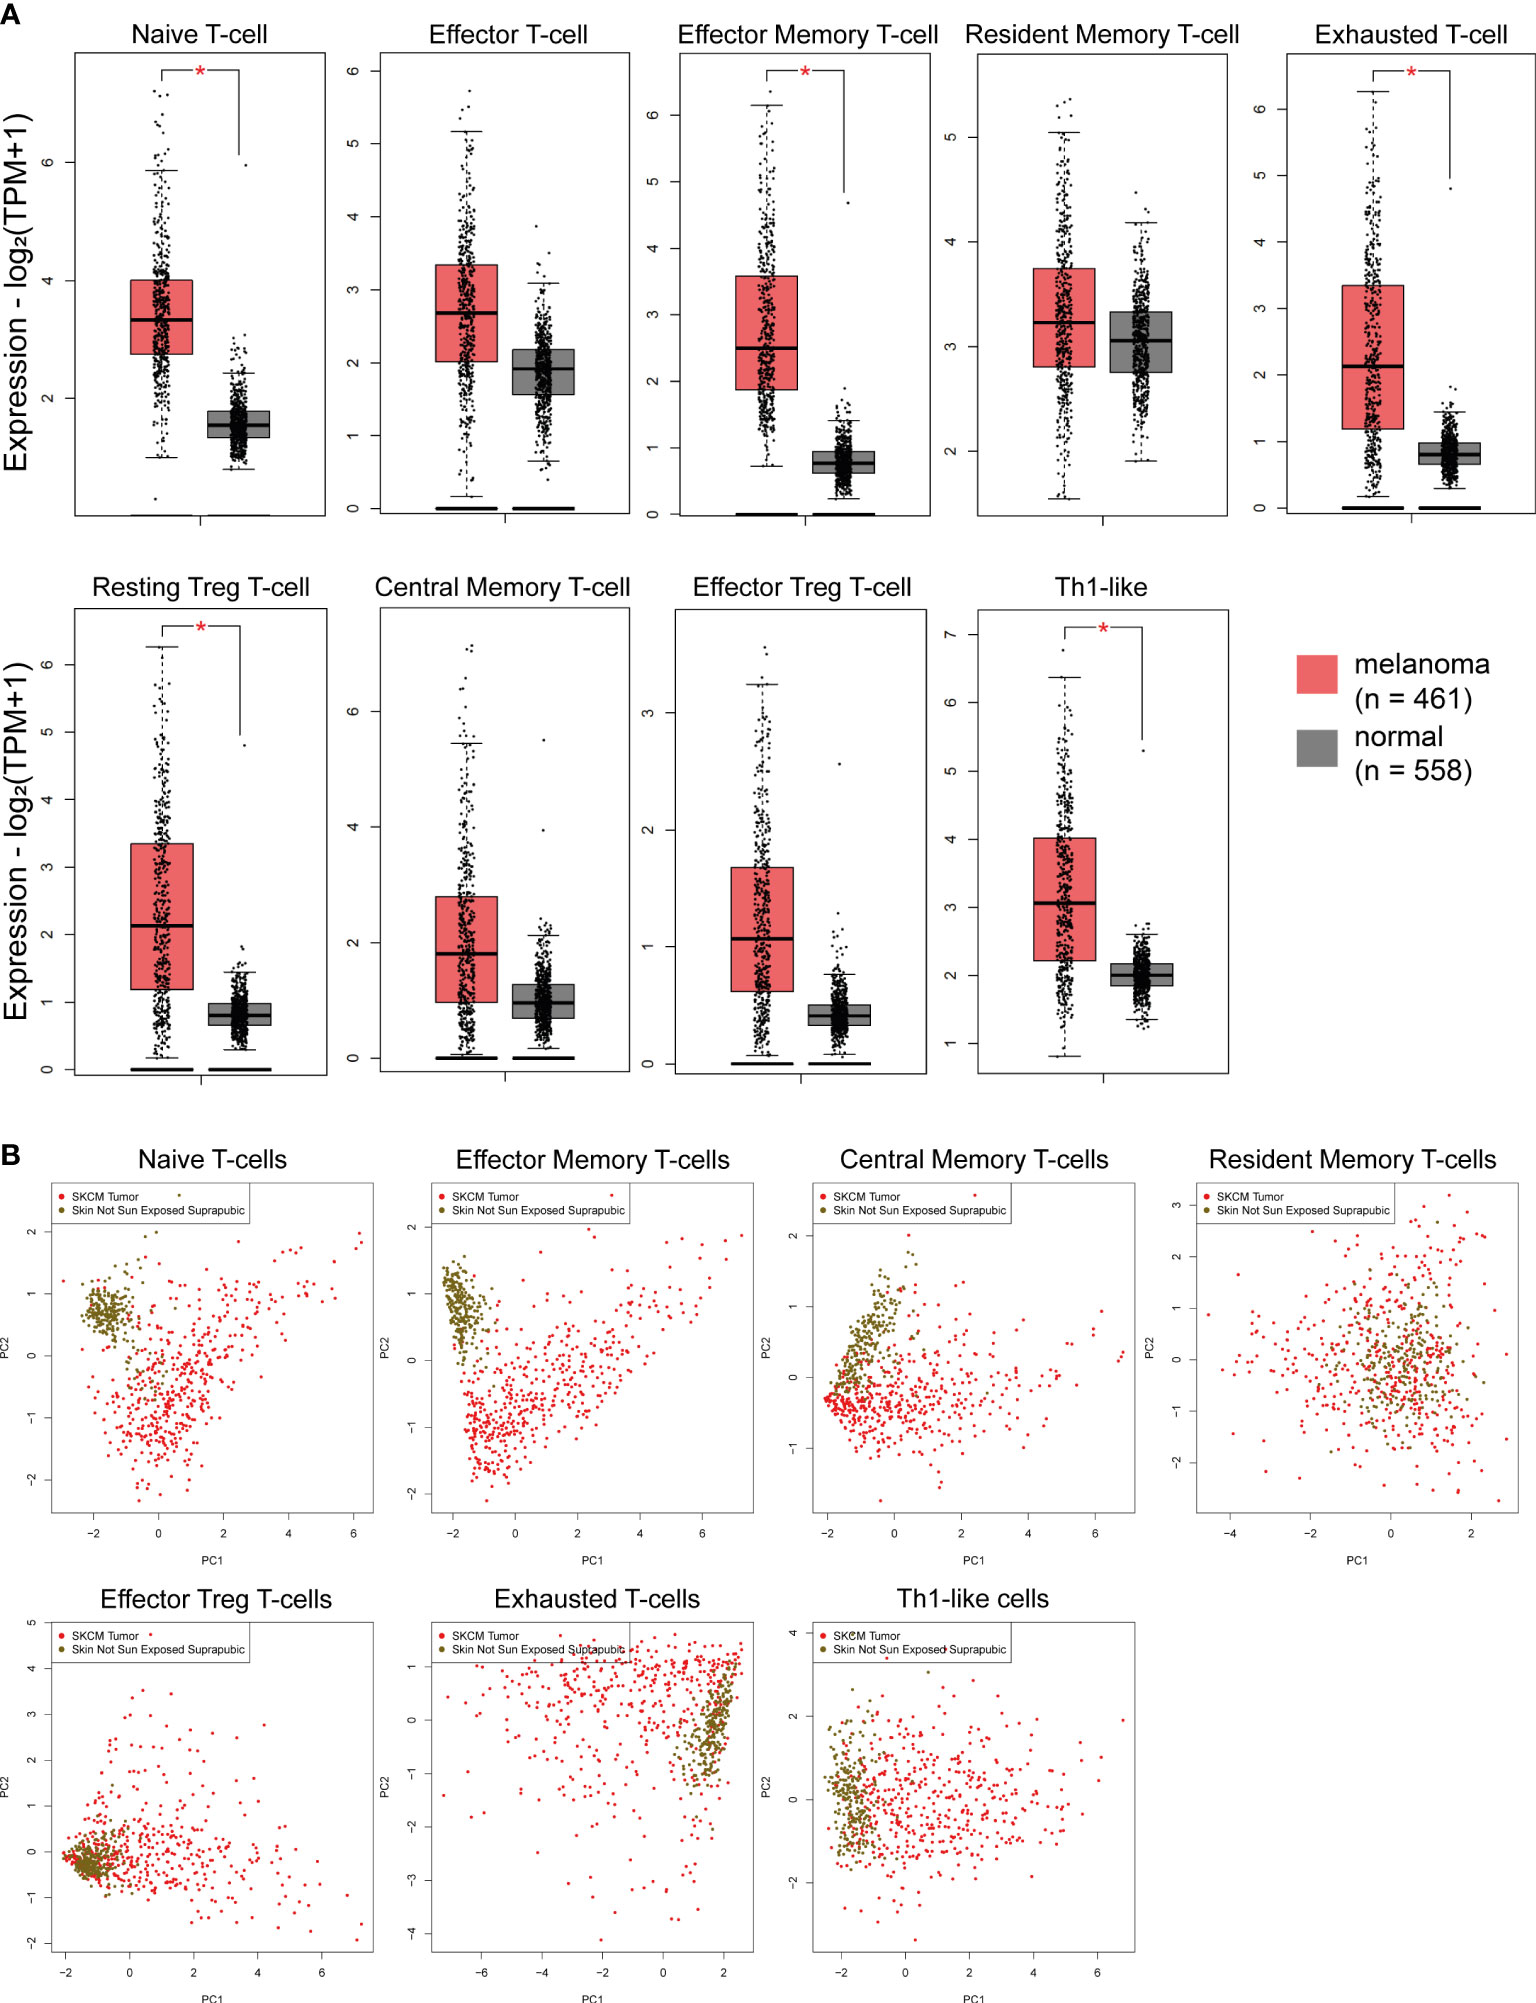
Figure 2 (A) Immune-related signatures being upregulated in skin melanomas. The “naïve T-cell”, “effector memory T-cell”, “exhausted T-cell”, “resting Treg T-cell” and “Th1-like” signatures discriminated best skin melanomas (TCGA-SKCM) from the non-sun-exposed (suprapubic) normal skin (GTEx). Asterisks (*) denote significant differences |Log2FC|>1 and p-value<0.01. (B) PCA dimensionality reduction on skin melanoma samples and normal skin tissue not exposed to the sun, based on the expression of each signature.
Mutational signatures causing high TMB associate with UV light exposure and ageing in melanoma
Skin melanoma patient stratification based on their mutation rate revealed that tumors with >30 mutations/Mb had a different mutational signature profile from those having <7.42 mutations/Mb. The former group was mainly characterized of (C/T)p*Cp(C/G)>T and (C/T)p*Cp(A/G)>T mutations, whereas the latter, of transversions, A>G and (A/G)p*C>T mutations (Figure 3). We further analyzed the single-base substitution (SBS) profiles and decomposed each signature to its components and the different percentages of contribution for each of these. As expected, we found that (both primary and metastatic) melanomas were mainly characterized of signatures SBS7a/b (exposure to UV light), SBS1 (spontaneous deamination of 5-methylcytosine; clock-like), SBS5 (clock-like) and SBS10b (POLE/POLD1 mutations). Interestingly, we found a primary tumor to associate with SBS4 (tobacco smoking) and a metastatic tumor to associate with SBS17b. The latter signature is of unkown aetiology, but previous studies have associated it with 5FU chemotherapy treatment and to damage inflicted by reactive oxygen species (65). As expected, we found ~3.6-times higher number of SBSs among metastatic tumors compared to primary ones (121,175 vs 33,796 SBSs). The mutational signatures exhibiting the highest contribution in primary tumors, were SBS7b (17,220 mutations; 51.9%) SBS7a (13,873 mutations; 41.8%), SBS1 (1,408 mutations; 4.2%) and SBS5 (640 mutations; 1.9%), followed by a small contribution in SBS4 (46 mutations; 0.1%), SBS17b (603 mutations; 0.5%) and SBS7d (6 mutations; 0%). Metastatic tumors on the other hand, were enriched in SBS7b (60,043 mutations; 49.5%) SBS7a (50,904 mutations; 42%), SBS1 (4,124 mutations; 3.4%) and SBS10b (3,823 mutations; 3.2%), followed by a small contribution in SBS5 (1,321 mutations; 1.1%), SBS17b (603 mutations; 0.5%) and SBS17a (357 mutations; 0.3%) (Figures 4A–C). Most of these SBSs were previously reported in skin melanoma and their mutational processes are known to cause a high TMB and hypermutation (32, 42, 66–69). As regards POLE/POLD1 mutated tumors (SBS10b), they have been shown to have a higher number of neoantigens and infiltrating lymphocytes (70).
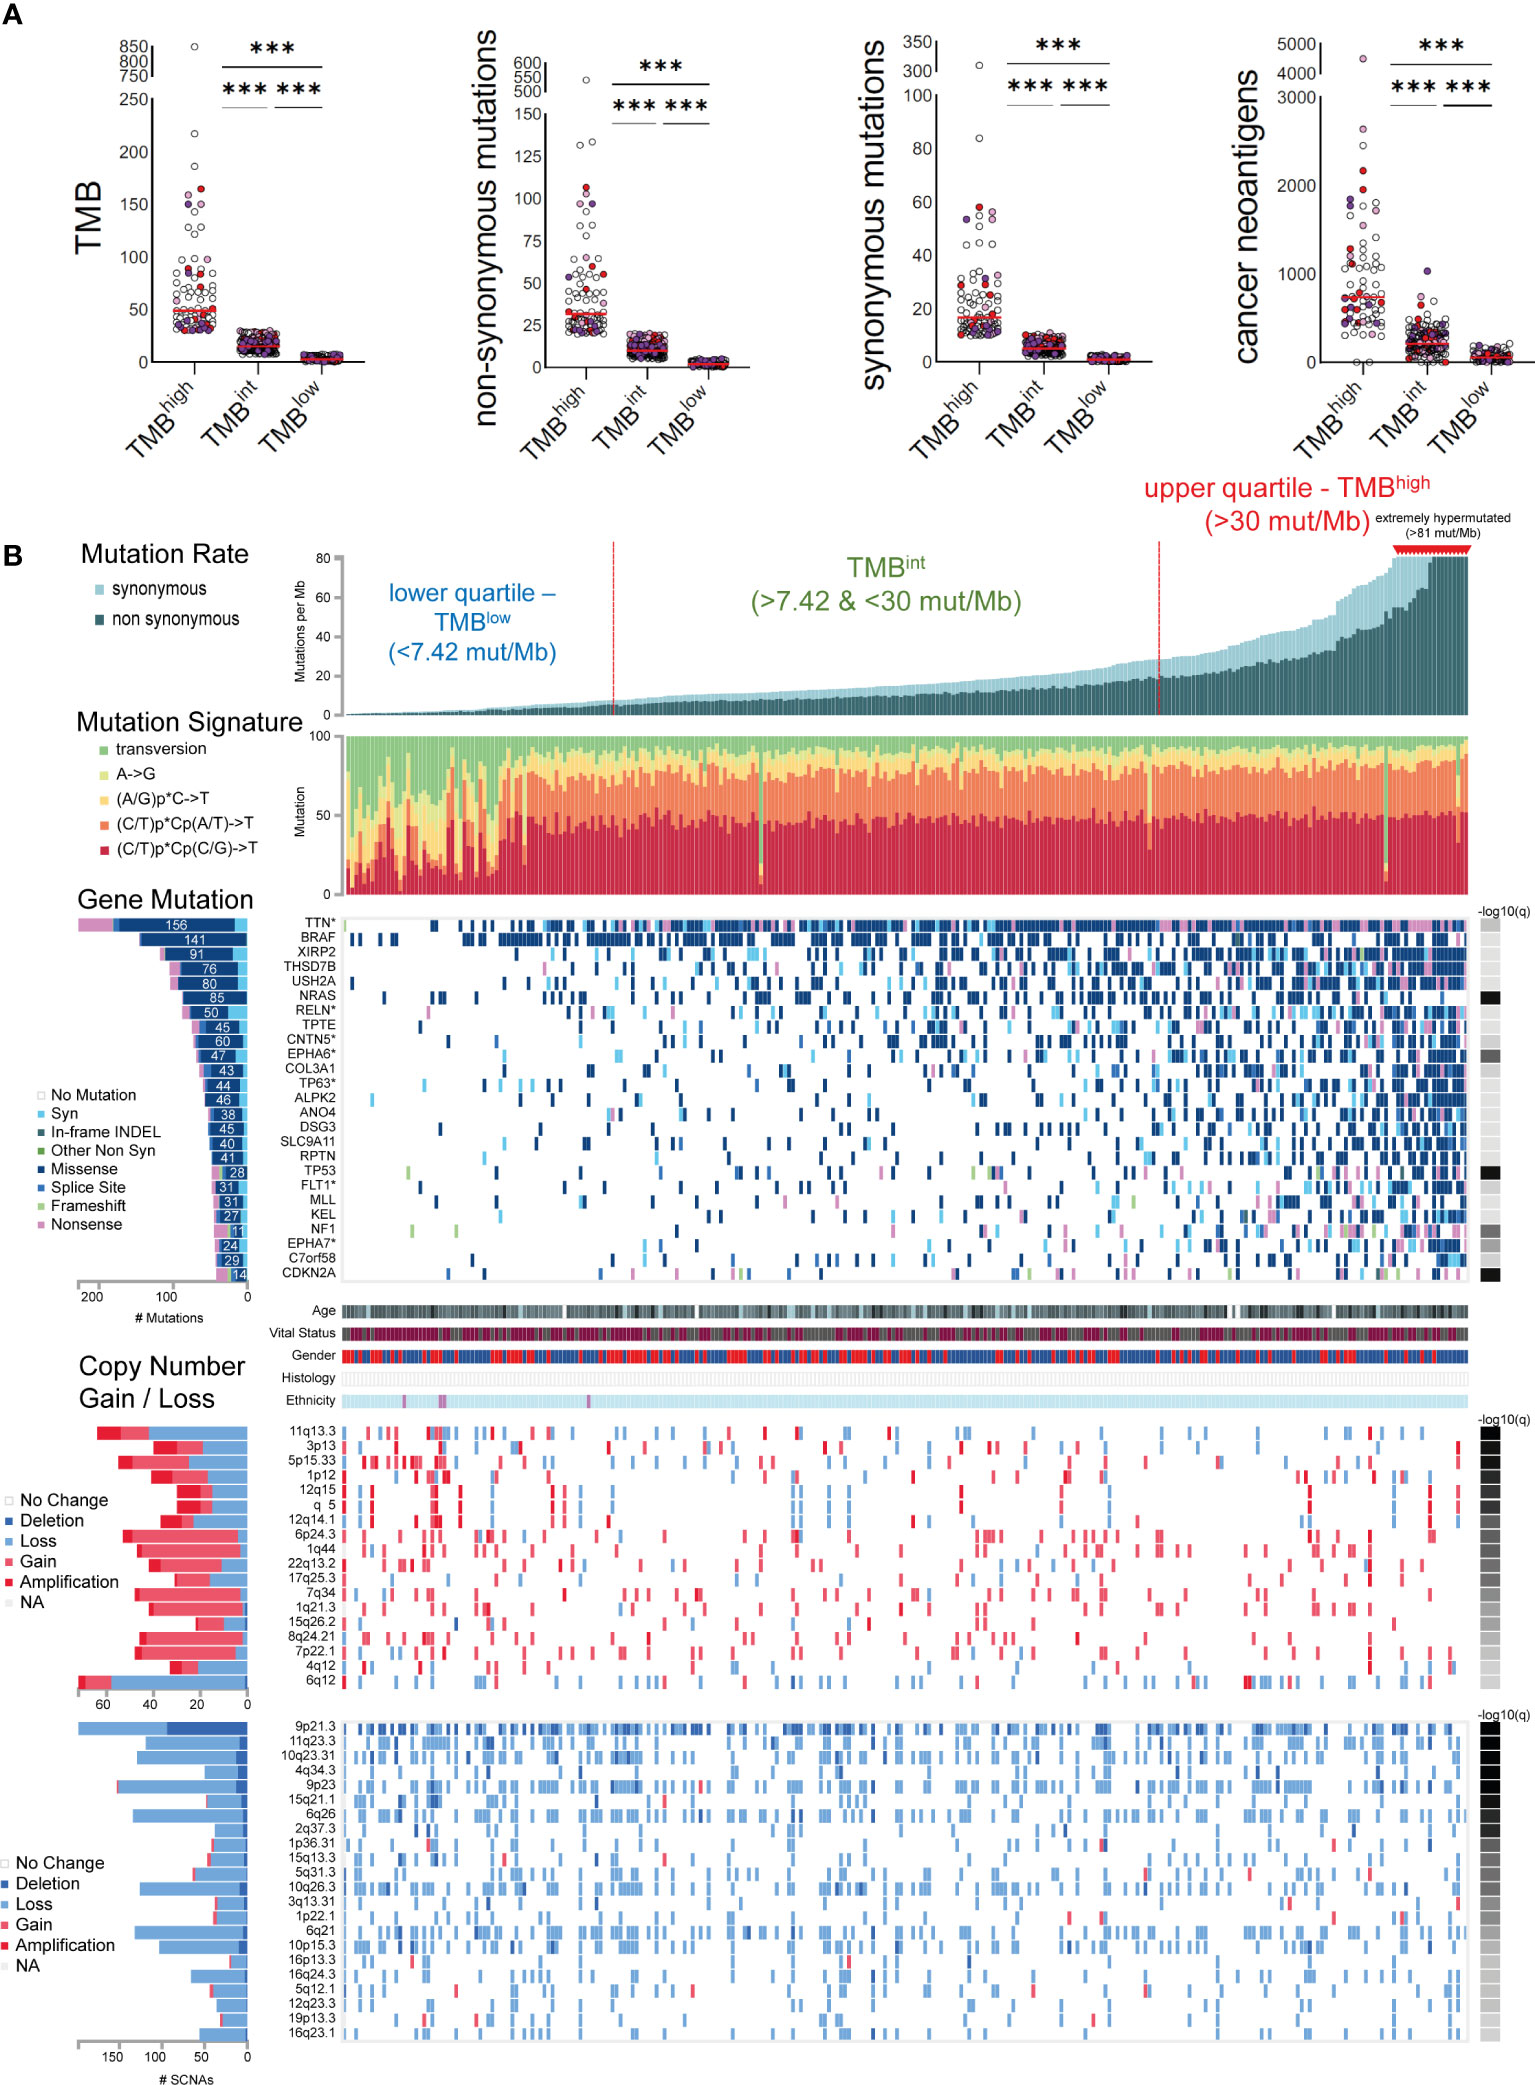
Figure 3 (A) Skin melanomas were stratified into upper and lower quartiles. The upper quartile includes TMBhigh tumors (>30 total mutations/Mb), among which some were extremely hypermutated (>81 total mutations/Mb); whereas the lower quartile contains TMBlow tumors (<7.4 total mutations/Mb). Tumors in-between were classified as TMB intermediate (TMBint). The scatterplots in the upper part show the total number of mutations (TMB), non-synonymous and synonymous mutations, as well as cancer neoantigens per TMB subgroup. Melanoma samples overexpressing CD274 (PD-L1) (>2.44 log2(TPM+1)) and CTLA4 (>3.089 log2(TPM+1)) are highlighted in red and purple color, respectively. Samples overexpressing both CD274 and CTLA4 are colored in light purple. Asterisks (***) denote statistically significant differences in the TMB, non-synonymous mutations, synonymous mutations or cancer neoantigens, between the three subgroups (p<0.0001). (B) The mutational signatures differed between TMBhigh and TMBlow tumors, with the first having a preference for (C/T)p*Cp(C/G)>T and (C/T)p*Cp(A/G)>T mutations, whereas the latter, of transversions, A>G and (A/G)p*C>T mutations. The significantly mutated genes include TTN, BRAF, XIRP2, THSD7B, USH2A, NRAS, RELN, TPTE, CNTN5, EPHA6, COL3A1, among others. Copy number gains and losses were observed irrespective of the TMB status of the tumors, mainly across 6q12, 11q13.3, 5p15.33, 6p24.3, 9p21.3, 7q34, 11q23.3, 10q23.31, 4q34.3, 9p23 and 6q26.
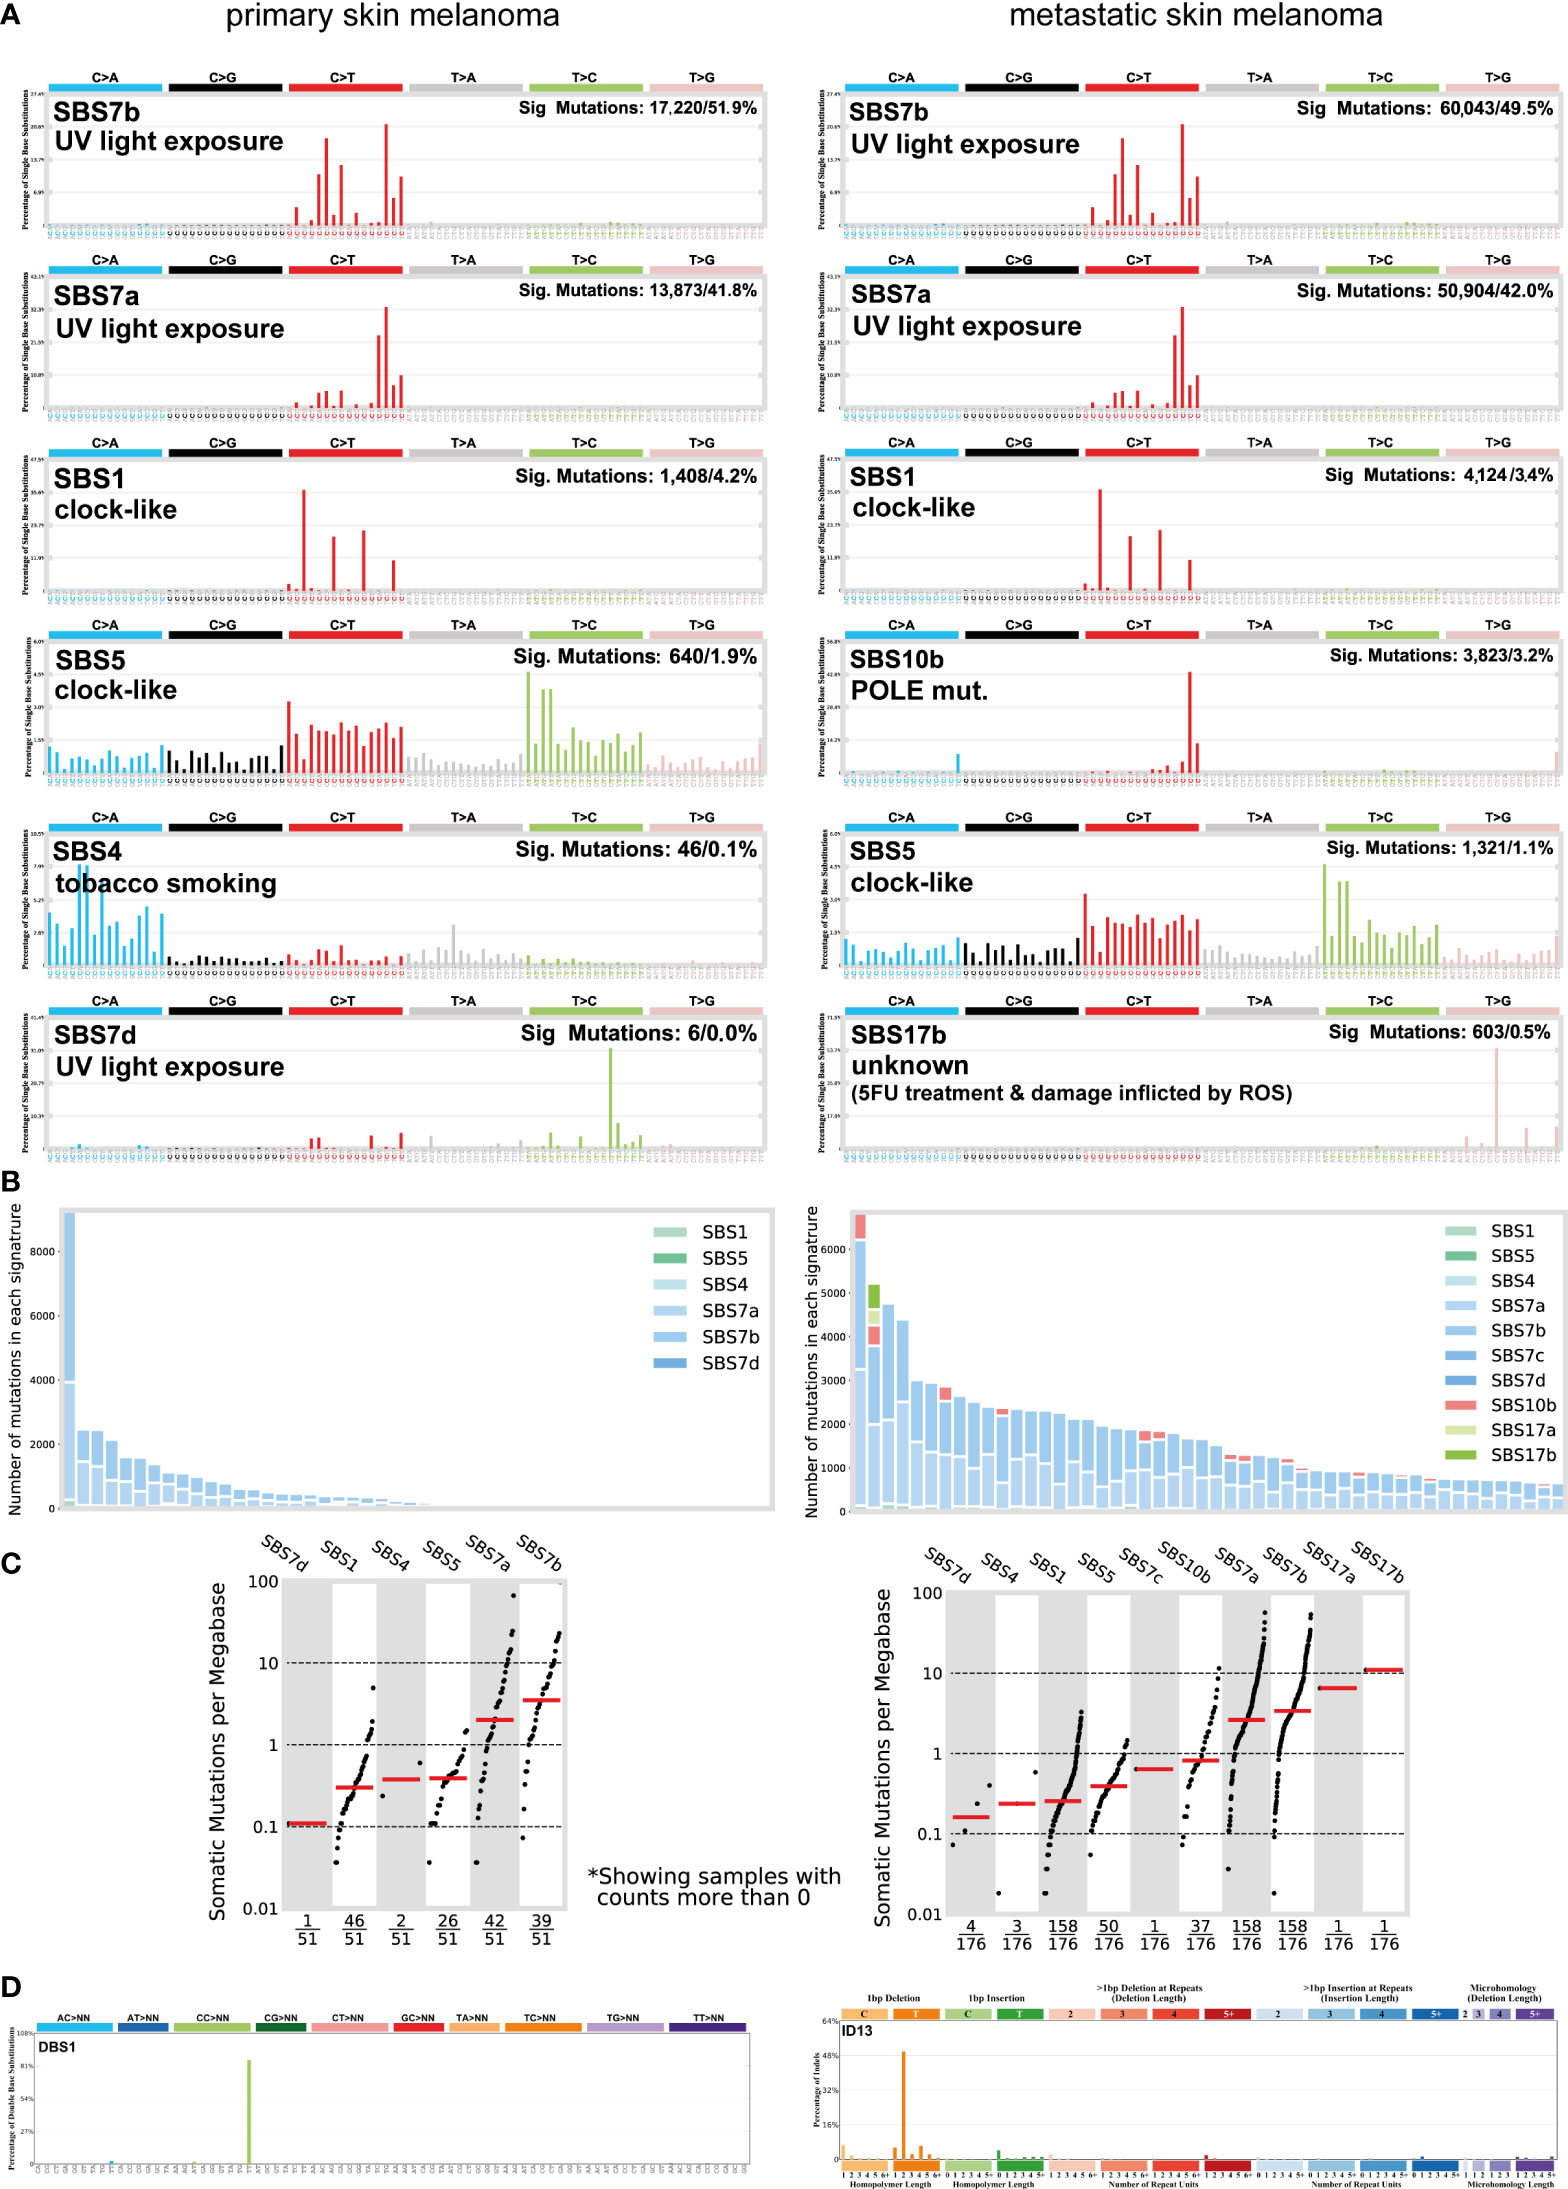
Figure 4 (A) The most prevalent single base substitution (SBS) signatures in primary and metastatic skin melanoma. The proposed aetiology of each SBS signature, along with the total number of mutations and corresponding percentage (%) are denoted. SBS signatures were identified using 96 different contexts, considering not only the mutated base, but also the bases immediately 5’ and 3’. (B) Activity plots depicting the number of mutations in each signature per skin melanoma patient. (C) TMB plots depicting the somatic mutations per Mb. (D) The most common doublet base substitutions (DBS) across primary and metastatic skin melanomas, were DBS1 and ID13. DBS signatures were generated after the concurrent modification of two consecutive nucleotide bases.
We also found a substantial variation in the number of doublet base substitutions (DBS) (range, 0-79 DBSs/sample in primary tumors; 0-206 DBSs/sample in metastatic tumors). Among these, we identified a high percentage of DBS1 and ID13, both due to exposure to UV light. DBS1 is mainly composed of CC>TT on the untranscribed strands of genes indicative of damage to cytosine and repair by transcription-coupled nucleotide excision repair (TC-NER), and it associates with SBS7a/SBS7b (71, 72). ID13 is predominantly composed of T deletions at TT dinucleotides, exhibits large numbers of mutations and is also associated with DBS1 (34) (Figure 4D). These data reiterate the strong link between UV light exposure with melanoma and ageing.
Genomic landscape in skin melanomas with diverse TMB
In total, 25 genes were recurrently mutated in skin melanoma, including TTN (156 missense out of a total of 228 mutations), BRAF (141 missense out of a total of 146 mutations), XIRP2 (91 missense out of a total of 118 mutations), THSD7B (76 missense out of a total of 105 mutations), USH2A (80 missense out of a total of 104 mutations), NRAS (85 missense out of a total of 88 mutations), RLN (50 missense out of a total of 88 mutations) and TPTE (45 missense out of a total of 75 mutations), among others, having a lower mutation frequency (Figure 3). As expected, BRAF and NRAS mutations were not common among TMBhigh patients, as only the BRAFV600K mutation is UV-induced and associates with a higher mutational burden (73). Overall, we identified 40 recurrently mutated cancer drivers, including BRAF, NRAS, ARID2 and TP53, across 466 tumors within the TCGA-SKCM dataset (413,742 total mutations), among which, BRAF dominated (35) (Table S6 and Figure S9). As anticipated, we found differences in the top mutated genes between primary and metastatic skin melanomas, apart from the drivers BRAF, NRAS, TP53 and PTEN, being commonly mutated in the two types (Figure S9).
Copy number variations (CNVs) were also observed across all tumor samples, irrespective of their TMB status. In addition, we did not detect any difference in the intra-tumoral genomic heterogeneity between TMBhigh and TMBlow tumors, as reflected by their MATH scores (74). CNVs were mainly located in 6q12 (1.39% deletion, 79% loss, 15.28% gain and 4.17% amplification); 11q13.3 (65.63% loss, 18.75% gain and 15.63% amplification; associated with WNT11 amplification); 5p15.33 (45.45% loss, 43.64% gain and 10.91% amplification); 6p24.3 (7.55% loss, 84.91% gain and 7.55% amplification); 7q34 (89.58% gain, 4.17% amplification and 6.25% loss; associated with BRAF amplification); 8q24.21 (89.13% gain, 6.52% amplification and 4.35% loss; associated with MYC amplification); 9p21.3 (47.47% deletion and 52.53% loss); 11q23.3 (7.56% deletion, 92.44% loss); 10q23.31 (10.08% deletion, 89.92% loss; associated with PTEN deletion); 4q34.3 (22% deletion, 78% loss); 9p23 (8.50% deletion, 90/20% loss and 1.31% gain), 6q26 (3.73% deletion, 96.27% loss) and 1p22.1 (87.5% loss, 2.5% deletion and 10% gain; associated with NRAS reduction) among others (Figure 3). These findings are in good agreement with previous reports (75).
The expression of most immune-receptors is independent of the TMB in skin melanoma
PD-L1 expression and TMB were recently shown to be independent biomarkers in most cancers (76). Here, we evaluated the expression of CD274 (PD-L1) along with other immunoinhibitors and immunostimulators, across TMBhigh, TMBint and TMBlow skin melanomas. Globally, we found that the expression of most immunoreceptors does not differ across the three TMB subgroups (p>0.05) (Figures S10–S13). CD274 expressed higher in TMBhigh tumors (p<0.05), but still without any significant correlation with the TMB (Pearson’s rho (r)=0.052, p=0.372). We also noted differences in the expression of TNFSF18, KDR and ENTPD1, which were lower in TMBhigh tumors (p<0.05) but also did not correlate significantly with the TMB (TNFSF18, r=-0.043, p= 0.459; KDR, r=-0.073, p=0.214; ENTPD1, r=0.0002, p=0.997). In contrast, the expression of TNFSF9 was marginally higher in TMBlow melanomas (p=0.06) and correlated negatively with the TMB (r=-0.146, p=0.013). A few other correlations we could note, were between TNFSF9 and TMB (r=-0.146, p=0.013), NT5E and TMB (r=0.134, p=0.023), as well as between MICA and TMB (Pearson’s r=0.167, p=0.004). Paradoxially, however, the expression of several well-known inhibitory receptors, including CTLA-4, PDCD1 (PD-1), TIGIT, IDO1, LAG3, ADORA2A and VTCN1, was similar between TMBhigh and TMBlow tumors, corroborating that in general, the expression of immune checkpoints and TMB are independent biomarkers in skin melanoma. This finding was further supported by our IHC data, showing that PD-1, PD-L1, IDO1 and LAG3 protein levels are also similar across melanomas of differential TMB status (Figures 5A, B). In addition, PD-L1+ cells (when expressed) were topologically associated with CD8+ T-cells. The TIL percentage (%) also, did not differ significantly across the three TMB subgroups of tumors (TMBhigh, 1.77 ± 2.63; TMBint, 2.74 ± 5.46; TMBlow, 1.72 ± 3.03); it was higher in the stroma than in the parenchyma of primary tumors, but this percentage decreased in the metastatic cases. Taken together, these data suggest that TMB is not the only factor that affects immunogenicity. In fact, other factors apart from high PD-L1 expression, seem to also affect immunogenicity in skin melanoma and therefore, prevent TMBlow patients to benefit from ICI therapies. These include high levels of IFNγ, CD8 and GZMA/PRF1 [intra-tumoral immune cytolytic activity (23, 42, 77)], as well as low levels of MDSCs, CAFs or M2 macrophages in the TME.
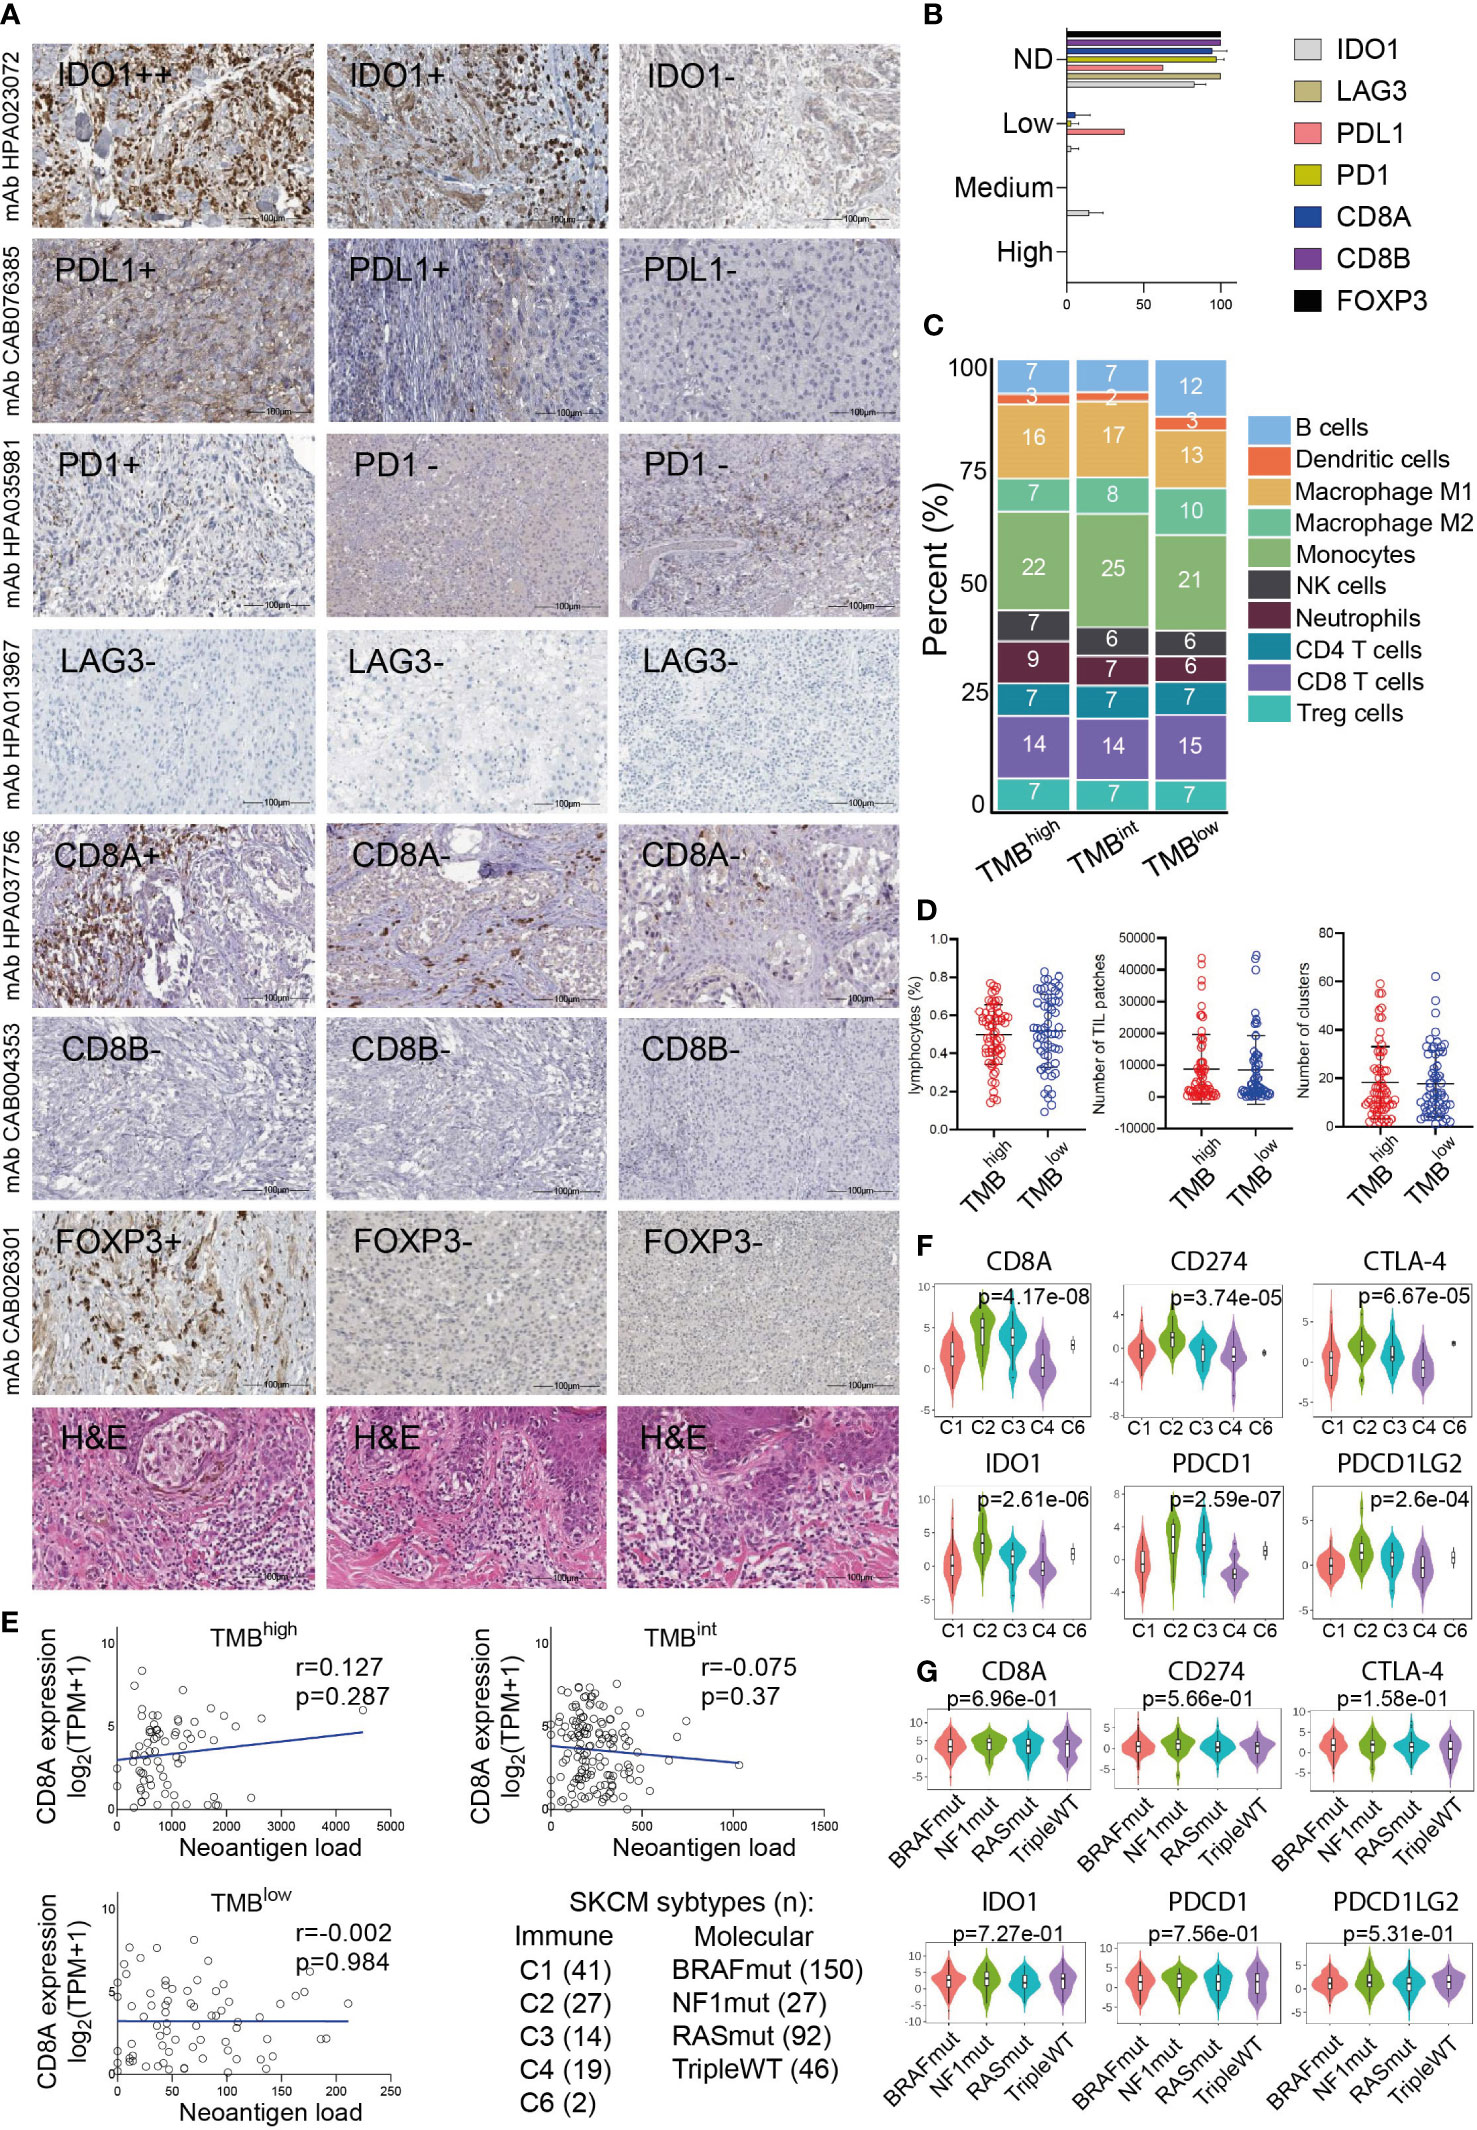
Figure 5 (A) Indicative immunohistochemistry (IHC) staining for the inhibitory receptors IDO1, PD-L1, PD-1, LAG3, CD8A/B (marker for cytotoxic T-cells) and FOXP3 (marker for Tregs) in an independent cohort of 11 cutaneous melanomas. H&E, hematoxylin and eosin staining. (B) Overall, the protein expression of these markers was either not detected (ND) or low and probably did not differ between TMBhigh and TMBlow tumors. (C) Immune-cell fractions across TMBhigh, TMBint and TMBlow skin melanomas, using extracted data (quanTIseq) from The Cancer Immunome Database. (D) The scatterplots depict the percentage of lymphocytes (%), average number of TIL patches and clusters (with standard deviation, SD) in TMBhigh (>30 mut/Mb) and TMBlow (<7.4 mut/Mb) skin melanomas. Neither of these differed significantly between the two subgroups of tumors. (E) The expression of CD8A (log2(TPM+1)) did not correlate with the neoantigen load in either TMB subgroup. Expression of CD8A, PDCD1 (PD-1), CD274 (PD-L1), PDCD1LG2 (PD-L2), IDO1 and CTLA-4 across different immune (F) and molecular (G) subtypes in skin melanoma. Immune subtypes: C1, wound healing (n=41); C2, IFN-gamma dominant (n=27); C3, inflammatory (n=14); C4, lymphocyte depleted (n=19); C5, immunologically quiet (n=0); C6, TGF-b dominant (n=2). Molecular subtypes: BRAFmut (n=150), NF1mut (n=27), RASmut (n=92), tripleWT (n=46).
To further investigate these factors, we examined the fractions of 10 immune cell types, including B-cells, DCs, M1/M2 macrophages, NK cells, neutrophils, CD4+, CD8+T-cells and Tregs, among the three TMB subgroups of melanomas. Interestingly, we observed a similar immune-cell fraction between TMBhigh and TMBint tumors, both having a higher ratio of M1/M2 macrophages compared to TMBlow tumors. In addition, the CD8+ T-cells/Tregs ratio was similar between the three TMB subgroups (Figure 5C). Other than this, the total number of lymphocytes and the rest immune cells did not differ between TMBhigh and TMBlow melanomas, neither did the number of TIL patches or clusters that they formed (Figure 5D), suggesting the existence of other mechanisms allowing or inhibiting response to ICI therapies. These findings also agree with the notion that the content of CD8+ cytotoxic T cells within the TME, along with the TMB, are both crucial factors in determining patient resistance to ICI therapies. In line with this, McGrail et al. showed that CD8+ T-cell levels positively correlate with the neoantigen load in melanoma and that TMBhigh tumors have a better response to ICI compared to TMBlow ones (78). Nevertheless, in terms of CD8A gene expression, our data show that this does not correlate with the neoantigen load in either TMB subgroup (Figure 5E). As regards the number of TIL clusters in different molecular subtypes of skin melanoma, this was recently evaluated in the same cohort and it was found to associate with better survival in BRAFV600E/K patients, but neither in NRASmut nor BRAFwt/NRASwt patients (79). We also found that CD8A, PDCD1 (PD-1), CD274 (PD-L1), PDCD1LG2 (PD-L2), IDO1 and CTLA-4 are highly expressed in the ‘IFN-gamma dominant’ (C2) and ‘inflammatory’ (C3) immune subtypes, but not across the different molecular subtypes (BRAFmut, NF1mut, RASmut or tripleWT) (Figures 5F, G).
Mutations in the IFNγ pathway could affect immunogenicity in melanoma patients
IFNγ-related gene expression signatures have been shown to predict patient response to PD-1 checkpoint blockade in melanoma (39). Motivated by these observations, we hypothesized that mutations in the IFNγ pathway could also affect immunogenicity in melanoma patients, apart from the high IFNγ levels. Therefore, we explored the mutational pattern of genes in the IFNγ pathway signaling, to find whether they associate with T-cell insensitivity, and therefore, resistance to immunotherapy. Notably, we found an increased number of SNVs in IDO1 and HLA-DRA (MHC-II protein). In specific, these contained 28 missense mutations, 1 stop gained and 1 splice acceptor variant in IDO1 (Figure 6 and Table S7), which however did not seem to disturb the gene’s expression, as they did not affect the protein’s, heme-ring. Therefore, the ability of IDO1 to catalyze the deoxygenation of tryptophan does not seem to be affected. Kynurenine is the metabolic product of tryptophan, which suppresses T-cell proliferation and promotes the development of Treg cells. Its inhibition could be exploited therapeutically in cancer immunotherapy beyond ICI or adoptive transfer of chimeric antigen receptor (CAR) T-cells, since it may restore T-cell function and reduce the accumulation of Tregs (80, 81).
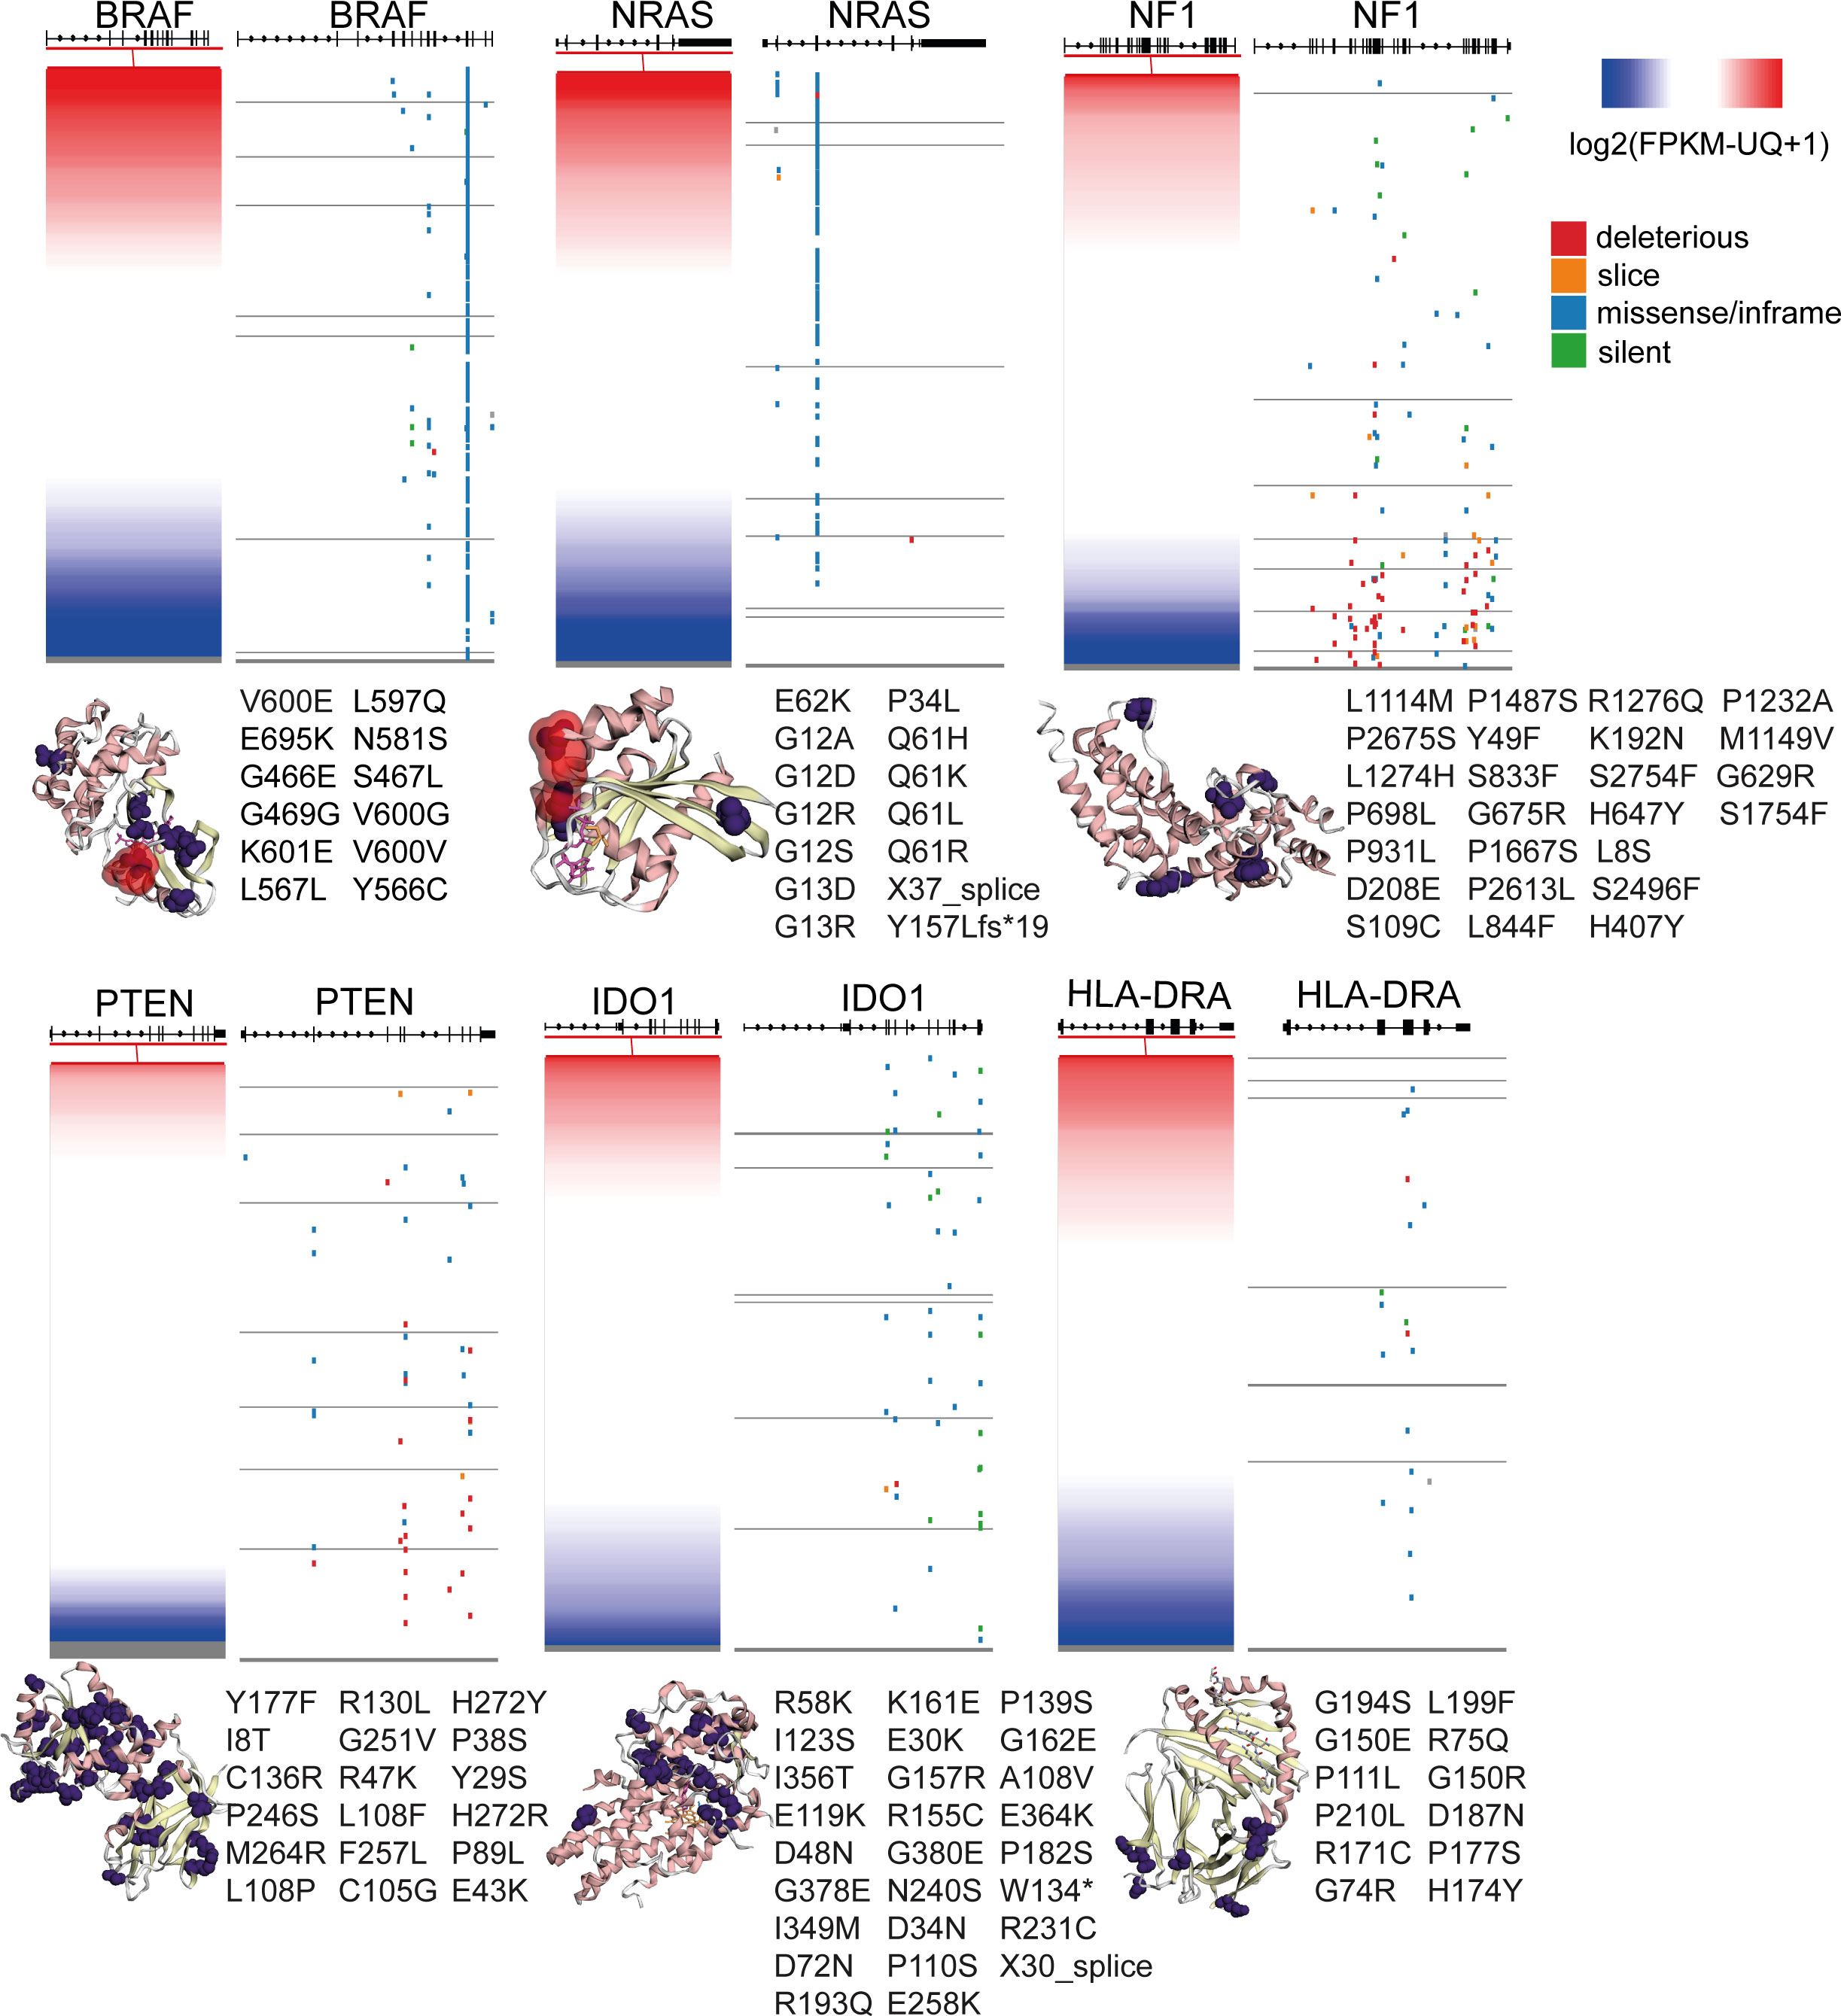
Figure 6 Gene expression and somatic mutations (deleterious, slice, missense/inframe or silent) in the genes BRAF, NRAS, NF1, PTEN, IDO1 and HLA-DRA in skin melanoma. The crystal structures (3D) of the genes’ encoded proteins along with their somatic mutations detected in the TCGA-SKCM dataset (purple color), were calculated using MuPIT (hg38 coding) and are depicted on the right of each plot. Hotspot BRAF and NRAS mutations are highlighted in red color in the corresponding crystal structures. Apart from BRAF, NRAS, NF1 and PTEN, all of which are well-known to be recurrently mutated in skin melanoma, IDO1 and HLA-DRA were also significantly mutated, but the somatic mutations did not seem to affect their protein expression.
In HLA-DRA, we detected 14 missense variants, corroborating the dynamic role of the function of MHC in the progression of the disease (82). HLA-II expression has also been shown to predict patient response to anti-PD1, but not to anti-CTLA-4 immunotherapy (82). HLA-DRa also exhibited heterogenous expression in melanoma lesions and cell lines, with IFNγ being a strong inducer of HLA class II expression (83).
In addition, we noted 3 missense mutations in CXCL10 and 5 missense mutations, one 5’ UTR and one stop gained variant in CXCL9, 6 missense mutations in STAT1, as well as 5 missense mutations in IFNG, including 1 splice donor, 1 stop-gained, three 5’ UTR variants and one 3’ UTR variant (Figure 6 and Table S7).
As expected, BRAF and NRAS were the most frequently mutated genes among all patient samples, hosting hotspot mutations (274 missense mutations, 2 in frame deletions and one 3’ UTR variants in BRAF; and 121 missense mutations, one frameshift and one splice donor variant in NRAS), followed by NF1 (34 missense, 30 stop gained, 5 frameshift, one 3’ UTR, 3 splice acceptor and 1 splice donor variants and 2 splice region;synonymous variants) and PTEN (23 missense, 14 frameshifts, 1 in frame insertion, 4 splice donor/acceptor variants and 6 stop gained mutations). Finally, we detected a smaller number of somatic mutations in B2M (1 in frame deletion, 2 splice donor and 1 coding sequence variants), IFNGR1 (4 missense and two 3’ UTR variants), IFNGR2 (1 missense, one 3’ UTR and one splice region variant in chr21), JAK1 (10 missense mutations, one 5’ UTR and 1 stop gained variant), JAK2 (2 frameshift and 6 missense mutations) and IRF1 (1 missense and one 3’UTR variant) (Table S7). Apart from the activating NRAS mutations (linked with high NRAS expression) and the inactivating NF1 mutations (linked with decreased NF1 expression), all the other mutations were randomly distributed across all melanoma tumors, irrespective of their gene expression (Figure 6). Collectively, these data show that mutations in the IFNγ pathway could affect immunogenicity in melanoma patients.
Patient response to ICI therapies is independent of their TMB status
Tumor immune evasion is based on the infiltration of dysfunctional T-cells in the tumor, but also the prevention of T-cell infiltration into the TME. TIDE scores predict better patient response to anti-PD-1 and anti-CTLA-4 therapies, compared to TMB and PD-L1, and can be used to predict longer patient overall survival (84). Using 7 publicly available transcriptome profiles of ICI-treated melanoma patients, we predicted their response based on their TIDE scores. Overall, patient response rate to ICI ranged between 27-53%, depending on their number in each dataset and the ICI therapy given. Broadly, non-responders (high TIDE score) had significantly lower IFNG, Merck18, CD274 (PD-L1), CD8 and ‘dysfunction of the tumor’ scores. In contrast, they had higher ‘exclusion potential of the tumor’ scores, as a result of the higher levels in MDSCs, CAFs and M2 macrophages. As expected, microsatellite instability (MSI) did not associate with melanoma patient response to ICI therapies, obviously due to its low prevalence in this tumor type. Importantly, we found higher CTL levels among ICI-responders compared to non-responders (Figures 7A, B), recapitulating previous findings (85).
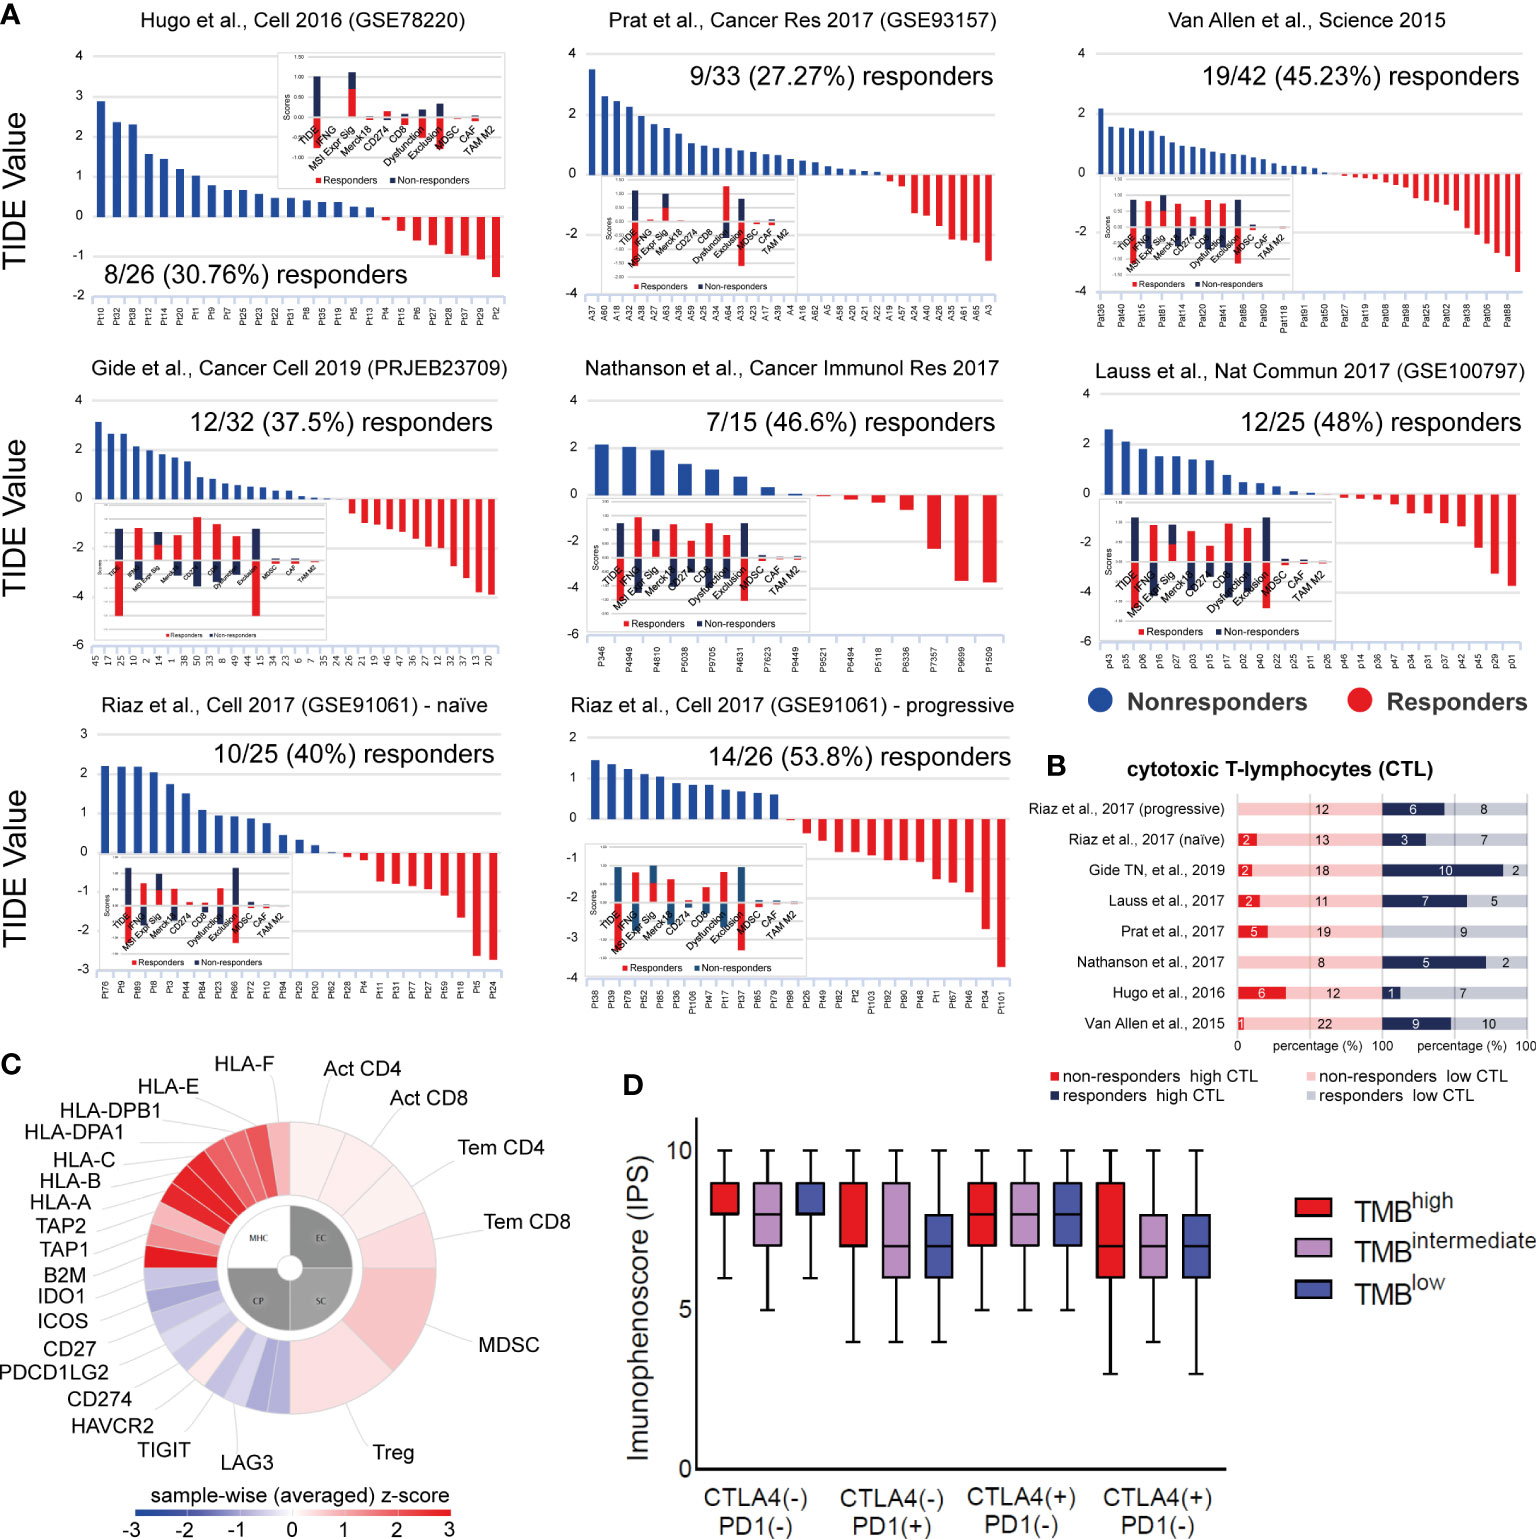
Figure 7 (A) TIDE analysis was used to predict patient response to ICI in 7 independent datasets of skin melanoma patients. Higher TIDE score (blue) denotes non-responders to immune-checkpoint blockade, whereas lower TIDE score (red) denotes responders. (B) Percentage (%) of high or low cytotoxic T-cell lymphocytes (CTLs) among responders or non-responders to ICI therapies, across all 7 melanoma datasets. Clearly, higher CTL levels were found among ICI-responders. The numbers of ICI-responders or non-responders with high or low CTL levels, are indicated within each bar. (C) Indicative immunophenogram depicting the four categories of markers, the expression of which, was used to calculate the immunophenoscores (IPS) for each TMB subgroup of patients. These include: MHC molecules (MHC), immunomodulators (CP), effector cells (EC) and suppressor cells (SC). The outer part of the circle includes individual factors; whereas, the inner part illustrates the weighted average z-scores of the factors included in each category. Sample wise z-scores were positively weighted according to stimulatory cells and negatively weighted according to inhibitory cells and averaged. (D) The boxplots indicate the average IPS across the three TMB subgroups, treated with combination ICI therapy [CTLA-4 (+)/PD1 (+)] or with each ICI therapy, alone [CTLA-4 (+)/PD1 (–) or CTLA-4 (–)/PD1 (+)] or none [CTLA-4 (-)/PD1 (-)]. Similar IPS scores were found across all tumors, suggesting that ICI therapy can be applied independently of the patient’s TMB status.
Next, we questioned whether the TMB status associates with the outcome of each ICI therapy. Therefore, we calculated the immunophenoscores between TMBhigh, TMBint and TMBlow patients treated with anti-PD1 or anti-CTLA-4 alone, a combination of both immune checkpoint inhibitors, or any of them. Interestingly, our analysis revealed similar IPS scores across all TMB subtypes (Figures 7C, D), suggesting that ICI therapy is independent of the patient’s TMB status alone, and it could thus, also work effectively to treat TMBlow patients. Our data also clearly point that the quality of mutations is a more important factor than their quantity, in terms of their immunologic impact on patient response to ICI therapy.
Discussion
In the present study, we explored the expression of various activating or inhibitory immunoreceptors in skin melanomas with diverse TMB, and evaluated their association with patient survival and the TIL load. Overall, our findings show that high expression of most immunoreceptors, apart from PD-1, PD-L1/L2 and CTLA-4 that have been already tested in the clinical setting, associates with the TIL load and patient survival, but not with the TMB, in contrast to other, less hypermutated and/or non-inflamed tumor types (24, 53).
High TMB was initially noted to correlate with response to anti-CTLA-4 immunotherapy in melanoma (45, 86). During the next years, TMB was employed in many clinical trials of anti-PD-1/PD-L1 agents for treating various cancer types. Patients with higher TMB tended to exhibit better treatment response, but the testing methods and cutoffs of TMB varied across trials (45, 87, 88). In contrast to the widely accepted threshold of ≥10 mut/Mb to define TMBhigh tumors, in our study we used a more stringent criterion, setting this threshold in the upper 25th quartile (≥30 mut/Mb, TMBhigh), but we also defined as TMBint those tumors with a mutational burden between 7.42 and 30 mut/Mb.
Overall, our findings suggest that TMBhigh skin melanomas correlate with high levels of IFNγ, CD8+ T-cells in the TME, cancer neoepitopes, as well as high expression of PD-L1 and further immune receptors. In addition, TMBhigh patients experience longer survival and greater response rates after ICI therapy, compared to TMBlow ones (89). The number of cytotoxic CD8+ T-cells modulates immunogenicity in the TME. CD8+ T-cells are the most powerful effectors during an anticancer immune response and constitute the backbone of cancer immunotherapy (90, 91). TMBhigh skin melanomas also correlate with intratumoral immune cytolytic activity (CYT), defined by the expression of granzyme A and perforin 1, both secreted by effector cytotoxic CD8+ T-cells and NK cells against their target cells (72, 87). CYT is significantly elevated upon CD8+ T-cell activation, as well as during a productive clinical response against immune-checkpoint blockade therapies in melanoma patients (23). The presence of several immune-exclusive cells in the TME, such as MDSCs, CAFs and M2 macrophages also affects response to ICI therapies (57).
By stratifying patients based on their TMB, we found that those having a higher mutation rate (>30 mut/Mb) did not express higher CTLA-4, PD-1, IDO1 or other immunoreceptors, apart from just a few cases (including CD274 which was upregulated in TMBhigh tumors). In contrast, TNFSF18, KDR and ENTPD1 showed lower expression levels among TMBhigh tumors, and also did not correlate with the TMB. Collectively, these observations strongly indicate that immunogenicity in these tumors is affected by other factors as well, other than the TMB, and therefore, TMBlow patients could also benefit from ICI therapies.
In the KEYNOTE-002 study, pembrolizumab (anti-PD-1) was established as a new standard treatment after progression on ipilimumab (anti-CTLA-4) and other therapies (92). A year later, in the KEYNOTE-006 study, pembrolizumab was shown to prolong progression-free survival and overall survival and had less high-grade toxicity compared to ipilimumab in patients with advanced melanoma (93). In the CheckMate-066 study, nivolumab was also shown to associate with significant improvements in overall survival and progression-free survival, as compared with dacarbazine, among previously untreated metastatic melanoma patients, without a BRAF mutation (94). Similar improvements associated with ICI therapies were reported elsewhere (13, 95).
Our findings also corroborate that the expression of immune checkpoints and the quantification of the mutational burden seem to be independent predictive biomarkers of ICI therapy in melanoma patients. These results are in line with recent reports mentioning that PD-L1 expression and TMB have non-overlapping effects on the response rate to PD-1/PD-L1 inhibitors and can thus, be used to categorize the immunologic subtypes of different tumor types (76, 96). In addition, despite that TMB associates with improved treatment response, the mutation frequency in expressed genes was found to be superior in predicting the outcome. Additionally, the pre-existing T- and B-cell immunity was shown to play a key role in therapeutic outcomes (97).
We also show that, apart from CTLA-4 and PD-1, there are many other immune receptors expressed by T-cells, which influence the TME and act as checkpoints, negatively regulating immune responses in skin melanoma (24, 98). As combination ICI therapy has been proven to provide clinical benefits for patients with advanced metastatic melanoma, as in other cancer types (99, 100), our data further open up new perspectives for combining the currently administered immune checkpoint blockers, ipilimumab, nivolumab and pembrolizumab with mAbs towards additional inhibitory molecules. These include IDO1, IL2RA, TIGIT, LTA, VTCN1, TIM3, KDR, ENTPD1 and LAG3, as well as agonistic mAbs targeting activating immune receptors, such as TNFSF18, CD70, ICOS and KLRK1. In this line, FDA recently approved the combination therapy of nivolumab (anti-PD-1) and relatlimab (anti-LAG-3 mAb, Opdualag), which was shown to provide a greater benefit with regard to progression-free survival than inhibition of PD-1 alone, in patients with previously untreated metastatic or unresectable melanoma (REALITIVY-047, ClinicalTrials.gov number, NCT03470922) (101).
Importantly, we show that the TIL load is significantly higher among TMBhigh skin melanomas, providing evidence that patients with a high number of immunogenic mutations have an increased survival. Indeed, the lymphocytic score associated with better survival in these patients, in agreement with previous reports (102, 103). The tumors also had higher CTL numbers, as deduced from their CD8A expression. To examine further the factors that could contribute to treatment response or resistance among melanoma patients receiving anti-PD-1 and/or anti-CTLA-4 immunotherapy, we evaluated transcriptomic data from 7 independent datasets and found that indeed, the number of CTLs in the TME associates with patient response to ICI therapy, irrespective of the patient TMB status.
In addition, we investigated different immune-related gene signatures. We found several T-cell-related signatures, including those of naive T-cells, effector memory T-cells and exhausted T-cells, all being upregulated in skin melanoma compared to the normal skin (or matched blood). Other signatures involving inhibitory cells (effector Treg T-cell and resting Treg T-cell signatures), or helper T-cells (Th1-like cell signature), were also higher in skin melanoma, underlying the intricate immunological reactions taking place within the tumor’s microenvironment. Looking deeper into the fractions of immune-cells within the TME however, we did not observe significant differences between TMBhigh and TMBlow tumors, apart from the ratio of M1/M2 macrophages, which was higher in the TMBhigh subgroup.
Notably, different genomic events and the immune microenvironment in skin melanoma seem to orchestrate the patients’ resistance to ICI therapies or their relapse (42). Frameshift mutations, indels and splice-site mutations are also believed to generate more immunogenic neoantigens compared with the nonsynonymous SNVs that are more frequently detected upon TMB assessment (104). In addition, cancer neoantigens that are similar to pathogen-derived antigens can affect tumor immunogenicity and thus, patient response to ICI therapy (86). We explored the SNVs and CNVs across the different TMB subgroups of tumors, and also highlighted the mutational signatures contributing more to this mutational burden. Chronic sun exposure over years permits the accumulation of sun damage, and it correlates with the age of melanoma diagnosis. Therefore, is was expected to observe mainly UV-light (SBS7a/b/d) and clock-like signatures (SBS1 and SBS5) across all melanomas. In addition, we found that a small percentage of these tumors also associated with POLE/POLD1 mutations (SBS10b) and tobacco smoking (SBS4).
Together with granzyme B and perforin, IFN-γ acts as a cytotoxic cytokine that initiates apoptosis in tumor cells (105, 106). IFN-γ also enables the synthesis of immune checkpoint inhibitory molecules and indoleamine-2,3-dioxygenase (IDO), thus stimulating other immune-suppressive mechanisms (107–109). The IFN-γ signaling pathway enhances MHC expression and subsequent tumor antigen presentation. It also induces the recruitment of further immune cells, and inhibits tumor cell proliferation (110). IDO1 associates with adverse clinical outcome in melanoma patients, and its activity promotes an immunosuppressive TME by upregulating trafficking of MDSCs and Tregs (111). Here, we evaluated somatic mutations in IFNG and other IFN-γ-related genes in skin melanoma, and questioned whether their presence associates with gene expression. Our data reveal that IDO1 and HLA-DRA are frequently mutated in skin melanoma, but these mutations do not seem to associate with their gene expression. Nevertheless, the frequency of the somatic mutations that we detected both in IDO1 and HLA-DRA, suggests that these are common events taking place in skin melanoma and could be involved in hindering patient response to ICI therapies. Their contribution to immune evasion and resistance to ICI therapies, could take place in parallel with other well-known mutations in BRAF, NRAS, NF1, PTEN and B2M, as well as in other genes involved in the IFN-γ signaling pathway, being critical in mediating antitumor immunity (112).
We finally showed that non-responders to anti-PD-1 and/or anti-CTLA-4 ICI therapies have lower IFNG, Merck18, CD274 and CD8 scores, and lower dysfunction of the tumor. In addition, they have higher exclusion potential of the tumor and higher levels in the immune suppressive MDSCs, CAFs and M2 macrophages, compared to ICI-responders. The latter cell types, on their own and cooperatively, induce an immune-suppressive TME that prevents anti-tumor cytotoxic and Th1-directed T-cell activities, mainly through the release of cytokines, chemokines, and other soluble mediators (113). In addition, their depletion increases anti-tumor immune responses overcoming innate resistance (114). Non-responders to monotherapy often express alternate immune-checkpoints, such as IDO1, ICOS, and TIGIT, in contrast to combination therapy on non-responders, who rarely express these alternate drug targets (50). Moreover, ICI responders had significantly higher CTL numbers compared to non-responders. Therefore, it seems that IFNɣ-associated genes and CTLs in the TME, along with a high TMB (and consequently neoantigen) load, but no specific gene mutation, associate with ICI therapy response. These data provide important insights to facilitate the development of precision immuno-oncology for skin melanoma patients.
Overall, we highlight the associations between various immune receptors, TMB, TILs, patient survival and their response to ICI therapies. Taken together, our data highlight the importance of pre-existing T-cell immunity in the therapeutic outcome. They also corroborate that the expression of most immunoreceptors and TMB are independent biomarkers in predicting treatment response in skin melanoma and that ICI therapies could also be applied to TMBlow patients.
Data availability statement
The original contributions presented in the study are included in the article/Supplementary Material. Further inquiries can be directed to the corresponding author.
Author contributions
GG and AZ acquired data and analyzed them. AZ developed the methodology, analyzed data and interpreted them. AZ wrote the manuscript and supervised the study. GG and AZ critically reviewed the manuscript. All authors contributed to the article and approved the submitted version.
Acknowledgments
We would like to acknowledge TCGA, ICGC, HPA, GDAC and TCIA for providing the genetic and clinical data of the skin melanoma patients that were analyzed in this study. We would also like to acknowledge assistance with extracting mutational signatures from Dr. Ilias Georgakopoulos-Soares.
Conflict of interest
The authors declare that the research was conducted in the absence of any commercial or financial relationships that could be construed as a potential conflict of interest.
Publisher’s note
All claims expressed in this article are solely those of the authors and do not necessarily represent those of their affiliated organizations, or those of the publisher, the editors and the reviewers. Any product that may be evaluated in this article, or claim that may be made by its manufacturer, is not guaranteed or endorsed by the publisher.
Supplementary material
The Supplementary Material for this article can be found online at: https://www.frontiersin.org/articles/10.3389/fimmu.2022.1006665/full#supplementary-material
Supplementary Figure 1 | The bar charts (left) depict the top 10 enriched Gene Ontology (GO) terms in the top 250 upregulated genes in primary skin melanoma, along with their corresponding p-values. Asterisks (*) indicate the terms with significant adjusted p-values (<0.05). The scatterplots (right) were created using UMAP and are organized so that similar gene sets are clustered together. Larger, black-outlined points represent significantly enriched terms, the associated gene set names and p-values of which, are denoted.
Supplementary Figure 2 | The bar charts (left) depict the top 10 enriched Gene Ontology (GO) terms in the top 250 downregulated genes in primary skin melanoma, along with their corresponding p-values. Colored bars correspond to terms with significant p-values (<0.05). Asterisks (*) indicate the terms with significant adjusted p-values (<0.05). The scatterplots (right) were created using UMAP and are organized so that similar gene sets are clustered together. Larger, black-outlined points represent significantly enriched terms, the associated gene set names and p-values of which, are denoted.
Supplementary Figure 3 | The bar charts (left) depict the top 10 enriched Gene Ontology (GO) terms in the top 250 upregulated genes in metastatic skin melanoma, along with their corresponding p-values. Colored bars correspond to terms with significant p-values (<0.05). Asterisks (*) indicate the terms with significant adjusted p-values (<0.05). The scatterplots (right) were created using UMAP and are organized so that similar gene sets are clustered together. Larger, black-outlined points represent significantly enriched terms, the associated gene set names and p-values of which, are denoted.
Supplementary Figure 4 | The bar charts (left) depict the top 10 enriched Gene Ontology (GO) terms in the top 250 downregulated genes in metastatic skin melanoma, along with their corresponding p-values. Colored bars correspond to terms with significant p-values (<0.05). Asterisks (*) indicate the terms with significant adjusted p-values (<0.05). The scatterplots (right) were created using UMAP and are organized so that similar gene sets are clustered together. Larger, black-outlined points represent significantly enriched terms, the associated gene set names and p-values of which, are denoted.
Supplementary Figure 5 | Stage-plot analysis of the expression of CD8 and several immune receptors in skin melanoma, showing no significant differences according to the tumor’s stage.
Supplementary Figure 6 | The Kaplan-Meier curves show the overall and disease-free (DF) survival of melanoma patients, expressing high or low expression levels of PD-1, PD-L1/L2, CTLA-4, LAG3, IDO1/2, TIGIT, HAVCR2, VISTA, VTCN1, ILT2/4, ADORA2A and CD8 (marker for CD8+ T cells). The log-rank test was used to assess statistical differences between the two subgroups of patients. The patients were separated into high expression group (upper 50 percentile, red curve) and low expression group (lower 50 percentile, blue curve) by gene expression levels. The numbers of the patients in each group are provided as “n(high)” and “n(low)”, respectively. The log-rank p-value, along with the HR(high) and p(HR) values are also provided in each Kaplan-Meier survival plot. A Bonferroni-corrected cut-off log-rank p-value of <0.05 indicates statistical significance.
Supplementary Figure 7 | The scatterplots depict the Pearson’s correlation coefficient (R and p-values) between the expression of CD274 (PD-L1) (A) or CD8A (B) and various immune receptors in skin melanomas (TCGA-SKCM) and normal suprapubic skin sample, not exposed to the sun (GTEx).
Supplementary Figure 8 | The boxplots depict nine immune-signatures which did not differ across BRAFmut, NF1mut, RASmut and TripleWT skin melanoma tumors. Signatures were calculated in log2(TPM+1) using the |log2FC>1| and p<0.01 (ANOVA) as thresholds for statistical significance across the different skin melanoma subtypes.
Supplementary Figure 9 | The comutation plots depict the top 20 significantly mutated genes (SMGs, FDR<0.1) in primary and metastatic (A) or TMBhigh and TBlow skin melanomas (B). Green, red, pink, black and orange boxes indicate missense, nonsense, translation start site, multi-hit and splice-site mutations, respectively. The SMGs that correlate with primary or metastatic tumors (p<0.05) are highlighted by red or blue circles, respectively, next to the gene names. Each SMG’s q-values (−log10(FDR)) are plotted as a right-side bar plot in blue color. (C) The bar chart depicts the top 30 cancer drivers in skin melanoma. (D) The lollipop plots (below) report all the variants affecting the coding region of three drivers in skin melanoma (BRAF, NRAS and ARID2). Diagram circles are colored with respect to the corresponding mutations. Passenger mutations are highlighted in light blue and ad driver mutations in red.
Supplementary Figure 10 | The scatterplots show mean values in log2(TPM+1) with standard deviation (SD) of gene expression across various immunostimulators. Gene expression did not change across TMBhigh, TMBint and TMBlow skin melanomas, apart from CD274 and TNFSF18 (*, p<0.05. **, p<0.01).
Supplementary Figure 11 | The scatterplots show mean values in log2(TPM+1) with standard deviation (SD) of gene expression across various immunoinhibitors. Gene expression did not change across TMBhigh, TMBint and TMBlow skin melanomas, apart from KDR, which was lower in TMBhigh tumors (**, p<0.01).
Supplementary Figure 12 | Pearson’s correlation between TMB and the expression of activating immune receptors (immunostimulators), shows that there was no relationship between their gene expression and the TMB in skin melanoma.
Supplementary Figure 13 | Pearson’s correlation between TMB and the expression of inhibitory immune receptors (immunoinhibitors), shows that there was no relationship between the gene expression and the TMB in skin melanoma.
Supplementary Table 1 | Significantly up- and down-regulated genes in skin melanoma (TCGA-SKCM).
Supplementary Table 2 | Gene Ontology enrichment for the top 250 up-regulated genes in primary skin melanoma.
Supplementary Table 3 | Gene Ontology enrichment for the top 250 down-regulated genes in primary skin melanoma.
Supplementary Table 4 | Gene Ontology enrichment for the top 250 up-regulated genes in metastatic skin melanoma.
Supplementary Table 5 | Gene Ontology enrichment for the top 250 down-regulated genes in metastatic skin melanoma.
Supplementary Table 6 | Recurrently mutated cancer drivers in skin melanoma, identified using IntOGen analysis.
Supplementary Table 7 | Somatic mutation analysis for IDO1, HLA-DRA, CXCL10, CXCL9. STAT1, IFNG, B2M, BRAF, NRAS, NF1, JAK1, JAK2, PTEN, IFNGR1, IFNGR2 and IRF1, in skin melanoma.
References
1. Bittner M, Meltzer P, Chen Y, Jiang Y, Seftor E, Hendrix M, et al. Molecular classification of cutaneous malignant melanoma by gene expression profiling. Nature (2000) 406:536–40. doi: 10.1038/35020115
2. Leiter U, Garbe C. Epidemiology of melanoma and nonmelanoma skin cancer–the role of sunlight. Adv Exp Med Biol (2008) 624:89–103. doi: 10.1007/978-0-387-77574-6_8
3. Brash DE, Rudolph JA, Simon JA, Lin A, McKenna GJ, Baden HP, et al. A role for sunlight in skin cancer: UV-induced p53 mutations in squamous cell carcinoma. Proc Natl Acad Sci U.S.A. (1991) 88:10124–8. doi: 10.1073/pnas.88.22.10124
4. Cancer Genome Atlas Network. Genomic classification of cutaneous melanoma. Cell (2015) 161:1681–96. doi: 10.1016/j.cell.2015.05.044
5. Davies H, Bignell GR, Cox C, Stephens P, Edkins S, Clegg S, et al. Mutations of the BRAF gene in human cancer. Nature (2002) 417:949–54. doi: 10.1038/nature00766
6. Huang FW, Hodis E, Xu MJ, Kryukov GV, Chin L, Garraway LA. Highly recurrent TERT promoter mutations in human melanoma. Science (2013) 339:957–9. doi: 10.1126/science.1229259
7. Thorsson V, Gibbs DL, Brown SD, Wolf D, Bortone DS, Ou Yang T-H, et al. The immune landscape of cancer. Immunity (2018) 48:812–30.e14. doi: 10.1016/j.immuni.2018.03.023
8. Villanueva J, Herlyn M. Melanoma and the tumor microenvironment. Curr Oncol Rep (2008) 10:439–46. doi: 10.1007/s11912-008-0067-y
9. Ji R-R, Chasalow SD, Wang L, Hamid O, Schmidt H, Cogswell J, et al. An immune-active tumor microenvironment favors clinical response to ipilimumab. Cancer Immunol Immunother CII (2012) 61:1019–31. doi: 10.1007/s00262-011-1172-6
10. Topalian SL, Taube JM, Anders RA, Pardoll DM. Mechanism-driven biomarkers to guide immune checkpoint blockade in cancer therapy. Nat Rev Cancer (2016) 16:275–87. doi: 10.1038/nrc.2016.36
11. Herbst RS, Soria J-C, Kowanetz M, Fine GD, Hamid O, Gordon MS, et al. Predictive correlates of response to the anti-PD-L1 antibody MPDL3280A in cancer patients. Nature (2014) 515:563–7. doi: 10.1038/nature14011
12. Mandalà M, Imberti GL, Piazzalunga D, Belfiglio M, Labianca R, Barberis M, et al. Clinical and histopathological risk factors to predict sentinel lymph node positivity, disease-free and overall survival in clinical stages I-II AJCC skin melanoma: Outcome analysis from a single-institution prospectively collected database. Eur J Cancer Oxf Engl 1990 (2009) 45:2537–45. doi: 10.1016/j.ejca.2009.05.034
13. Postow MA, Chesney J, Pavlick AC, Robert C, Grossmann K, McDermott D, et al. Nivolumab and ipilimumab versus ipilimumab in untreated melanoma. N Engl J Med (2015) 372:2006–17. doi: 10.1056/NEJMoa1414428
14. Larkin J, Hodi FS, Wolchok JD. Combined nivolumab and ipilimumab or monotherapy in untreated melanoma. N Engl J Med (2015) 373:1270–1. doi: 10.1056/NEJMc1509660
15. Tucci M, Passarelli A, Mannavola F, Felici C, Stucci LS, Cives M, et al. Immune system evasion as hallmark of melanoma progression: The role of dendritic cells. Front Oncol (2019) 9:1148. doi: 10.3389/fonc.2019.01148
16. McGranahan N, Favero F, de Bruin EC, Birkbak NJ, Szallasi Z, Swanton C. Clonal status of actionable driver events and the timing of mutational processes in cancer evolution. Sci Transl Med (2015) 7:283ra54. doi: 10.1126/scitranslmed.aaa1408
17. Schumacher TN, Schreiber RD. Neoantigens in cancer immunotherapy. Science (2015) 348:69–74. doi: 10.1126/science.aaa4971
18. Riaz N, Morris L, Havel JJ, Makarov V, Desrichard A, Chan TA. The role of neoantigens in response to immune checkpoint blockade. Int Immunol (2016) 28:411–9. doi: 10.1093/intimm/dxw019
19. Goodman AM, Kato S, Bazhenova L, Patel SP, Frampton GM, Miller V, et al. Tumor mutational burden as an independent predictor of response to immunotherapy in diverse cancers. Mol Cancer Ther (2017) 16:2598–608. doi: 10.1158/1535-7163.MCT-17-0386
20. Lee C-H, Yelensky R, Jooss K, Chan TA. Update on tumor neoantigens and their utility: Why it is good to be different. Trends Immunol (2018) 39:536–48. doi: 10.1016/j.it.2018.04.005
21. Christodoulou M-I, Zaravinos A. New clinical approaches and emerging evidence on immune-checkpoint inhibitors as anti-cancer therapeutics: CTLA-4 and PD-1 pathways and beyond. Crit Rev Immunol (2019) 39:379–408. doi: 10.1615/CritRevImmunol.2020033340
22. McInnes L, Healy J, Melville J. UMAP: Uniform manifold approximation and projection for dimension reduction. arXiv preprint (2018). doi: 10.48550/ARXIV.1802.03426
23. Roufas C, Chasiotis D, Makris A, Efstathiades C, Dimopoulos C, Zaravinos A. The expression and prognostic impact of immune cytolytic activity-related markers in human malignancies: A comprehensive meta-analysis. Front Oncol (2018) 8:27. doi: 10.3389/fonc.2018.00027
24. Zaravinos A, Roufas C, Nagara M, de Lucas Moreno B, Oblovatskaya M, Efstathiades C, et al. Cytolytic activity correlates with the mutational burden and deregulated expression of immune checkpoints in colorectal cancer. J Exp Clin Cancer Res CR (2019) 38:364. doi: 10.1186/s13046-019-1372-z
25. Xu L, Shen SS, Hoshida Y, Subramanian A, Ross K, Brunet J-P, et al. Gene expression changes in an animal melanoma model correlate with aggressiveness of human melanoma metastases. Mol Cancer Res MCR (2008) 6:760–9. doi: 10.1158/1541-7786.MCR-07-0344
26. Jalili A, Mertz KD, Romanov J, Wagner C, Kalthoff F, Stuetz A, et al. NVP-LDE225, a potent and selective SMOOTHENED antagonist reduces melanoma growth. Vitro vivo. PloS One (2013) 8:e69064. doi: 10.1371/journal.pone.0069064
27. Riker AI, Enkemann SA, Fodstad O, Liu S, Ren S, Morris C, et al. The gene expression profiles of primary and metastatic melanoma yields a transition point of tumor progression and metastasis. BMC Med Genomics (2008) 1:13. doi: 10.1186/1755-8794-1-13
28. Kabbarah O, Nogueira C, Feng B, Nazarian RM, Bosenberg M, Wu M, et al. Integrative genome comparison of primary and metastatic melanomas. PloS One (2010) 5:e10770. doi: 10.1371/journal.pone.0010770
29. Smyth GK. Linear models and empirical bayes methods for assessing differential expression in microarray experiments. Stat Appl Genet Mol Biol (2004) 3. doi: 10.2202/1544-6115.1027
30. Tang Z, Kang B, Li C, Chen T, Zhang Z. GEPIA2: An enhanced web server for large-scale expression profiling and interactive analysis. Nucleic Acids Res (2019) 47:W556–60. doi: 10.1093/nar/gkz430
31. Mayakonda A, Lin D-C, Assenov Y, Plass C, Koeffler HP. Maftools: efficient and comprehensive analysis of somatic variants in cancer. Genome Res (2018) 28:1747–56. doi: 10.1101/gr.239244.118
32. Alexandrov LB, Nik-Zainal S, Wedge DC, Aparicio SAJR, Behjati S, Biankin AV, et al. Signatures of mutational processes in human cancer. Nature (2013) 500:415–21. doi: 10.1038/nature12477
33. Bergstrom EN, Huang MN, Mahto U, Barnes M, Stratton MR, Rozen SG, et al. SigProfilerMatrixGenerator: A tool for visualizing and exploring patterns of small mutational events. BMC Genomics (2019) 20:685. doi: 10.1186/s12864-019-6041-2
34. Alexandrov LB, Kim J, Haradhvala NJ, Huang MN, Tian Ng AW, Wu Y, et al. The repertoire of mutational signatures in human cancer. Nature (2020) 578:94–101. doi: 10.1038/s41586-020-1943-3
35. Martínez-Jiménez F, Muiños F, Sentís I, Deu-Pons J, Reyes-Salazar I, Arnedo-Pac C, et al. A compendium of mutational cancer driver genes. Nat Rev Cancer (2020) 20:555–72. doi: 10.1038/s41568-020-0290-x
36. Charoentong P, Finotello F, Angelova M, Mayer C, Efremova M, Rieder D, et al. Pan-cancer immunogenomic analyses reveal genotype-immunophenotype relationships and predictors of response to checkpoint blockade. Cell Rep (2017) 18:248–62. doi: 10.1016/j.celrep.2016.12.019
37. Finotello F, Mayer C, Plattner C, Laschober G, Rieder D, Hackl H, et al. Molecular and pharmacological modulators of the tumor immune contexture revealed by deconvolution of RNA-seq data. Genome Med (2019) 11:34. doi: 10.1186/s13073-019-0638-6
38. Uhlen M, Zhang C, Lee S, Sjöstedt E, Fagerberg L, Bidkhori G, et al. A pathology atlas of the human cancer transcriptome. Science (2017) 357:eaan2507. doi: 10.1126/science.aan2507
39. Ayers M, Lunceford J, Nebozhyn M, Murphy E, Loboda A, Kaufman DR, et al. IFN-γ-related mRNA profile predicts clinical response to PD-1 blockade. J Clin Invest (2017) 127:2930–40. doi: 10.1172/JCI91190
40. Goldman M, Craft B, Hastie M, Repečka K, Kamath A, McDade F, et al. The UCSC xena platform for public and private cancer genomics data visualization and interpretation. [preprint]. Cancer Biol (2018) 326470. doi: 10.1101/326470
41. Hugo W, Zaretsky JM, Sun L, Song C, Moreno BH, Hu-Lieskovan S, et al. Genomic and transcriptomic features of response to anti-PD-1 therapy in metastatic melanoma. Cell (2016) 165:35–44. doi: 10.1016/j.cell.2016.02.065
42. Roufas C, Georgakopoulos-Soares I, Zaravinos A. Distinct genomic features across cytolytic subgroups in skin melanoma. Cancer Immunol Immunother CII (2021) 70:3137–54. doi: 10.1007/s00262-021-02918-3
43. Fu J, Li K, Zhang W, Wan C, Zhang J, Jiang P, et al. Large-Scale public data reuse to model immunotherapy response and resistance. Genome Med (2020) 12:21. doi: 10.1186/s13073-020-0721-z
44. Jiang P, Gu S, Pan D, Fu J, Sahu A, Hu X, et al. Signatures of T cell dysfunction and exclusion predict cancer immunotherapy response. Nat Med (2018) 24:1550–8. doi: 10.1038/s41591-018-0136-1
45. Van Allen EM, Miao D, Schilling B, Shukla SA, Blank C, Zimmer L, et al. Genomic correlates of response to CTLA-4 blockade in metastatic melanoma. Science (2015) 350:207–11. doi: 10.1126/science.aad0095
46. Nathanson T, Ahuja A, Rubinsteyn A, Aksoy BA, Hellmann MD, Miao D, et al. Somatic mutations and neoepitope homology in melanomas treated with CTLA-4 blockade. Cancer Immunol Res (2017) 5:84–91. doi: 10.1158/2326-6066.CIR-16-0019
47. Prat A, Navarro A, Paré L, Reguart N, Galván P, Pascual T, et al. Immune-related gene expression profiling after PD-1 blockade in non-small cell lung carcinoma, head and neck squamous cell carcinoma, and melanoma. Cancer Res (2017) 77:3540–50. doi: 10.1158/0008-5472.CAN-16-3556
48. Lauss M, Donia M, Harbst K, Andersen R, Mitra S, Rosengren F, et al. Mutational and putative neoantigen load predict clinical benefit of adoptive T cell therapy in melanoma. Nat Commun (2017) 8:1738. doi: 10.1038/s41467-017-01460-0
49. Riaz N, Havel JJ, Makarov V, Desrichard A, Urba WJ, Sims JS, et al. Tumor and microenvironment evolution during immunotherapy with nivolumab. Cell (2017) 171:934–949.e16. doi: 10.1016/j.cell.2017.09.028
50. Gide TN, Quek C, Menzies AM, Tasker AT, Shang P, Holst J, et al. Distinct immune cell populations define response to anti-PD-1 monotherapy and anti-PD-1/Anti-CTLA-4 combined therapy. Cancer Cell (2019) 35:238–255.e6. doi: 10.1016/j.ccell.2019.01.003
51. Traag VA, Waltman L, van Eck NJ. From louvain to Leiden: Guaranteeing well-connected communities. Sci Rep (2019) 9:5233. doi: 10.1038/s41598-019-41695-z
52. Ballot E, Ladoire S, Routy B, Truntzer C, Ghiringhelli F. Tumor infiltrating lymphocytes signature as a new pan-cancer predictive biomarker of anti PD-1/PD-L1 efficacy. Cancers (2020) 12:E2418. doi: 10.3390/cancers12092418
53. Kitsou M, Ayiomamitis GD, Zaravinos A. High expression of immune checkpoints is associated with the TIL load, mutation rate and patient survival in colorectal cancer. Int J Oncol (2020) 57:237–48. doi: 10.3892/ijo.2020.5062
54. Kitano A, Ono M, Yoshida M, Noguchi E, Shimomura A, Shimoi T, et al. Tumour-infiltrating lymphocytes are correlated with higher expression levels of PD-1 and PD-L1 in early breast cancer. ESMO Open (2017) 2:e000150. doi: 10.1136/esmoopen-2016-000150
55. Yu Z, Si L. Immunotherapy of patients with metastatic melanoma. Chin Clin Oncol (2017) 6:20. doi: 10.21037/cco.2017.04.01
56. Ott PA, Hodi FS, Kaufman HL, Wigginton JM, Wolchok JD. Combination immunotherapy: A road map. J Immunother Cancer (2017) 5:16. doi: 10.1186/s40425-017-0218-5
57. Jenkins RW, Barbie DA, Flaherty KT. Mechanisms of resistance to immune checkpoint inhibitors. Br J Cancer (2018) 118:9–16. doi: 10.1038/bjc.2017.434
58. Li F, Li C, Cai X, Xie Z, Zhou L, Cheng B, et al. The association between CD8+ tumor-infiltrating lymphocytes and the clinical outcome of cancer immunotherapy: A systematic review and meta-analysis. EClinicalMedicine (2021) 41:101134. doi: 10.1016/j.eclinm.2021.101134
59. Takada K, Jameson SC. Naive T cell homeostasis: From awareness of space to a sense of place. Nat Rev Immunol (2009) 9:823–32. doi: 10.1038/nri2657
61. Ciccocioppo F, Lanuti P, Pierdomenico L, Simeone P, Bologna G, Ercolino E, et al. The characterization of regulatory T-cell profiles in alzheimer’s disease and multiple sclerosis. Sci Rep (2019) 9:8788. doi: 10.1038/s41598-019-45433-3
62. Kamali AN, Noorbakhsh SM, Hamedifar H, Jadidi-Niaragh F, Yazdani R, Bautista JM, et al. A role for Th1-like Th17 cells in the pathogenesis of inflammatory and autoimmune disorders. Mol Immunol (2019) 105:107–15. doi: 10.1016/j.molimm.2018.11.015
63. Wan YY, Flavell RA. How diverse–CD4 effector T cells and their functions. J Mol Cell Biol (2009) 1:20–36. doi: 10.1093/jmcb/mjp001
64. Koizumi S-I, Ishikawa H. Transcriptional regulation of differentiation and functions of effector T regulatory cells. Cells (2019) 8:E939. doi: 10.3390/cells8080939
65. Secrier M, Li X, de Silva N, Eldridge MD, Contino G, Bornschein J, et al. Corrigendum: Mutational signatures in esophageal adenocarcinoma define etiologically distinct subgroups with therapeutic relevance. Nat Genet (2017) 49:317. doi: 10.1038/ng0217-317a
66. Hayward NK, Wilmott JS, Waddell N, Johansson PA, Field MA, Nones K, et al. Whole-genome landscapes of major melanoma subtypes. Nature (2017) 545:175–80. doi: 10.1038/nature22071
67. Nik-Zainal S, Alexandrov LB, Wedge DC, Van Loo P, Greenman CD, Raine K, et al. Mutational processes molding the genomes of 21 breast cancers. Cell (2012) 149:979–93. doi: 10.1016/j.cell.2012.04.024
68. Saini N, Roberts SA, Klimczak LJ, Chan K, Grimm SA, Dai S, et al. The impact of environmental and endogenous damage on somatic mutation load in human skin fibroblasts. PloS Genet (2016) 12:e1006385. doi: 10.1371/journal.pgen.1006385
69. Sha D, Jin Z, Budczies J, Kluck K, Stenzinger A, Sinicrope FA. Tumor mutational burden as a predictive biomarker in solid tumors. Cancer Discovery (2020) 10:1808–25. doi: 10.1158/2159-8290.CD-20-0522
70. Wang F, Zhao Q, Wang Y-N, Jin Y, He M-M, Liu Z-X, et al. Evaluation of POLE and POLD1 mutations as biomarkers for immunotherapy outcomes across multiple cancer types. JAMA Oncol (2019) 5:1504–6. doi: 10.1001/jamaoncol.2019.2963
71. Chen J-M, Férec C, Cooper DN. Patterns and mutational signatures of tandem base substitutions causing human inherited disease. Hum Mutat (2013) 34:1119–30. doi: 10.1002/humu.22341
72. Kucab JE, Zou X, Morganella S, Joel M, Nanda AS, Nagy E, et al. A compendium of mutational signatures of environmental agents. Cell (2019) 177:821–836.e16. doi: 10.1016/j.cell.2019.03.001
73. Menzies AM, Haydu LE, Visintin L, Carlino MS, Howle JR, Thompson JF, et al. Distinguishing clinicopathologic features of patients with V600E and V600K BRAF-mutant metastatic melanoma. Clin Cancer Res Off J Am Assoc Cancer Res (2012) 18:3242–9. doi: 10.1158/1078-0432.CCR-12-0052
74. Mermel CH, Schumacher SE, Hill B, Meyerson ML, Beroukhim R, Getz G. GISTIC2.0 facilitates sensitive and confident localization of the targets of focal somatic copy-number alteration in human cancers. Genome Biol (2011) 12:R41. doi: 10.1186/gb-2011-12-4-r41
75. Guan J, Gupta R, Filipp FV. Cancer systems biology of TCGA SKCM: Efficient detection of genomic drivers in melanoma. Sci Rep (2015) 5:7857. doi: 10.1038/srep07857
76. Yarchoan M, Albacker LA, Hopkins AC, Montesion M, Murugesan K, Vithayathil TT, et al. PD-L1 expression and tumor mutational burden are independent biomarkers in most cancers. JCI Insight (2019) 4:126908. doi: 10.1172/jci.insight.126908
77. Rooney MS, Shukla SA, Wu CJ, Getz G, Hacohen N. Molecular and genetic properties of tumors associated with local immune cytolytic activity. Cell (2015) 160:48–61. doi: 10.1016/j.cell.2014.12.033
78. McGrail DJ, Pilié PG, Rashid NU, Voorwerk L, Slagter M, Kok M, et al. High tumor mutation burden fails to predict immune checkpoint blockade response across all cancer types. Ann Oncol Off J Eur Soc Med Oncol (2021) 32:661–72. doi: 10.1016/j.annonc.2021.02.006
79. Klein S, Mauch C, Brinker K, Noh K-W, Knez S, Büttner R, et al. Tumor infiltrating lymphocyte clusters are associated with response to immune checkpoint inhibition in BRAF V600E/K mutated malignant melanomas. Sci Rep (2021) 11:1834. doi: 10.1038/s41598-021-81330-4
80. Liu M, Wang X, Wang L, Ma X, Gong Z, Zhang S, et al. Targeting the IDO1 pathway in cancer: From bench to bedside. J Hematol OncolJ Hematol Oncol (2018) 11:100. doi: 10.1186/s13045-018-0644-y
81. Platten M, Wick W, Van den Eynde BJ. Tryptophan catabolism in cancer: Beyond IDO and tryptophan depletion. Cancer Res (2012) 72:5435–40. doi: 10.1158/0008-5472.CAN-12-0569
82. Degenhardt Y, Huang J, Greshock J, Horiates G, Nathanson K, Yang X, et al. Distinct MHC gene expression patterns during progression of melanoma. Genes Chromosomes Cancer (2010) 49:144–54. doi: 10.1002/gcc.20728
83. Meyer S, Handke D, Mueller A, Biehl K, Kreuz M, Bukur J, et al. Distinct molecular mechanisms of altered HLA class II expression in malignant melanoma. Cancers (2021) 13:3907. doi: 10.3390/cancers13153907
84. Wang Y, Tong Z, Zhang W, Zhang W, Buzdin A, Mu X, et al. FDA-Approved and emerging next generation predictive biomarkers for immune checkpoint inhibitors in cancer patients. Front Oncol (2021) 11:683419. doi: 10.3389/fonc.2021.683419
85. Daud AI, Loo K, Pauli ML, Sanchez-Rodriguez R, Sandoval PM, Taravati K, et al. Tumor immune profiling predicts response to anti-PD-1 therapy in human melanoma. J Clin Invest (2016) 126:3447–52. doi: 10.1172/JCI87324
86. Snyder A, Makarov V, Merghoub T, Yuan J, Zaretsky JM, Desrichard A, et al. Genetic basis for clinical response to CTLA-4 blockade in melanoma. N Engl J Med (2014) 371:2189–99. doi: 10.1056/NEJMoa1406498
87. Hellmann MD, Ciuleanu T-E, Pluzanski A, Lee JS, Otterson GA, Audigier-Valette C, et al. Nivolumab plus ipilimumab in lung cancer with a high tumor mutational burden. N Engl J Med (2018) 378:2093–104. doi: 10.1056/NEJMoa1801946
88. Marabelle A, Fakih M, Lopez J, Shah M, Shapira-Frommer R, Nakagawa K, et al. Association of tumour mutational burden with outcomes in patients with advanced solid tumours treated with pembrolizumab: Prospective biomarker analysis of the multicohort, open-label, phase 2 KEYNOTE-158 study. Lancet Oncol (2020) 21:1353–65. doi: 10.1016/S1470-2045(20)30445-9
89. Klempner SJ, Fabrizio D, Bane S, Reinhart M, Peoples T, Ali SM, et al. Tumor mutational burden as a predictive biomarker for response to immune checkpoint inhibitors: A review of current evidence. Oncologist (2020) 25:e147–59. doi: 10.1634/theoncologist.2019-0244
90. Raskov H, Orhan A, Christensen JP, Gögenur I. Cytotoxic CD8+ T cells in cancer and cancer immunotherapy. Br J Cancer (2021) 124:359–67. doi: 10.1038/s41416-020-01048-4
91. Wellenstein MD, de Visser KE. Cancer-Cell-Intrinsic mechanisms shaping the tumor immune landscape. Immunity (2018) 48:399–416. doi: 10.1016/j.immuni.2018.03.004
92. Ribas A, Puzanov I, Dummer R, Schadendorf D, Hamid O, Robert C, et al. Pembrolizumab versus investigator-choice chemotherapy for ipilimumab-refractory melanoma (KEYNOTE-002): A randomised, controlled, phase 2 trial. Lancet Oncol (2015) 16:908–18. doi: 10.1016/S1470-2045(15)00083-2
93. Robert C, Schachter J, Long GV, Arance A, Grob JJ, Mortier L, et al. Pembrolizumab versus ipilimumab in advanced melanoma. N Engl J Med (2015) 372:2521–32. doi: 10.1056/NEJMoa1503093
94. Robert C, Long GV, Brady B, Dutriaux C, Maio M, Mortier L, et al. Nivolumab in previously untreated melanoma without BRAF mutation. N Engl J Med (2015) 372:320–30. doi: 10.1056/NEJMoa1412082
95. Iorgulescu JB, Harary M, Zogg CK, Ligon KL, Reardon DA, Hodi FS, et al. Improved risk-adjusted survival for melanoma brain metastases in the era of checkpoint blockade immunotherapies: Results from a national cohort. Cancer Immunol Res (2018) 6:1039–45. doi: 10.1158/2326-6066.CIR-18-0067
96. Cristescu R, Mogg R, Ayers M, Albright A, Murphy E, Yearley J, et al. Pan-tumor genomic biomarkers for PD-1 checkpoint blockade-based immunotherapy. Science (2018) 362:eaar3593. doi: 10.1126/science.aar3593
97. Anagnostou V, Bruhm DC, Niknafs N, White JR, Shao XM, Sidhom JW, et al. Integrative tumor and immune cell multi-omic analyses predict response to immune checkpoint blockade in melanoma. Cell Rep Med (2020) 1:100139. doi: 10.1016/j.xcrm.2020.100139
98. Topalian SL, Drake CG, Pardoll DM. Immune checkpoint blockade: A common denominator approach to cancer therapy. Cancer Cell (2015) 27:450–61. doi: 10.1016/j.ccell.2015.03.001
99. Pardoll DM. The blockade of immune checkpoints in cancer immunotherapy. Nat Rev Cancer (2012) 12:252–64. doi: 10.1038/nrc3239
100. Sharma P, Allison JP. The future of immune checkpoint therapy. Science (2015) 348:56–61. doi: 10.1126/science.aaa8172
101. Tawbi HA, Schadendorf D, Lipson EJ, Ascierto PA, Matamala L, Castillo Gutiérrez E, et al. Relatlimab and nivolumab versus nivolumab in untreated advanced melanoma. N Engl J Med (2022) 386:24–34. doi: 10.1056/NEJMoa2109970
102. Brown SD, Warren RL, Gibb EA, Martin SD, Spinelli JJ, Nelson BH, et al. Neo-antigens predicted by tumor genome meta-analysis correlate with increased patient survival. Genome Res (2014) 24:743–50. doi: 10.1101/gr.165985.113
103. Slansky JE, Spellman PT. Alternative splicing in tumors - a path to immunogenicity? N Engl J Med (2019) 380:877–80. doi: 10.1056/NEJMcibr1814237
104. Tau GZ, Cowan SN, Weisburg J, Braunstein NS, Rothman PB. Regulation of IFN-gamma signaling is essential for the cytotoxic activity of CD8(+) T cells. J Immunol Baltim Md 1950 (2001) 167:5574–82. doi: 10.4049/jimmunol.167.10.5574
105. Maimela NR, Liu S, Zhang Y. Fates of CD8+ T cells in tumor microenvironment. Comput Struct Biotechnol J (2019) 17:1–13. doi: 10.1016/j.csbj.2018.11.004
106. Mojic M, Takeda K, Hayakawa Y. The dark side of IFN-γ: Its role in promoting cancer immunoevasion. Int J Mol Sci (2017) 19:E89. doi: 10.3390/ijms19010089
107. Angelova M, Charoentong P, Hackl H, Fischer ML, Snajder R, Krogsdam AM, et al. Characterization of the immunophenotypes and antigenomes of colorectal cancers reveals distinct tumor escape mechanisms and novel targets for immunotherapy. Genome Biol (2015) 16:64. doi: 10.1186/s13059-015-0620-6
108. Zaidi MR, Davis S, Noonan FP, Graff-Cherry C, Hawley TS, Walker RL, et al. Interferon-γ links ultraviolet radiation to melanomagenesis in mice. Nature (2011) 469:548–53. doi: 10.1038/nature09666
109. Jorgovanovic D, Song M, Wang L, Zhang Y. Roles of IFN-γ in tumor progression and regression: A review. biomark Res (2020) 8:49. doi: 10.1186/s40364-020-00228-x
110. Holmgaard RB, Zamarin D, Li Y, Gasmi B, Munn DH, Allison JP, et al. Tumor-expressed IDO recruits and activates MDSCs in a treg-dependent manner. Cell Rep (2015) 13:412–24. doi: 10.1016/j.celrep.2015.08.077
111. Platanias LC. Mechanisms of type-i- and type-II-interferon-mediated signalling. Nat Rev Immunol (2005) 5:375–86. doi: 10.1038/nri1604
112. Patel H, Nilendu P, Jahagirdar D, Pal JK, Sharma NK. Modulating secreted components of tumor microenvironment: A masterstroke in tumor therapeutics. Cancer Biol Ther (2018) 19:3–12. doi: 10.1080/15384047.2017.1394538
113. Highfill SL, Cui Y, Giles AJ, Smith JP, Zhang H, Morse E, et al. Disruption of CXCR2-mediated MDSC tumor trafficking enhances anti-PD1 efficacy. Sci Transl Med (2014) 6:237ra67. doi: 10.1126/scitranslmed.3007974
Keywords: skin melanoma, tumor mutation burden (TMB), immune signatures, immune checkpoint inhibition therapy, patient response, tumor-infiltrating lymphocytes, tumor microenvironment
Citation: Georgoulias G and Zaravinos A (2022) Genomic landscape of the immunogenicity regulation in skin melanomas with diverse tumor mutation burden. Front. Immunol. 13:1006665. doi: 10.3389/fimmu.2022.1006665
Received: 29 July 2022; Accepted: 10 October 2022;
Published: 28 October 2022.
Edited by:
Beatriz Martín-Antonio, University Hospital Fundación Jiménez Díaz, SpainReviewed by:
Chi Yan, Henan Provincial Cancer Hospital, ChinaBenjamin Bonavida, University of California, Los Angeles, United States
Copyright © 2022 Georgoulias and Zaravinos. This is an open-access article distributed under the terms of the Creative Commons Attribution License (CC BY). The use, distribution or reproduction in other forums is permitted, provided the original author(s) and the copyright owner(s) are credited and that the original publication in this journal is cited, in accordance with accepted academic practice. No use, distribution or reproduction is permitted which does not comply with these terms.
*Correspondence: Apostolos Zaravinos, YS56YXJhdmlub3NAZXVjLmFjLmN5
†ORCID: George Georgoulias, orcid.org/0000-0002-7402-334X
Apostolos Zaravinos, orcid.org/0000-0003-4625-5562