 Cheng Wei1†
 Bo Wang1†Dazhao Peng1†
 Xiaoyang Zhang1Zesheng Li1
 Lin Luo2Yingjie He3Hao Liang1Xuezhi Du3Shenghui Li1Shu Zhang1Zhenyu Zhang2*
 Lei Han1*Jianning Zhang1*
- 1Tianjin Neurological Institute, Key Laboratory of Post-Neuroinjury Neuro-repair and Regeneration in Central Nervous System, Ministry of Education and Tianjin City, Tianjin Medical University General Hospital, Tianjin, China
- 2Department of Neurosurgery, The First Affiliated Hospital of Zhengzhou University, Zhengzhou, China
- 3Department of Hepatopancreatobiliary Surgery, The Second Hospital of Tianjin Medical University, Tianjin, China
Background: AlkB homolog 5 (ALKBH5) is a N6-methyladenosine (m6A) demethylase associated with the development, growth, and progression of multiple cancer types. However, the biological role of ALKBH5 has not been investigated in pan-cancer datasets. Therefore, in this study, comprehensive bioinformatics analysis of pan-cancer datasets was performed to determine the mechanisms through which ALKBH5 regulates tumorigenesis.
Methods: Online websites and databases such as NCBI, UCSC, CCLE, HPA, TIMER2, GEPIA2, cBioPortal, UALCAN, STRING, SangerBox, ImmuCellAl, xCell, and GenePattern were used to extract data of ALKBH5 in multiple cancers. The pan-cancer patient datasets were analyzed to determine the relationship between ALKBH5 expression, genetic alterations, methylation status, and tumor immunity. Targetscan, miRWalk, miRDB, miRabel, LncBase databases and Cytoscape tool were used to identify microRNAs (miRNAs) and long non-coding RNAs (lncRNAs) that regulate expression of ALKBH5 and construct the lncRNA-miRNA-ALKBH5 network. In vitro CCK-8, wound healing, Transwell and M2 macrophage infiltration assays as well as in vivo xenograft animal experiments were performed to determine the biological functions of ALKBH5 in glioma cells.
Results: The pan-cancer analysis showed that ALKBH5 was upregulated in several solid tumors. ALKBH5 expression significantly correlated with the prognosis of cancer patients. Genetic alterations including duplications and deep mutations of the ALKBH5 gene were identified in several cancer types. Alterations in the ALKBH5 gene correlated with tumor prognosis. GO and KEGG enrichment analyses showed that ALKBH5-related genes were enriched in the inflammatory, metabolic, and immune signaling pathways in glioma. ALKBH5 expression correlated with the expression of immune checkpoint (ICP) genes, and influenced sensitivity to immunotherapy. We constructed a lncRNA-miRNA network that regulates ALKBH5 expression in tumor development and progression. In vitro and in vivo experiments showed that ALKBH5 promoted proliferation, migration, and invasion of glioma cells and recruited the M2 macrophage to glioma cells.
Conclusions: ALKBH5 was overexpressed in multiple cancer types and promoted the development and progression of cancers through several mechanisms including regulation of the tumor-infiltration of immune cells. Our study shows that ALKBH5 is a promising prognostic and immunotherapeutic biomarker in some malignant tumors.
Introduction
Nucleoside modifications affect the biological functions and stability of the RNA molecules. According to MODOMICS, the database of RNA modifications, 163 different nucleoside modifications have been reported for RNA molecules in all organisms (1). The most abundant RNA modification is N6-methyladenosine (m6A), which involves methylation of the 6th nitrogen atom of the adenine (A) molecule in either messenger RNAs (mRNAs) or non-coding RNAs (ncRNAs) (2, 3). The m6A modification is catalyzed by the m6A methylation writer complex consisting of several proteins including METTL3 and METTL14, and is reversed by demethylase erasers such as FTO and ALKBH5 (4). The m6A modification is recognized by m6A reader proteins belonging to the YTHDF and YTHDC protein families, and modulates translation, localization, mRNA splicing, or stability of the modified mRNA or ncRNA (5). Several studies have shown that aberrant regulation of m6A RNA modifications is associated with the development and progression of various cancers (6–8).
AlkB homolog 5 (ALKBH5) is a widely reported m6A RNA demethylase that belongs to the AlkB family of DNA and RNA demethylases, which mediates the repair of N-alkylated nucleobases by oxidative demethylation and consists of 9 mammalian homologs (9). The full-length ALKBH5 has 394 amino acids and ALKBH5 mainly locates on nuclear speckles that facilitate the assembly of mRNA-processing factors, which sustains the view that nuclear nascent RNAs are the main substrates of ALKBH5. ALKBH5 plays a significant role in several biological processes such as cell proliferation, osteogenesis, spermatogenesis, and ossification (10–13). ALKBH5 also plays an oncogenic or tumor suppressive role in different kinds of cancers, such as breast cancer, glioblastoma, ovarian cancer, lung cancer, liver cancer, pancreatic cancer, gastrointestinal cancer, acute myeloid leukemia (AML) and osteosarcoma (14–20). On the one hand, breast cancer stem cell (BCSC) phenotype could be induced by hypoxia through HIF-dependent and ALKBH5-mediated regulation of NANOG mRNA (14). And ALKBH5 was highly expressed in glioblastoma stem-like cells (GSCs) and maintained tumorigenic activity of GSCs via maintaining FOXM1 expression and cell proliferation program (15). Hu et al. found that ALKBH5 promoted epithelial ovarian cancer cell proliferation and invasion by inhibiting autophagy through miR-7 and Bcl-2 (16). Chen et al. discovered that ALKBH5 was essential for the development and maintenance of AML and the self-renewal of leukemia stem/initiating cells (LSCs/LICs), and ALKBH5 played a tumorigenic role in AML through post-transcriptional regulation of its key targets, such as TACC3 (21). On the other hand, ALKBH5 inhibited tumor growth and metastasis via decreasing YTHDFs-mediated YAP expression and suppressing miR-107/LATS2-mediated YAP activity (17). Zheng et al. found that ALKBH5-mediated m6A demethylation led to post-transcriptional inhibition of LY6/PLAUR Domain Containing 1 (LYPD1), which inhibited malignant progression of hepatocellular carcinoma (22). In osteosarcoma, ALKBH5 could inhibit tumor progression through epigenetic silencing of m6A-dependent pre-miR-181B-1/YAP signaling pathway (20). Furthermore, Tariq M Rana revealed that ALKBH5 regulated the response of anti-PD-1 therapy by regulating lactate in tumor microenvironment and inhibiting immune cell recruitment (23). These results indicate that altered ALKBH5 expression could both promote and suppress carcinogenesis based on cancer type and ALKBH5 acts as a significant role in tumor immune microenvironment. At present, there are few systematic studies on ALKBH5 in pan-cancer, especially in glioma.
In this study, we performed systematic bioinformatics analysis to determine the biological functions and prognostic significance of ALKBH5 in several cancers using the patient data in multiple databases. The functional significance of altered expression levels of ALKBH5 was comprehensively investigated in various cancers in regard to prognosis, genetic alterations, expression levels of ALKBH5-related genes, tumor immunity, and the lncRNA-miRNA network regulating ALKBH5 expression. We also specifically analyzed the relationship between ALKBH5 expression and the growth and progression of gliomas using both in vitro and in vivo models.
Materials and Methods
Analysis of ALKBH5 Gene and Protein Expression
The Human Protein Atlas (HPA) online website (https://www.proteinatlas.org/) was used to analyze ALKBH5 in “Tissue Atlas”. The expression data of ALKBH5 gene in different human normal tissues were obtained (24). The row data source was TMM normalized. Normalized eXpression (NX), the resulting transcript expression values, were calculated for each gene in every sample. Online website (https://www.proteinatlas.org/about/assays+annotation) showed the detailed information. NX ≥ 1 was regarded as “Low specificity” in at least one tissue, but not increased in other tissue. Then, the Cancer Genome Atlas (TCGA) cohort was used to analyze ALKBH5 expression in 33 tumors, including adrenocortical carcinoma (ACC), bladder urothelial carcinoma (BLCA), breast invasive carcinoma (BRCA), cervical squamous cell carcinoma and endocervical adenocarcinoma (CESC), cholangiocarcinoma (CHOL), colon adenocarcinoma (COAD), lymphoid neoplasm diffuse large B-cell lymphoma (DLBC), esophageal carcinoma (ESCA), glioblastoma multiforme (GBM), head and neck cancer (HNSC), kidney chromophobe (KICH), kidney renal clear cell carcinoma (KIRC), kidney renal papillary cell carcinoma (KIRP), acute myeloid leukemia (LAML), brain lower grade glioma (LGG), liver hepatocellular carcinoma (LIHC), lung adenocarcinoma (LUAD), lung squamous cell carcinoma (LUSC), Mesothelioma (MESO), ovarian serous cystadenocarcinoma (OV), pancreatic adenocarcinoma (PAAD), pheochromocytoma and paraganglioma (PCPG), prostate adenocarcinoma (PRAD), rectum adenocarcinoma (READ), sarcoma (SARC), skin cutaneous melanoma (SKCM), stomach adenocarcinoma (STAD), testicular germ cell tumors (TGCT), thyroid carcinoma (THCA), thymoma (THYM), uterine corpus endometrial carcinoma (UCEC), uterine carcinosarcoma (UCS) and uveal melanoma (UVM) via Gene Expression Profiling Interactive Analysis 2.0 (GEPIA2) (http://gepia2.cancer-pku.cn/#index) (25). All abbreviations showed in Supplementary Table 1. Using TCGA combined with Genotype Tissue Expression (GTEx) cohort, ALKBH5 expression was analyzed between tumors and corresponding normal tissues in 27 tumors via SangerBox (http://SangerBox.com/Tool) (26). ALKBH5 mRNA expression data of glioma with different gardes, subtypes and new types (oligodendroglioma, astrocytoma and glioblastoma) were obtained from the Chinese Glioma Genome Atlas (CGGA) (http://www.cgga.org.cn; dataset ID: mRNAseq_325 and mRNAseq_693) and TCGA databases.
Moreover, RNA-Seq data (lllumina HiSeq X Ten, Novogene) and corresponding pathological and clinical data of external 100 glioma samples were obtained to further validate the correlation between ALKBH5 mRNA expression and glioma grades or prognosis. All human glioma samples were taken from patients undergoing surgery at the First Affiliated Hospital of Zhengzhou University. Tissue samples were graded by neuropathologists according to World Health Organization (WHO) standards and stored in liquid nitrogen. Glioma specimens were divided into grade II (30 cases), grade III (20 cases) and grade IV (50 cases). Histological and clinical data of glioma specimens are shown in Supplementary Table 2. This study was approved by the institutional review boards of the hospital and obtained written informed consent from all patients.
In addition, the ALKBH5 protein expression data for 44 tissues under physiological conditions were obtained in HPA portal. The subcellular localization information of ALKBH5 was obtained using the Cell Atlas module. The conserved functional domains of ALKBH5 proteins were analyzed in different species using “HomoloGene” function of NCBI database. The expression levels of ALKBH5 protein were also analyzed in Clinical Proteomic Tumor Analysis Consortium (CPTAC) module via UALCAN portal (http://ualcan.path.uab.edu/index.html) (27). The CPTAC database normalized the expression values in each proteome data to the standard deviation of the median. The total ALKBH5 protein expression level was compared between tumors and normal tissues via retrieving “ALKBH5”. Five available data sets for tumors were selected, including OV, breast cancer, clear cell RCC (ccRCC), lung adenocarcinoma and UCEC.
Survival Prognosis Analysis
The overall survival (OS) and disease-free survival (DFS) survival map data for ALKBH5 in various tumor types in TCGA database were obtained via GEPIA2 online website. The high-expression and low-expression cohorts of ALKBH5 was obtained through the expression threshold of the cutoff-high (50%) and cutoff-low (50%) values. The “Survival Analysis” module of GEPIA2 was used to analyze special survival plots with log-rank P-values.
Then, the COX_OS (overall survival) and COX_DSS (disease specific survival) analysis data of ALKBH5 for different tumors was analyzed on SangerBox portal. In Kaplan-Meier Plotter website (https://kmplot.com/analysis/), the relationship between ALKBH5 expression and prognosis of tumor patients, such as OS, progression free survival (PFS), first progression (FP), post progression survival (PPS) and relapse free survival (RFS), was analyzed (28). The Kaplan-Meier survival plots of ovarian, lung, gastric and liver cancer cases were generated in the “mRNA gene chip” and “mRNA RNA-seq” modules. The log-rank P-value, hazard ratio (HR) and 95% confidence intervals were computed. Through CGGA mRNAseq_325 (CGGA_325), CGGA mRNAseq_693 (CGGA_693) and TCGA mRNAseq databases, the relationship between ALKBH5 and overall survival of glioma patients in primary glioma, recurrent glioma, LGG (WHO I-III) and GBM (WHO IV) was analyzed. Through these three databases, the relationship between ALKBH5 expression and prognosis in IDH mut+1p/19q codeletion, IDH mut+1p/19q noncodeletion and IDH wild groups was analyzed in glioma. The relationship between ALKBH5 expression and prognosis in IDH status, 1p/19q codeletion status and MGMT promoter status was also analyzed in glioma via CGGA_325 and CGGA _693 datasets. Cox regression analysis of CGGA_325 combined with CGGA _693 and TCGA datasets in glioma was performed via SPSS and nomogram was used to visualize the results via SangerBox.
Genetic Alteration Analysis
Firstly, the genetic mutation ratios of ALKBH5 in various tumors was explored via the “Gene_Mutation” module of the Tumor Immune Estimation Resource 2.0 (TIMER2) website (http://timer.cistrome.org/) (29). The row data represented the percentages of ALKBH5 mutation in tumors.
Then, the characteristics of ALKBH5 genetic alterations were explored by the online cBioPortal database (https://www.cbioportal.org/) (30). TCGA Pan Cancer Atlas Studies in the “Quick select” section was selected for query. The mutation type, alteration frequency, and copy number alteration (CNA) data were observed across TCGA tumor datasets in the “Cancer Types Summary” module.
Databases of somatic mutations and somatic copy number alternations (CNAs) were obtained from TCGA datasets. CNAs correlated with ALKBH5 expression, and the threshold copy number at alteration peaks were analyzed by GISTIC 2.0 (https://cloud.genepattern.org/) (31). The patients were divided into the first 25% ALKBH5high (n=166) and the last 25% ALKBH5low (n=166) groups according to the expression value of ALKBH5. The maftools package was also used in R software (https://www.r-project.org/) to download and visualize the somatic mutations of patients with 25% ALKBH5high and 25% ALKBH5low glioma across TCGA databases (32).
ALKBH5-Related Gene Enrichment Analysis
Through searching the STRING website (https://string-db.org/), “ALKBH5” was queried in the “protein name” module and “Homo sapiens” in the organism module (33). The following main parameters was set: meaning of network edges (“evidence”), minimum required interaction score [“low confidence (0.150)”], active interaction sources (“experiments” and “database”) and maximum number of interactors to show (“no more than 50 interactors” in the 1st shell). The available ALKBH5-binding proteins was analyzed. Then, the top 10 ALKBH5-associated targeting genes in TCGA tumors were generated by the “Similar Gene Detection” module of GEPIA2. The “correlation analysis” module of GEPIA2 was used to explore the correlation between ALKBH5 and these 10 ALKBH5-associated targeting genes. The P-value and the correlation coefficient (R) were generated. The correlation scatter plot of 10 genes was generated via the log2 TPM. We obtained a heatmap of these top 9 targeting genes via the “Gene_Corr” function of TIMER2.
Analyses of ALKBH5 related genes in CGGA_325, CGGA_693 and TCGA databases were performed using R package. The first 100 genes positively or negatively correlated with ALKBH5 expression were screened in CGGA_325, CGGA_693 and TCGA databases, and a total of 200 genes were used for subsequent analysis. SangerBox portal was used to analyze and map the results of GO-BP analysis of ALKBH5 related genes in glioma. Then, GSE93054 database (https://www.ncbi.nlm.nih.gov/geo/query/acc.cgi?acc=GSE93054) was used to analyze the biological functions of ALKBH5 related genes in glioma stem cells (GSCs). In GSC11 and GSC17 cells, 3032 and 5158 differentially expressed genes were found after knockdown ALKBH5, respectively. Among them, 1150 differentially expressed genes were intersected within GSC11 and GSC17 cell lines. GO-BP and KEGG enrichment analyses of ALKBH5 related genes was analyzed and mapped in glioma by SangerBox portal.
Analysis of Immune Cell Infiltration
The relationships between ALKBH5 expression and ESTIMATE score and tumor infiltration immune cells (TIICs) in multiple tumors were explored via the SangerBox website, including CD4+ T cells, CD8+ T cells, B cells, neutrophils, macrophages, etc. XCell (https://xcell.ucsf.edu/) and ImmuCellAI (http://bioinfo.life.hust.edu.cn/ImmuCellAI#!/) portals were used to analyze the relationship between ALKBH5 expression and immune-related cells in glioma via CGGA_325, CGGA_693 and TCGA datasets (34, 35).
Metagene analysis was performed with gene set variation analysis (GSVA) using the R package GSVA. Metagenes included HCK, IgG, Interferon, LCK, MHC-I, MHC-II and STAT1 clusters (Supplementary Table 3). The relationships between ALKBH5 expression and microsatellite instability (MSI), tumor mutation burden (TMB), Neoantigens and immune checkpoint (ICP) in different tumors from TCGA cohorts were investigated via the SangerBox website. These checkpoint genes included ADORA2A, BTLA, BTNL2, CD160, CD200, CTLA4, HHLA2, ICOS, IDO1, LAG3, PDCD1, TNFRSF14, VTCN1, etc. Spearman’s rank correlation test was performed, and the partial correlation (cor) and P-value were generated. Details of immune checkpoint receptor and ligand genes shown in Supplementary Table 4.
LncRNA-miRNA-ALKBH5 Regulatory Network Analysis
Upstream binding miRNAs of ALKBH5 were predicted by several target gene prediction programs, consisting of miRWalk (http://mirwalk.umm.uni-heidelberg.de/), miRDB (http://mirdb.org/), miRabel and TargetScan (http://www.targetscan.org/vert_72/) (36–39). Only the 49 predicted miRNAs that appeared in these four programs were included for subsequent analyses. Then, top 10 miRNAs ranked in TargetScan program were regarded as candidate miRNAs of ALKBH5, including miR-4732-5p, miR-193a-3p, miR-362-3p, miR-193b-3p, miR-589-5p, miR-4736, miR-6840-3p, miR-329-3p, miR-5008-5p and miR-6132. The CGGA microRNA_array_198 cohort was used to analyze the clinical features of the top 10 miRNAs. In addition, upstream target lncRNAs by miRNA screened were predicted and analyzed in “Experimental module” and “Prediction module” via LncBase database (http://carolina.imis.athena-innovation.gr/diana_tools/web/index.php?r=lncba sev2%2Findex) (40). Subsequently, Cytoscape software was applied to visualize the lncRNA-miRNA-ALKBH5 regulatory network.
Cell Lines and Culture
Human astrocytes (HA) and human glioma cell lines (U87, LN229, U251, A172 and B19) were obtained from ATCC (American Type Culture Collection, Manassas, VA, USA). Human THP-1 cells were purchased from the Shanghai Cell Bank of the Chinese Academy of Sciences (Shanghai, China). All cell line authentication service was applied and mycoplasma was also routinely tested. Astrocyte medium (AM) (Cat. #1801, ScienCell, USA) was used to culture human astrocytes, supplemented with 10 mL of fetal bovine serum (FBS) (Cat. #0010, ScienCell, USA), 5 mL of penicillin/streptomycin solution (P/S) (Cat. #0503, ScienCell, USA) and 5 mL of Astrocyte Growth Supplement (AGS) (Cat. #1852, ScienCell, USA). The glioma cell lines were cultured in DMEM Medium (Dulbecco’s Modified Eagle Medium, Gibco, USA) and THP-1 cells were cultured in RPMI 1640 medium with 10% FBS (FBS, BI serum, Israel) and cultured in a 37°C constant temperature incubator containing 5% CO2.
SiRNAs or Plasmids Delivery, Total RNA Isolation, Reverse Transcription and Quantitative Real-Time Polymerase Chain Reaction
The ALKBH5 siRNAs were purchased from Shanghai GenePharma Co., Ltd. SiRNAs were applied to knockdown the expression of ALKBH5 in U87 and U251 cell lines and transfected via Lipofectamine ™ RNAiMax (13778150, Thermo Fisher Scientific, USA) reagent. The ALKBH5 overexpression plasmids (pEGFP-C1B-ALKBH5) were kindly supplied by professor Xudong Wu (Tianjin Medical University, China) and transfected into cell lines via Lipofectamine 3000. RT-qPCR was applied to detect the efficiency of ALKBH5 knockdown or overexpression. Glioma cells were planted in 6-well plates, 5μL Lipofectamine ™ RNAiMAX and 40 pmol siRNA were mixed in each well for 5 min. Then, mixture was added into the cells for transfection. After transfection, the cells were replaced with full medium at 24h. The cells were collected after 48h. The total RNA was extracted with TRIzol reagent (Thermo Fisher Scientific, Inc.). The GoScript reverse transcription system (Promega Corporation) was used to synthesize cDNA. The mRNA expression status was detected via GoTaq®qPCR Master Mix (Promega Corporation) on ABI QuantStudio 3. GAPDH was applied as an internal control. The oligonucleotide primers used for quantitative PCR were as follows: ALKBH5, 5’- GGACCCCATCCACATCTTCG-3’ forward and 5’-GGCCGTATG CAGTGAGTGAT-3’ reverse; GAPDH, 5’-GGTGGTCTCCTCTGACTTCAACA-3’ forward and 5’-GTTGCTGTAGCCAAA TTCGTTGT-3’ reverse. The following PCR program was used: 95˚C for 10 min, 40 cycles of amplification (15 sec at 95˚C, 40 sec at 60˚C and 1 min at 72˚C) and a final extension step (72˚C for 2 min). All PCR experiments were performed in triplicate. The siRNA sequences were shown below: siALKBH5#1, 5’-CUGCGCAACAAGUACUUCUTT-3’sense and 5’-AGAAGUACUUGUUG CGCAGTT-3’ antisense; siALKBH5#2, 5’-CCUCAGGAAGACAA GAUUATT-3’sense and 5’-UAAUCUUGUCUUCCUGAGGTT-3’ antisense; negative control (NC), 5’-UUCUCCGAACGUG UCACGUTT-3’sense and 5’-ACGUGACACGUUCGGAGAATT-3’ antisense.
CCK-8 Experiment
The CCK-8 reagent was purchased from APExBIO (USA). The 2×10³ cells were seeded into 96-well plates in advance. The test was started 24 hours later and lasted for 6 consecutive days (0, 1, 2, 3, 4, 5, 6 days). The medium was absorbed and discarded, and CCK-8 reagent was mixed with serum-free medium in a 5ml eppendorf tube (CCK8 reagent: Serum-free medium =10 μL: 90 μL per well) and added into 96-well plates with 100 μL per well. OD value at 450 wavelength was detected on a microplate after incubation at 37°C for 1h.
Wound Healing and Transwell Experiments
Wound healing assay: According to the density of 2.5×10⁵ cells per well, U87, U251 and LN229 cells were inoculated in the 6-well plate. Then, siALKBH5#1, siALKBH5#2 or ALKBH5 plasmids were transfected into the 6-well plate. After 24 h, 200 μL pipetting head was used to scratch the cells in the plate and the serum-free medium was replaced to collect images under an inverted microscope (IX81, Olympus Company, Japan) at 0 h, 12h and 24 h.
Transwell assay: The upper chamber of Transwell assay was coated with a layer of Matrigel matrix glue (Corning Company, USA) (matrix glue: Serum-free medium=1:4). Then, the cells were resuspended and counted using serum-free medium. The cells were seeded into the upper chamber at a density of 5×10⁴, and the lower chamber was added 500 μL full medium. After 24h, the cells were fixated with 4% paraformaldehyde for 10 min, 1% crystal violet was used to staining cells for 10 s. The remaining cells in the upper chamber were slightly wiped off, and images were collected under a positive microscope (BX53, Olympus Company, Japan). In addition, the number of cells passing through the chamber was counted in four random fields under the microscope.
M2 Macrophage Infiltration Assay
THP-1 cells were differentiated into macrophages induced by 150 nM phorbol 12-myristate 13-acetate (PMA; Sigma, USA) with 24 h. Then, macrophage M2 polarization was obtained by incubation with 20 ng/ml of interleukin 4 (R&D Systems, #204-IL) and 20 ng/ml of interleukin 13 (R&D Systems, #213-ILB) for 48 h. M2 macrophage infiltration assays were applied through seeding 1.0×10⁵ M2 macrophage cells (300μl) without serum in the upper chamber of a Transwell plate for 48 h (size 5mm, Corning, NY, USA). In bottom plate, U87 and U251 glioma cells (1.0×10⁵) were cultured with10% FBS in DMEM (700μl). After incubation for 48 h, the cells in the upper chamber were fixed with 4% paraformaldehyde for 10 min and stained with 0.1% crystal violet for 10s. The infiltrated M2 macrophage cells were counted in three randomly selected fields from each membrane.
Subcutaneous Xenograft Experiment
All mouse experiments were conducted in accordance with protocols approved by the Tianjin medical university animal care and use committee and followed guidelines for animal welfare. Four-week-old BALB/c female nude mice were purchased from Beijing HFK Bioscience Co.,LTD. The tumor masses were subcutaneously embedded in nude mice and the nude mice were randomly divided into two groups (n=5) when the tumor masses grew to 4 to 5mm in diameter. These two groups were control group and siALKBH5 group. After that, tumor volumes were measured every 2 days and ALKBH5 siRNA were injected into the siALKBH5 group at a dose of 10 μL of siRNA versus 10 μL of Lipofectamine ™ 3000 per nude mouse. After 21 days, mice were euthanatized, subcutaneous tumors were removed and images were collected. The tumor volume was calculated with the formula Volume= (length × width2)/2.
Statistical Analysis
Through the online databases mentioned above, the statistical analysis was automatically computed in this study. These results were considered as statistically significant at *P<0.05, **P<0.01, ***P<0.001 and ****P<0.0001.
Results
ALKBH5 Expression Is Upregulated in Multiple Tumors Including Gliomas
The flowchart of this study is shown in Supplementary Figure 1. The normalized expression (NX) levels of ALKBH5 were analyzed in various tumor tissues and their corresponding adjacent normal tissues as well as various tumor cells and the corresponding non-tumor cells in The Human Protein Atlas (THPA) database. ALKBH5 mRNA expression levels were higher in the normal human skeletal muscle, heart muscle, and tongue tissues (NX>50; Figure 1A). In most other normal human tissues, ALKBH5 mRNA expression level was detectable (NX>10) but low (NX<50) (Figure 1A). Moreover, TCGA database analyses of tumor tissues from 33 cancer types showed that ALKBH5 mRNA expression levels were tumor-specific and had the highest expression in Sarcoma (Figure 1B). TCGA and GTEx database analyses showed that the ALKBH5 mRNA levels were upregulated in the adrenocortical carcinoma (ACC), breast invasive carcinoma (BRCA), cervical squamous cell carcinoma and endocervical adenocarcinoma (CESC), cholangiocarcinoma (CHOL), colon adenocarcinoma (COAD), esophageal carcinoma (ESCA), glioblastoma multiforme (GBM), head and neck cancer (HNSC), kidney renal clear cell carcinoma (KIRC), acute myeloid leukemia (LAML), brain lower grade glioma (LGG), liver hepatocellular carcinoma (LIHC), lung adenocarcinoma (LUAD), lung squamous cell carcinoma (LUSC), ovarian serous cystadenocarcinoma (OV), pancreatic adenocarcinoma (PAAD), prostate adenocarcinoma (PRAD), skin cutaneous melanoma (SKCM), stomach adenocarcinoma (STAD), testicular germ cell tumors (TGCT), thyroid carcinoma (THCA) and uterine carcinosarcoma (UCS) tumor tissues compared to the corresponding normal tissues, while decreased in kidney renal papillary cell carcinoma (KIRP), rectum adenocarcinoma (READ) and uterine corpus endometrial carcinoma (UCEC) (All abbreviations showed in Supplementary Table 1) (Figure 1C).
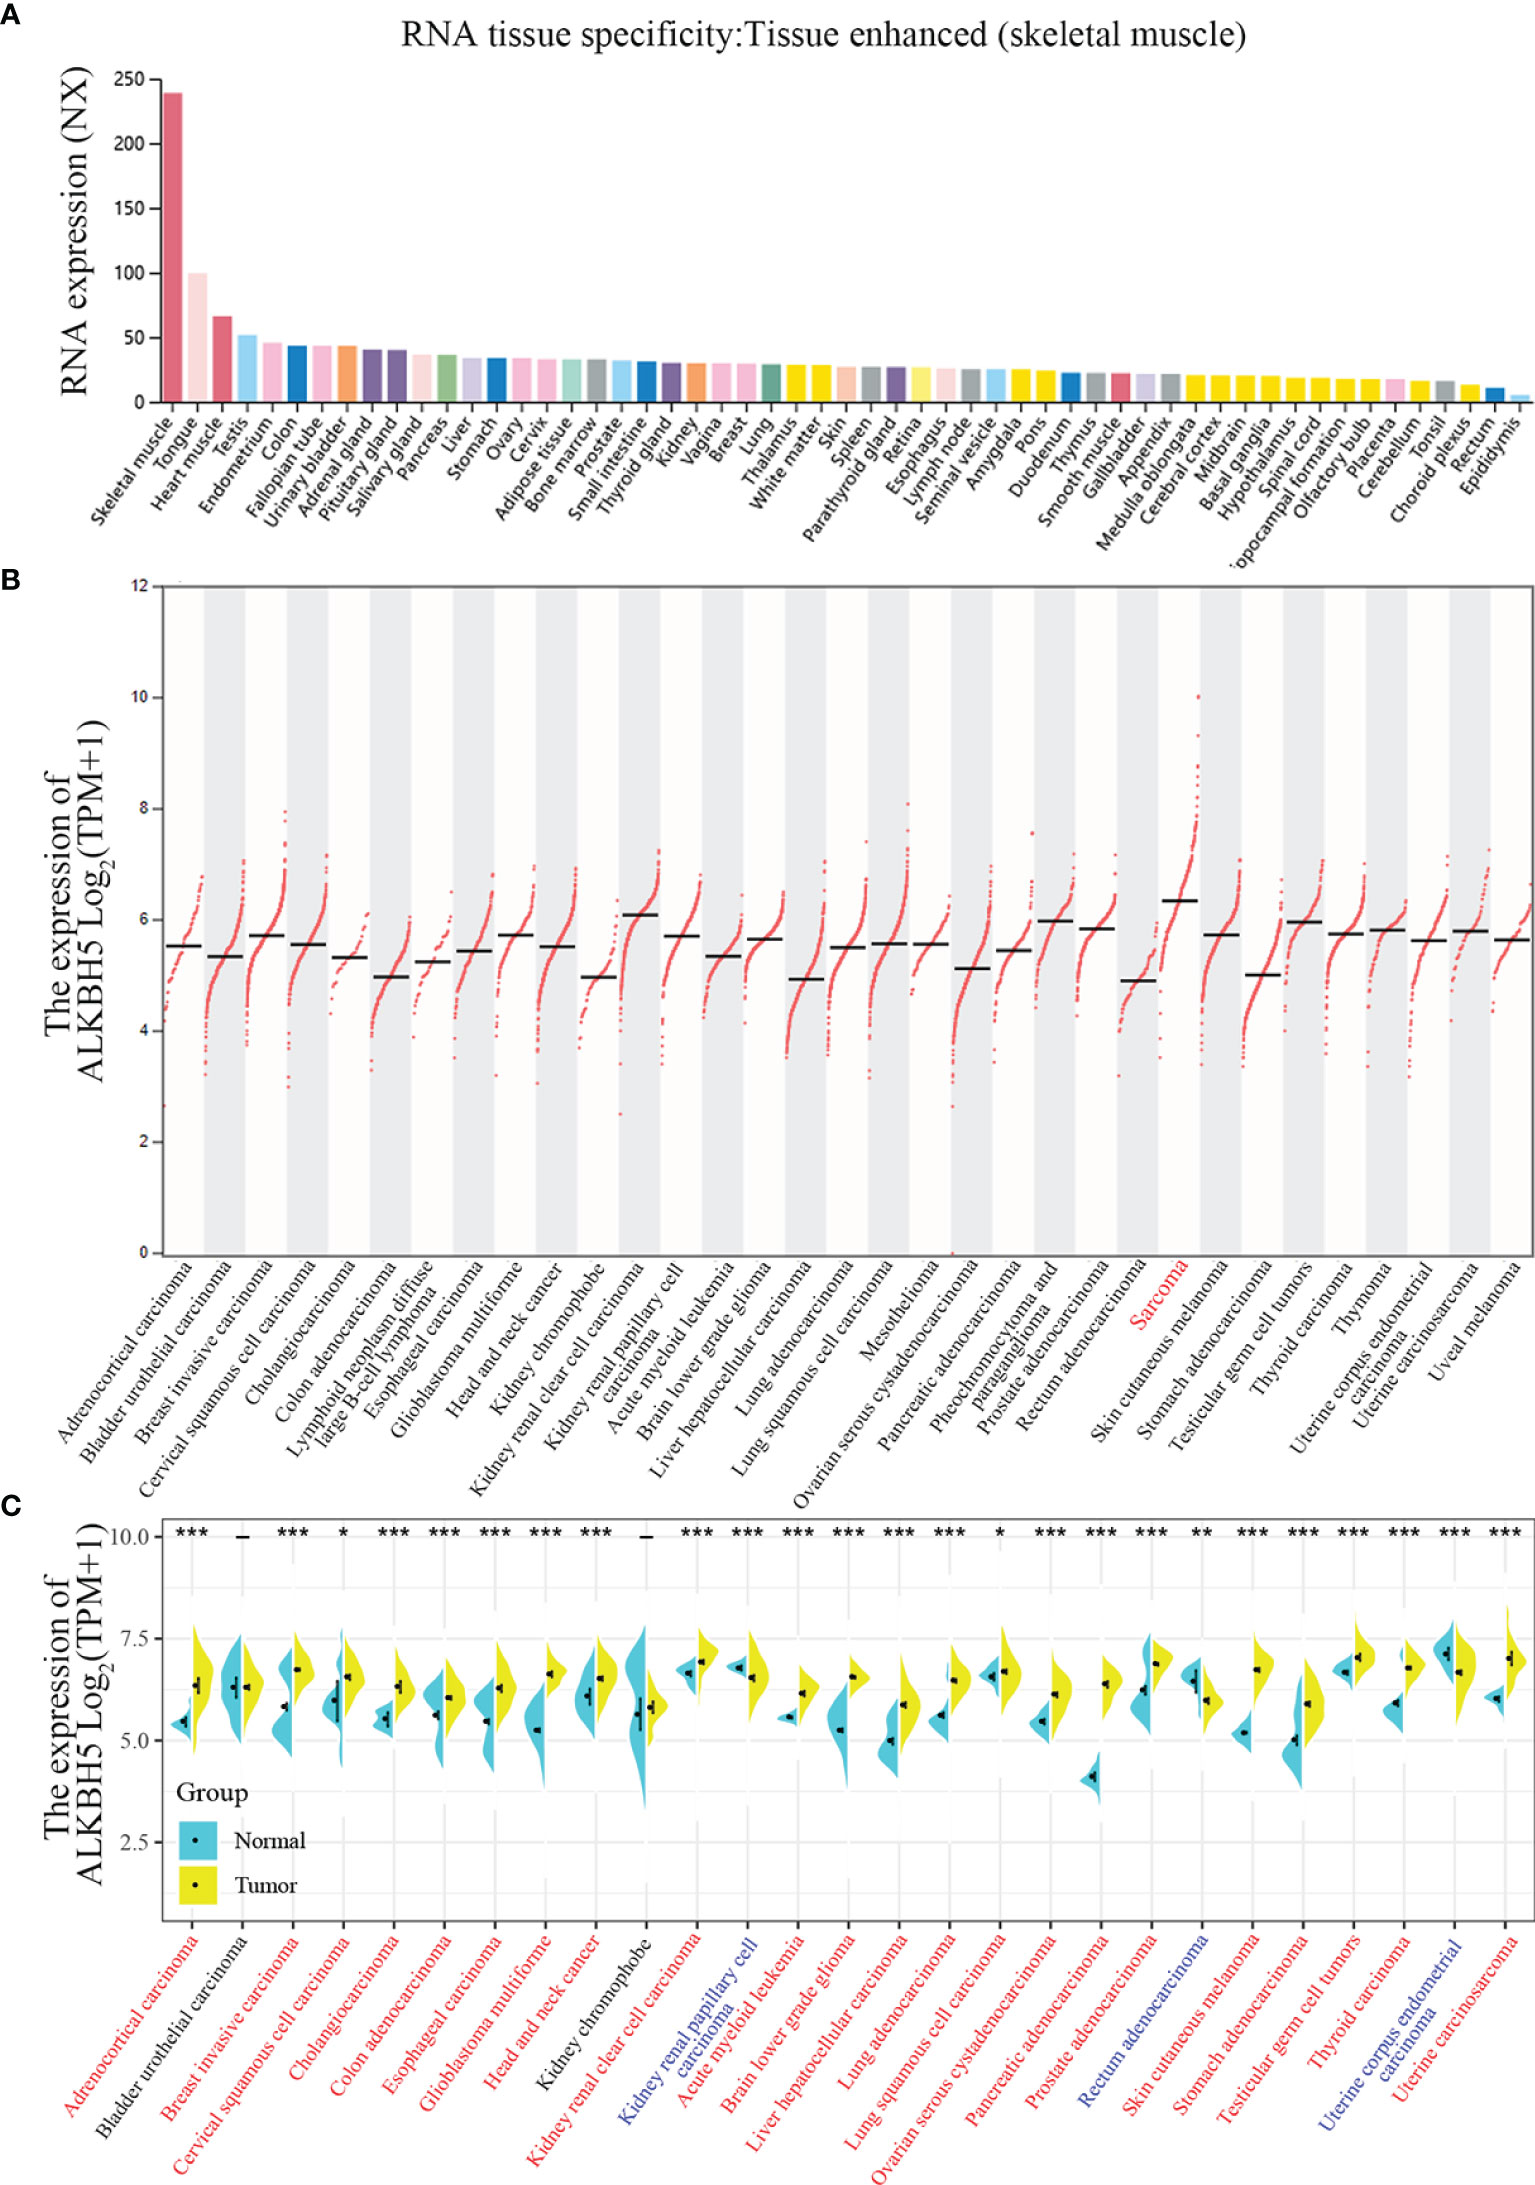
Figure 1 ALKBH5 expression levels in normal tissues and cancers. (A) ALKBH5 consensus Normalized eXpression (NX) levels for 54 normal tissue types and 7 blood cell types, generated by the three transcriptomics datasets (GTEx, HPA and FANTOM5); (B) ALKBH5 mRNA expression levels in 33 different tumor types from TCGA database via GEPIA2 portal (Sarcoma with the highest expression is shown in red label); (C) ALKBH5 mRNA expression levels in different tumors and corresponding normal tissues from TCGA and GTEx database by SangerBox. Red label tumors represented up-regulation of ALKBH5 compared with corresponding normal tissues, blue label tumors represented down-regulation of ALKBH5 compared with corresponding normal tissues, and black label tumors represented no significant difference of ALKBH5 between tumor tissues and corresponding normal tissues or absence of normal samples. *P<0.05, **P<0.01, ***P<0.001.
Next, we analyzed ALKBH5 mRNA expression levels in different WHO grades, subtypes, and new types of gliomas. Glioblastoma is classified into four subtypes (classical, mesenchymal, neural, and proneural) based on the molecular signatures (41). The gliomas are classified into the following three types according to the fifth edition of the World Health Organization (WHO) classification of tumors of the Central Nervous System (CNS) (WHO CNS5): IDH-mutant and 1p/19q-codeleted (mut+codel) oligodendroglioma, IDH-mutant (mut+non-codel) astrocytoma, and IDH-wildtype (IDH-wild) glioblastoma (42). CGGA and TCGA database analyses showed that ALKBH5 expression levels were positively associated with glioma grades (Figure 2A). Moreover, the expression levels of ALKBH5 mRNA correlated with the WHO CNS5 types and glioma subtypes (Figures 2B, C). Analysis of 100 glioma cases collected also showed that ALKBH5 expression level was positively correlated with glioma grade, which was consistent with our analysis results in CGGA and TCGA databases (Figure 2D). Isocitrate dehydrogenase (IDH) mutations and chromosomal 1p/19q codeletions are associated with better survival outcomes of glioma patients (43). Furthermore, promoter methylation status of the O6-methylguanine DNA methyltransferase (MGMT) is a prognostic indicator of the clinical response to treatment of glioblastoma patients with temozolomide (TMZ) (44). Then, we explored the relationship between ALKBH5 mRNA expression and the status of IDH gene mutations, 1p/19q codeletion, and MGMT promoter methylation. Analysis of the TCGA database and the CGGA_325, CGGA_693 datasets showed significantly higher ALKBH5 mRNA levels in the glioma patients with wild-type IDH and chromosomal 1p/19q non-codeletion, and significantly reduced in the glioma patients with MGMT promoter methylation (Supplementary Figures 2A–C).
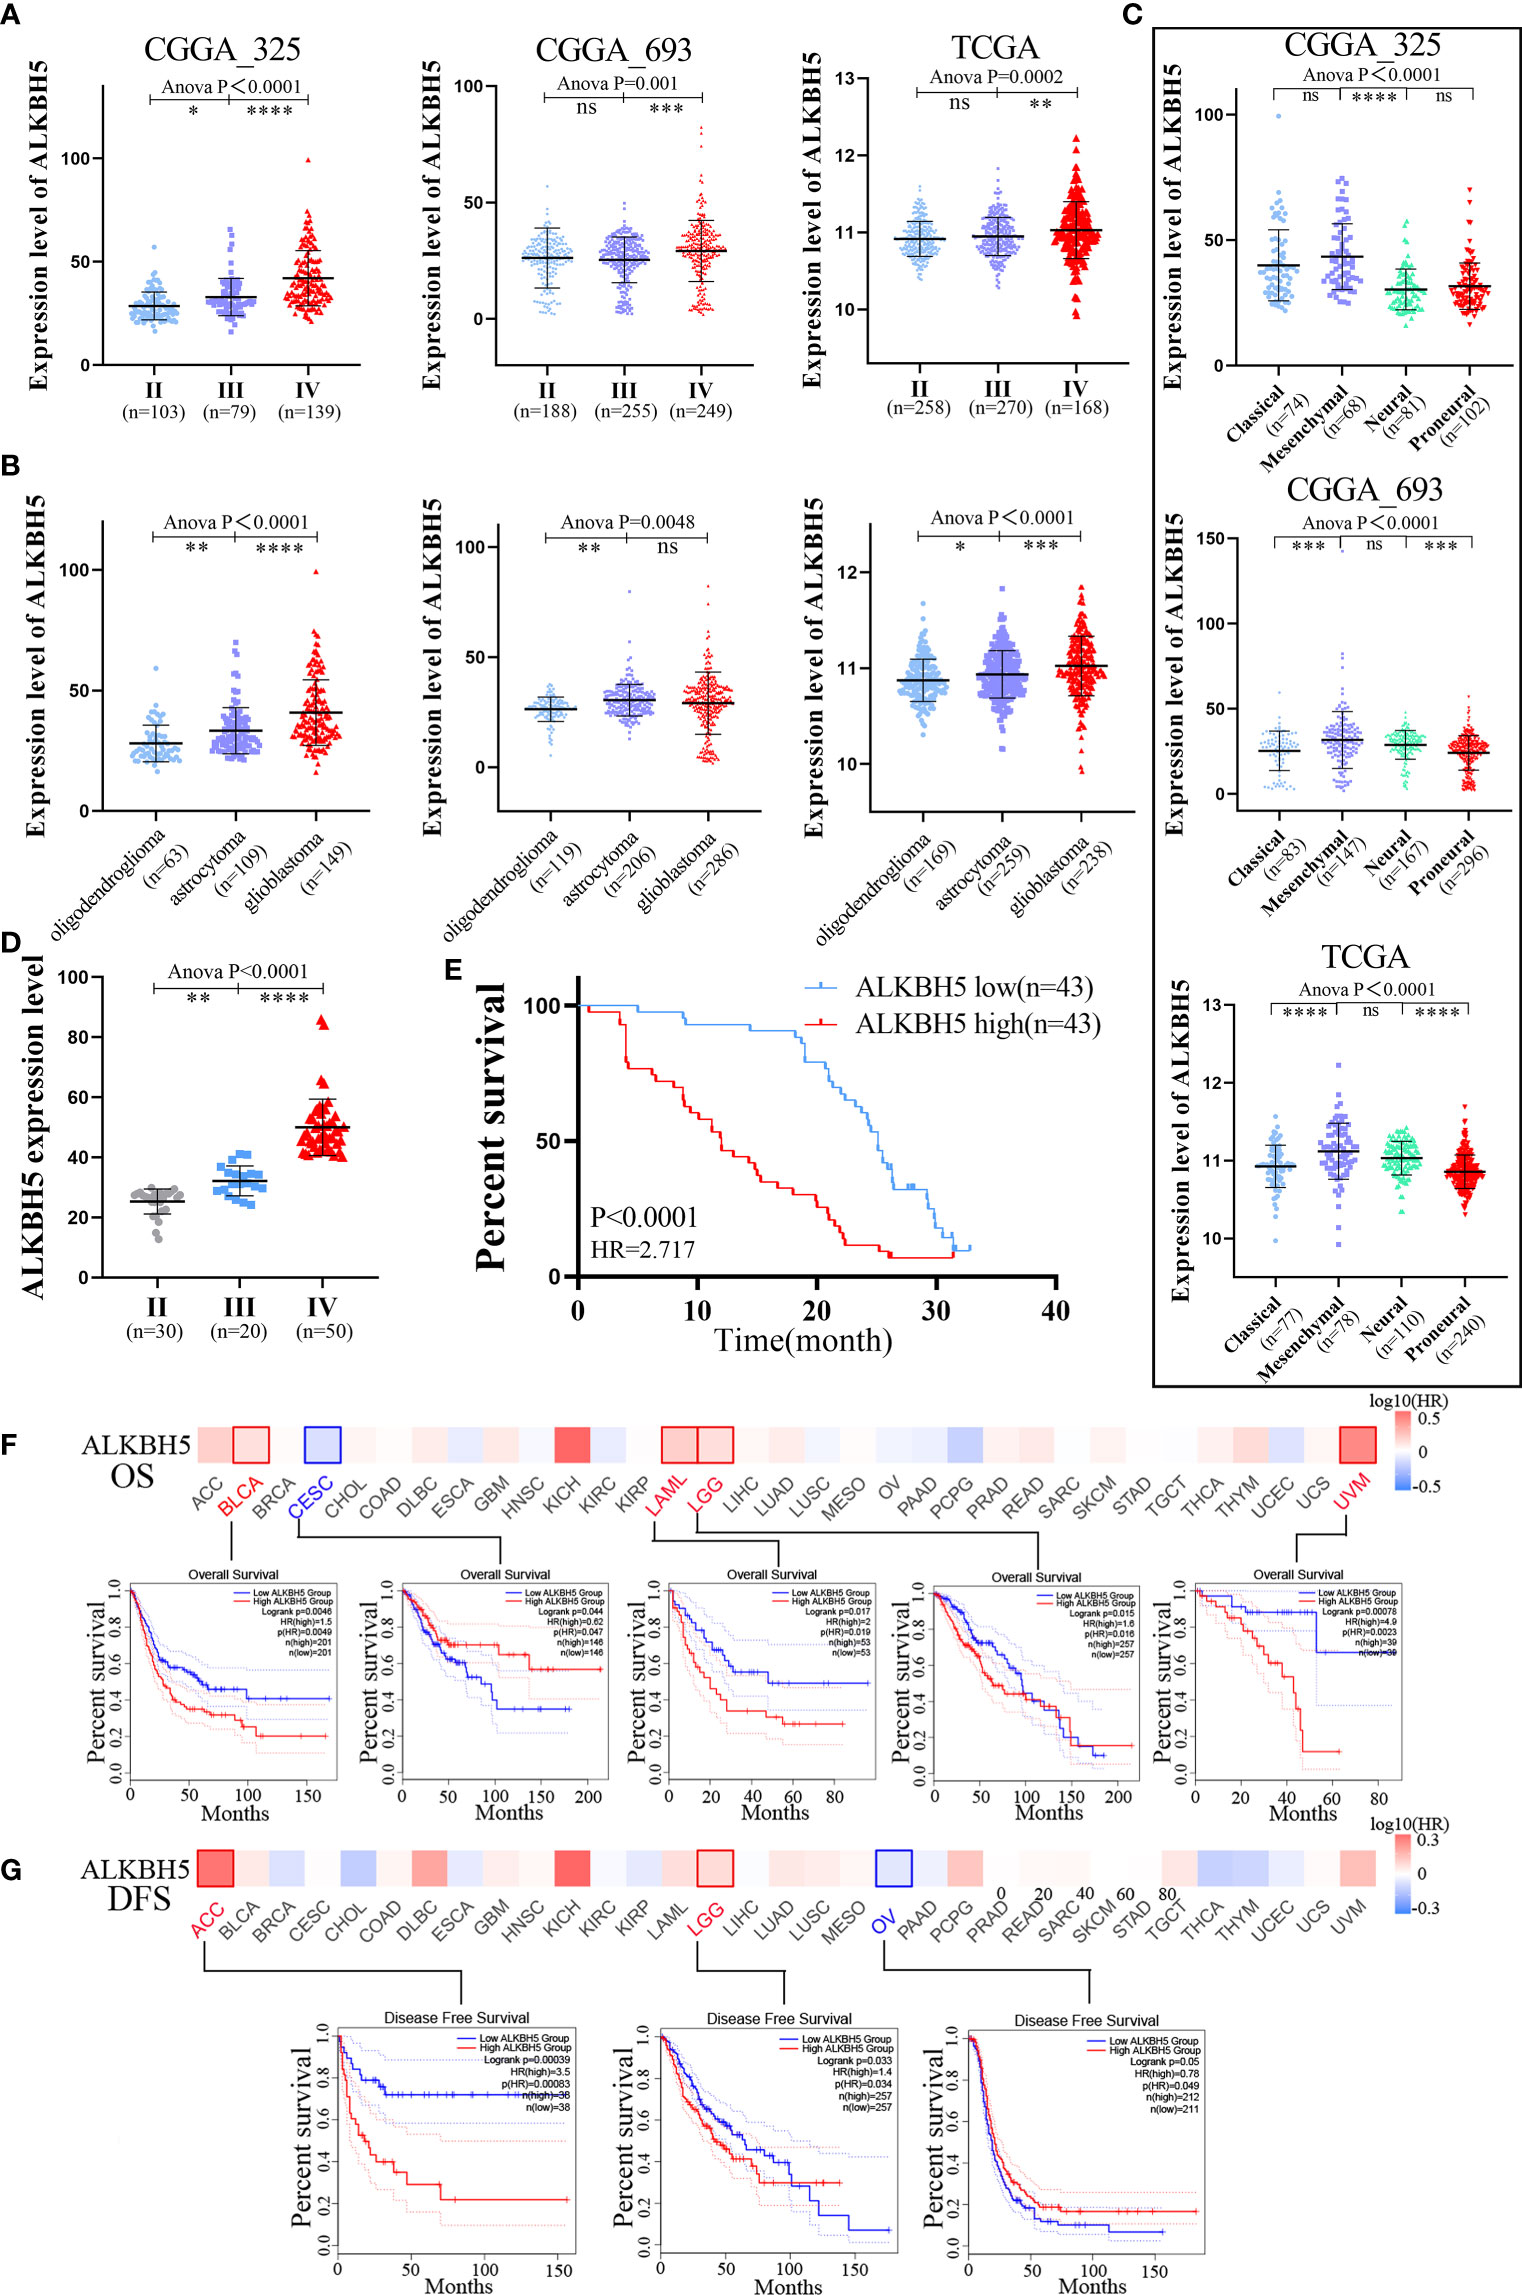
Figure 2 Clinical and molecular characteristics of ALKBH5 in pan-cancer, including gliomas. (A) The correlation between ALKBH5 expression and glioma WHO grade (II, II and IV) in CGGA_325, CGGA_693 and TCGA datasets; (B) The correlation between ALKBH5 expression and glioma three types (oligodendroglioma, astrocytoma and glioblastoma) in CGGA_325, CGGA_693 and TCGA datasets; (C) The relationship between ALKBH5 expression and glioma subtypes (classical, mesenchymal, neural, and proneural) in CGGA_325, CGGA_693 and TCGA datasets; (D) The correlation between ALKBH5 expression and grades in 100 glioma samples, including grade II (n=30), grade III(n=20) and grade IV (n=50) samples; (E) Overall survival (OS) of different ALKBH5 expression level in 100 glioma samples. The GEPIA2 tool was used to perform OS (F) and disease-free survival (DFS) (G) analyses of different tumors in TCGA by ALKBH5 expression. Red label indicated positively correlated, blue label indicated negatively correlated. *P<0.05, **P<0.01, ***P<0.001, ****P<0.0001.
Finally, we then investigated the expression characteristics of the ALKBH5 protein in 43 different normal tissues and various cancers using the THPA database, respectively. ALKBH5 protein expression was higher in most normal tissues and lower in soft tissues (Supplementary Figure 3A). ALKBH5 protein was localized in the nucleoplasm, cytosol, and golgi apparatus (Supplementary Figure 3B). NCBI database analysis showed that ALKBH5 protein was conserved in multiple species (Supplementary Figure 3C). CPTAC database analysis showed that ALKBH5 protein levels were significantly increased in the ovarian cancer, breast cancer, clear cell renal cell carcinoma (ccRCC), and lung adenocarcinoma tissues, and significantly reduced in the uterine corpus endometrial carcinoma (UCEC) tissues compared with the corresponding normal tissues (Supplementary Figure 3D).
In summary, our results showed that ALKBH5 mRNA and protein levels were upregulated in several tumors. Furthermore, ALKBH5 expression levels correlated with the grades, subtypes, and clinical features of gliomas.
ALKBH5 Expression Is Associated With the Prognosis of Various Tumors Including Gliomas
The prognostic value of ALKBH5 expression levels in multiple cancers was analyzed by comparing the rates of overall survival (OS), progression free survival (PFS), disease free survival (DFS), post progression survival (PPS), first progression (FP), and relapse free survival (RFS) in the cancer patients with high or low ALKBH5 expression levels.
GEPIA2 database analysis of the pan-cancer cohorts showed that OS was significantly reduced in BLCA (HR=1.5), LAML (HR=2.0), LGG (HR=1.6), and UVM (HR=4.9) patients with high ALKBH5 mRNA expression levels and significantly increased in CESC (HR=0.62) patients with high ALKBH5 mRNA expression levels (Figure 2F). The results showed that patients with high ALKBH5 mRNA expression level had a worse prognosis (OS) than those with low ALKBH5 mRNA expression in BLCA, LAML, LGG and UVM. Furthermore, DFS was significantly reduced in the ACC (HR=3.5) and LGG (1.4) patients with high ALKBH5 mRNA expression levels and significantly increased in the OV (HR=0.78) patients with high ALKBH5 mRNA expression levels (Figure 2G). The results suggested that patients with high ALKBH5 mRNA expression level had a worse prognosis (DFS) than those with low ALKBH5 mRNA expression in ACC and LGG. Cox regression analysis of the SangerBox database showed that ALKBH5 mRNA expression levels were associated with OS and disease specific survival (DSS) of patients with multiple cancers. The results showed that the high mRNA expression of ALKBH5 was associated with shorter OS in KICH (HR=7.29), LGG (HR=3.42), LAML (HR=2.11), GBM (HR=1.60) and BLCA (HR=1.40) and shorter DSS in KICH (HR=10.50), LGG (HR=3.23), GBM (HR=1.56) and BLCA (HR=1.42) (Supplementary Figures 4A, B). Furthermore, integrated analysis of GEO, EGA, and TCGA databases in the Kaplan-Meier Plotter website showed that ALKBH5 mRNA expression was negatively associated with the OS and PFS rates of ovarian cancer patients, OS, FP and PPS rates of gastric cancer patients, and OS and PPS rates of lung cancer patients (Supplementary Figures 4C–E). ALKBH5 mRNA expression showed positive association with OS, PFS, and RFS rates of liver cancer patients (Supplementary Figure 4F).
The correlation between ALKBH5 mRNA expression levels and the prognosis of patients with primary glioma, recurrent glioma, low grade glioma (LGG) or glioblastoma (GBM) was investigated using the CGGA and TCGA datasets. In the CGGA_325, CGGA_693, and TCGA datasets, high ALKBH5 expression levels were associated with shorter OS in primary glioma and LGG patients (Supplementary Figures 5A–C). Analysis of 100 glioma cases also showed that glioma patients with high ALKBH5 mRNA expression levels had shorter OS compared with patients with low ALKBH5 expression level (Figure 2E). Then, Cox regression analyses demonstrated that tumor grade, chemotherapy, IDH mutation status, 1p/19q codeletion, and ALKBH5 mRNA expression levels were independent prognostic predictors based on the CGGA_325 combined with CGGA_693 dataset (Supplementary Figure 6A). In TCGA database, tumor grade, age of patients, IDH mutation status and 1p/19q codeletion were independent prognostic predictors (Supplementary Figure 6B). The nomograms were constructed by combining all the independent prognostic markers, namely, tumor grades, ALKBH5 mRNA expression levels, IDH mutation status, 1p/19q codeletion status and MGMT promoter status, based on the results of the Cox regression analysis (Supplementary Figures 6C, D).
The prognostic efficacy of the factors included in the nomogram were analyzed in the glioma patients from the CGGA_325 and CGGA_693 datasets. The results showed that ALKBH5 mRNA expression levels significantly correlated with the prognosis of glioma patients with different IDH mutations, 1p/19q codeletion, and MGMT promoter status; the high mRNA expression of ALKBH5 negatively correlated with the prognosis of glioma patients in the CGGA_325 and CGGA_693 datasets (Supplementary Figures 7A–C). ALKBH5 mRNA expression was associated with the prognosis of the glioma patients in the CGGA_325 and CGGA_693 datasets, but was independent of chemotherapy and/or radiotherapy (Supplementary Figures 7D, E).
Overall, the results demonstrated that the ALKBH5 mRNA and protein expression levels were associated with the prognosis of multiple cancers. Moreover, higher ALKBH5 mRNA and protein expression was associated with poorer prognosis of glioma patients.
Alterations in the ALKBH5 Gene Are Associated With Development and Progression of Multiple Tumors Including Gliomas
Genetic alterations such as the mutations, deletions, or amplifications of oncogenes or tumor suppressor genes are associated with growth and progression of several tumors (45). Therefore, we first analyzed different types of alterations including mutations, structural variations, amplifications, and deep deletions in the ALKBH5 gene in using the TCGA cancer datasets with the cBioPortal portal. The most common genetic alteration in the ALKBH5 gene were amplifications in the sarcomas (>8%), uterine carcinosarcomas, liver hepatocellular carcinoma and pancreatic adenocarcinomas; mutations (1.3%) in the bladder urothelial carcinomas; and deep deletions (>2%) in the diffuse large B-cell lymphomas (Figure 3A). TIMER database analysis showed that BLCA (6/411), BRCA-Her2 (1/79), and UCEC (6/531) were the top 3 cancers with the highest ALKBH5 gene mutation rates (Figure 3B). cBioPortal database analysis showed that missense mutations were the main type of ALKBH5 gene mutations in cancers (Figure 3C).
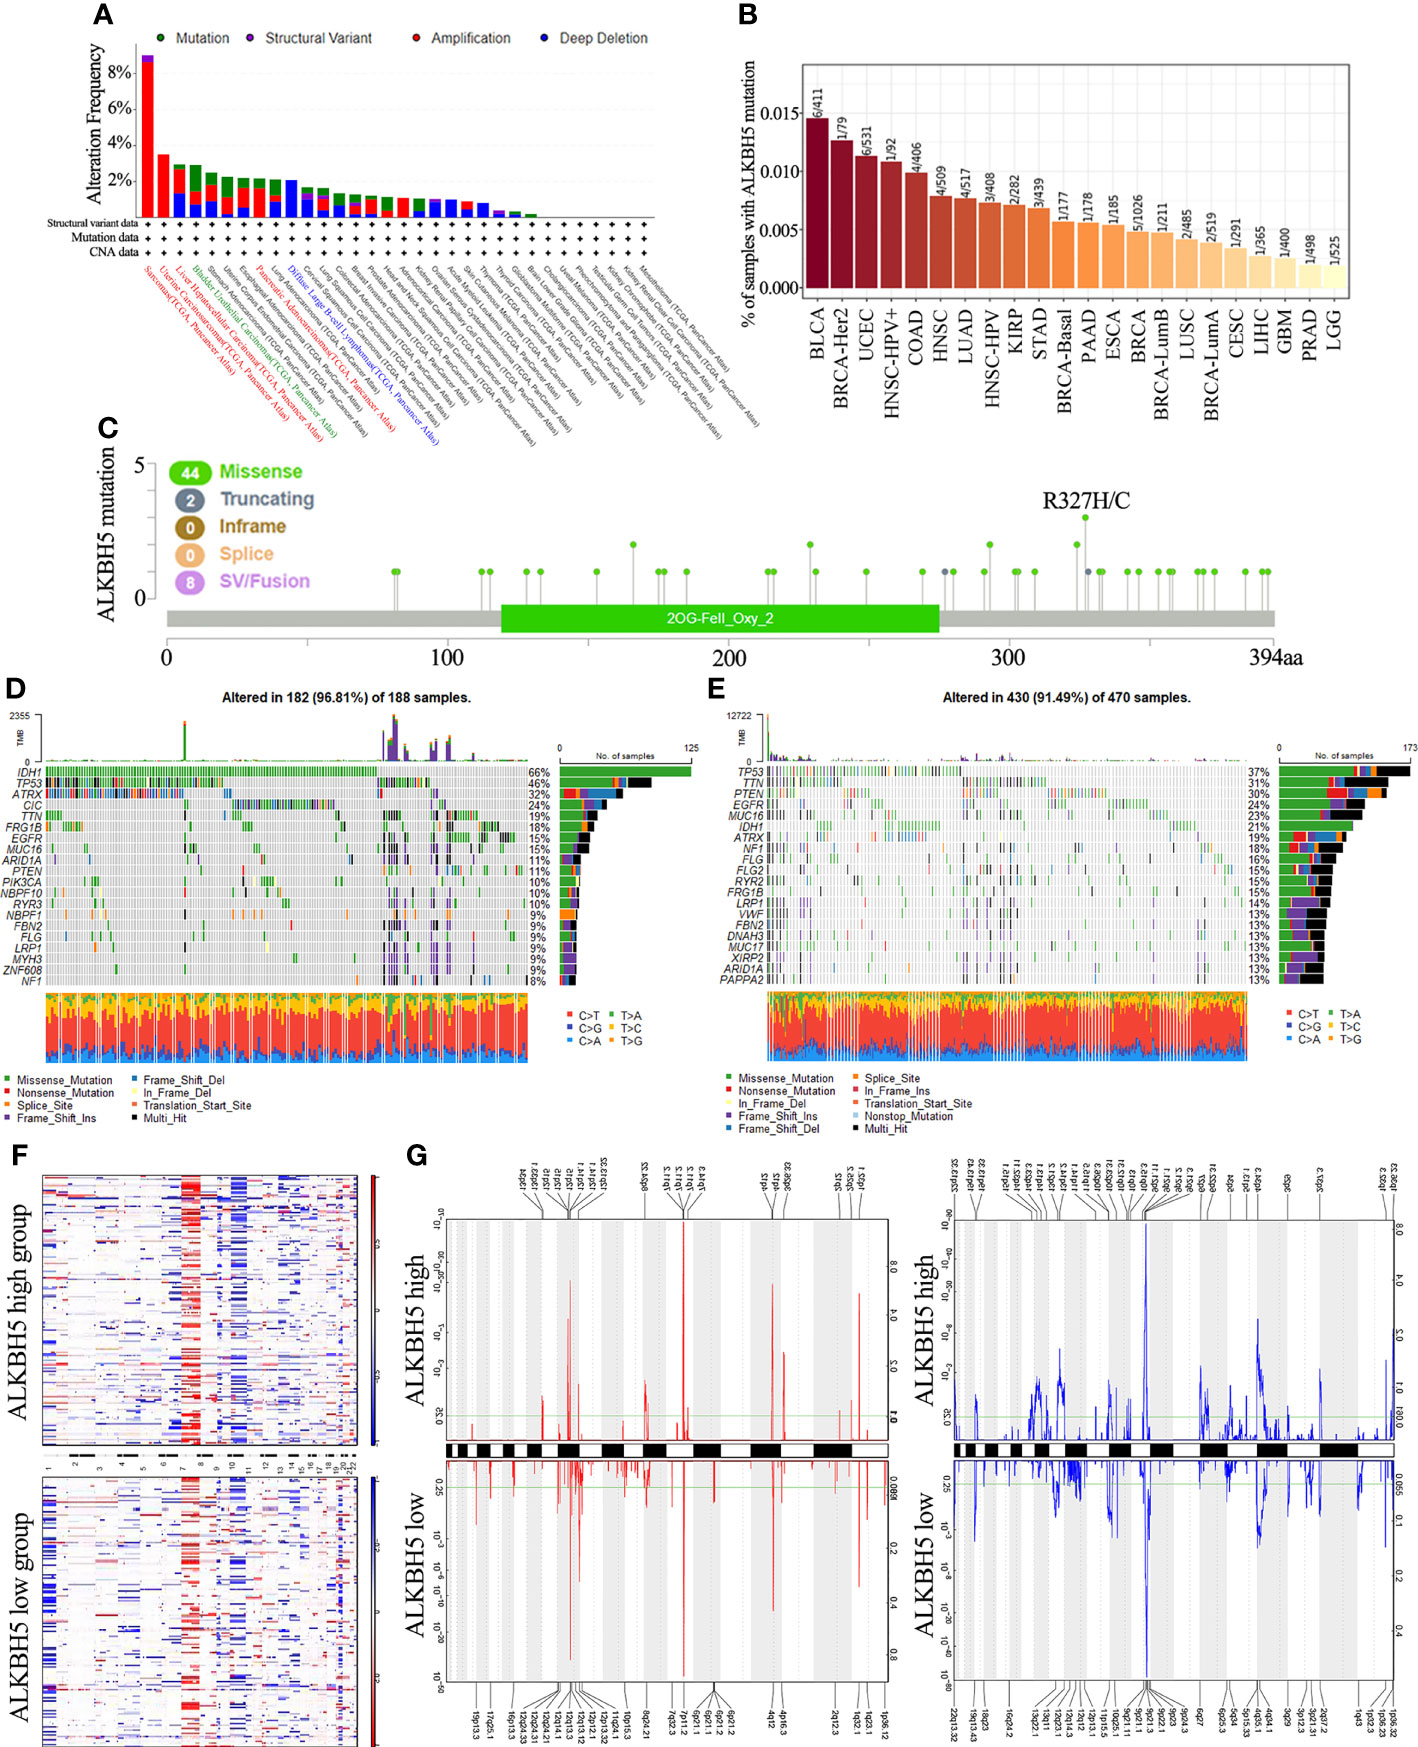
Figure 3 Distinct genomic profiles associated with ALKBH5 expression and integrative analysis of complex cancer genomics and clinical profiles. (A) Genetic alteration features (Mutation, Structural Variant, Amplification and Deep Deletion) of ALKBH5 in 32 different tumors were analyzed in TCGA database by the cBioPortal tool. The red label represented the tumors with the top 3 levels of amplification. The green label represented the tumor with the highest mutation level and the blue label represented the tumor with the highest deep deletion level; (B) Mutation rates of ALKBH5 gene in various tumors via TIMER portal; (C) The mutation sites of ALKBH5 in multiple tumors by the cBioPortal tool. Detection of differential somatic mutations in gliomas, including 25% ALKBH5low group (D) and 25% ALKBH5high group (E). Only the top 20 genes with the highest mutation rates were shown; (F) The CNAs profile analysis about 25% ALKBH5low group and 25% ALKBH5high group in TCGA dataset via GISTIC2.0; (G) Frequency of amplifications and deletions in gliomas with low and high ALKBH5 expression (Blue, deletion; red, amplification).
Next, the relationship between ALKBH5 expression and specific genomic characteristics such as somatic mutations and copy number variations (CNVs) was analyzed in the TCGA glioma dataset. The ALKBH5high group (n = 166) showed high frequency of somatic mutations in the TP53 (37%), TTN (31%), PTEN (30%), and EGFR (24%) genes and the ALKBH5low group (n = 166) showed high frequency of mutations in the IDH1 (66%), TP53 (46%), ATRX (32%), and CIC (24%) genes (Figures 3D, E). The comparison of the CNV profiles in the ALKBH5low (n = 166) and ALKBH5high (n = 166) samples is shown in Figure 3F. In the ALKBH5high samples, we observed amplification peaks in the 1q32.1, 3q26.33, 4q12, 7p11.2, 8q24.22, and 12q15 chromosomal regions, and deletions in the 1p36.23, 4q34.3, 9p21.2, 13q14.2 and 13q22.1 chromosomal locations. In the ALKBH5low samples, we observed amplification peaks in the 4q12, 7p11.2, 12q13.3 and 19p13.3 chromosomal locations and frequent deletions in the 4q35.1 and 9p21.3 chromosomal regions (Figure 3G).
Overall, these results showed ALKBH5 gene mutations, amplifications, and deletions in multiple tumors. Missense mutations were the most frequent type of ALKBH5 gene mutations in various tumors. Moreover, the glioma tissues showed distinct somatic mutations and CNVs based on the expression levels of ALKBH5. This suggested that alterations in the ALKBH5 gene may regulate the initiation, growth and progression of various tumors, especially gliomas.
ALKBH5 and Related Genes Regulate Immunity, Immune Signaling, and Metabolism in Gliomas and Other Cancer Types
STRING database analysis identified ten ALKBH5-binding proteins, namely, FTO, METTL3, METTL14, ALKBH1, YTHDC1, YTHDF1, JMJD4, YTHDF2, DDX3X and WTAP as shown in the protein-protein interaction (PPI) network (Figure 4A). GEPIA2 database analysis of 33 cancer types showed the following top 10 ALKBH5-related genes: GID4 (R=0.71), TOP3A (R=0.67), MAPK7 (R=0.66), NT5M (R=0.61), FLII (R=0.59), ZNF18 (R=0.57), DRG2 (R=0.57), COPS3 (R=0.56), MED9 (R=0.56) and PRPSAP2 (R=0.56) (all P<0.0001; Figure 4B). TIMER2 database was then used to confirm the association between ALKBH5 and the top 9 ALKBH5-related genes (GID4 was not annotated in TIMER2 portal) in 40 cancer types (Figure 4C).
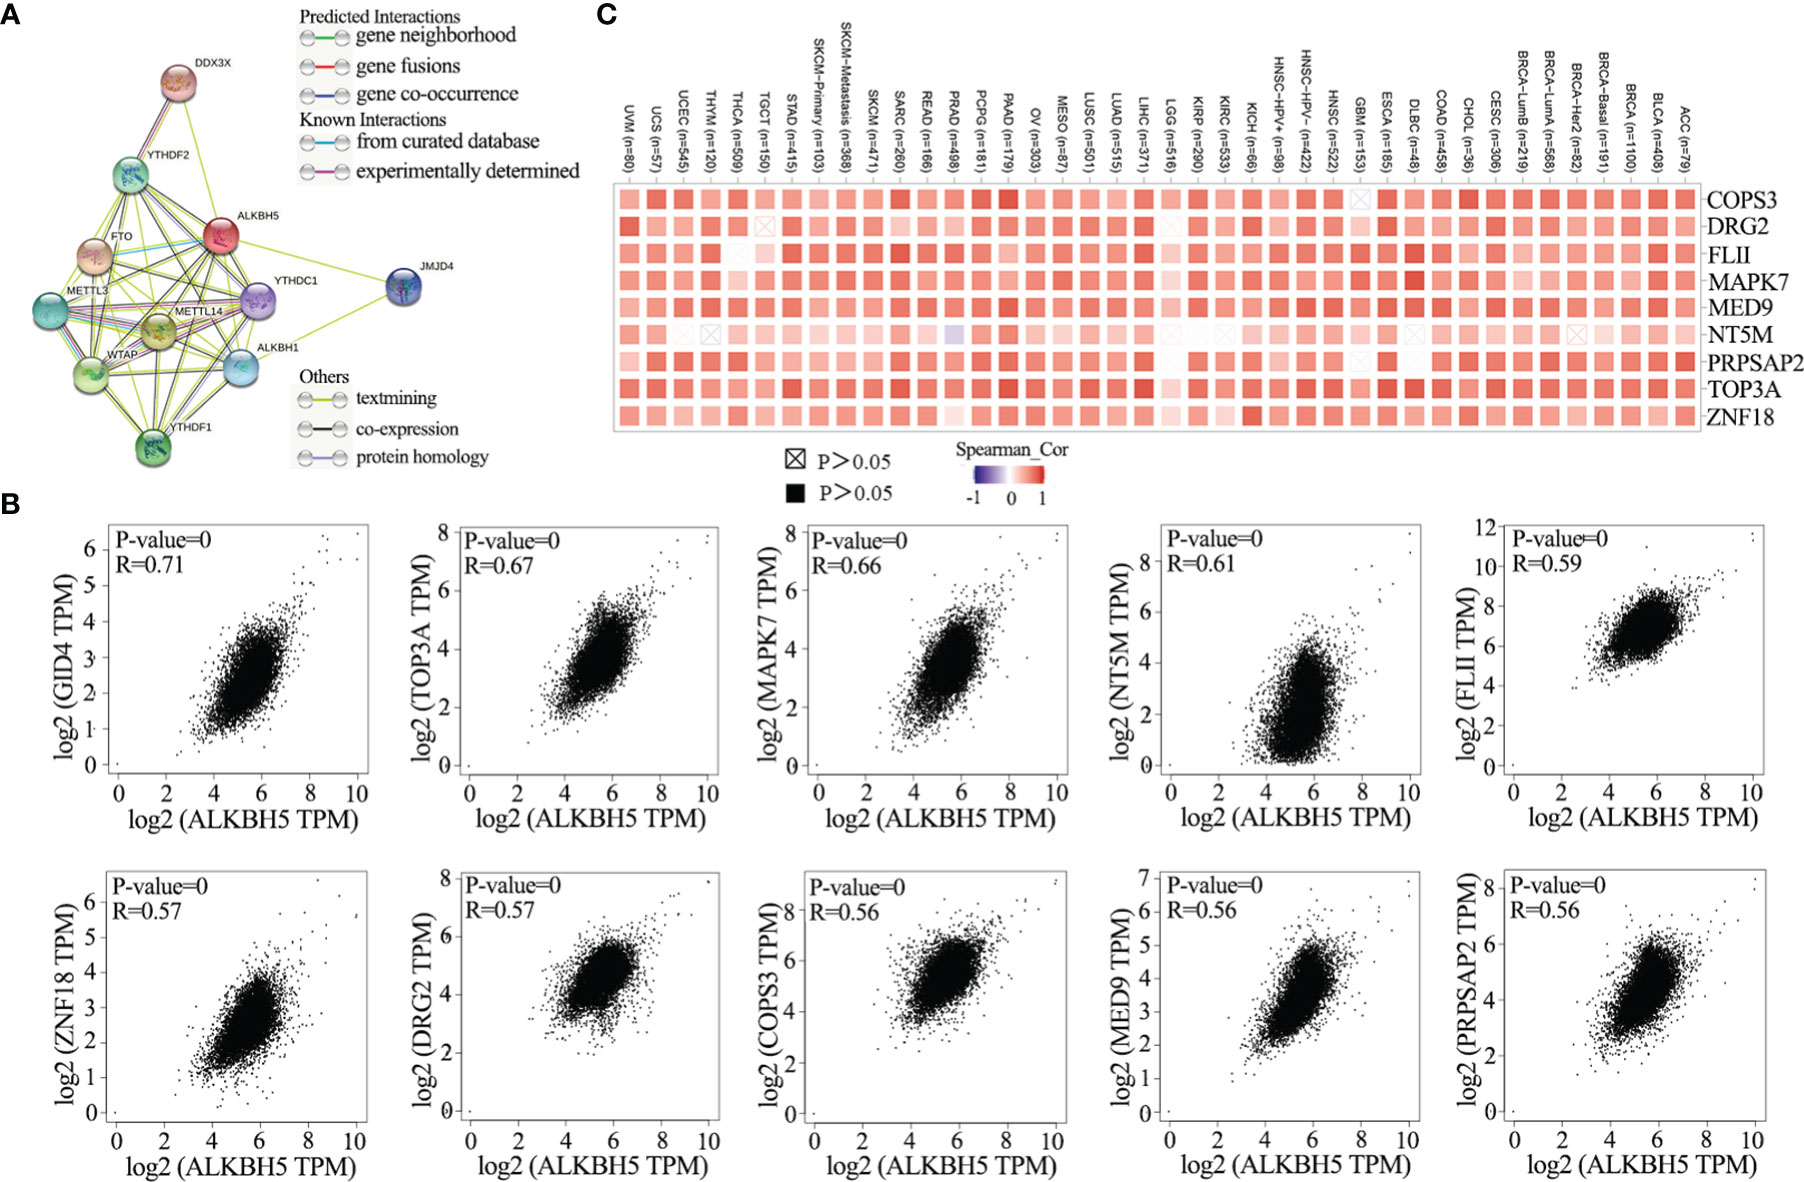
Figure 4 ALKBH5-related genes enrichment analysis in pan-cancers. (A) ALKBH5-binding proteins were displayed using the STRING tool (DDX3X, YTHDC1, YTHDF1, YTHDF2, FTO, METTL3, METTL14, WTAP, JMJD4, ALKBH1); (B) The top 10 ALKBH5-correlated genes was displayed in various tumors and the correlations between ALKBH5 expression and selected targeting genes were analyzed via the GEPIA2 website. These top 10 genes included GID4 (R=0.71), TOP3A (R=0.67), MAPK7 (R=0.66), NT5M (R=0.61), FLII (R=0.59), ZNF18 (R=0.57), DRG2 (R=0.57), COPS3 (R=0.56), MED9 (R=0.56) and PRPSAP2 (R=0.56). The P-value and partial correlation (R) were generated via the purity-adjusted Spearman’s rank correlation test; (C) The corresponding heatmap data of ALKBH5 and its positively correlated genes in various tumors via TIMER2.0.
Next, in order to further exploring the biological functions of ALKBH5 in glioma. GO-BP and KEGG enrichment analyses of ALKBH5-related genes in glioma was performed. Figures 5A–C showed the enrichment patterns of the top 200 genes positively (100 genes) or negatively (100 genes) correlated with ALKBH5 expression in glioma from the CGGA_325, CGGA_693 and TCGA databases. In CGGA_325 and CGGA_693 databases, GO-BP analyses showed wnt signaling pathway, stimulatory C-type lectin receptors signaling pathway, innate immune response activating cell surface receptor signaling pathway, cell-cell signaling by wnt, interleukin-1-mediated signaling pathway and NIK/NF-kappaB signaling (Figures 5D, E). In TCGA database, GO-BP analysis showed response to hypoxia and response to oxygen levels (Figure 5F). These results showed that ALKBH5 could regulate immunity and metabolism correlated signaling pathways in glioma. In addition, GSE93054 dataset was used to further exploring the correlation between ALKBH5 and immunity and metabolism. Figure 5G showed the 1150 intersectional genes of differentially expressed genes in GSC11 (3032 differentially expressed genes) and GSC17 (5158 differentially expressed genes) cell lines after ALKBH5 knockdown in GSE93054 dataset. The GO-BP analysis of these 1150 genes showed the enrichment processes, including cell cycle process, DNA metabolic process, DNA repair, DNA replication and cell cycle checkpoint in Figure 5H. And the KEGG enrichment analysis showed that these 1150 genes enriched in the cell cycle, FoxO signaling pathway, DNA repair, p53 signaling pathway, Homologous recombination, Hedgehog signaling pathway and so on (Figure 5I).
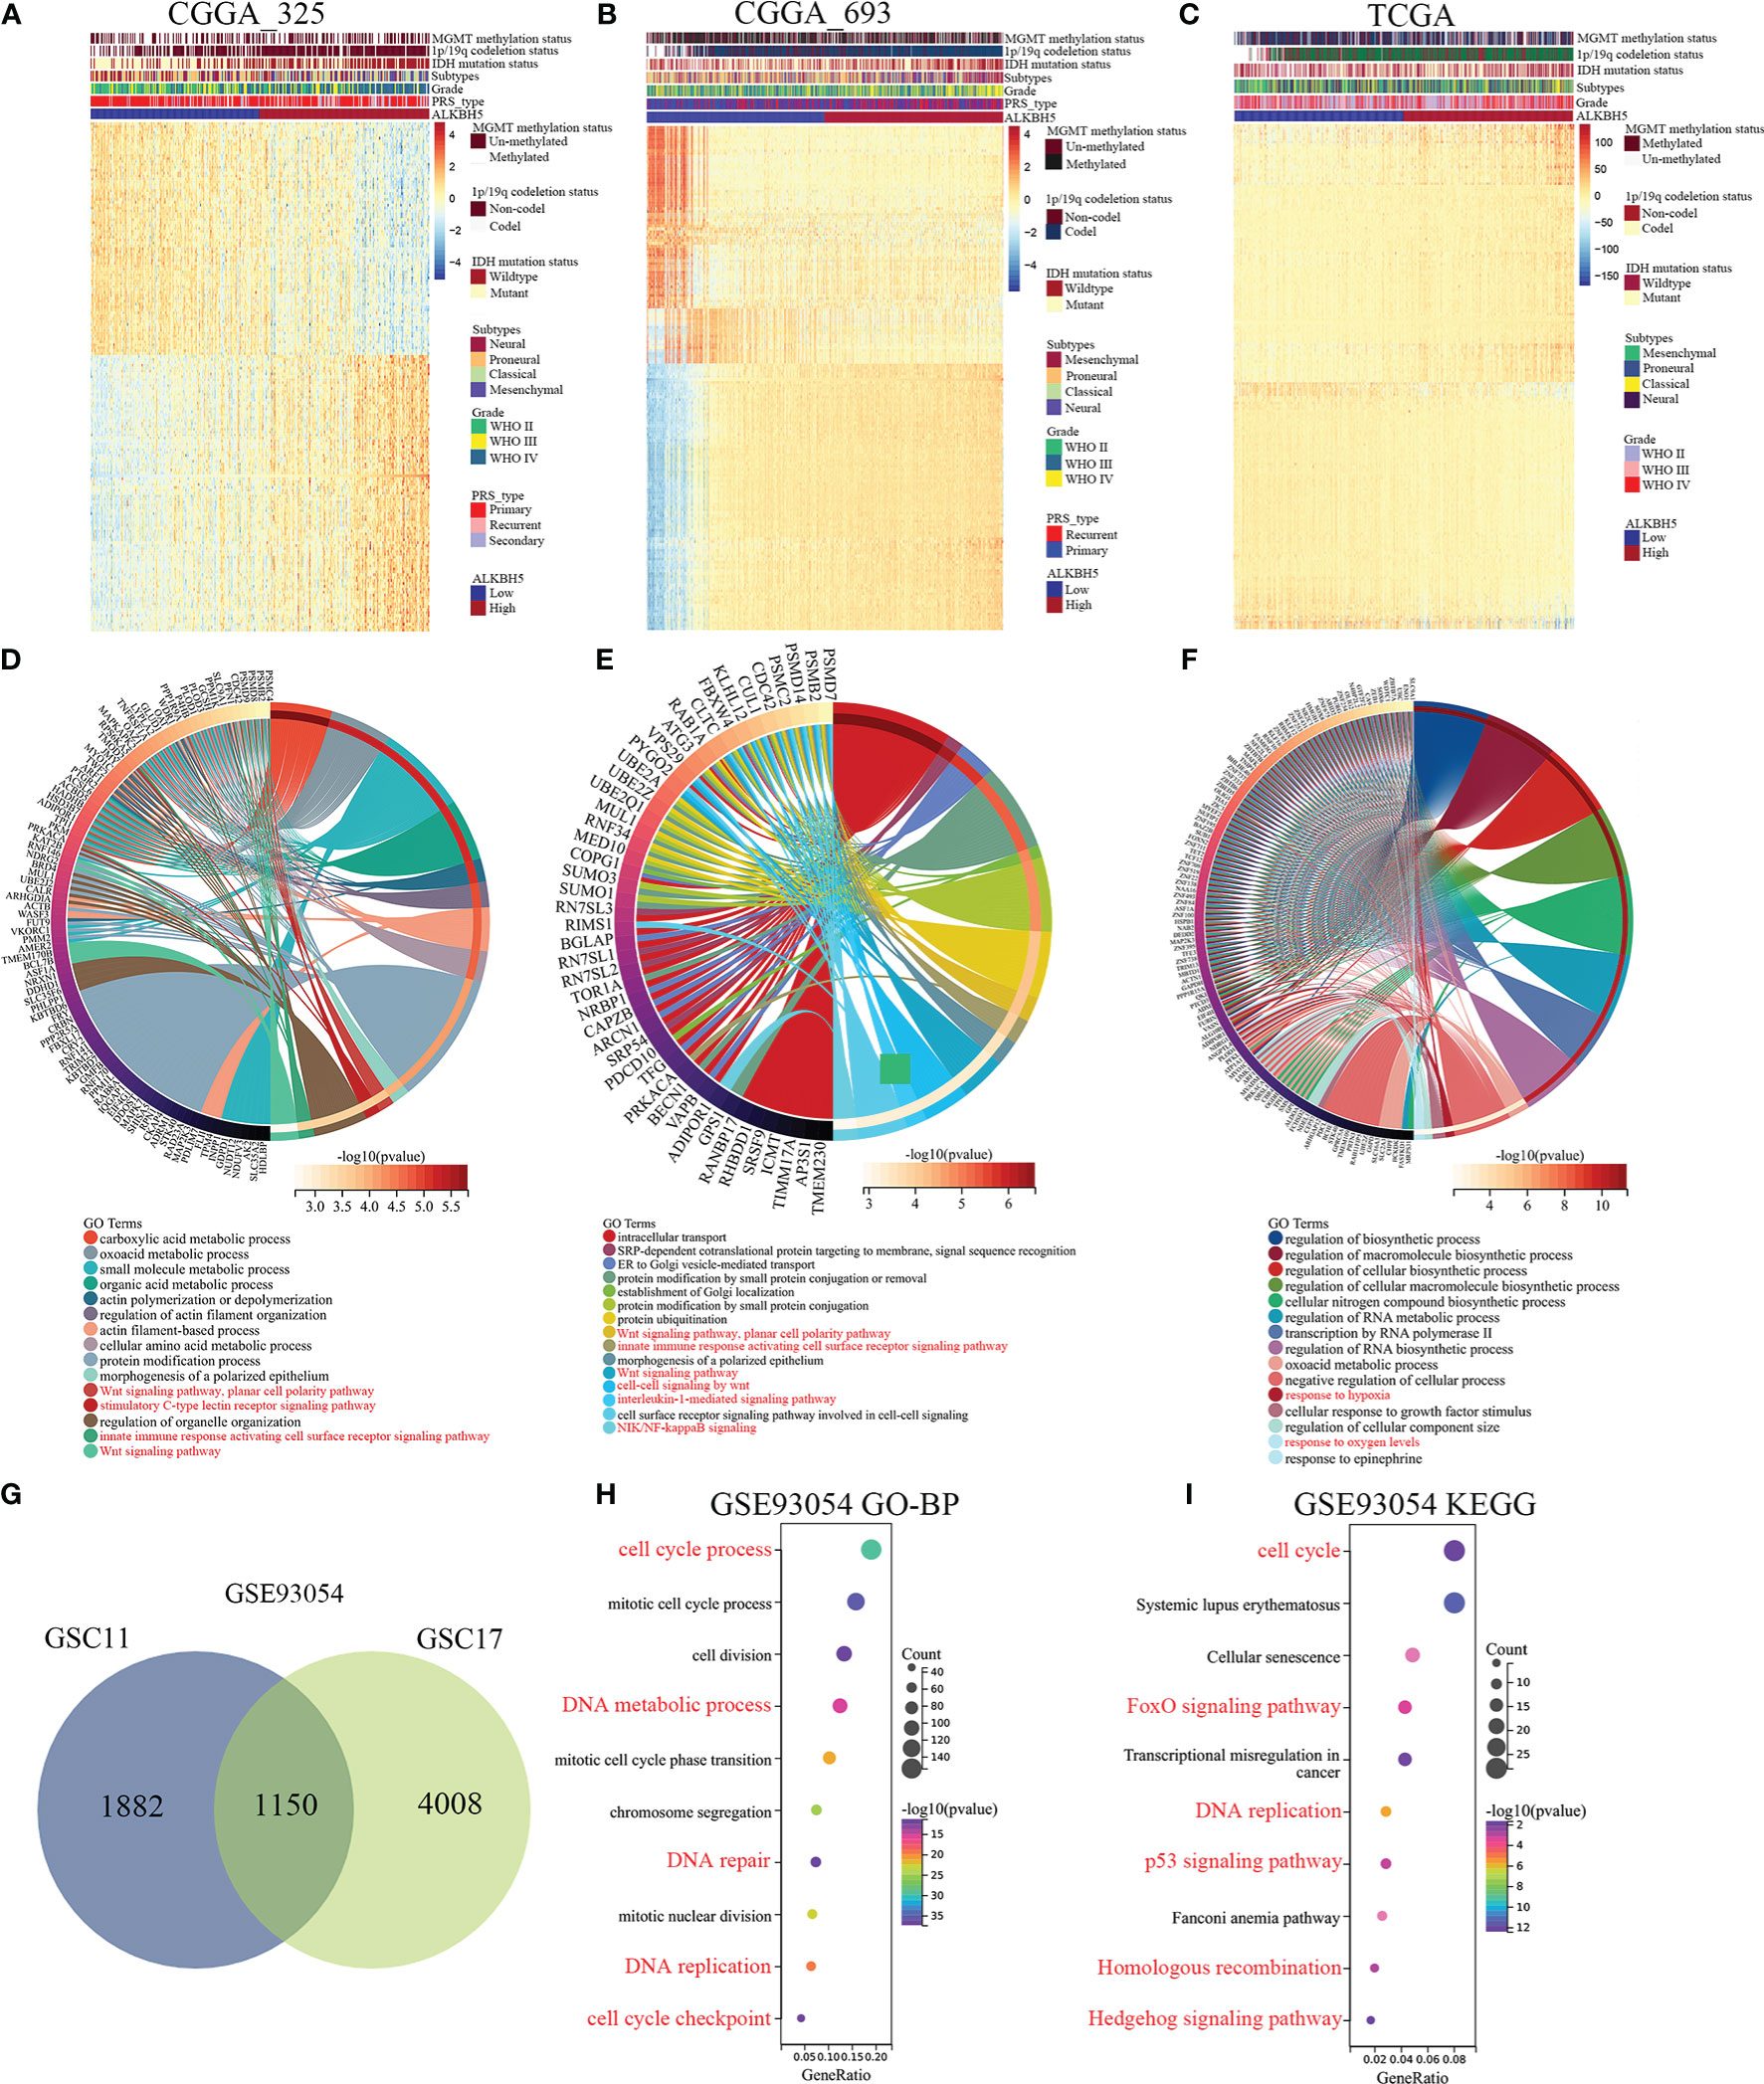
Figure 5 ALKBH5-related genes enrichment analysis in glioma by CGGA_325, CGGA_693 and TCGA datasets. (A-C) Heatmap showing the enrichment patterns of the top 200 genes positively (100) or negatively (100) correlated with ALKBH5 expression of glioma in the CGGA_325, CGGA_693 and TCGA databases. (D-F) Alterations in different classifications of biological functions in gliomas samples with ALKBH5 expression in the CGGA_325, CGGA_693 and TCGA databases. (G) Venn diagram showing the 1150 intersectional genes of differentially expressed genes in GSC11 (3032 differentially expressed genes) and GSC17 (5158 differentially expressed genes) cell lines after ALKBH5 knockdown in GSE93054 dataset. The GO-BP (H) and KEGG (I) pathway enrichment analyses were applied with the 1150 intersectional genes of differentially expressed genes in GSE93054 dataset. Red label indicated that these GO-BP or KEGG analysis was associated with cell cycle, DNA damage repair, metabolism, or immunity.
These results indicated that ALKBH5 expression was associated with cell cycle, DNA damage repair, metabolism, or immunity. Therefore, we then studied the relationship between ALKBH5 and immune in a variety of tumors.
ALKBH5 Regulates Tumor Infiltration of Immune Cells in Multiple Human Cancers
The above results suggested that ALKBH5 may regulate the tumor immune microenvironment (TIM) in multiple cancer types, we studied the relationship between ALKBH5 expression levels and the composition of tumor infiltrating immune cells (TIICs) in various tumors. Several studies have shown that TIICs are important components of the tumor microenvironment and regulate tumor initiation, progression, and metastasis (46, 47). Firstly, we evaluated the correlation between ESTIMATE scores (ESTIMATE, immune, and stromal scores) and ALKBH5 expression levels in pan-cancers. Immune score reflects the proportion of infiltrated immune cells in the tumor tissues; stromal score reflects the proportion of stromal cells in the tumor tissues. ESTIMATE score is the sum of immune and stromal scores, and reflects the status of the tumor immune microenvironment and tumor purity. Our results demonstrated negative correlation between ALKBH5 expression and the ESTIMATE, immune, and stromal scores in LUAD, LUSC, UCEC, LIHC, CESC, SARC, BRCA and THCA (Figure 6A). This suggested that high ALKBH5 expression was associated with decreased infiltration of immune and stromal cells in several tumors, thereby resulting in high tumor purity. Conversely, ALKBH5 expression showed positive correlation with ESTIMATE, immune, and stromal scores in COAD, LGG, and UVM (Figure 6A). Supplementary Figure 8 showed the positive correlations between ALKBH5 mRNA expression level and ESTIMATE score, Immune score and Stromal score in glioma.
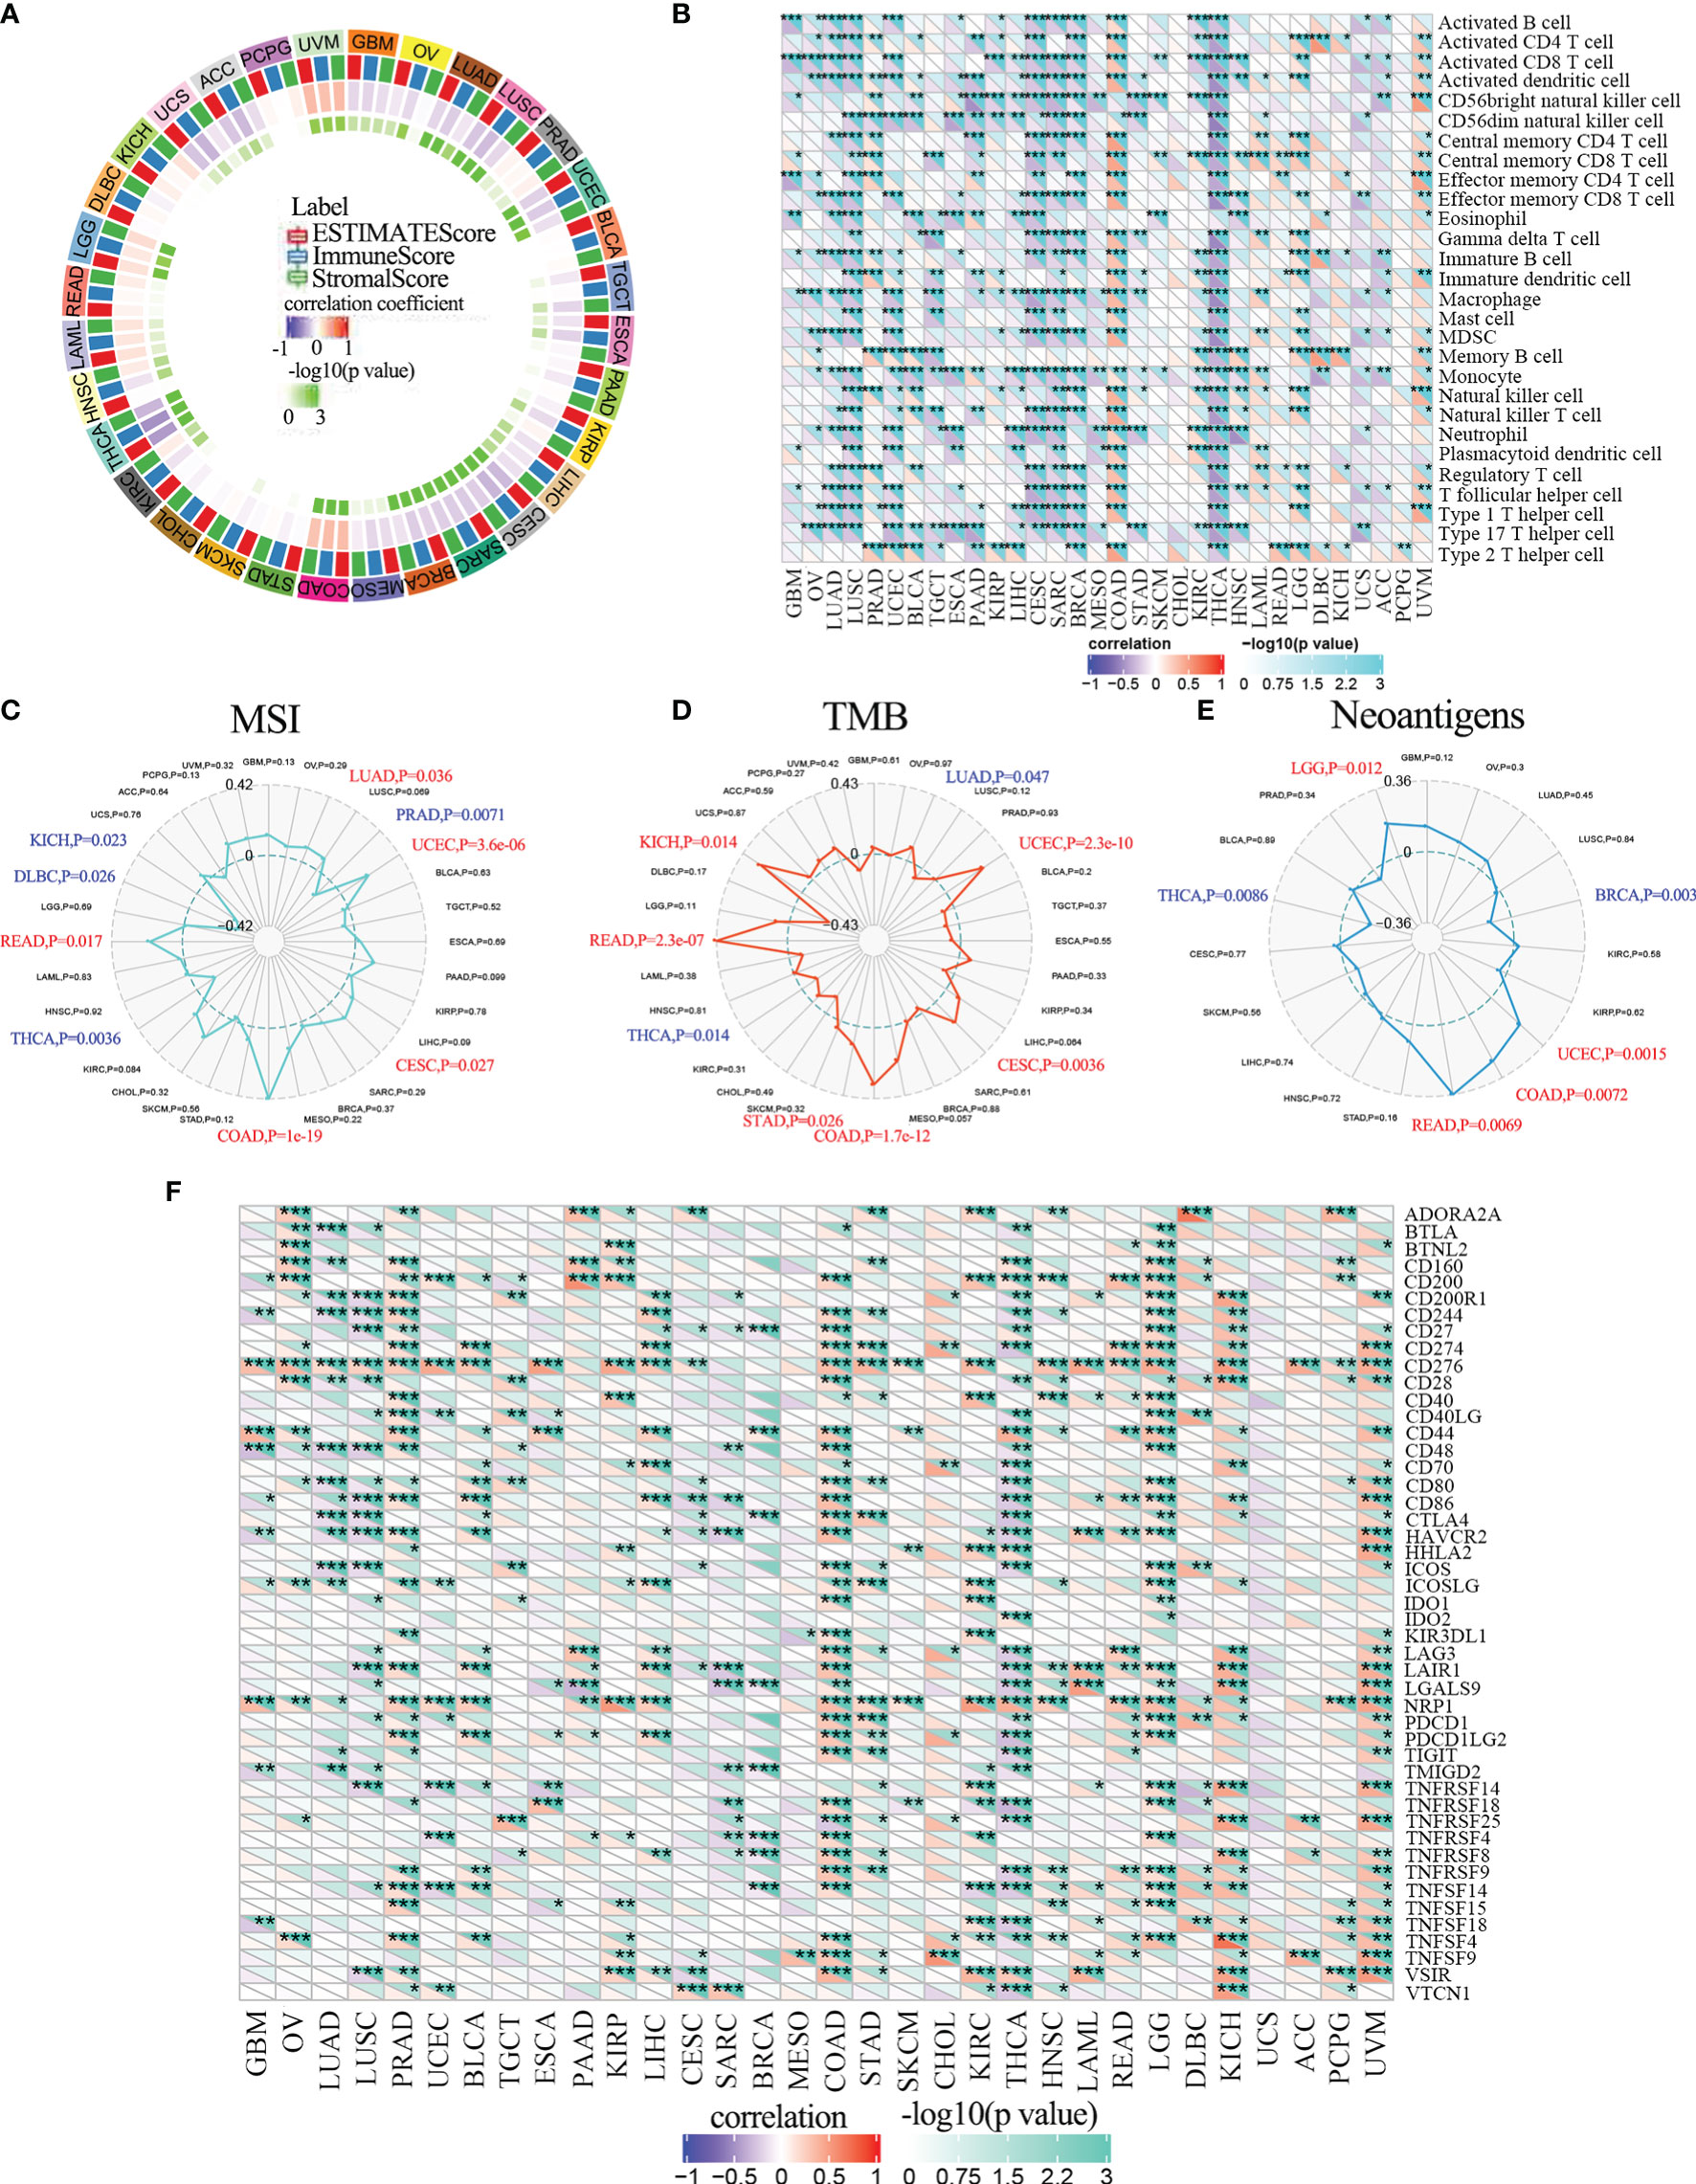
Figure 6 ALKBH5 mRNA expression and immune infiltration. (A) The correlations between ESTIMATE scores (ESTIMATE Score, Immune Score, and Stromal Score) and ALKBH5 expression were analyzed in various tumors by Sangerbox portal. (B) The relationship between ALKBH5 expression and immune cell infiltration level was analyzed in various tumors by Sangerbox online website. The relationship between ALKBH5 mRNA expression and MSI (C), TMB (D), neoantigen (E) and ICP-gene (F) in multiple cancers. Red label indicated positive correlation with ALKBH5 expression and blue label indicated negative correlation with ALKBH5 expression. *P<0.05, **P<0.01, ***P<0.001, ****P<0.0001.
Then, we investigated the relationship between ALKBH5 expression and TIIC levels in various tumors using the Sangerbox database. ALKBH5 expression showed negative correlation with multiple immune cell types in LUAD, LUSC, UCEC, CESC, SARC, BRCA, and THCA, and positive correlation with immune cell types in COAD, LGG and UVM (Figure 6B). The immune cell types included activated CD4+ and CD8+ T cells, activated dendritic cells, central memory CD4+ and CD8+ T cells, effector memory CD4+ and CD8+ T cells, gamma delta T cells, immature B cells, macrophages, MDSCs, memory B cells, natural killer cells, natural killer T cells, and regulatory T cells (Figure 6B).
ALKBH5 Regulates Interferon Signaling, Lymphocyte Activation, and Activation of Antigen-Presenting Cells in Glioma
Since ALKBH5 expression shows positive correlation with tumor infiltration of immune cells in LGG, we further analyzed the relationship between ALKBH5 and tumor infiltrating immune cells in glioma using the ImmuCellAI and xCell databases. ALKBH5 expression levels showed positive correlation with various TIICs in the CGGA_325, CGGA_693, and TCGA glioma datasets; moreover, ALKBH5 expression correlated with the proportions of immune and stromal cells in the gliomas (Figure 7 and Supplementary Figure 9). This suggested that ALKBH5 expression modulated the recruitment of immune cells into the glioma and may affect the sensitivity of glioma patients to immunotherapy.
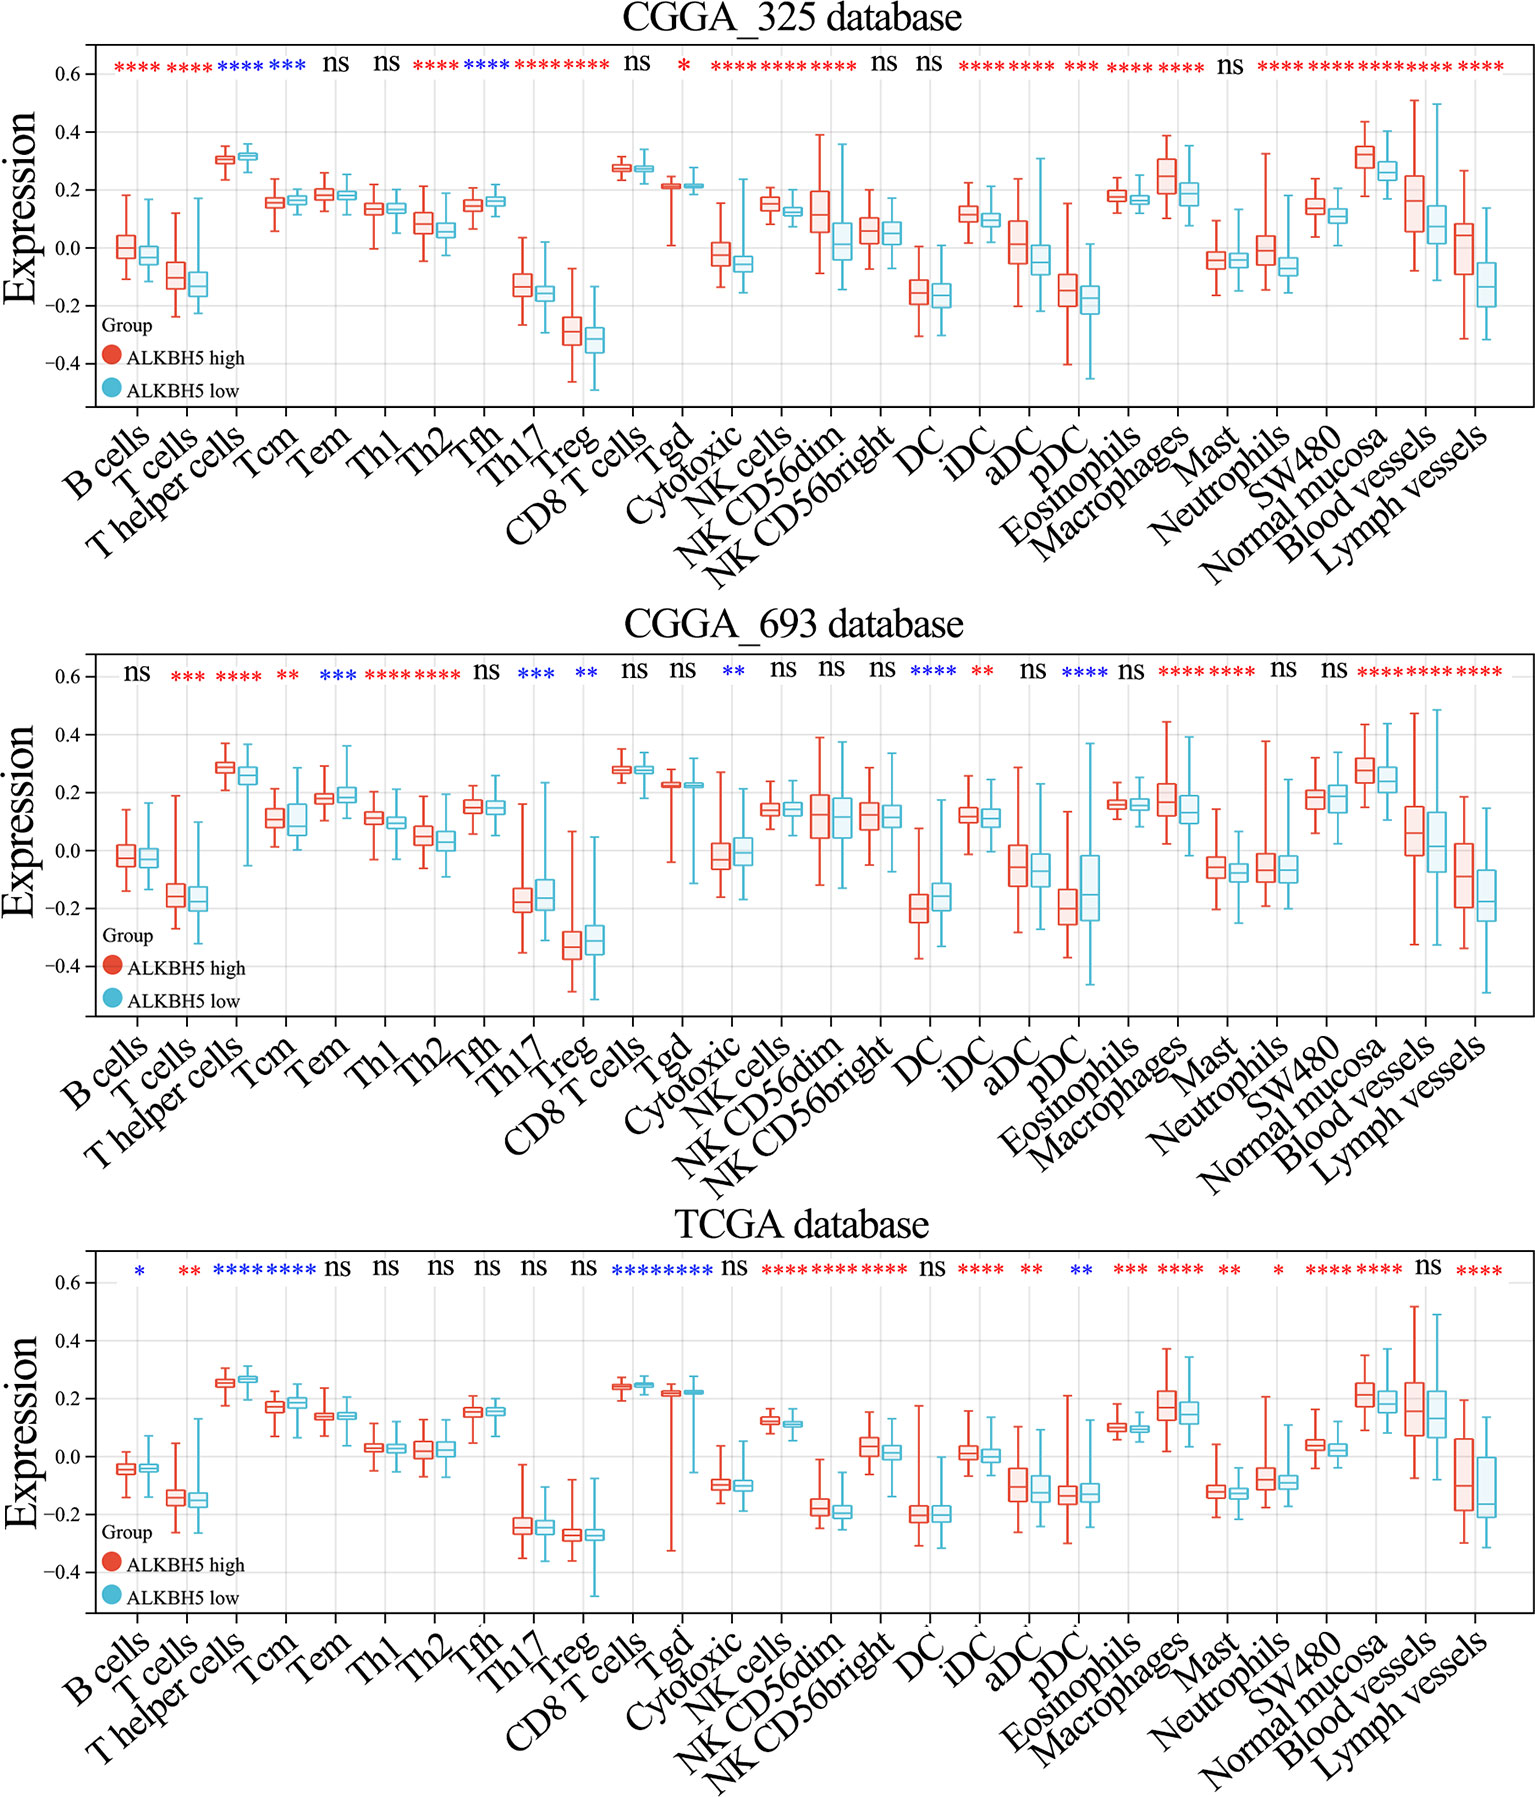
Figure 7 Correlation between ALKBH5 mRNA expression and tumor immune-related cells in glioma. The correlation between ALKBH5 mRNA expression and immune cells types in glioma calculated by xCell algorithm in CGGA_325, CGGA_693 and TCGA datasets. ns (nonsense), *P<0.05, **P<0.01, ***P<0.001, ****P<0.0001.
We then further investigated the effects of ALKBH5 expression on the tumor immune microenvironment (TIM) of glioma by screening seven metagenes, namely, HCK, IgG, Interferon, LCK, MHC-I, MHC-II, and STAT1, which reflect the status of inflammation and immune responses (48, 49). Our results showed higher enrichment scores for the lymphocyte-specific kinase (LCK), major histocompatibility complex I (MHC-I), major histocompatibility complex II (MHC-II) and signal transducer and activator of transcription 1 (STAT1) metagenes in glioma patients with high ALKBH5 expression levels from the CGGA_325, CGGA_693, and TCGA datasets (Supplementary Figure 10). This suggested that ALKBH5 expression regulated interferon signaling, lymphocyte activation, and activation of antigen-presenting cells in the gliomas.
ALKBH5 Correlates With Immune Checkpoint Blockade Proteins and Is a Potential Biomarker of Tumor Immunotherapeutic Response in Multiple Tumors
Antitumor immunity is a strong predictor of the efficacy of tumor immunotherapy and correlates with microsatellite instability (MSI), tumor mutation burden (TMB), and neoantigens in the tumor microenvironment (50). Tumors with high MSI (MSI-H) and TMB respond favorably to immune checkpoint inhibition therapies (51). Neoantigens are mutated antigens that are specifically expressed by the tumor tissues and are potential targets for T cell-based tumor immunotherapy (52). Therefore, we investigated the relationship between ALKBH5 expression levels and MSI, TMB or neoantigens to determine if ALKBH5 was a predictor of immunotherapeutic responses in multiple cancer types. ALKBH5 expression showed positive correlation with MSI in LUAD (P=0.038), UCEC (P=3.6e-06), CESC (P=0.027), COAD (P=1e-19) and READ (P=0.017), and negative association with MSI in PRAD (P=0.0071), THCA (P=0.0036), DLBC (P=0.026) and KICH (P=0.023) (Figure 6C). Furthermore, ALKBH5 expression showed positive relationship with TMB in UCEC (P=2.3e-10), CESC (P=0.0036), COAD (P=1.7e-12), STAD (P=0.026), READ (P=2.3E-07) and KICH (P=0.014), and negative association with TMB in LUAD (P=0.047) and THCA (P=0.014) (Figure 6D). ALKBH5 expression also showed positive correlation with neoantigens in UCEC (P=0.0015), COAD (P=0.0072), READ (P=0.0069) and LGG (P=0.012), and negative association with neoantigens in BRCA (P=0.003) and THCA (P=0.0086) (Figure 6E).
The immune checkpoint (ICP) blockade proteins are the most promising targets of cancer immunotherapeutic treatments because they regulate the infiltration of immune cells into the tumor microenvironment (48). Therefore, we analyzed the relationship between expression levels of ICP genes and ALKBH5 in multiple cancer types. ALKBH5 expression showed a positive correlation with ICP genes in UVM, KICH, LGG and COAD (Figure 6F). ALKBH5 expression showed positive correlation with 34 out of 47 ICP genes in COAD and 32 out of 47 ICP genes in UVM (Figure 6F). These results suggested that ALKBH5 affected the sensitivity of UVM, KICH, LGG and COAD to the immune checkpoint inhibitor therapies. In THCA, ALKBH5 expression showed negative correlation with the ICP genes (Figure 6F). This suggested that THCA patients with high ALKBH5 expression may respond poorly to immunotherapies targeting ICP genes. Next, we analyzed the correlation between ALKBH5 and various ICP receptors and ligands in glioma patients from the CGGA_325, CGGA_693, and TCGA datasets (49). ALKBH5 expression showed positive association with ICP receptors such as TNFRSF14, CD40, CD96 and CD200R1, and ICP ligands such as PDCD1LG2, CD70, TNFSF14, ICOSLG and CD274 in glioma tissues (Supplementary Figure 11). Therefore, we hypothesized that high ALKBH5 expression altered the immune microenvironment in the glioma tissues by modulating the expression levels of ICP receptors and ligands such as TNFRSF14, CD40, CD96, PDCD1LG2, CD70 and TNFSF14. This suggested that ALKBH5 mediated the activation of ICP genes and was an ideal target for immunotherapy of glioma patients.
Overall, our results suggested that ALKHB5 expression levels modulated the sensitivity of several tumors to immunotherapy. Therefore, ALKBH5 is a potential immunotherapy biomarker and predictor of tumor immunotherapeutic response.
Construction of the Upstream lncRNA-miRNA Regulatory Network That Regulates ALKBH5 Expression Levels in Gliomas and Other Tumors
In recent years, several studies have shown that long non-coding RNAs (lncRNAs) play a significant role in tumorigenesis by regulating the expression of the downstream mRNAs through sequestering of their target miRNAs (53, 54). Therefore, we investigated the lncRNA-miRNA network that may regulate ALKBH5 expression in various tumors. First, we screened the miRWalk, miRDB, Targetscan, and miRabel databases and identified 49 miRNAs that potentially target the ALKBH5 mRNAs (Figure 8A). The top 10 ALKBH5 mRNA-targeting miRNAs were hsa-miR-4732-5p, hsa-miR-193a-3p, hsa-miR-362-3p, hsa-miR-193b-3p, hsa-miR-589-5p, hsa-miR-4736, hsa-miR-6840-3p, hsa-miR-329-3p, hsa-miR-5008-5p and hsa-miR-6132 (Figure 8B).
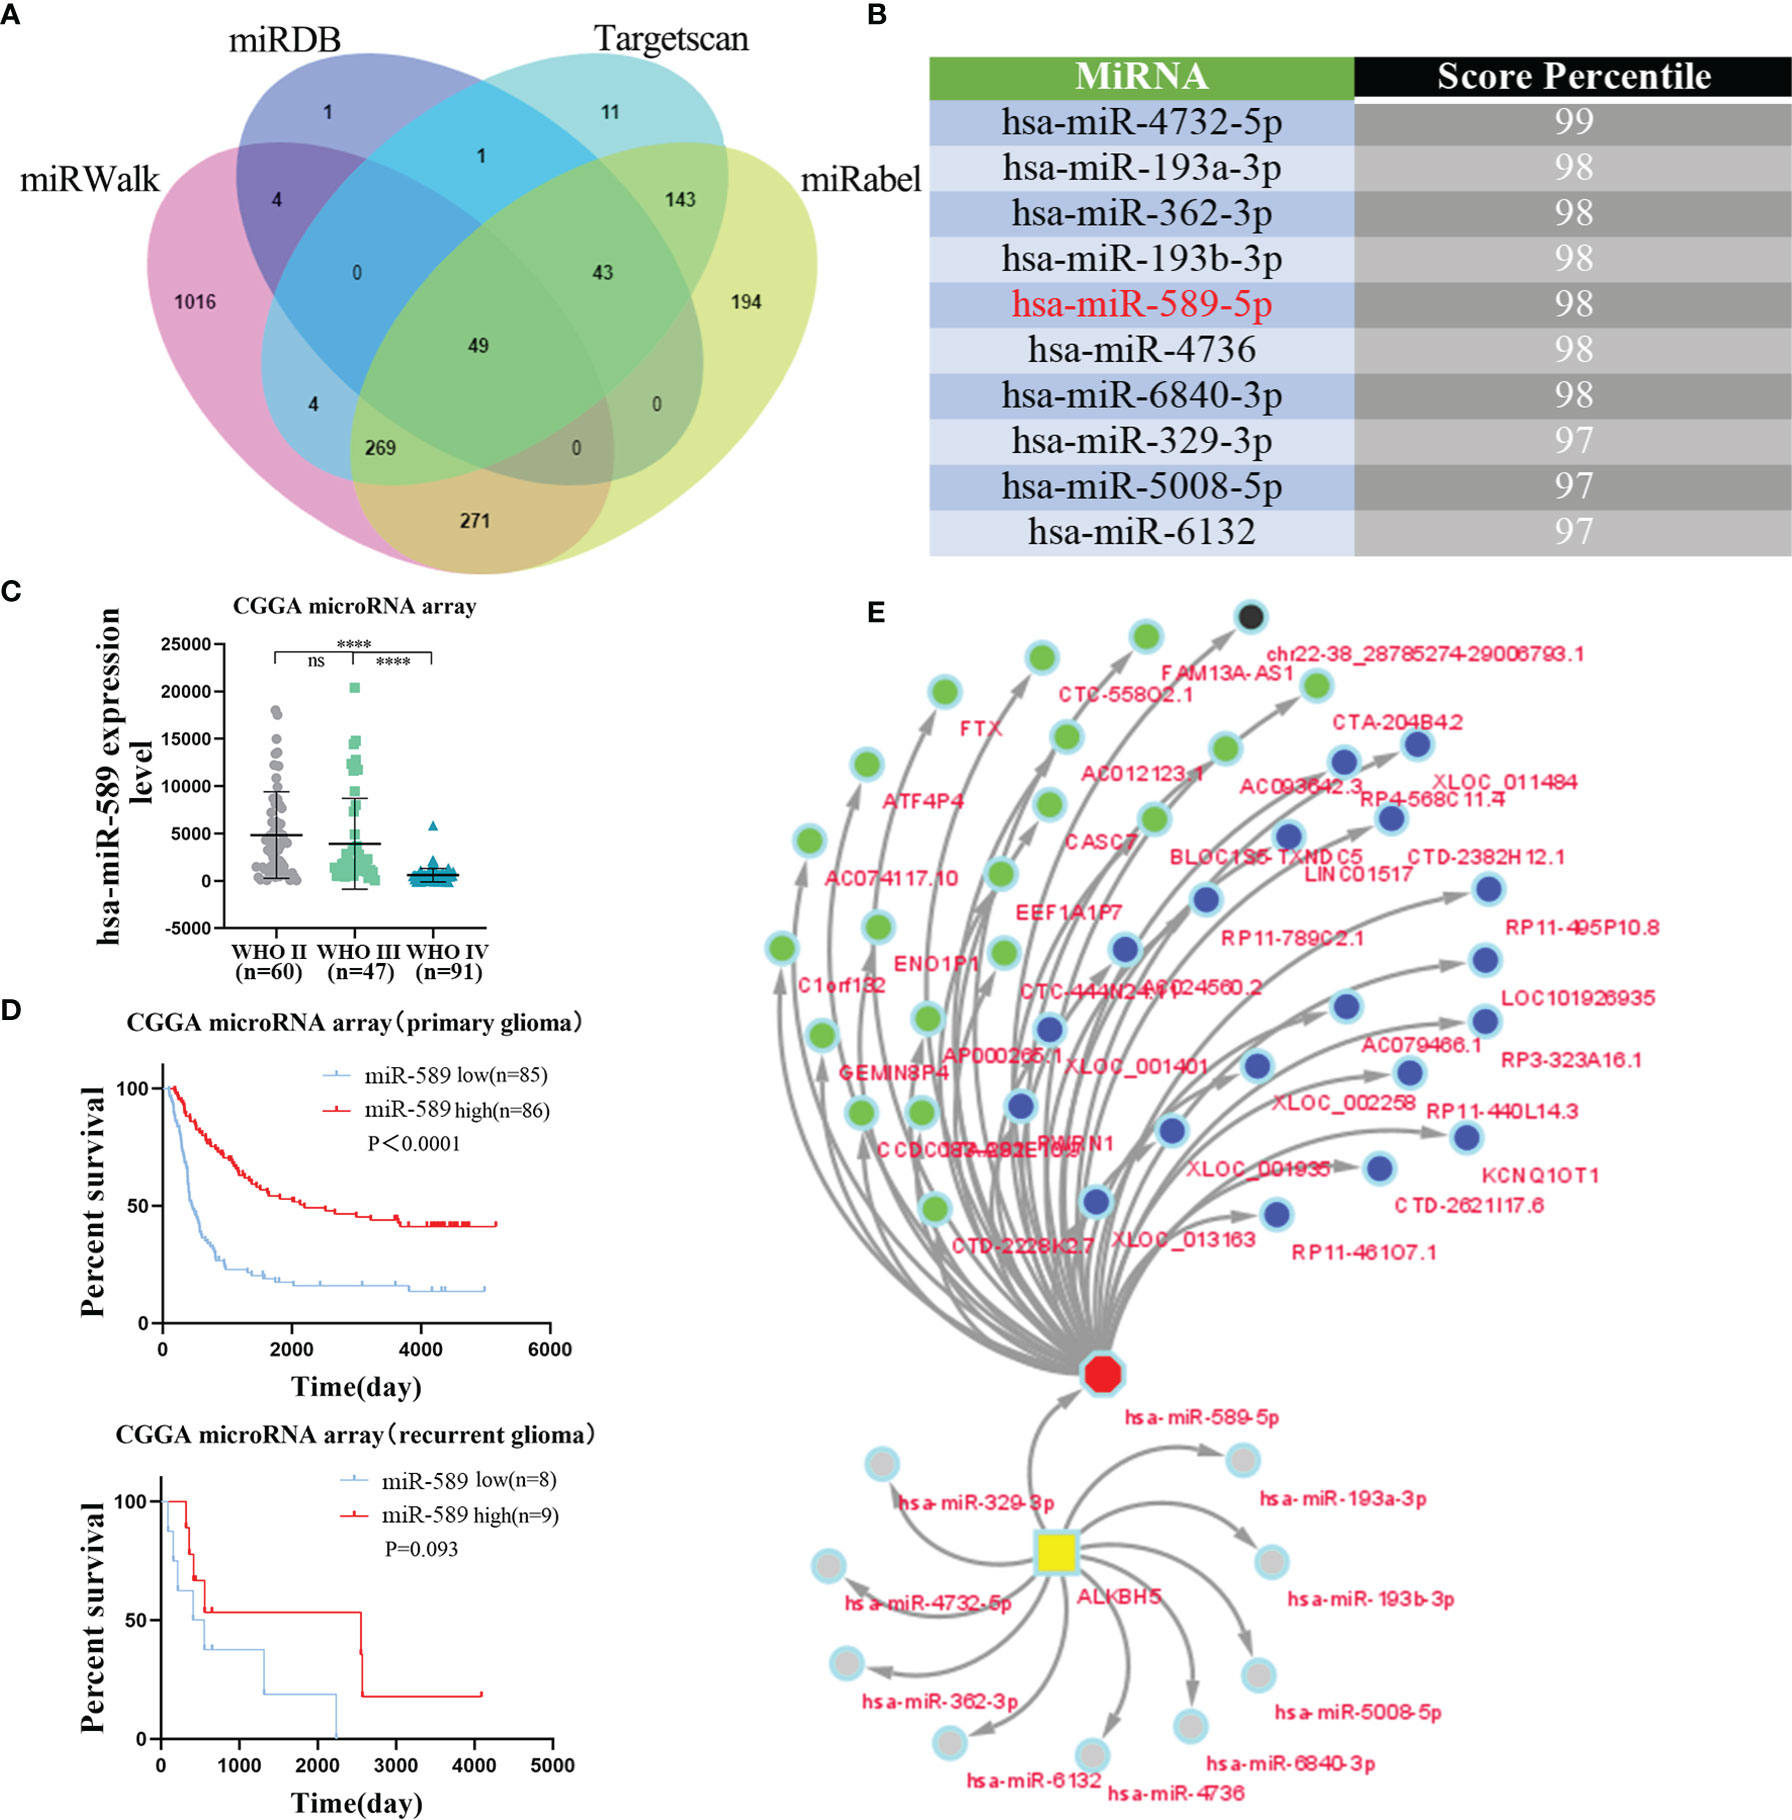
Figure 8 The lncRNA-miRNA-ALKBH5 regulatory network constructed. (A) The upstream miRNAs of ALKBH5 were predicted by miRWalk, miRDB, Targetscan and miRabel databases and the intersection was taken (49 intersection miRNAs). (B) The top 10 miRNAs targeting ALKBH5 were displayed in Targetscan database. (C)The relationship between hsa-miR-589 expression and grade in glioma from CGGA microRNA array dataset. (D) The relationship between hsa-miR-589 expression and prognosis in glioma patients from CGGA microRNA array dataset. (E)The lncRNA-miRNA-ALKBH5 regulatory network was constructed by Cytoscape. ns (nonsense), ****P<0.0001.
Among these 10 ALKBH5 mRNA-targeting miRNAs, 5 miRNAs (hsa-miR-193a-3p, hsa-miR-362-3p, hsa-miR-193b-3p, hsa-miR-589-5p and hsa-miR-329-3p) were found in the CGGA database (Figures 8C, D and Supplementary Figure 12). Bioinformatics analysis showed that the expression levels of hsa-miR-193a-3p (Supplementary Figure 12A), hsa-miR-362-3p (Supplementary Figure 12C), and hsa-miR-193b-3p (Supplementary Figure 12E) were positively associated with glioma grades, whereas, the expression levels of hsa-miR-589-5p (Figure 8C) and hsa-miR-329-3p (Supplementary Figure 12G) showed negative correlation with glioma grades. Kaplan-Meier survival curve analysis of glioma patients in the CGGA database showed that hsa-miR-589-5p was associated with the prognosis of primary glioma patients (Figure 8D). The expression levels of hsa-miR-329-3p were not associated with the prognosis of glioma patients (Supplementary Figure 12H). These results suggested that hsa-miR-589-5p potentially targeted ALKBH5 expression in the gliomas.
Next, we identified 769 predicted lncRNAs and 73 validated lncRNAs that may target hsa-miR-589-5p using the LncBase database. The top 20 predicted lncRNAs and top 20 validated lncRNAs were used to construct a lncRNA-miRNA-ALKBH5 regulatory network using the cytoscape software (Figure 8E). These results demonstrated the upstream lncRNA-miRNA regulatory network that may regulate the aberrant expression of ALKBH5 in the gliomas.
ALKBH5 Promotes In Vitro and In Vivo Proliferation, Migration, and Invasion of Glioma Cells and Affect the Recruitment of M2 Macrophages
Next, we analyzed ALKBH5 expression levels in various glioma cell lines by qRT-PCR. ALKBH5 mRNA levels were significantly higher in the U87-MG and U251-MG cell lines compared to the other glioma cell lines and were consistent with the results from the CCLE database (Figure 9A and Supplementary Figure 13). We then used specific ALKBH5-targeting siRNAs to knockdown the expression levels of ALKBH5 in the U87-MG and U251-MG cells (Figure 9B). And ALKBH5 was overexpressed by using the ALKBH5 overexpression plasmid (Supplementary Figure 14A). CCK-8 assay, Wound healing assay and Transwell assay results showed that ALKBH5 knockdown suppressed the cell proliferation, migration and invasion of U87-MG and U251-MG and ALKBH5 overexpression promoted the cell proliferation, migration and invasion of LN229 in vitro (Figures 9C-G and Supplementary Figures 14B–D). Moreover, THP-1 cells were differentiated into M2 macrophage on the basis of classical inducing methods (Supplementary Figure 15) (55–57). Silencing of ALKBH5 in U87 and U251 cells significantly reduced the infiltration of M2 macrophages (Figure 9H), consisting with the results of our previous analysis (Figure 7 and Supplementary Figure 9). Furthermore, tumor xenograft experiments showed that ALKBH5 knockdown suppressed the in vivo growth of glioma cells (Figures 9I–K). These results showed that ALKBH5 promoted in vitro and in vivo proliferation, migration, and invasion of glioma cells.
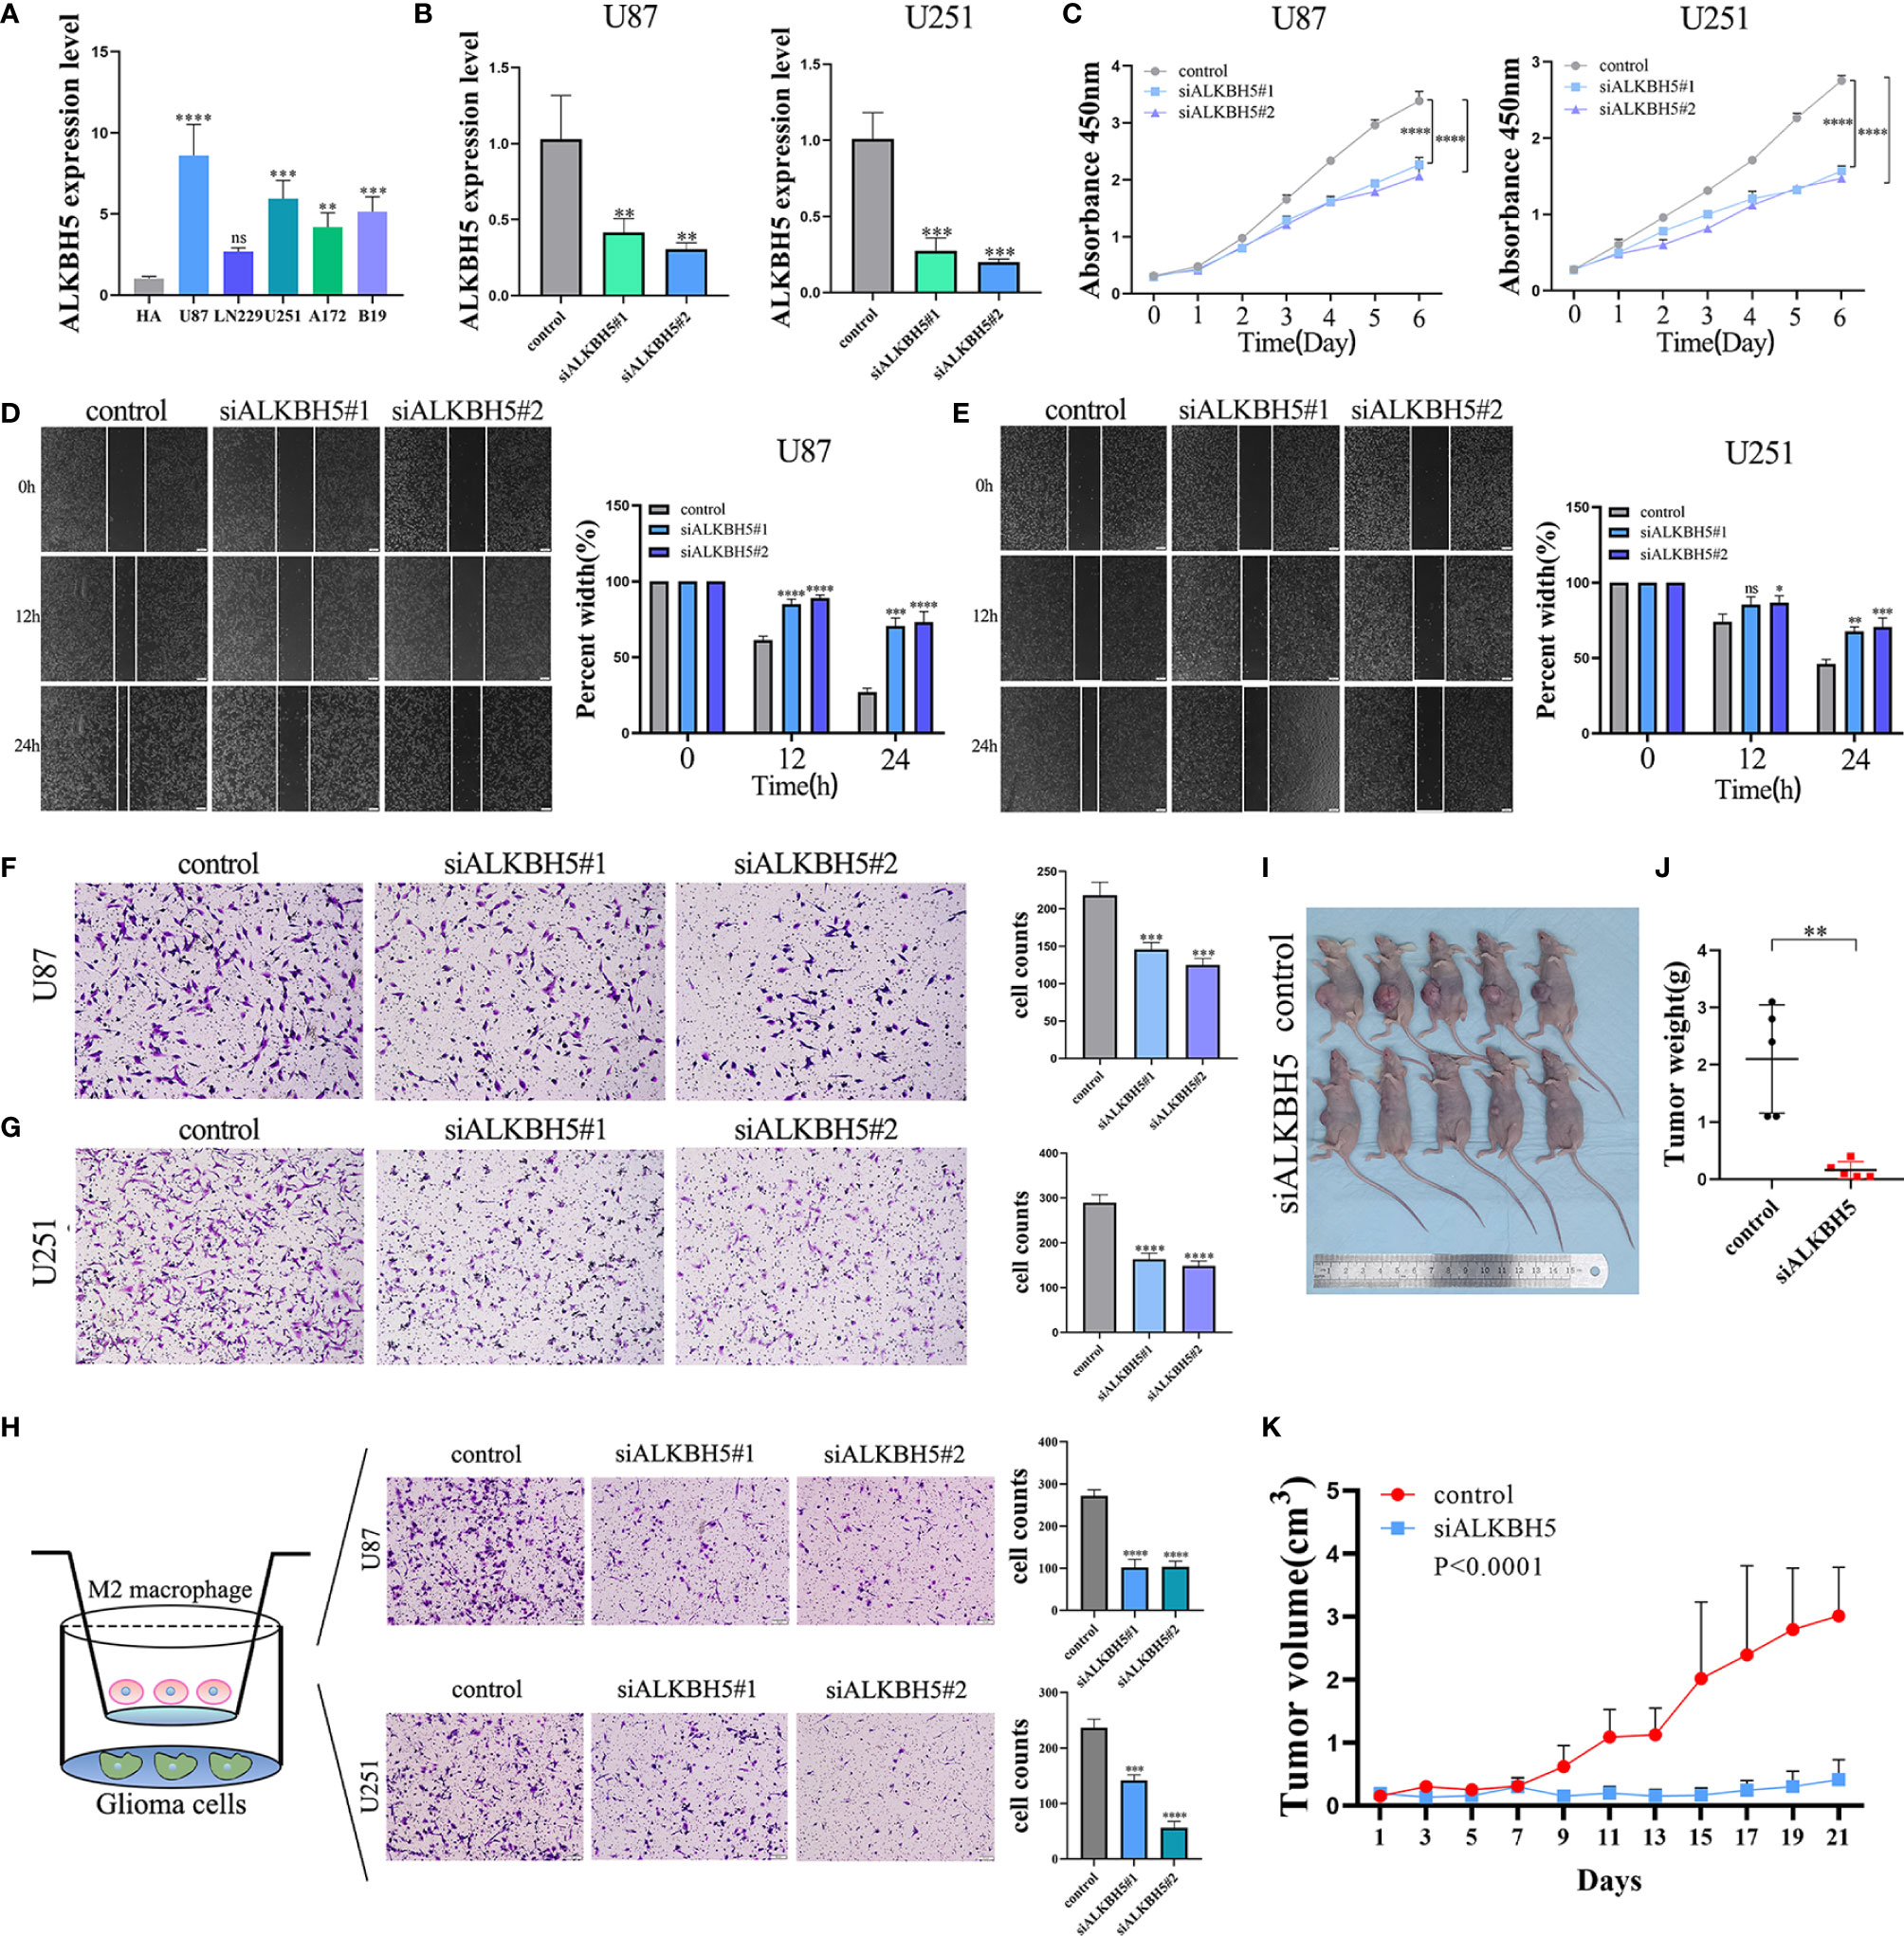
Figure 9 The biological functions of ALKBH5 in glioma. (A) The expression levels of ALKBH5 were verified in multi-cell lines, including human astrocyte (HA), U87, LN229, U251, A172 and B19 cell lines. (B) Verification of knockdown efficiency of ALKBH5 in U87 and U251 cell lines. The biological functions of ALKBH5 on glioma cell lines were verified by CCK-8 (C), wound healing (D, E) and Transwell (F, G) experiments. Xenograft mouse models were generated by subcutaneous injection of U87 cells into nude mice. Seven days after implanted, mice were treated with control siRNA (n=8) or ALKBH5 siRNA (n=8). (H) Infiltration of M2 macrophage in control (left), siALKBH5#1 (middle), siALKBH5#2 (right) of U87 and U251 cells. Representative image of subcutaneous tumors (I), tumor weight (J) and tumor growth curve (K), in si-ALKBH5 treated or control siRNA treated xenograft models with U87 cells. ns (nonsense), *P<0.05, **P<0.01, ***P<0.001, ****P<0.0001.
Discussion
N6-methyladenosine (m6A) modification is the most common chemical modification in messenger RNAs (mRNAs), and non-coding RNAs (ncRNAs) (58). The reversible N6-methylation of adenosine is a dynamic post-transcriptional modification process involving three protein complexes, namely, m6A readers, m6A writers, and m6A erasers (59). Several studies have shown that aberrant m6A modification regulates the development, growth, and progression of various tumors (1).
ALKBH5 is a m6A demethylase that is associated with the development and progression of multiple cancer types (60), such as glioblastoma, ovarian cancer, lung cancer, liver cancer, pancreatic cancer and osteosarcoma. However, pan-cancer analysis of ALKBH5 has not been investigated. Therefore, we investigated the functional role of ALKBH5 in multiple tumors, especially gliomas. The analysis included the effects of ALKBH5 RNA expression levels on prognosis, as well as the genetic alterations in the ALKBH5 gene, GO and KEGG analyses of ALKBH5-related genes, and tumor immunity. We also investigated the upstream lncRNA-miRNA network that regulates ALKBH5 expression in gliomas and its effects on glioma progression.
In this study, we first performed comprehensive bioinformatics analysis to determine the functional role of ALKBH5 in multiple cancers using the patient data from various databases. The results showed that ALKBH5 mRNA and protein levels were upregulated compared to the corresponding normal tissues in multiple cancers including glioma. Our analysis was confirmed by the previous studies. ALKBH5 mRNA was increased in epithelial ovarian cancer tissue as compared to the normal ovarian tissues and ALKBH5 silencing could inhibit the proliferation and invasion of epithelial ovarian cancer cells (16). Xu et al. found that ALKBH5 protein expression was increased in colon cancer and could promote colon cancer progression by decreasing methylation of the lncRNA NEAT1 (61). Gu et al. discovered that the mRNA and protein expressions of ALKBH5 were overexpressed in endometrial cancer cells and promoted proliferation and invasion of endometrial cancer via erasing IGF1R m6A-modifications (62). For glioma, Ji et al. found that the mRNA and protein expressions of ALKBH5 were upregulated in glioma and promoted the glioma cells proliferation by increasing the mRNA stability of G6PD (63). ALKBH5 expression was associated with tumor grades, subtypes, and new WHO tumor types (IDH mut+codel, IDH mut+non-codel and IDH wild) in glioma. The pan-cancer analysis showed correlation between ALKBH5 mRNA expression and the prognosis of cancer patients. Analysis of 100 glioma cases discovered that glioma patients with high ALKBH5 expression levels had shorter OS compared with patients with low ALKBH5 expression level. IDH mutations, considered as truncal events, are occurred in the vast majority of low-grade gliomas (LGG) and secondary GBM (64). The 2016 WHO Classification of CNS tumors included several tumor-specific molecular alterations in the classification and diagnosis of gliomas. The 1p/19q co-deletion status were included in the oligodendroglioma stratification. Multiple studies have shown that 1p/19q co-deletion had significant prognostic value in the WHO oligodendrocytoma subgroup (49). In our studies, high ALKBH5 expression was associated with clinical features such as IDH wildtype status, 1p/19q non-codeleted status, and demethylation of MGMT, all of which were related to poor prognosis in the glioma patients. Cox regression analysis showed that ALKBH5 was an independent prognostic predictor in glioma patients. Recent research showed that ALKBH5 mRNA and protein expression were upregulated in glioblastoma stem-like cells (GSCs) and ALKBH5 could maintain the tumorigenicity of GSCs by maintaining FOXM1 expression (15). And Guo et al. found that lncRNA SOX2OT could enhance SOX2 expression through ALKBH5-mediated epigenetic regulation in glioblastoma, thereby promoting temozolomide resistance (65). Moreover, Catherine Seva et al. reported that ALKBH5 promoted radio-resistance and invasion capability of glioblastoma stem cells (GBMSCs) (66). These findings demonstrated that high ALKBH5 expression was associated with unfavorable survival outcomes in gliomas. Overall, our analysis showed that ALKBH5 was a potential prognostic biomarker in various cancers, especially in glioma.
Somatic mutations in critical genes transform normal cells into cancer cells (67). Moreover, somatic mutations in the cancer cells contribute significantly to immune evasion and poor responses to therapies (68). We identified amplifications, mutations, and deep deletions as the most frequent alterations in the ALKBH5 gene in several cancer types. In this study, gliomas with low ALKBH5 expression showed higher proportion (66%) of IDH1 mutations compared to those with high ALKBH5 expression (21%). Previous reports showed that IDH mutations were more abundant in LGG, and the survival rate of LGG patients was higher than those with HGG (69). The low ALKBH5 expressing glioma patients (46%) also showed increased frequency of mutations in TP53 compared to the high ALKBH5 expressing group (37%). TP53 is a well-known tumor suppressor gene that inhibits GBM progression. The high ALKBH5-expressing glioma patients showed higher EGFR mutational rate compared to those with low ALKBH5 expression (24% vs. 15%). Previous studies showed that EGFR activation in patients with GBM was associated with worse survival outcomes (70). Therefore, ALKBH5 is a potential prognostic biomarker for patients with glioma and multiple cancer types.
In order to explore the biological functions of ALKBH5, we applied GO and KEGG analysis of ALKBH5 related genes. GO and KEGG pathway enrichment analysis showed that high ALKBH5 expression correlated with the activation of metabolic and immune signaling pathways in various tumors. In glioma, ALKBH5 could affect immunity, metabolism, cell cycle, DNA damage repair via CGGA_325, CGGA_693, TCGA and GSE93054 datasets. We focused on the effect of ALKBH5 on immunity, for the significant role of immune system in preventing and fighting tumors. In recent years, cancer immunotherapy, restoring the immune system’s ability to recognize and destroy tumor cells, has shown significant clinical results, but only for a small number of tumors (64). And the tumor-infiltrating immune cells play a significant role in the tumor microenvironment (TME), which provides a favorable microenvironment for the survival of cancer cells, and is associated with regulation of tumor immunosurveillance and therapeutic response of tumors (71, 72). ESTIMATE analysis showed that high expression of ALKBH5 correlated significantly with the infiltration of immune cells and stromal cells in multiple cancers. These results suggested that ALKBH5 inhibited the infiltration of immune cells into tumors, thereby enabling the tumor cells to evade the immune system. Tariq M Rana et al. found that ALKBH5 could regulate the expression of Mct4/Slc16a3 and lactate content in tumor microenvironment, as well as the composition of tumor infiltrating Treg and bone marrow derived inhibitory cells, thereby inhibiting immune cells accumulation in tumor microenvironment in some tumors, which was consistent with our analysis (23).
In recent years, immunotherapy has been widely applied in tumors, but many solid tumors showed poor immunotherapy effect due to their special immunosuppressive microenvironment (49). As an immunologically “cold tumor”, glioma is considered to be highly resistant to immunotherapy. However, our research found that ALKBH5 expression was positively correlated with the infiltration of immune cells into the tumors in glioma and may affect the sensitivity of glioma patients to immunotherapy. Wu et al. found that ALKBH5 promoted the generation of immunosuppressive tumor microenvironment via hypoxia-induced paraspeckle assembly and IL8 secretion (73). These results suggested that ALKBH5 could be acted as a potential therapeutic target for glioma and as a novel marker to predict prognosis of glioma patients (74). In addition, analysis of the seven inflammation and immune related clusters suggested that high ALKBH5 expression activated the antigen-presenting cells and lymphocytes, and enhanced interferon signaling in the glioma tissues. Overall, these data suggested that glioma patients with high ALKBH5 expression may benefit from immunotherapy. This study provides theoretical basis for the application of immunotherapy in patients with glioma (49).
Recent studies have shown that tumors with high MSI (MSI-H), TMB or neoantigens show better response to immunotherapy (75). ICP proteins play a significant role in the tumor-infiltration of immune cells and immunotherapy (76). Therefore, ICP gene expression is used to select tumor patients that may benefit from immune checkpoint blockage (ICB) therapy (77). Our results showed that the expression of ALKBH5 was closely related to MSI, TMB, and neoantigens in various tumors. ALKBH5 expression correlated with the expression of multiple ICP genes in multiple cancers. This suggested that ALKBH5 regulated tumor immunity in several cancer types. Therefore, ALKBH5 may be a potential predictive biomarker of immunotherapeutic responses in patients with malignant tumors. Finally, we used Targetscan, miWalk, miRDB, miRabel and other websites to identify ALKBH5-targeting miRNAs and lncRNAs and constructed a lncRNA-miRNA-ALKBH5 regulatory network that regulates the abnormal expression of ALKBH5 in various cancers. Furthermore, in vivo and in vitro experiments with glioma cells showed that ALKBH5 acted as an oncogene and promoted the growth, migration, and invasiveness of the glioma cells. And ALKBH5 knockdown could reduce the infiltration of M2 macrophage in U87 and U251 cells.
In summary, our results suggested that ALKBH5 was aberrantly expressed in various cancers and significantly correlated with the prognosis of cancer patients. ALKBH5 gene alterations including mutations, duplications, and amplifications were identified in a wide variety of cancer types. ALKBH5 expression showed significant association with the infiltration of immune cells into the tumor microenvironment and immunotherapeutic response in multiple cancers. Therefore, ALKBH5 is a potential immunotherapeutic biomarker for selecting tumor patients that may benefit from immune checkpoint blockade (ICB) therapy in glioma and other cancers. In vitro and in vivo experiments confirmed that ALKBH5 functioned as an oncogene in gliomas. Our study suggested that ALKBH5 was a promising prognostic biomarker as well as a potential predictor of sensitivity to immunotherapy in several malignant tumors and glioma.
List of abbreviations
The information is shown in Supplementary Table 1.
Data Availability Statement
The original contributions presented in the study are included in the article/Supplementary Material. Further inquiries can be directed to the corresponding authors.
Ethics Statement
The animal study was reviewed and approved by Ethics Committee of the Tianjin Neurological Institute and Hospital (Tianjin Medical University General Hospital).
Author Contributions
CW, BW and DP contributed equally to this study and made substantial contributions to conception and design, acquisition of data, and analysis and interpretation of data. LL and ZZ supplied the RNA-seq data and clinical information of 100 glioma patients. XZ, LL, ZL, YH and XD performed the experiments and were involved in drafting the article. HL, SL and SZ were mainly responsible for editing the data and revised the article critically for important intellectual content. LH, ZZ and JZ had given final approval of the version to be published. All authors read and approved the final manuscript.
Funding
The project was supported by the grants (Nos. 81773187, 81702465) from National Nature Science Foundation of China and by Tianjin high school program for young and middle-aged talents backbone and Tianjin young medical talents program.
Conflict of Interest
The authors declare that the research was conducted in the absence of any commercial or financial relationships that could be construed as a potential conflict of interest.
Publisher’s Note
All claims expressed in this article are solely those of the authors and do not necessarily represent those of their affiliated organizations, or those of the publisher, the editors and the reviewers. Any product that may be evaluated in this article, or claim that may be made by its manufacturer, is not guaranteed or endorsed by the publisher.
Acknowledgments
We thank professor Xudong Wu (Department of Cell Biology, State Key Laboratory of Experimental Hematology, The Province and Ministry Co-sponsored Collaborative Innovation Center for Medical Epigenetics, Key Laboratory of Immune Microenvironment and Disease, Tianjin Medical University, Tianjin, China.) for providing the ALKBH5 overexpression plasmids.
Supplementary Material
The Supplementary Material for this article can be found online at: https://www.frontiersin.org/articles/10.3389/fimmu.2022.849592/full#supplementary-material
Supplementary Figure 1 | Flow chart of bioinformatics analyses.
Supplementary Figure 2 | ALKBH5 expression in different IDH status, 1p/19q status and MGMT promotor status in glioma. The expression level of ALKBH5 in different IDH status (A), 1p/19q status (B) and MGMT promotor status (C) of gliomas in CGGA_325, CGGA_693 and TCGA databases. *P<0.05, **P<0.01, ***P<0.001, ****P<0.0001.
Supplementary Figure 3 | ALKBH5 protein expression, location and conservation. (A) ALKBH5 protein expression in 44 normal tissues via THPA portal; (B) Localization of ALKBH5 protein in cells was displayed via THPA portal; (C) Conservation of ALKBH5 protein among different species through NCBI; (D) ALKBH5 protein expression in multiple tumors compared with adjacent normal tissues in TCGA database, including ovarian cancer (P=0.0178), breast cancer (P<0.0001), clear cell RCC (P<0.0001), lung adenocarcinoma (P<0.0001) and UCEC (P=0.0126).
Supplementary Figure 4 | Correlation between ALKBH5 mRNA expression and prognosis of tumor patients. The relationships between ALKBH5 expression level and OS (A) and DSS (B) of various cancers by SangerBox (P<0.05). The Kaplan-Meier plotter was applied to survival analysis by ALKBH5 mRNA expression level in ovarian cancer (C), gastric cancer (D), lung cancer (E) and liver cancer (F), including overall survival (OS), progression free survival (PFS), first progression (FP), post progression survival (PPS) and relapse free survival (RFS).
Supplementary Figure 5 | The relationships between ALKBH5 expression and prognosis of glioma patients. Kaplan-Meier analysis of ALKBH5 expression in the overall survival of patients with primary gliomas (A), recurrent glioma, low grade glioma (LGG), and glioblastoma (GBM) in CGGA_325 (A), CGGA_693 (B) and TCGA (C) databases.
Supplementary Figure 6 | Univariate and multivariate Cox analyses of ALKBH5 and clinical features in glioma. Univariate and multivariate Cox analyses of ALKBH5 and clinical features of glioma in CGGA_325 combined with CGGA_693 (A) and TCGA (B) databases. The nomogram model of ALKBH5 and clinical features in CGGA_325 combined with CGGA_693 (C) and TCGA datasets (D). *P<0.05, **P<0.01, ***P<0.001, ****P<0.0001.
Supplementary Figure 7 | Prognosis analyses of glioma patients. Kaplan-Meier analyses of overall survival among four patient groups stratified by the ALKBH5 mRNA level and IDH status (A), 1p/19q status (B), MGMT promotor status (C), radiotherapy (D), and chemotherapy (E) in CGGA_325 and CGGA_693 datasets. *P<0.05, **P<0.01, ***P<0.001, ****P<0.0001.
Supplementary Figure 8 | Correlation between ALKBH5 mRNA expression and ESTIMATE Score in glioma. The correlations between ALKBH5 mRNA expression level and ESTIMATE Score (P=5.5e-3, R=0.13) (A), Immune Score (P=0.02, R=0.09) (B) and Stromal Score (P=9.0e-4, R=0.13) (C) of glioma in TCGA dataset.
Supplementary Figure 9 | Relationship between ALKBH5 expression and immune cell infiltration in glioma. Comparison of immune cell infiltration between ALKBH5 high expression and ALKBH5 low expression groups in glioma by CGGA_325 (A), CGGA_693 (B) and TCGA (C) datasets via ImmuCellAl algorithm. Red asterisk represents the positive correlation between ALKBH5 expression and the level of immune cell infiltration, blue asterisk represents the negative correlation between ALKBH5 expression and the level of immune cell infiltration. *P<0.05, **P<0.01, ***P<0.001, ****P<0.0001.
Supplementary Figure 10 | Correlation analysis between ALKBH5 and immune and inflammatory-related metagenes in glioma. Enrichment scores of seven immune and inflammatory-related metagenes in glioma patients with different ALKBH5 mRNA expression level status in CGGA_325 (A), CGGA_693 (B) and TCGA (C) datasets. *P<0.05, **P<0.01, ***P<0.001, ****P<0.0001.
Supplementary Figure 11 | Correlation between ALKBH5 and immune checkpoint (ICP) genes in glioma. The correlation between ALKBH5 expression and ICP genes (receptors and ligands) of glioma in CGGA_325 (A), CGGA_693 (B) and TCGA (C) datasets. The red dots represent the positive correlation between ALKBH5 and ICP genes, while the green dots represent the negative correlation between ALKBH5 and ICP genes.
Supplementary Figure 12 | The relationships between the expressions of miRNAs and grade and prognosis in glioma. The relationships between the expressions of has-miR-193a-3p (A, B), has-miR-362-3p (C, D), has-miR-193b (E, F) and miR-329 (G, H) and grades or prognosis of primary and recurrent glioma in CGGA microRNA array database. *P<0.05, **P<0.01, ***P<0.001, ****P<0.0001.
Supplementary Figure 13 | The abundance of ALKBH5 mRNA expression in a variety of glioma cell lines by CCLE database. Cell lines labeled in red (U87-MG, U251-MG, A172 and LN229) were used to detect the relative expression level of ALKBH5 in this study via qPCR.
Supplementary Figure 14 | The biological functions of ALKBH5 in glioma. (A) Verification of overexpression efficiency of ALKBH5 via RT-qPCR in LN229 cell lines. The biological functions of ALKBH5 on LN229 cell lines were verified by CCK-8 (B), wound healing (C) and Transwell (D) experiments. *P<0.05, **P<0.01, ***P<0.001, ****P<0.0001.
Supplementary Figure 15 | Morphological changes of THP1 cells induced by PMA, IL-4 and IL-13. Morphological changes of THP1 cells were observed 24 h after PMA induction and 24h/48 h after IL-4 and IL-13 induction.
References
1. Chen XY, Zhang J, Zhu JS. The Role of M(6)A RNA Methylation in Human Cancer. Mol Cancer (2019) 18:103. doi: 10.1186/s12943-019-1033-z
2. Deng X, Su R, Weng H, Huang H, Li Z, Chen J. RNA N(6)-Methyladenosine Modification in Cancers: Current Status and Perspectives. Cell Res (2018) 28:507–17. doi: 10.1038/s41422-018-0034-6
3. Wang T, Kong S, Tao M, Ju S. The Potential Role of RNA N6-Methyladenosine in Cancer Progression. Mol Cancer (2020) 19:88. doi: 10.1186/s12943-020-01204-7
4. Dixit D, Prager BC, Gimple RC, Poh HX, Wang Y, Wu Q, et al. The RNA M6a Reader YTHDF2 Maintains Oncogene Expression and Is a Targetable Dependency in Glioblastoma Stem Cells. Cancer Discov (2021) 11:480–99. doi: 10.1158/2159-8290.CD-20-0331
5. Kan L, Ott S, Joseph B, Park ES, Dai W, Kleiner RE, et al. A Neural M(6)A/Ythdf Pathway is Required for Learning and Memory in Drosophila. Nat Commun (2021) 12:1458. doi: 10.1038/s41467-021-21537-1
6. Zhang L, Wan Y, Zhang Z, Jiang Y, Gu Z, Ma X, et al. IGF2BP1 Overexpression Stabilizes PEG10 mRNA in an M6a-Dependent Manner and Promotes Endometrial Cancer Progression. Theranostics (2021) 11:1100–14. doi: 10.7150/thno.49345
7. Nombela P, Miguel-Lopez B, Blanco S. The Role of M(6)A, M(5)C and Psi RNA Modifications in Cancer: Novel Therapeutic Opportunities. Mol Cancer (2021) 20:18. doi: 10.1186/s12943-020-01263-w
8. Chen H, Gao S, Liu W, Wong CC, Wu J, Wu J, et al. RNA N(6)-Methyladenosine Methyltransferase METTL3 Facilitates Colorectal Cancer by Activating the M(6)A-GLUT1-Mtorc1 Axis and Is a Therapeutic Target. Gastroenterology (2021) 160:1284–300. doi: 10.1053/j.gastro.2020.11.013
9. Purslow JA, Nguyen TT, Egner TK, Dotas RR, Khatiwada B, Venditti V. Active Site Breathing of Human Alkbh5 Revealed by Solution NMR and Accelerated Molecular Dynamics. Biophys J (2018) 115:1895–905. doi: 10.1016/j.bpj.2018.10.004
10. Han Z, Wang X, Xu Z, Cao Y, Gong R, Yu Y, et al. ALKBH5 Regulates Cardiomyocyte Proliferation and Heart Regeneration by Demethylating the mRNA of YTHDF1. Theranostics (2021) 11:3000–16. doi: 10.7150/thno.47354
11. Li Z, Wang P, Li J, Xie Z, Cen S, Li M, et al. The N(6)-Methyladenosine Demethylase ALKBH5 Negatively Regulates the Osteogenic Differentiation of Mesenchymal Stem Cells Through PRMT6. Cell Death Dis (2021) 12:578. doi: 10.1038/s41419-021-03869-4
12. Aik W, Scotti JS, Choi H, Gong L, Demetriades M, Schofield CJ, et al. Structure of Human RNA N(6)-Methyladenine Demethylase ALKBH5 Provides Insights Into its Mechanisms of Nucleic Acid Recognition and Demethylation. Nucleic Acids Res (2014) 42:4741–54. doi: 10.1093/nar/gku085
13. Wang HF, Kuang MJ, Han SJ, Wang AB, Qiu J, Wang F, et al. BMP2 Modified by the M(6)A Demethylation Enzyme ALKBH5 in the Ossification of the Ligamentum Flavum Through the AKT Signaling Pathway. Calcif Tissue Int (2020) 106:486–93. doi: 10.1007/s00223-019-00654-6
14. Zhang C, Samanta D, Lu H, Bullen JW, Zhang H, Chen I, et al. Hypoxia Induces the Breast Cancer Stem Cell Phenotype by HIF-Dependent and ALKBH5-Mediated M(6)A-Demethylation of NANOG mRNA. Proc Natl Acad Sci USA (2016) 113:E2047–56. doi: 10.1073/pnas.1602883113
15. Zhang S, Zhao BS, Zhou A, Lin K, Zheng S, Lu Z, et al. M(6)A Demethylase ALKBH5 Maintains Tumorigenicity of Glioblastoma Stem-Like Cells by Sustaining FOXM1 Expression and Cell Proliferation Program. Cancer Cell (2017) 31:591–606. doi: 10.1016/j.ccell.2017.02.013
16. Zhu H, Gan X, Jiang X, Diao S, Wu H, Hu J. ALKBH5 Inhibited Autophagy of Epithelial Ovarian Cancer Through miR-7 and BCL-2. J Exp Clin Cancer Res (2019) 38:163. doi: 10.1186/s13046-019-1159-2
17. Jin D, Guo J, Wu Y, Yang L, Wang X, Du J, et al. M(6)A Demethylase ALKBH5 Inhibits Tumor Growth and Metastasis by Reducing YTHDFs-Mediated YAP Expression and Inhibiting miR-107/LATS2-Mediated YAP Activity in NSCLC. Mol Cancer (2020) 19:40. doi: 10.1186/s12943-020-01161-1
18. Tang B, Yang Y, Kang M, Wang Y, Wang Y, Bi Y, et al. M(6)A Demethylase ALKBH5 Inhibits Pancreatic Cancer Tumorigenesis by Decreasing WIF-1 RNA Methylation and Mediating Wnt Signaling. Mol Cancer (2020) 19:3. doi: 10.1186/s12943-019-1128-6
19. Hu BB, Wang XY, Gu XY, Zou C, Gao ZJ, Zhang H, et al. N(6)-Methyladenosine (M(6)A) RNA Modification in Gastrointestinal Tract Cancers: Roles, Mechanisms, and Applications. Mol Cancer (2019) 18:178. doi: 10.1186/s12943-019-1099-7
20. Yuan Y, Yan G, He M, Lei H, Li L, Wang Y, et al. ALKBH5 Suppresses Tumor Progression via an M(6)A-Dependent Epigenetic Silencing of pre-miR-181b-1/YAP Signaling Axis in Osteosarcoma. Cell Death Dis (2021) 12:60. doi: 10.1038/s41419-020-03315-x
21. Shen C, Sheng Y, Zhu AC, Robinson S, Jiang X, Dong L, et al. RNA Demethylase ALKBH5 Selectively Promotes Tumorigenesis and Cancer Stem Cell Self-Renewal in Acute Myeloid Leukemia. Cell Stem Cell (2020) 27:64–80. doi: 10.1016/j.stem.2020.04.009
22. Chen Y, Zhao Y, Chen J, Peng C, Zhang Y, Tong R, et al. ALKBH5 Suppresses Malignancy of Hepatocellular Carcinoma via M(6)A-Guided Epigenetic Inhibition of LYPD1. Mol Cancer (2020) 19:123. doi: 10.1186/s12943-020-01239-w
23. Li N, Kang Y, Wang L, Huff S, Tang R, Hui H, et al. ALKBH5 Regulates Anti-PD-1 Therapy Response by Modulating Lactate and Suppressive Immune Cell Accumulation in Tumor Microenvironment. Proc Natl Acad Sci USA (2020) 117:20159–70. doi: 10.1073/pnas.1918986117
24. Peng D, Wei C, Zhang X, Li S, Liang H, Zheng X, et al. Pan-Cancer Analysis Combined With Experiments Predicts CTHRC1 as a Therapeutic Target for Human Cancers. Cancer Cell Int (2021) 21:566. doi: 10.1186/s12935-021-02266-3
25. Tang Z, Kang B, Li C, Chen T, Zhang Z. GEPIA2: An Enhanced Web Server for Large-Scale Expression Profiling and Interactive Analysis. Nucleic Acids Res (2019) 47:W556–60. doi: 10.1093/nar/gkz430
26. Hu J, Qiu D, Yu A, Hu J, Deng H, Li H, et al. YTHDF1 Is a Potential Pan-Cancer Biomarker for Prognosis and Immunotherapy. Front Oncol (2021) 11:607224:607224. doi: 10.3389/fonc.2021.607224
27. Chandrashekar DS, Bashel B, Balasubramanya S, Creighton CJ, Ponce-Rodriguez I, Chakravarthi B, et al. UALCAN: A Portal for Facilitating Tumor Subgroup Gene Expression and Survival Analyses. Neoplasia (2017) 19:649–58. doi: 10.1016/j.neo.2017.05.002
28. Sun CC, Li SJ, Hu W, Zhang J, Zhou Q, Liu C, et al. Comprehensive Analysis of the Expression and Prognosis for E2Fs in Human Breast Cancer. Mol Ther (2019) 27:1153–65. doi: 10.1016/j.ymthe.2019.03.019
29. Li T, Fu J, Zeng Z, Cohen D, Li J, Chen Q, et al. TIMER2.0 for Analysis of Tumor-Infiltrating Immune Cells. Nucleic Acids Res (2020) 48:W509–14. doi: 10.1093/nar/gkaa407
30. Cerami E, Gao J, Dogrusoz U, Gross BE, Sumer SO, Aksoy BA, et al. The Cbio Cancer Genomics Portal: An Open Platform for Exploring Multidimensional Cancer Genomics Data. Cancer Discov (2012) 2:401–4. doi: 10.1158/2159-8290.CD-12-0095
31. Xu D, Wang Y, Liu X, Zhou K, Wu J, Chen J, et al. Development and Clinical Validation of a Novel 9-Gene Prognostic Model Based on Multi-Omics in Pancreatic Adenocarcinoma. Pharmacol Res (2021) 164:105370. doi: 10.1016/j.phrs.2020.105370
32. Mayakonda A, Lin DC, Assenov Y, Plass C, Koeffler HP. Maftools: Efficient and Comprehensive Analysis of Somatic Variants in Cancer. Genome Res (2018) 28:1747–56. doi: 10.1101/gr.239244.118
33. Szklarczyk D, Gable AL, Nastou KC, Lyon D, Kirsch R, Pyysalo S, et al. The STRING Database in 2021: Customizable Protein-Protein Networks, and Functional Characterization of User-Uploaded Gene/Measurement Sets. Nucleic Acids Res (2021) 49:D605–12. doi: 10.1093/nar/gkaa1074
34. Aran D, Hu Z, Butte AJ. Xcell: Digitally Portraying the Tissue Cellular Heterogeneity Landscape. Genome Biol (2017) 18:220. doi: 10.1186/s13059-017-1349-1
35. Miao YR, Zhang Q, Lei Q, Luo M, Xie GY, Wang H, et al. ImmuCellAI: A Unique Method for Comprehensive T-Cell Subsets Abundance Prediction and its Application in Cancer Immunotherapy. Adv Sci (Weinh) (2020) 7:1902880. doi: 10.1002/advs.201902880
36. Sticht C, de la Torre C, Parveen A, Gretz N. Mirwalk: An Online Resource for Prediction of microRNA Binding Sites. PloS One (2018) 13:e206239. doi: 10.1371/journal.pone.0206239
37. Chen Y, Wang X. miRDB: An Online Database for Prediction of Functional microRNA Targets. Nucleic Acids Res (2020) 48:D127–31. doi: 10.1093/nar/gkz757
38. Crepet A, Papadopoulos A, Elegbede CF, Ait-Dahmane S, Loynet C, Millet G, et al. Mirabel: An Integrated Project for Risk and Cost/Benefit Analysis of Peanut Allergy. Regul Toxicol Pharmacol (2015) 71:178–83. doi: 10.1016/j.yrtph.2014.12.006
39. Kern F, Krammes L, Danz K, Diener C, Kehl T, Kuchler O, et al. Validation of Human microRNA Target Pathways Enables Evaluation of Target Prediction Tools. Nucleic Acids Res (2021) 49:127–44. doi: 10.1093/nar/gkaa1161
40. Karagkouni D, Paraskevopoulou MD, Tastsoglou S, Skoufos G, Karavangeli A, Pierros V, et al. DIANA-LncBase V3: Indexing Experimentally Supported miRNA Targets on Non-Coding Transcripts. Nucleic Acids Res (2020) 48:D101–10. doi: 10.1093/nar/gkz1036
41. Verhaak RG, Hoadley KA, Purdom E, Wang V, Qi Y, Wilkerson MD, et al. Integrated Genomic Analysis Identifies Clinically Relevant Subtypes of Glioblastoma Characterized by Abnormalities in PDGFRA, IDH1, EGFR, and NF1. Cancer Cell (2010) 17:98–110. doi: 10.1016/j.ccr.2009.12.020
42. Louis DN, Perry A, Wesseling P, Brat DJ, Cree IA, Figarella-Branger D, et al. The 2021 WHO Classification of Tumors of the Central Nervous System: A Summary. Neuro Oncol (2021) 23:1231–51. doi: 10.1093/neuonc/noab106
43. Eckel-Passow JE, Lachance DH, Molinaro AM, Walsh KM, Decker PA, Sicotte H, et al. Glioma Groups Based on 1p/19q, IDH, and TERT Promoter Mutations in Tumors. N Engl J Med (2015) 372:2499–508. doi: 10.1056/NEJMoa1407279
44. Chen X, Zhang M, Gan H, Wang H, Lee JH, Fang D, et al. A Novel Enhancer Regulates MGMT Expression and Promotes Temozolomide Resistance in Glioblastoma. Nat Commun (2018) 9:2949. doi: 10.1038/s41467-018-05373-4
45. Martincorena I, Raine KM, Gerstung M, Dawson KJ, Haase K, Van Loo P, et al. Universal Patterns of Selection in Cancer and Somatic Tissues. Cell (2017) 171:1029–41. doi: 10.1016/j.cell.2017.09.042
46. Mikami S, Mizuno R, Kondo T, Shinohara N, Nonomura N, Ozono S, et al. Clinical Significance of Programmed Death-1 and Programmed Death-Ligand 1 Expression in the Tumor Microenvironment of Clear Cell Renal Cell Carcinoma. Cancer Sci (2019) 110:1820–8. doi: 10.1111/cas.14019
47. Sui S, An X, Xu C, Li Z, Hua Y, Huang G, et al. An Immune Cell Infiltration-Based Immune Score Model Predicts Prognosis and Chemotherapy Effects in Breast Cancer. Theranostics (2020) 10:11938–49. doi: 10.7150/thno.49451
48. Schizas D, Charalampakis N, Kole C, Economopoulou P, Koustas E, Gkotsis E, et al. Immunotherapy for Pancreatic Cancer: A 2020 Update. Cancer Treat Rev (2020) 86:102016. doi: 10.1016/j.ctrv.2020.102016
49. Li G, Huang R, Fan W, Wang D, Wu F, Zeng F, et al. Galectin-9/TIM-3 as a Key Regulator of Immune Response in Gliomas With Chromosome 1p/19q Codeletion. Front Immunol (2021) 12:800928:800928. doi: 10.3389/fimmu.2021.800928
50. Picard E, Verschoor CP, Ma GW, Pawelec G. Relationships Between Immune Landscapes, Genetic Subtypes and Responses to Immunotherapy in Colorectal Cancer. Front Immunol (2020) 11:369:369. doi: 10.3389/fimmu.2020.00369
51. Goodman AM, Sokol ES, Frampton GM, Lippman SM, Kurzrock R. Microsatellite-Stable Tumors With High Mutational Burden Benefit From Immunotherapy. Cancer Immunol Res (2019) 7:1570–3. doi: 10.1158/2326-6066.CIR-19-0149
52. Li L, Goedegebuure SP, Gillanders WE. Preclinical and Clinical Development of Neoantigen Vaccines. Ann Oncol (2017) 28:i11–7. doi: 10.1093/annonc/mdx681
53. Han TS, Hur K, Cho HS, Ban HS. Epigenetic Associations Between lncRNA/circRNA and miRNA in Hepatocellular Carcinoma. Cancers (Basel) (2020) 12(9):2622. doi: 10.3390/cancers12092622
54. Thomson DW, Dinger ME. Endogenous microRNA Sponges: Evidence and Controversy. Nat Rev Genet (2016) 17:272–83. doi: 10.1038/nrg.2016.20
55. Genin M, Clement F, Fattaccioli A, Raes M, Michiels C. M1 and M2 Macrophages Derived From THP-1 Cells Differentially Modulate the Response of Cancer Cells to Etoposide. BMC Cancer (2015) 15:577. doi: 10.1186/s12885-015-1546-9
56. Wang D, Yang L, Yue D, Cao L, Li L, Wang D, et al. Macrophage-Derived CCL22 Promotes an Immunosuppressive Tumor Microenvironment via IL-8 in Malignant Pleural Effusion. Cancer Lett (2019) 452:244–53. doi: 10.1016/j.canlet.2019.03.040
57. Ma W, Zhang K, Bao Z, Jiang T, Zhang Y. SAMD9 Is Relating With M2 Macrophage and Remarkable Malignancy Characters in Low-Grade Glioma. Front Immunol (2021) 12:659659:659659. doi: 10.3389/fimmu.2021.659659
58. Yi YC, Chen XY, Zhang J, Zhu JS. Novel Insights Into the Interplay Between M(6)A Modification and Noncoding RNAs in Cancer. Mol Cancer (2020) 19:121. doi: 10.1186/s12943-020-01233-2
59. He L, Li H, Wu A, Peng Y, Shu G, Yin G. Functions of N6-Methyladenosine and its Role in Cancer. Mol Cancer (2019) 18:176. doi: 10.1186/s12943-019-1109-9
60. Wang J, Wang J, Gu Q, Ma Y, Yang Y, Zhu J, et al. The Biological Function of M6a Demethylase ALKBH5 and its Role in Human Disease. Cancer Cell Int (2020) 20:347. doi: 10.1186/s12935-020-01450-1
61. Guo T, Liu DF, Peng SH, Xu AM. ALKBH5 Promotes Colon Cancer Progression by Decreasing Methylation of the lncRNA Neat1. Am J Transl Res (2020) 12:4542–9.
62. Pu X, Gu Z, Gu Z. ALKBH5 Regulates IGF1R Expression to Promote the Proliferation and Tumorigenicity of Endometrial Cancer. J Cancer (2020) 11:5612–22. doi: 10.7150/jca.46097
63. Liu Z, Chen Y, Wang L, Ji S. ALKBH5 Promotes the Proliferation of Glioma Cells via Enhancing the mRNA Stability of G6PD. Neurochem Res (2021) 46:3003–11. doi: 10.1007/s11064-021-03408-9
64. Wang ZL, Wang Z, Li GZ, Wang QW, Bao ZS, Zhang CB, et al. Immune Cytolytic Activity Is Associated With Genetic and Clinical Properties of Glioma. Front Immunol (2019) 10:1756:1756. doi: 10.3389/fimmu.2019.01756
65. Liu B, Zhou J, Wang C, Chi Y, Wei Q, Fu Z, et al. LncRNA SOX2OT Promotes Temozolomide Resistance by Elevating SOX2 Expression via ALKBH5-Mediated Epigenetic Regulation in Glioblastoma. Cell Death Dis (2020) 11:384. doi: 10.1038/s41419-020-2540-y
66. Kowalski-Chauvel A, Lacore MG, Arnauduc F, Delmas C, Toulas C, Cohen-Jonathan-Moyal E, et al. The M6a RNA Demethylase ALKBH5 Promotes Radioresistance and Invasion Capability of Glioma Stem Cells. Cancers (Basel) (2020) 13(1):40. doi: 10.3390/cancers13010040
67. Martincorena I, Campbell PJ. Somatic Mutation in Cancer and Normal Cells. Science (2015) 349:1483–9. doi: 10.1126/science.aab4082
68. Zacharakis N, Chinnasamy H, Black M, Xu H, Lu YC, Zheng Z, et al. Immune Recognition of Somatic Mutations Leading to Complete Durable Regression in Metastatic Breast Cancer. Nat Med (2018) 24:724–30. doi: 10.1038/s41591-018-0040-8
69. Zhang H, Wang Z, Dai Z, Wu W, Cao H, Li S, et al. Novel Immune Infiltrating Cell Signature Based on Cell Pair Algorithm Is a Prognostic Marker in Cancer. Front Immunol (2021) 12:694490:694490. doi: 10.3389/fimmu.2021.694490
70. Chen R, Wang X, Dai Z, Wang Z, Wu W, Hu Z, et al. TNFSF13 Is a Novel Onco-Inflammatory Marker and Correlates With Immune Infiltration in Gliomas. Front Immunol (2021) 12:713757:713757. doi: 10.3389/fimmu.2021.713757
71. Zeng D, Li M, Zhou R, Zhang J, Sun H, Shi M, et al. Tumor Microenvironment Characterization in Gastric Cancer Identifies Prognostic and Immunotherapeutically Relevant Gene Signatures. Cancer Immunol Res (2019) 7:737–50. doi: 10.1158/2326-6066.CIR-18-0436
72. Bader JE, Voss K, Rathmell JC. Targeting Metabolism to Improve the Tumor Microenvironment for Cancer Immunotherapy. Mol Cell (2020) 78:1019–33. doi: 10.1016/j.molcel.2020.05.034
73. Dong F, Qin X, Wang B, Li Q, Hu J, Cheng X, et al. ALKBH5 Facilitates Hypoxia-Induced Paraspeckle Assembly and IL8 Secretion to Generate an Immunosuppressive Tumor Microenvironment. Cancer Res (2021) 81:5876–88. doi: 10.1158/0008-5472.CAN-21-1456
74. Xu S, Li X, Tang L, Liu Z, Yang K, Cheng Q. CD74 Correlated With Malignancies and Immune Microenvironment in Gliomas. Front Mol Biosci (2021) 8:706949:706949. doi: 10.3389/fmolb.2021.706949
75. Filipovic A, Miller G, Bolen J. Progress Toward Identifying Exact Proxies for Predicting Response to Immunotherapies. Front Cell Dev Biol (2020) 8:155:155. doi: 10.3389/fcell.2020.00155
76. Bonaventura P, Shekarian T, Alcazer V, Valladeau-Guilemond J, Valsesia-Wittmann S, Amigorena S, et al. Cold Tumors: A Therapeutic Challenge for Immunotherapy. Front Immunol (2019) 10:168:168. doi: 10.3389/fimmu.2019.00168
Keywords: ALKBH5, pan-cancer, prognosis, immune, glioma, lncRNA-miRNA-ALKBH5 network
Citation: Wei C, Wang B, Peng D, Zhang X, Li Z, Luo L, He Y, Liang H, Du X, Li S, Zhang S, Zhang Z, Han L and Zhang J (2022) Pan-Cancer Analysis Shows That ALKBH5 Is a Potential Prognostic and Immunotherapeutic Biomarker for Multiple Cancer Types Including Gliomas. Front. Immunol. 13:849592. doi: 10.3389/fimmu.2022.849592
Received: 06 January 2022; Accepted: 11 March 2022;
Published: 04 April 2022.
Edited by:
Quan Cheng, Central South University, ChinaReviewed by:
Jun Ma, University of Minnesota Twin Cities, United StatesShengyan Xiang, Moffitt Cancer Center, United States
Hua Yang, University of South Florida, United States
Copyright © 2022 Wei, Wang, Peng, Zhang, Li, Luo, He, Liang, Du, Li, Zhang, Zhang, Han and Zhang. This is an open-access article distributed under the terms of the Creative Commons Attribution License (CC BY). The use, distribution or reproduction in other forums is permitted, provided the original author(s) and the copyright owner(s) are credited and that the original publication in this journal is cited, in accordance with accepted academic practice. No use, distribution or reproduction is permitted which does not comply with these terms.
*Correspondence: Jianning Zhang, amlhbm5pbmd6aGFuZzIwMjFAMTYzLmNvbQ==; Lei Han, c3VwZXJoYW5sZWlAdG11LmVkdS5jbg==; Zhenyu Zhang, ZmNjemhhbmd6eTFAenp1LmVkdS5jbg==
†These authors have contributed equally to this work