 Minhan Yi1,2,3†Wangcheng Zhao1,3,4†Quanming Fei1,3,4†Yun Tan1,2,3Kun Liu2
 Ziliang Chen5
 Yuan Zhang1,3*
- 1Department of Respiratory Medicine, Xiangya Hospital, Central South University, Changsha, China
- 2School of Life Sciences, Central South University, Changsha, China
- 3National Clinical Research Center for Geriatric Disorders, Xiangya Hospital, Central South University, Changsha, China
- 4Xiangya School of Medicine, Central South University, Changsha, China
- 5School of Computer Science and Engineering, Central South University, Changsha, China
Background: Inflammation proteins including interleukins (ILs) have been reported to be related to obstructive sleep apnea (OSA). The aims of this study were to estimate the levels for several key interleukins in OSA and the causal effects between them.
Method: Weighted mean difference (WMD) was used to compare the expression differences of interleukins between OSA and control, and the changed levels during OSA treatments in the meta-analysis section. A two-sample Mendelian randomization (MR) was used to estimate the causal directions and effect sizes between OSA risks and interleukins. The inverse-variance weighting (IVW) was used as the primary method followed by several other MR methods including MR Egger, Weighted median, and MR-Robust Adjusted Profile Score as sensitivity analysis.
Results: Nine different interleukins—IL-1β, IL-2, IL-4, IL-6, IL-8, IL-12, IL-17, IL-18, and IL-23—were elevated in OSA compared with control to varying degrees, ranging from 0.82 to 100.14 pg/ml, and one interleukin, IL-10, was decreased by 0.77 pg/ml. Increased IL-1β, IL-6, and IL-8 rather than IL-10 can be reduced in OSA by effective treatments. Further, the MR analysis of the IVW method showed that there was no significant evidence to support the causal relationships between OSA and the nine interleukins—IL-1β, IL-2, IL-4, IL-5, IL-6, IL-8, IL-10, IL-17, and IL-18. Among them, the causal effect of OSA on IL-5 was almost significant [estimate: 0.267 (−0.030, 0.564), p = 0.078]. These results were consistent in the sensitivity analysis.
Conclusions: Although IL-1β, IL-2, IL-4, IL-6, IL-8, IL-12, IL-17, IL-18, and IL-23 were increasing and IL-10 was reducing in OSA, no significant causal relationships were observed between them by MR analysis. Further research is needed to test the causality of OSA risk on elevated IL-5 level.
Introduction
Obstructive sleep apnea (OSA) is a widespread sleep disorder that affected about 9% to 38% of the whole population (1). OSA is caused by repeated constriction or collapse of the upper airway during sleep, resulting in intermittent hypoxia (IH), sleep fragmentation, disarrangement to physiological homeostasis, and more (2). The underlying pathophysiological mechanisms of OSA are complex and multifactorial, and the activated systematic inflammation has participated in these processes (3). Therefore, research studies to understand the association and even the causality between OSA and inflammation are necessary for this field, which may benefit prevention and treatment for OSA and related health outcomes.
Interleukins (IL) are a type of cytokine that has been involved in a range of inflammatory pathways (4), and several interleukins have been studied in the development and pathogenesis of OSA (5). It is reported that activated hypoxia-inducible factor-1 alpha (HIF-1α) and nuclear factor κb (NF-κb) can upregulate the expression of IL-1β and IL-6 in OSA (6–8). Previous studies have also reported that the levels of IL-6 and IL-8 were higher in patients with OSA and associated with apnea-hypopnea index (AHI) as well (9–11). Moreover, IL-1β, IL-10, IL-18, and several other interleukins were also researched in OSA, but there were still lacked consistent opinions and a comprehensive evaluation for them in OSA (12–16). Therefore, a pooled analysis including more interleukins with a larger sample size is needed to assess the interactions between interleukins and OSA.
Further, it is difficult to assess the causality between OSA and inflammation from previous observational studies due to the potential confounding biases and reverse causation that existed (17). Mendelian randomization (MR), which uses genetic variants as instrumental variable (IV) to assure causality between given exposure and outcome (18), may be a good option to explore causality between OSA and interleukins. Because the genetic variants are naturally randomized to offspring during conception, MR can avoid the limitations commonly seen in observational studies (19). Through a similar method, we have confirmed the causality of OSA on the elevated inflammation protein of C-reactive protein (20). With the progress of data-sharing, genome-wide association studies (GWASs) identified multiple relevant variants about several interleukins and OSA, which bring available IV for a powerful MR (21, 22). In this study, we used SNPs independently associated with exposure (OSA/interleukins) as IVs and explore the causal effects on corresponding outcome (interleukins/OSA).
In general, we first explored the association between the interleukins and OSA by comparing the expression differences of 10 interleukins between OSA and control and the effect of treatments on four interleukins in OSA. Then, we applied a MR analysis to estimate the causal relationships between nine interleukins and OSA risk of OSA on interleukin levels and of interleukin concentrations on OSA risk.
Materials and methods
Meta-analysis of the association between interleukins and OSA
We carefully conducted this comprehensive analysis following the guidelines of the Preferred Reporting Items for Systematic Reviews and Meta-Analysis (PRISMA) in this paper (23).
Data sources and search strategy
We searched PubMed, Embase, Web of Science, and Cochrane Library by two authors independently with the terms “OSA OR OSAS OR OSAHS OR (sleep apnea)” and “IL OR interleukin”, up to 4 December 2021. The references of the enrolled studies were manually evaluated by two researchers independently and disagreements were resolved through discussion.
Inclusion criteria and exclusion criteria
On the basis of PICOS (participants, interventions, controls, outcomes, and studies), we defined the inclusion criteria as follows.
For the section of comparing protein expression between patients with OSA and controls, we listed the criteria as follows: P: OSA was diagnosed by clinical diagnostic criteria as by questionnaire or polysomnography (PSG) with an AHI > 5 events/h in adults, and AHI > 1 events/h in children without age, sex, BMI, and detection method restrictions. I: Detection methods including enzyme-linked immunosorbent assay (ELISA), multiplex assays, quantitative sandwich enzyme immunoassay kits, and other methods were used to detect the inflammation levels. C: Control group defined by questionnaire or PSG with AHI < 5 events/h in adults and AHI < 1 events/h in children. O: Studies evaluating the expression of interleukin levels reported sufficient data in format as mean ± standard deviation (SD). Moreover, all measurement units about interleukins are expressed as pg/ml. S: All studies with available data, like case-control research.
For the section of comparing the interleukins changed levels during OSA treatments, we listed the criteria as follows: P: same as described above. I: Interventions contained continuous positive airway pressure (CPAP) used for least one month, surgery like adenotonsillectomy and adenoidectomy, mandibular advancement device (MAD) and other oral appliances etc. O: The studies included both pre-treatment and post-treatment protein expression data. S: All studies with available data, like randomized clinical trials, prospective cohort study etc.
In addition, the exclusion criteria were as follows: (1) duplicated publications and (2) no original research (reviews, letters, editorials, and conference abstract).
Data extraction and quality Assessments
The data were extracted by two investigators. Basic information involved the first author’s name, year of publication, region, diagnosis of participants, severity of patients with OSA, age, body mass index (BMI), gender distribution and AHI of both groups, detection method, sample sources, and interleukin measurements (mean ± SD). For protein levels change after treatments, we also extracted treatments follow-up period. Finally, the Newcastle-Ottawa Scale (NOS) (24) assessed the quality of the studies included in this analysis.
Data analysis
All data were analyzed in the Review Manager 5.3 (The Nordic Cochrane Centre, The Cochrane Collaboration, London, UK). As for continuous outcomes, the weighted mean differences (WMDs) were used as measures of effect size in this study. We calculate an I² statistic to estimate heterogeneity. If p < 0.05 or I2 > 50%, then the data were pooled by random effect model, otherwise by fixed effect model. A sensitivity analysis was also conducted by removing one article, in turn, to see its effect on the p value. Finally, a funnel diagram was conducted to evaluate publication bias.
In detail, first, we explored whether protein levels of interleukins were different between OSA and non-OSA. Then, similar analysis was conducted between subgroups of OSA with different severity and controls: mild OSA (AHI 5 to <15), moderate OSA (AHI 15 to <30), severe OSA (AHI ≥30), and mixed OSA (no clear definition of severity or difference degrees of severity) (25). To avoid the overlapping of controls, when available data for OSA were from different severity subgroups, whereas data for controls were from the same population, we only used the severe OSA subgroup data for analysis in total group analysis.
Second, as for possible interleukins, we analyzed whether interleukin levels changed over time after treatments in OSA (post-treatments VS pre-treatments), containing treatments of CPAP, surgery, and MAD.
Mendelian randomization of the causality between interleukins and OSA
GWAS data sources
We used a published GWAS summary statistics from FinnGen Study that contained 217,955 individuals with 16,761 patients with OSA from European (21). In this GWAS, OSA was diagnosed on the basis of the International Statistical Classification of Diseases (ICD) codes (ICD-10: G47.3, ICD-9: 3472A), which were based on subjective symptoms, clinical examination, and sleep records (AHI ≥ 5 or respiratory event index ≥ 5).
Recently, Ahola-Olli et al. conducted a large-scale mapping of protein concentrations loci, and ELISA was used to measure 41 cytokines in 8,293 participants in Young Finns Study (YFS) and FINRISK surveys from Finnish cities (22). The GWAS summary statistics for several interleukins in our MR were collected from this research. In addition, to verify the results, we also included another GWAS summary statistics with a larger sample for IL-6, IL-8, and IL-18, which contained 21,758 participants of European descent from the UK Biobank (26).
Selection of instrument variable
Two-sample MR analysis is based on three assumptions: First, the genetic variants being used as an IV are associated with the exposure. Second, the used IV is not associated with the common confounders of exposures and outcomes. Third, there is no independent pathway between the genetic variants and the outcome other than through exposure (27). Independent SNPs were selected as IV if they had been associated with OSA (p < 5 × 10⁻⁸) (21) or interleukins (most with p < 5 × 10⁻⁶ except IL-10 with p < 5 × 10⁻⁸ for and IL-18 with p < 5 × 10⁻⁷ in the study from Ahola-Olli et al. (22), and all with p < 5 × 10⁻⁸ for IL-6, IL-8, and IL-18 in replication analysis (26)) in the GWAS source studies and in pair-wise linkage disequilibrium with the distance of 1,000 kb and r2 < 0.1 referring to the European population.
Mendelian randomization analysis
For MR analysis, we used the method of inverse-variance weighting (IVW) as the primary outcome that assumed genetic instruments for each risk factor satisfy the IV assumptions (28). Other MR methods including MR Egger (29), Weighted median (30), and MR-Robust Adjusted Profile Score (RAPS) (31) were used to correct for any potential violations of the assumptions in the sensitivity analysis. These three analyses are performed as they operate in different ways and rely on different assumptions for valid inferences to assess the reliability of MR analyses. In addition, heterogeneity was analyzed by Cochran’s Q-test of IVW and MR Egger, and pleiotropy was tested by the intercept of MR Egger analysis.
Results
Characteristics for all included publications
On the basis of the inclusion and exclusion criteria in the method section, a total of 84 articles were included for analysis (Figure 1). The characteristics of the 68 included articles about protein levels in patients with OSA and healthy control were shown in Table 1 and Supplemental Tables 1, 2. Moreover, the features of the 24 articles on responses of interleukin levels to treatments in OSA were shown in Table 2 and Supplemental Tables 3, 4. Each literature obtained a NOS score of at least 5.
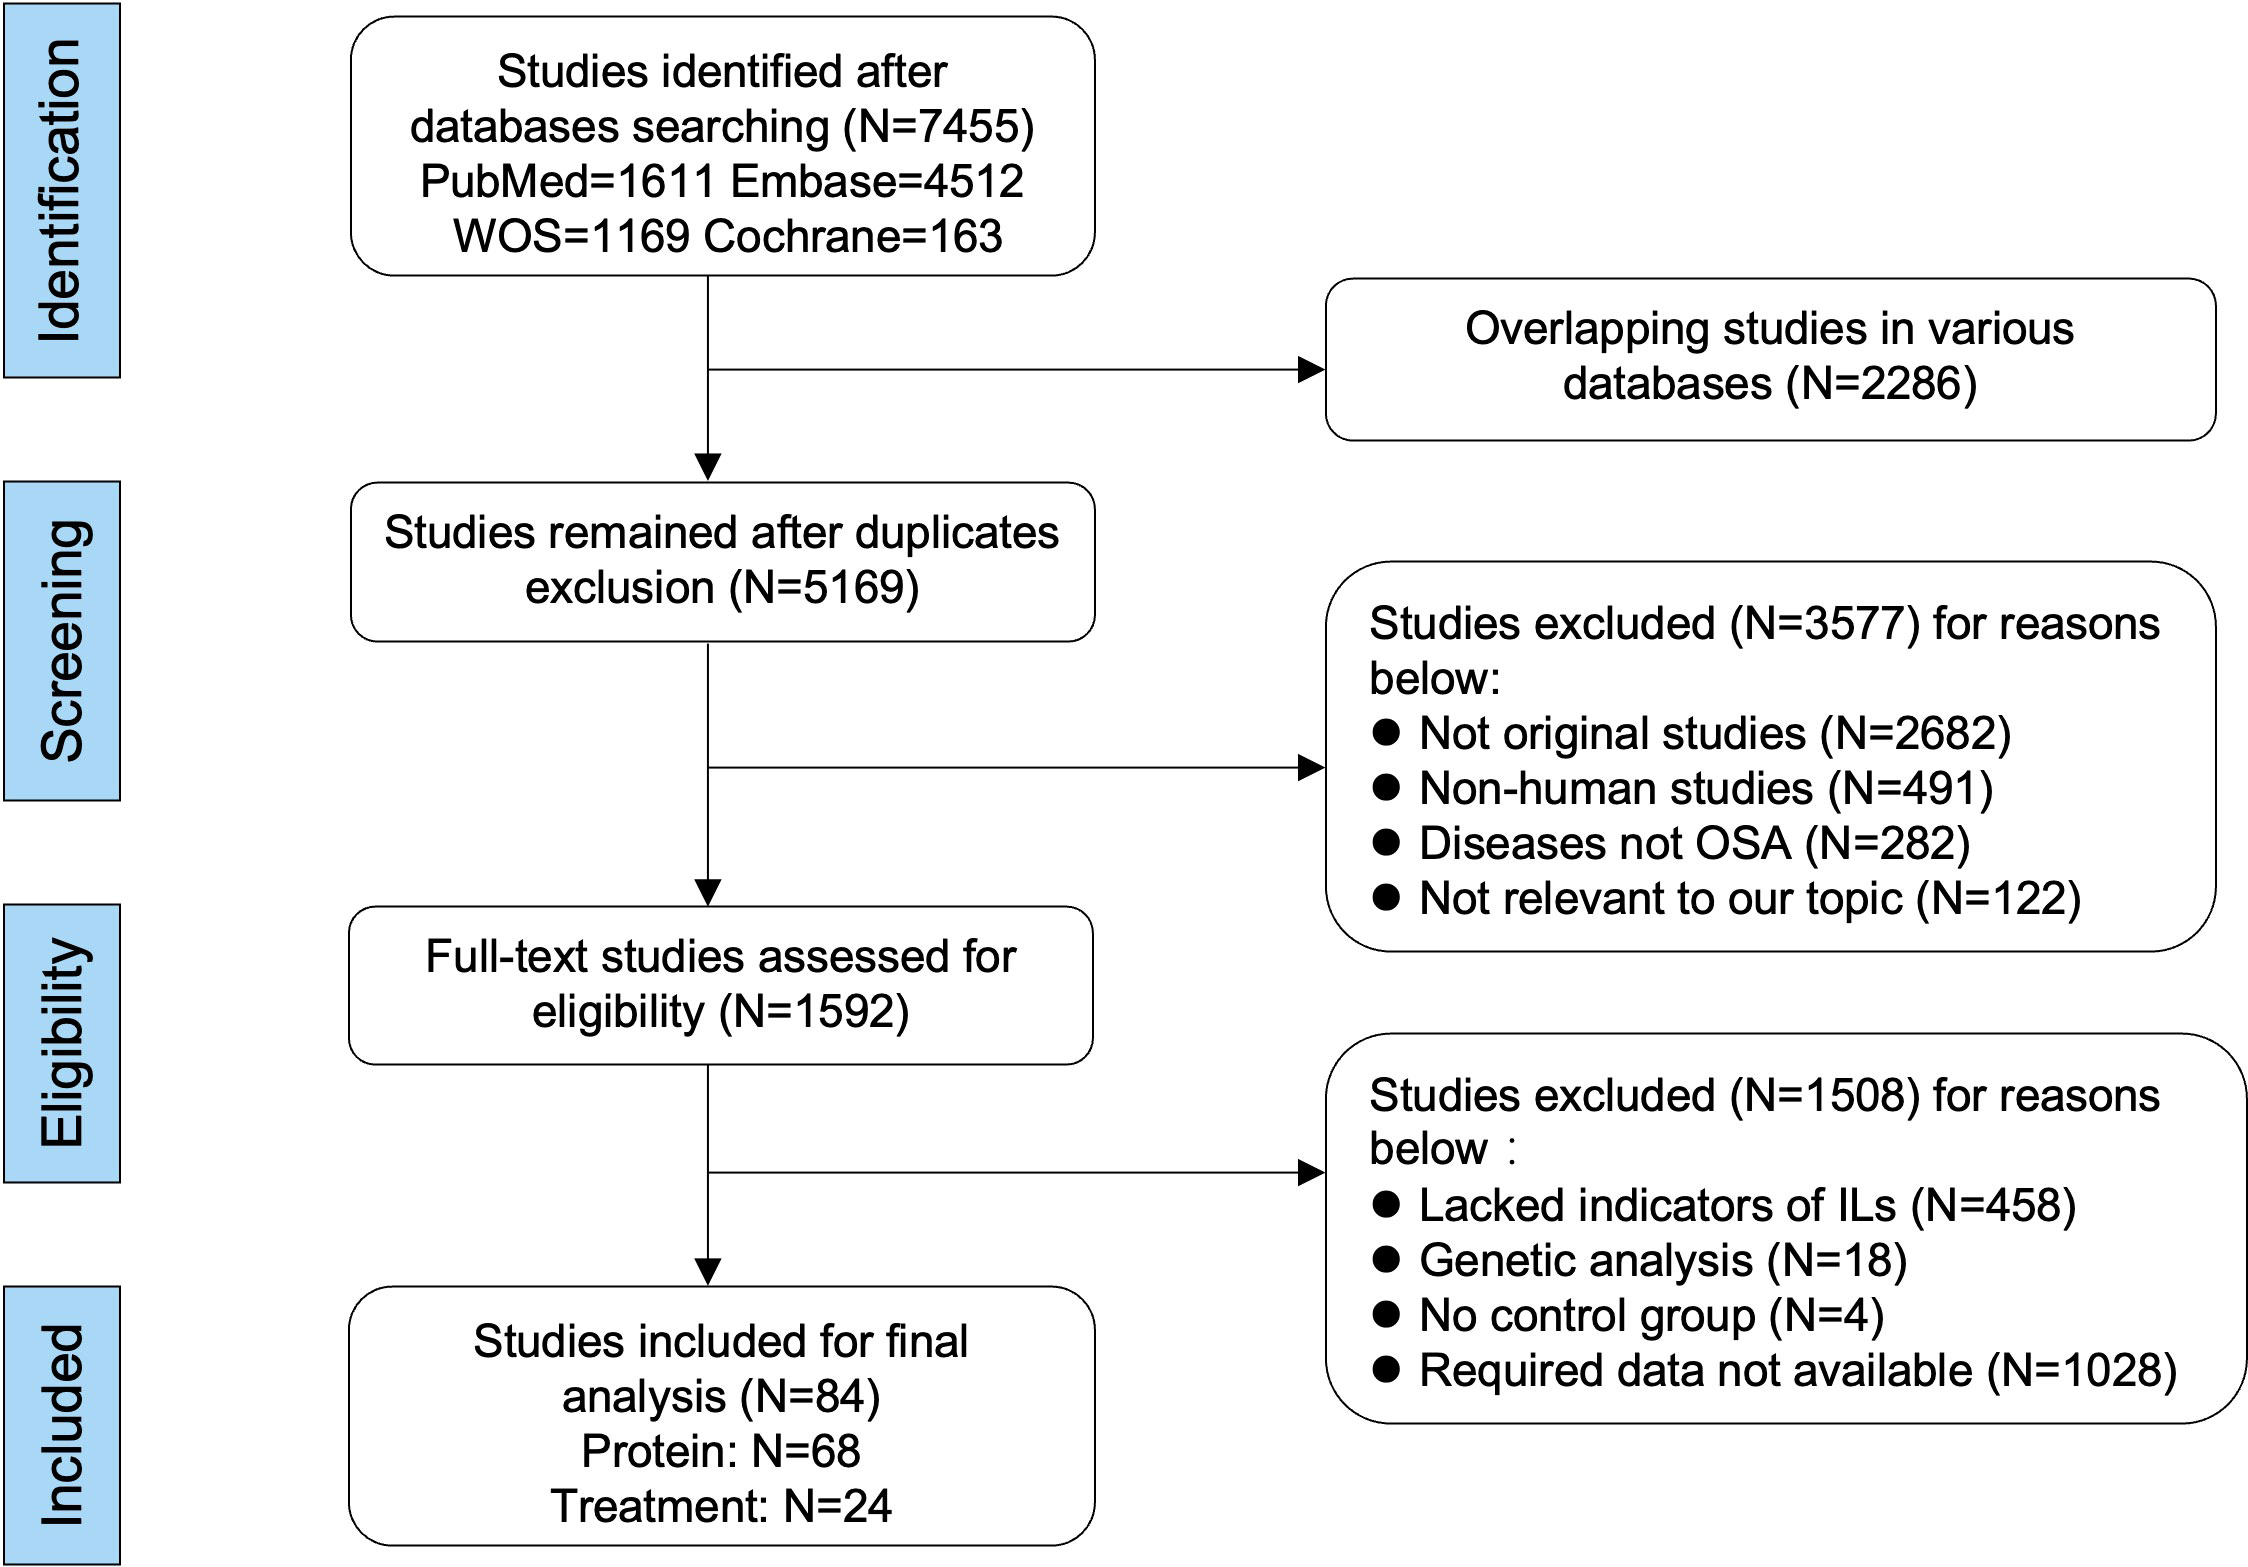
Figure 1 Flow diagram of literature selecting based on the inclusive and exclusive criteria. Among the included 84 publications, 68 studies were used for comparing the differences of interleukin levels between OSA and healthy control, and 24 studies were used for analyzing the changed levels of interleukins in patients with OSA responding to treatments. The format and unit of measurements were mean ± standard deviation and picograms per milliliter, respectively.

Table 1 Characteristics of the included studies about interleukin levels in patients with OSA and control.
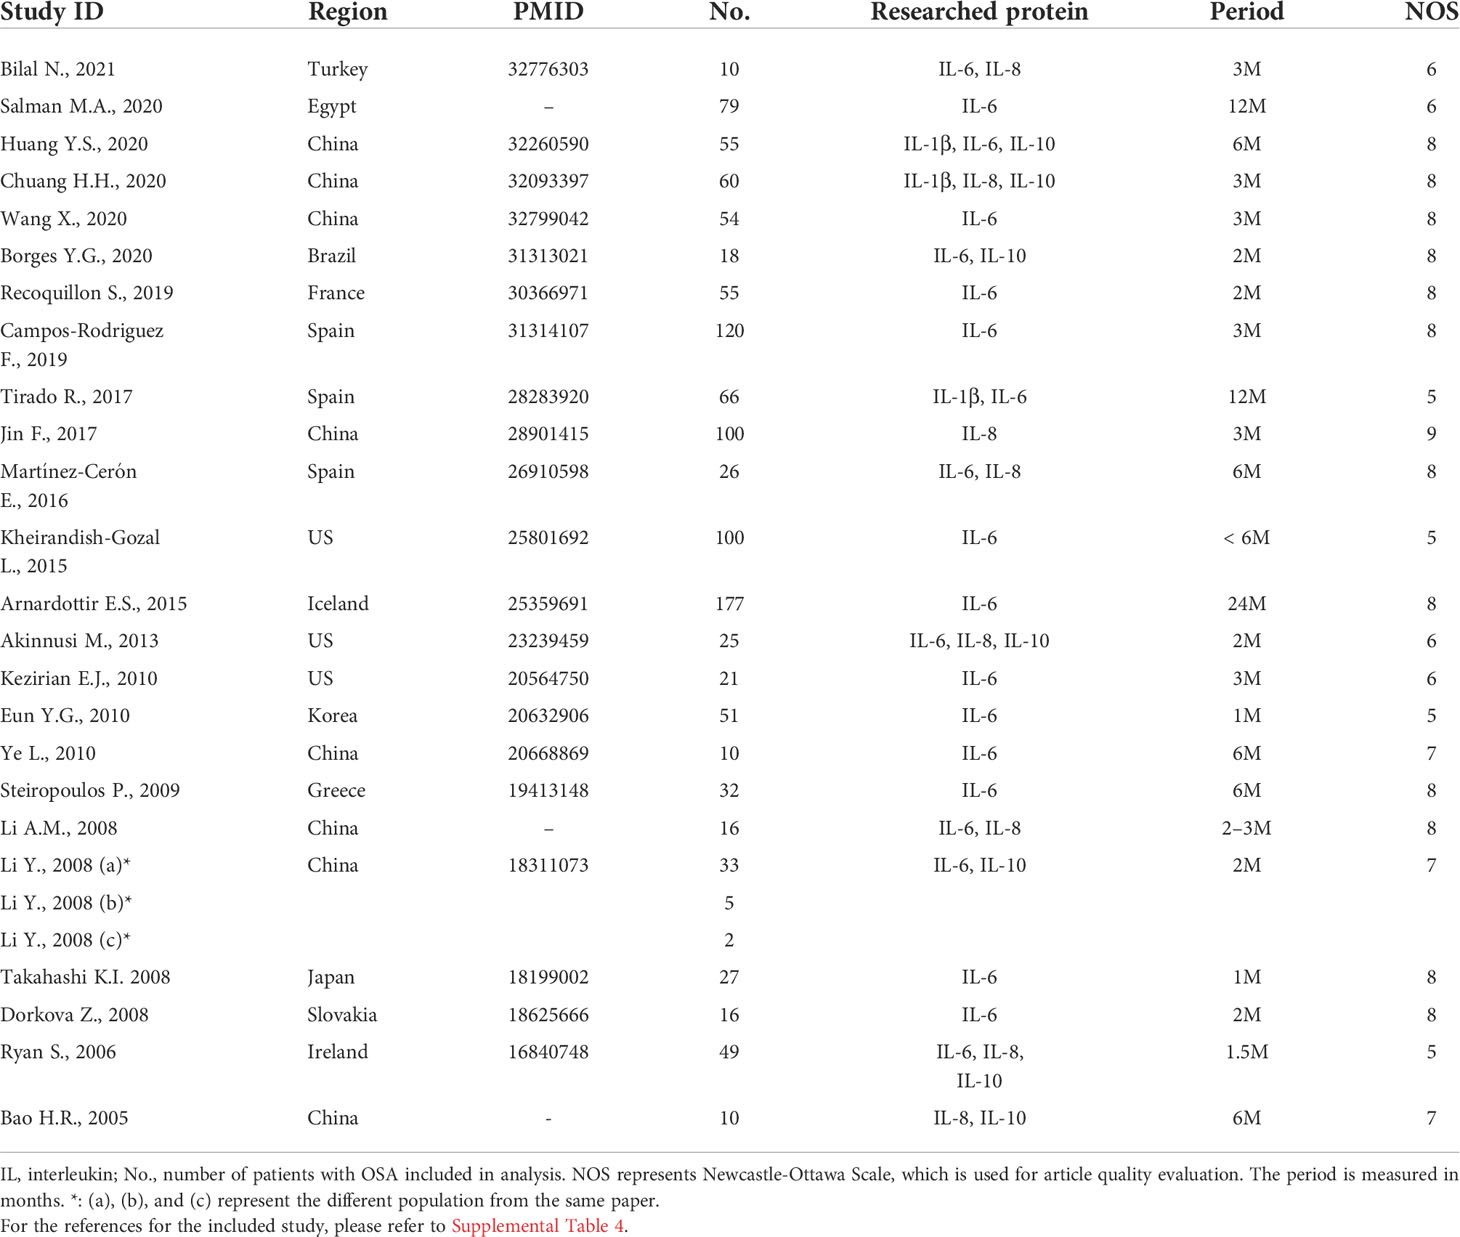
Table 2 Characteristics of included studies about interleukin changes during treatments.
Interleukin levels and OSA severity
In total, we compared the concentration differences of 10 interleukins between patients with OSA and controls. We found that nine different interleukins including IL-1β, IL-2, IL-4, IL-6, IL-8, IL-12, IL-17, IL-18, and IL-23 were elevated to varying degrees in patients with OSA compared with controls, with the differences ranging from 0.82 to 100.14 pg/ml. On the contrary, patients with OSA had lower IL-10 by 0.77 pg/ml than controls (Figure 2A, Supplemental Figure 1). The symmetric funnel plot illustrated no obvious publication bias (Supplemental Figure 2).
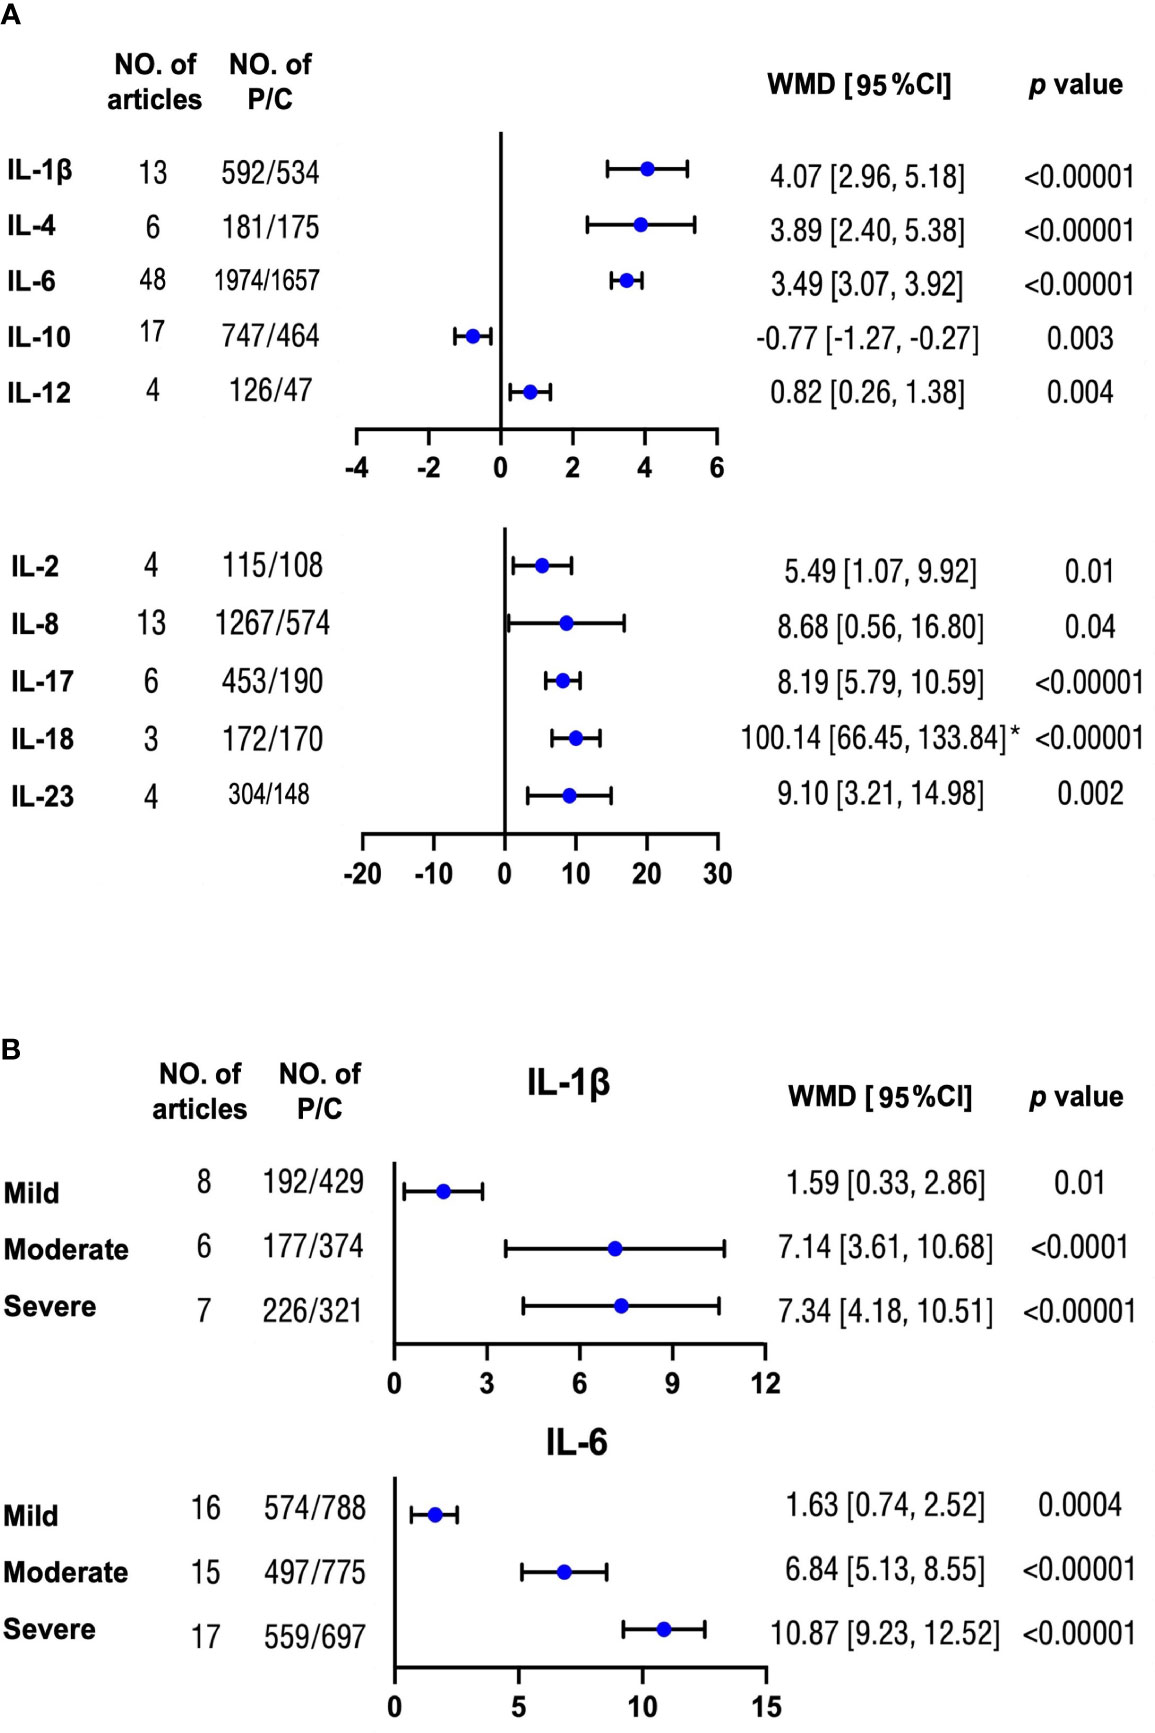
Figure 2 Mean differences of multiple interleukin levels between OSA and non-OSA subjects. (A) Concentration differences for several interleukin proteins were compared between patients with OSA and non-OSA controls. (B) Protein levels of IL-1β and IL-6 were analyzed between patients with OSA with mild, moderate, and severe severity and controls, respectively. The unit for all protein concentrations was presented as picograms per milliliter. Weighted mean difference (WMD) and 95% confidence interval (95% CI) were used for analysis. No. of articles, number of articles included for analysis in each group. No. of P/C, number of patients with OSA (P) and controls (C) were included for each group. *: The original protein value is 10 times higher than that shown in scale. The statistically different results with p < 0.05 were shown in blue point otherwise were in black point if p > 0.05. IL: interleukin.
Moreover, there were increasing differences for IL-1β and IL-6 with serious OSA severity compared with controls (Figure 2B and Supplemental Figure 3). However, the trends for IL-8, IL-10, and IL-18 were not significant (Supplemental Figure 4). There was no obvious publication bias from the symmetric funnel plots. (Supplemental Figure 5)
Interleukin levels and OSA treatment
Afterward, we compared the level changes of several interleukins (IL-1β, IL-6, IL-8, and IL-10) from pre-treatment to post-effective OSA treatments in patients with OSA. Except for IL-10, the levels for the other three proteins all went down significantly, ranging from 0.52 to 3.21 pg/ml after treatments (Figure 3 and Supplemental Figure 6). However, the level of IL-1β was sensitive to the study of Chuang et al. (32). The funnel plot illustrated the publication bias (Supplemental Figure 7).
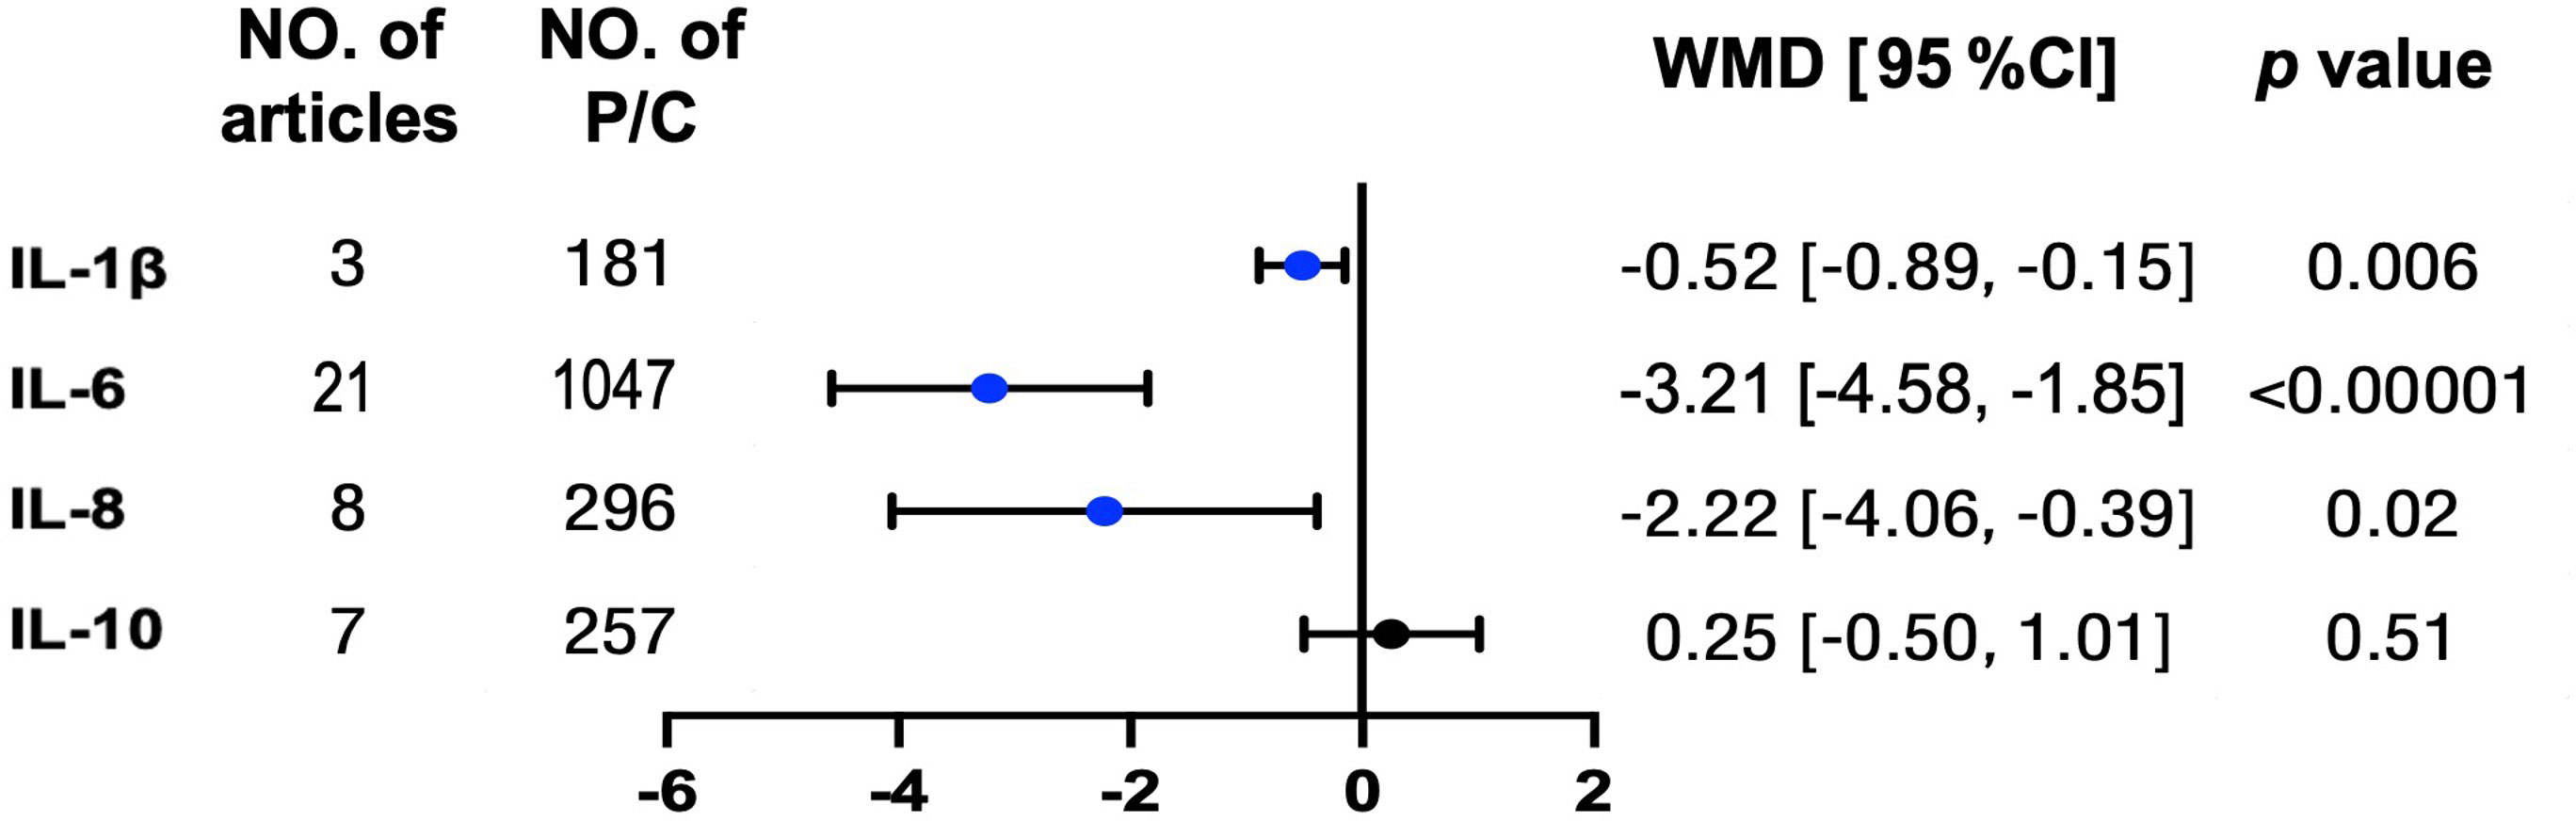
Figure 3 Typical inflammation but not anti-inflammation interleukins were reduced in patients with OSA after treatments. Concentrations for above interleukin proteins were tracked from pre-treatment to post treatment in patients with OSA. The unit for protein concentrations was presented as picograms per milliliter. Weighted mean difference (WMD) and 95% confidence interval (95% CI) were used for analysis. No. of articles, number of articles included for analysis in each group. No. of P, number of patients with OSA (P) included for each group. The statistically different results with p < 0.05 were shown in blue point otherwise were shown in black point if p > 0.05. IL, interleukin.
Causality analysis of OSA on interleukin levels
With independent variants related to OSA as IV, we estimated the causal effects from OSA to nine interleukin levels by MR analysis (Figure 4A). As a result, we did not find any significant causal relations of OSA on IL-1β, IL-2, IL-4, IL-5, IL-6, IL-8, IL-10, IL-17, and IL-18 by the primary method of IVW but the result of IL-5 was almost significant [estimate: 0.267 (−0.030, 0.564), p = 0.078] (Figure 4B). Similar results were obtained by MR Egger, Weighted median, and MR RAPS (Supplemental Table 5). There was no evidence of heterogeneity in the IVW analysis. Moreover, the MR Egger showed that there was no directional pleiotropic effect across the all interleukin genetic variants (Supplemental Table 5).
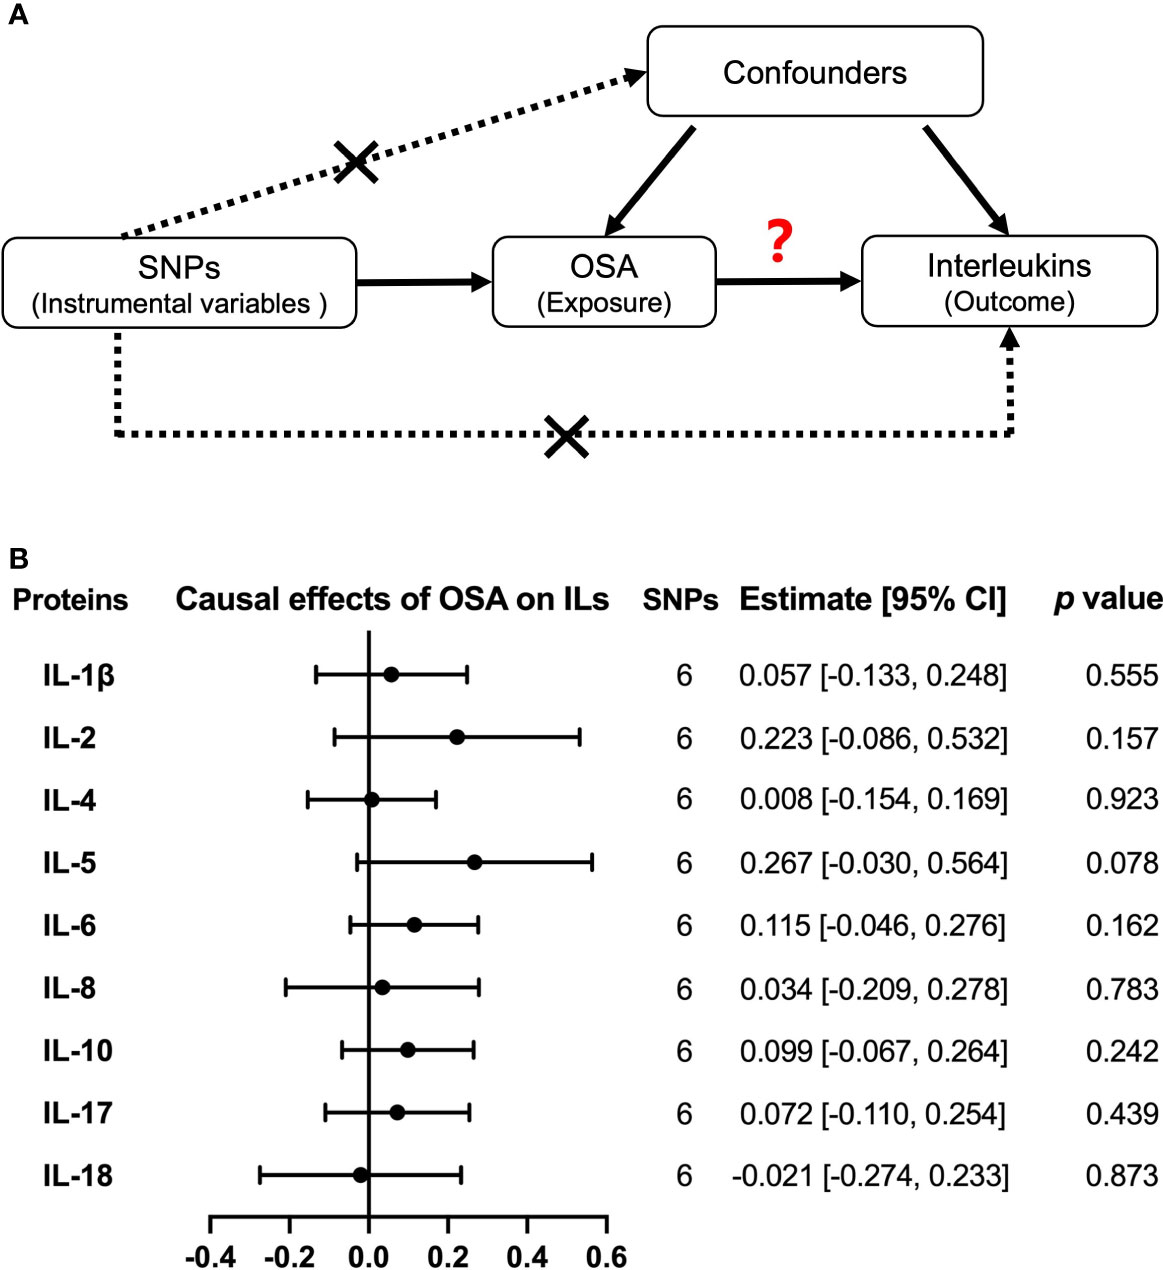
Figure 4 Causal relationships of OSA on interleukin levels by Mendelian randomization (MR) analysis. (A) The design of MR analysis was to explore the causal effects of OSA on interleukin levels: OSA as exposure, interleukins as outcomes, and SNPs independently associated with OSA from the used GWAS summary statistic were used as instrumental variables. In addition, other assumptions include the used SNPs is not associated with the confounders between exposure and outcome, and there is no independent pathway between the used SNPs and the outcome other than through exposure. (B) The presented results were performed by method of inverse-variance weighting (IVW). IL, interleukin.
Moreover, we used another large sample GWAS summary statistics of IL-6, IL-8, and IL-18 levels to verify the observed null associations of OSA on these hot researched interleukins. However, we still did not obtain any causal effects of OSA on IL-6 [estimate: 0.067, 95% CI = (−0.071, 0.205), p = 0.341], IL-8 [estimate: −0.069, 95% CI = (−0.200, 0.061), p = 0.297] and IL-18 [estimate: −0.043, 95% CI = (−0.163, 0.078), p = 0.488] by IVW (Supplemental Table 6 and Supplemental Figure 8A)
Causality analysis of interleukin levels on OSA risk
Then, we explored the causal effects of nine interleukins (IL-1β, IL-2, IL-4, IL-5, IL-6, IL-8, IL-10, IL-17, and IL-18) on OSA risk with each interleukin protein–related independent variants as IV (Figure 5A). The primary method of IVW model showed that there was no causal effect from interleukins to OSA risk (Figure 5B). Except for IL-17, there were no significant heterogeneity and horizontal pleiotropy in our results by IVW and MR Egger (Supplemental Table 7). Moreover, by another large sample GWAS, the causal effect of IL-6, IL-8, and IL-18 levels on OSA were still negative, with the OR of 0.853, 95% CI = (0.701, 1.039), and p = 0.114 for IL-6; OR of 0.982, 95% CI = (0.713, 1.353), and p = 0.912 for IL-8; and OR of 0.975, 95% CI = (0.941, 1.010), and p = 0.157 for IL-18 (Supplemental Table 8 and Supplemental Figure 8B).
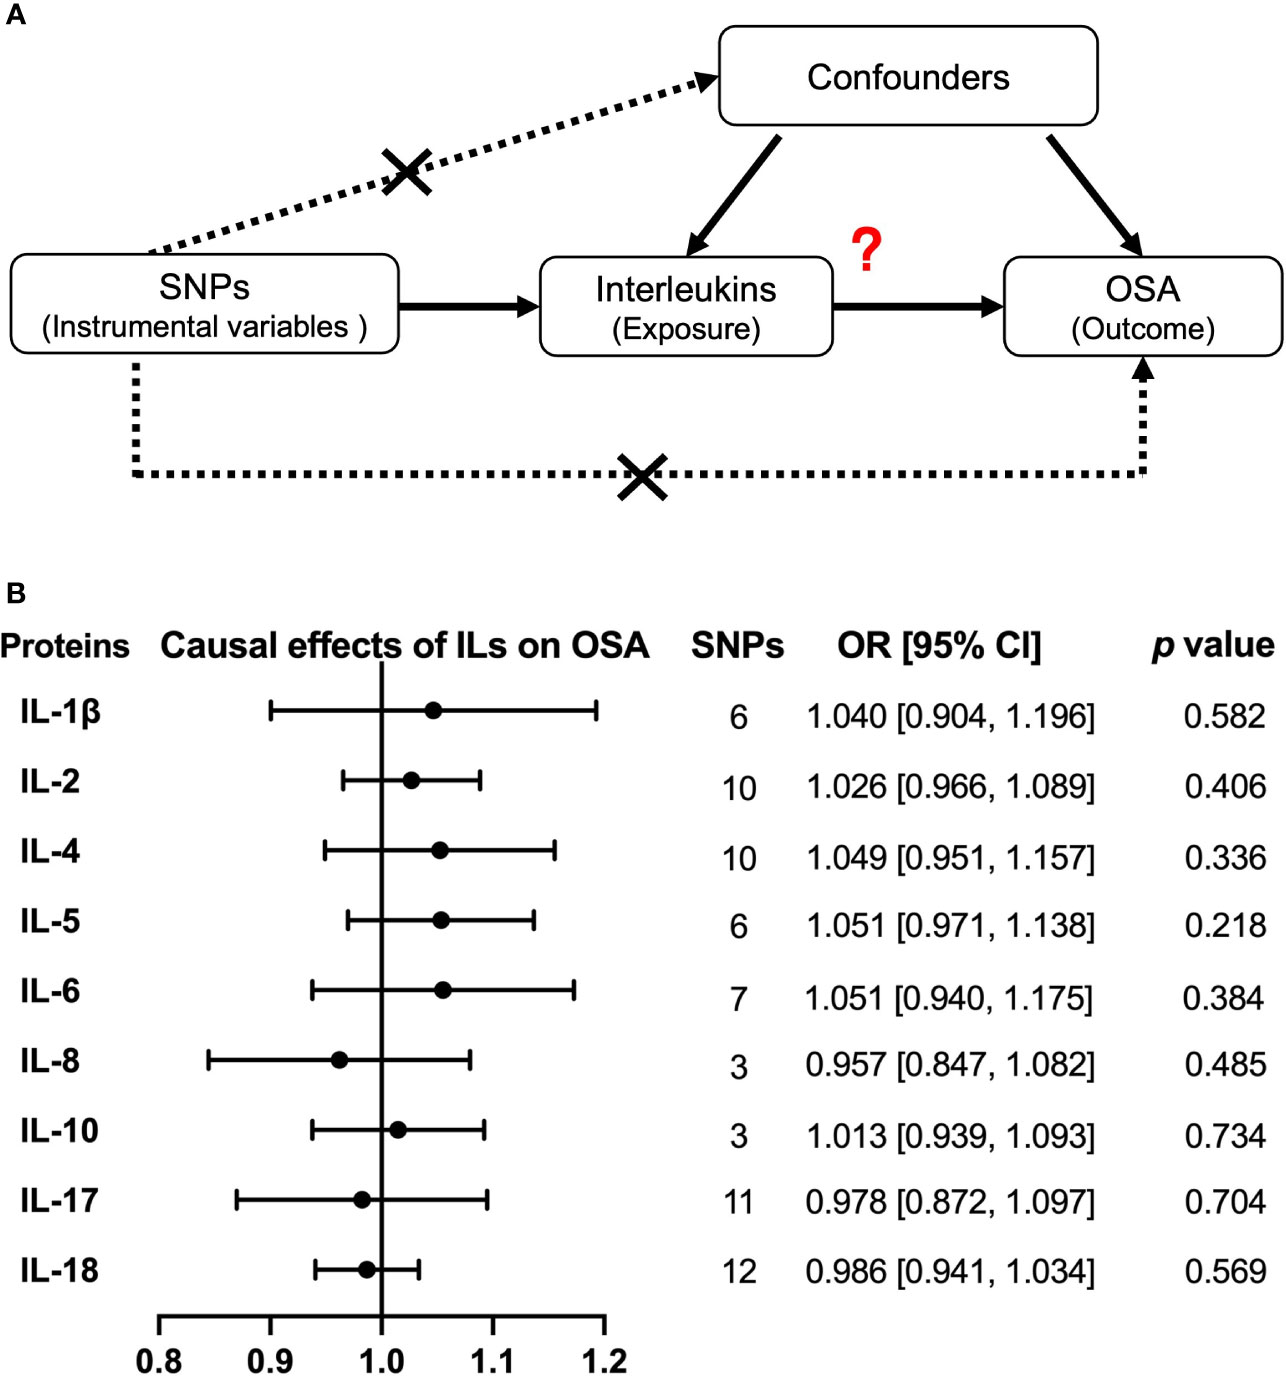
Figure 5 Causal relationships of interleukins on OSA risk by Mendelian randomization (MR) analysis. (A) The design of MR analysis was to explore the causal effects of interleukin levels on OSA risk: interleukins as exposure, OSA as outcomes, and SNPs independently associated with interleukins were used as instrumental variables. Other two assumptions are the same as described in the legend of Figure 4A. (B) The presented results were performed by method of inverse-variance weighting (IVW). IL, interleukin.
Discussion
By combining meta-analysis and MR analysis, we discussed the relationship between a series of interleukin types and OSA. First, there are higher levels of IL-1β, IL-2, IL-4, IL-6, IL-8, IL-12, IL-17, IL-18, IL-23, and lower level of IL-10 in patients with OSA compared with controls. Especially, the expressions of IL-1β and IL-6 in OSA increased with OSA severity. Moreover, the levels of IL-1β and IL-6 along with IL-8 could be reduced by OSA treatments. However, no significant causal effects were observed either from OSA to nine different interleukin levels (IL-1β, IL-2, IL-4, IL-5, IL-6, IL-8, IL-10, IL-17, and IL-18) or from these interleukins to OSA risk.
The observed dysregulated interleukins provided clues for activated inflammations in OSA. Higher levels of monocytes derived IL-1β, IL-6, IL-8, and IL-12 supported monocytes activation in OSA, which was significantly increased in peripheral blood in response to chronic IH (33, 34). Further, we confirmed that levels of IL-1β and IL-6 were associated with OSA severity. In addition, IL-1β, IL-6, and IL-8 could be reduced by effective OSA interventions. These results suggested that dysfunction of monocyte and related inflammation pathways like NF-κb may be an important factor for the high inflammation in OSA (35). We also found that the alterations of several lymphocyte-derived interleukins such as IL-2, IL-4, and IL-12 in OSA indicated an imbalance in Th1/Th2 (13, 36). The levels for Th1 cytokines (IL-2 and IL-12) and Th2 cytokines (IL-4) were increased, whereas another Th2 cytokine IL-10 was decreased that may be due to reduced IL-10 content in γδT cells in OSA (37). Moreover, other interleukins including IL-17 and IL-23 have been recently emphasized. The increase of IL-17 and IL-23 implies a systematic inflammation in OSA (38). Under the regulation of IL-23, IL-17 can interact with other pro-inflammation interleukins like IL-1β and IL-6 and upregulate inflammation (39, 40). On the other side, mRNA levels of several inflammation interleukins (IL-1β, IL-6, IL-8, and IL-12) were upregulated in OSA which was consistent with our results (5, 41, 42). In addition, the dysregulation of interleukins may partly attribute to the gender differences, ethnicity, and others (43–45). All these changed interleukins in OSA emphasized the highly activated inflammation in OSA and indicated that several interleukin-related pathways are worthy of studying for OSA in the future.
Next, we used MR methods, which can overcome the influence of confounders, to explore causality between OSA and interleukins (46, 47). Interestingly, although we had no enough data to compare the concentration differences of IL-5 between patients with OSA and controls, we found that the causal effect of OSA on upregulated IL-5 was almost significant (p = 0.078, Figure 5A), which indicated the possibility that OSA may influence IL-5 levels in patients with OSA. IL-5 has been reported to be associated with several allergic diseases including asthma and allergic rhinitis, which were risk factors for developing OSA (48, 49). In addition, the release of OSA by adenotonsillectomy was associated with improvement in asthma symptoms (50). Thus, more attention is needed to pay for the association between the allergic reaction and OSA in future research. Further, we did not find causal effects of OSA on the above altered interleukin levels. In fact, several mechanisms aim to speculate about the causality from OSA to interleukins. IH in OSA can activate inflammatory pathways such as NF-κB, which enhanced the expression of several interleukins (34, 51). Another pathway of HIF-1α was also reported to participants in the activation of inflammasome in monocytes under IH (52). However, it has been reported by Arnardottir et al. that the association between OSA and IL-6 was found only in obese patients (53). Thus, a possibility for the observed inflammation status in OSA but no causality may also be explained by the results of OSA risk factors and related comorbidity, like obesity or hypertension and even the gender (54–56). In our reverse analysis about the causal effect of interleukins on OSA, we still got the null results by MR analysis. Some previous studies have inferred a mediator role of interleukins in OSA. For example, although related research is limited, a recent study further put forward that IL-6 is the mediation between obesity and OSA (46). According to the findings from bidirectional MR, more research studies from different models, such as associations of mRNA expression for each interleukin, are required to verify the causality between OSA and interleukins.
Despite the enlightening findings, this study did leave some limitations. First, there was relatively high heterogeneity in meta-analysis, which may be attributed to the variation of individual data. Second, the diagnosis of OSA GWAS was from medical electronic records, which had missed diagnosis. Because only people with clinical symptoms prefer to go hospital and those who have OSA but show no/mild symptoms may be mistakenly included in the control group. Third, the sample size of interleukin GWAS was relatively small, which may have a lower power to find enough related variants as IV. To complete this, we have replicated the analysis for IL-6, IL-8 and IL-18 with larger sample sizes. Thus, the associations of other interleukins and OSA are still needed to be studied.
In conclusion, there was a pervasively altered expression of interleukins including not only typical inflammation interleukins (IL-6 and IL-8) but also other interleukins (IL-1β, IL-2, IL-4, IL-10, IL-12, IL-17, IL-18, and IL-23). Among them, high IL-1β, IL-6, and IL-8 can be reduced by treatments in OSA. Finally, our MR results supported no causal relationships between OSA and above altered interleukins. Our results indicated that more research studies are required to answer the connective link between inflammation and OSA.
Data availability statement
The original contributions presented in the study are included in the article/Supplementary Material. Further inquiries can be directed to the corresponding author.
Author contributions
Conceptualization: MY and YZ. Data curation: WZ, MY, QF, YT, KL, ZC, and YZ. Data analysis: WZ, MY, QF, YT, KL, ZC, and YZ. Writing: WZ, MY, QF, YT, KL, ZC, and YZ. Funding acquisition: MY and YZ. Administration: MY and YZ. All authors contributed to the article and approved the submitted version.
Funding
This research was supported by the National Natural Science Foundation of China (No. 82001357), the Hunan Provincial Natural Science Foundation of China (Nos. 2020JJ5951 and 2021JJ80079), the Youth Science Foundation of Xiangya Hospital (No. 2019Q17), the Degree and Postgraduate Education Reform Project of Central South University (No. 2021YJSKSA10), the Undergraduate Education Reform Project of Central South University (Nos. 2021CG065 and 2021CG068), and the Research Project of Laboratory Construction and Management of Central South University (No. 202120).
Conflict of interest
The authors declare that the research was conducted in the absence of any commercial or financial relationships that could be construed as a potential conflict of interest.
Publisher’s note
All claims expressed in this article are solely those of the authors and do not necessarily represent those of their affiliated organizations, or those of the publisher, the editors and the reviewers. Any product that may be evaluated in this article, or claim that may be made by its manufacturer, is not guaranteed or endorsed by the publisher.
Supplementary material
The Supplementary Material for this article can be found online at: https://www.frontiersin.org/articles/10.3389/fimmu.2022.888644/full#supplementary-material
References
1. Senaratna CV, Perret JL, Lodge CJ, Lowe AJ, Campbell BE, Matheson MC, et al. Prevalence of obstructive sleep apnea in the general population: a systematic review. Sleep Med Rev (2017) 34:70–81. doi: 10.1016/j.smrv.2016.07.002
2. Gottlieb DJ, Punjabi NM. Diagnosis and management of obstructive sleep apnea: a review. JAMA (2020) 323:1389–400. doi: 10.1001/jama.2020.3514
3. Unnikrishnan D, Jun J, Polotsky V. Inflammation in sleep apnea: an update. Rev Endocr Metab Disord (2015) 16:25–34. doi: 10.1007/s11154-014-9304-x
4. Dinarello CA, Mier JW. Interleukins. Annu Rev Med (1986) 37:173–8. doi: 10.1146/annurev.me.37.020186.001133
5. Chuang L-P, Wu H-P, Lee L-A, Chiu L-C, Lin S-W, Hu H-C, et al. Elevated monocytic interleukin-8 expression under intermittent hypoxia condition and in obstructive sleep apnea patients. Int J Mol Sci (2021) 22:11396. doi: 10.3390/ijms222111396
6. Malkov MI, Lee CT, Taylor CT. Regulation of the hypoxia-inducible factor (HIF) by pro-inflammatory cytokines. Cells (2021) 10:2340. doi: 10.3390/cells10092340
7. Bode JG, Albrecht U, Häussinger D, Heinrich PC, Schaper F. Hepatic acute phase proteins–regulation by IL-6- and IL-1-type cytokines involving STAT3 and its crosstalk with NF-κB-dependent signaling. Eur J Cell Biol (2012) 91:496–505. doi: 10.1016/j.ejcb.2011.09.008
8. Lavie L, Lavie P. Molecular mechanisms of cardiovascular disease in OSAHS: the oxidative stress link. Eur Respir J (2009) 33:1467–84. doi: 10.1183/09031936.00086608
9. Ciftci TU, Kokturk O, Bukan N, Bilgihan A. The relationship between serum cytokine levels with obesity and obstructive sleep apnea syndrome. Cytokine (2004) 28:87–91. doi: 10.1016/j.cyto.2004.07.003
10. Yokoe T, Minoguchi K, Matsuo H, Oda N, Minoguchi H, Yoshino G, et al. Elevated levels of c-reactive protein and interleukin-6 in patients with obstructive sleep apnea syndrome are decreased by nasal continuous positive airway pressure. Circulation (2003) 107:1129–34. doi: 10.1161/01.CIR.0000052627.99976.18
11. Ming H, Tian A, Liu B, Hu Y, Liu C, Chen R, et al. Inflammatory cytokines tumor necrosis factor-α, interleukin-8 and sleep monitoring in patients with obstructive sleep apnea syndrome. Exp Ther Med (2019) 17:1766–70. doi: 10.3892/etm.2018.7110
12. Huang YS, Chin WC, Guilleminault C, Chu KC, Lin CH, Li HY. Inflammatory factors: Nonobese pediatric obstructive sleep apnea and adenotonsillectomy. J Clin Med 9 (2020) 9(4):1028. doi: 10.3390/jcm9041028
13. Said EA, Al-Abri MA, Al-Saidi I, Al-Balushi MS, Al-Busaidi JZ, Al-Reesi I, et al. Altered blood cytokines, CD4 T cells, NK and neutrophils in patients with obstructive sleep apnea. Immunol Lett (2017) 190:272–8. doi: 10.1016/j.imlet.2017.08.009
14. Chen B, Liu YN, Ji L, Liu PL, He J, Gan YY, et al. Elevated levels of interleukin-35 and interleukin-37 in adult patients with obstructive sleep apnea. J Clin Lab Anal (2021) 35:e23790. doi: 10.1002/jcla.23790
15. Sahlman J, Miettinen K, Peuhkurinen K, Seppä J, Peltonen M, Herder C, et al. The activation of the inflammatory cytokines in overweight patients with mild obstructive sleep apnoea. J Sleep Res (2010) 19:341–8. doi: 10.1111/j.1365-2869.2009.00787.x
16. Tang T, Huang Q, Liu J, Zhou X, Du J, Wu H, et al. Oxidative stress does not contribute to the release of proinflammatory cytokines through activating the nod-like receptor protein 3 inflammasome in patients with obstructive sleep apnoea. Sleep Breathing (2019) 23:535–42. doi: 10.1007/s11325-018-1726-3
17. Skrivankova VW, Richmond RC, Woolf BAR, Yarmolinsky J, Davies NM, Swanson SA, et al. Strengthening the reporting of observational studies in epidemiology using mendelian randomization: The STROBE-MR statement. JAMA (2021) 326:1614–21. doi: 10.1001/jama.2021.18236
18. Lawlor DA, Harbord RM, Sterne JA, Timpson N, Davey Smith G. Mendelian randomization: using genes as instruments for making causal inferences in epidemiology. Stat Med (2008) 27:1133–63. doi: 10.1002/sim.3034
19. Burgess S, Butterworth A, Thompson SG. Mendelian randomization analysis with multiple genetic variants using summarized data. Genet Epidemiol (2013) 37:658–65. doi: 10.1002/gepi.21758
20. Yi M, Zhao W, Tan Y, Fei Q, Liu K, Chen Z, et al. The causal relationships between obstructive sleep apnea and elevated CRP and TNF-α protein levels. Ann Med (2022) 54:1578–89. doi: 10.1080/07853890.2022.2081873
21. Strausz S, Ruotsalainen S, Ollila HM, Karjalainen J, Kiiskinen T, Reeve M, et al. Genetic analysis of obstructive sleep apnoea discovers a strong association with cardiometabolic health. Eur Respir J 57 (2021) 57(5):2003091. doi: 10.1101/2020.08.04.235994
22. Ahola-Olli AV, Würtz P, Havulinna AS, Aalto K, Pitkänen N, Lehtimäki T, et al. Genome-wide association study identifies 27 loci influencing concentrations of circulating cytokines and growth factors. Am J Hum Genet (2017) 100:40–50. doi: 10.1016/j.ajhg.2016.11.007
23. Moher D, Liberati A, Tetzlaff J, Altman DG. Preferred reporting items for systematic reviews and meta-analyses: the PRISMA statement. PloS Med (2009) 6:e1000097. doi: 10.1371/journal.pmed.1000097
24. Patel SR, Larkin EK, Redline S. Shared genetic basis for obstructive sleep apnea and adiposity measures. Int J Obes (Lond) (2008) 32:795–800. doi: 10.1038/sj.ijo.0803803
25. Ho V, Crainiceanu CM, Punjabi NM, Redline S, Gottlieb DJ. Calibration model for apnea-hypopnea indices: Impact of alternative criteria for hypopneas. Sleep (2015) 38:1887–92. doi: 10.5665/sleep.5234
26. Folkersen L, Gustafsson S, Wang Q, Hansen DH, Hedman Å K, Schork A, et al. Genomic and drug target evaluation of 90 cardiovascular proteins in 30,931 individuals. Nat Metab (2020) 2:1135–48. doi: 10.1038/s42255-020-00287-2
27. VanderWeele TJ, Tchetgen Tchetgen EJ, Cornelis M, Kraft P. Methodological challenges in mendelian randomization. Epidemiology (2014) 25:427–35. doi: 10.1097/EDE.0000000000000081
28. Burgess S, Davey Smith G, Davies NM, Dudbridge F, Gill D, Glymour MM, et al. Guidelines for performing mendelian randomization investigations. Wellcome Open Res (2019) 4:186. doi: 10.12688/wellcomeopenres.15555.1
29. Bowden J, Davey Smith G, Burgess S. Mendelian randomization with invalid instruments: effect estimation and bias detection through egger regression. Int J Epidemiol (2015) 44:512–25. doi: 10.1093/ije/dyv080
30. Bowden J, Davey Smith G, Haycock PC, Burgess S. Consistent estimation in mendelian randomization with some invalid instruments using a weighted median estimator. Genet Epidemiol (2016) 40:304–14. doi: 10.1002/gepi.21965
31. Verbanck M, Chen CY, Neale B, Do R. Detection of widespread horizontal pleiotropy in causal relationships inferred from mendelian randomization between complex traits and diseases. Nat Genet (2018) 50:693–8. doi: 10.1038/s41588-018-0099-7
32. Chuang HH, Huang CG, Chuang LP, Huang YS, Chen NH, Li HY, et al. Relationships among and predictive values of obesity, inflammation markers, and disease severity in pediatric patients with obstructive sleep apnea before and after adenotonsillectomy. J Clin Med 9 (2020) 9(2):579. doi: 10.3390/jcm9020579
33. Alvarez-Martins I, Remédio L, Matias I, Diogo LN, Monteiro EC, Dias S. The impact of chronic intermittent hypoxia on hematopoiesis and the bone marrow microenvironment. Pflugers Arch (2016) 468:919–32. doi: 10.1007/s00424-016-1797-6
34. Liu T, Zhang L, Joo D, Sun SC. NF-κB signaling in inflammation. Signal Transduct Target Ther (2017) 2:17023–. doi: 10.1038/sigtrans.2017.23
35. Strehl C, Fangradt M, Fearon U, Gaber T, Buttgereit F, Veale DJ. Hypoxia: how does the monocyte-macrophage system respond to changes in oxygen availability? J Leukoc Biol (2014) 95:233–41. doi: 10.1189/jlb.1212627
36. Dyugovskaya L, Lavie P, Lavie L. Lymphocyte activation as a possible measure of atherosclerotic risk in patients with sleep apnea. Ann N Y Acad Sci (2005) 1051:340–50. doi: 10.1196/annals.1361.076
37. Dyugovskaya L, Lavie P, Lavie L. Phenotypic and functional characterization of blood gammadelta T cells in sleep apnea. Am J Respir Crit Care Med (2003) 168:242–9. doi: 10.1164/rccm.200210-1226OC
38. Bhatt SP, Guleria R, Kabra SK. Metabolic alterations and systemic inflammation in overweight/obese children with obstructive sleep apnea. PloS One (2021) 16:e0252353–e0252353. doi: 10.1371/journal.pone.0252353
39. Miossec P, Kolls JK. Targeting IL-17 and TH17 cells in chronic inflammation. Nat Rev Drug Discovery (2012) 11:763–76. doi: 10.1038/nrd3794
40. Huang YS, Guilleminault C, Hwang FM, Cheng C, Lin CH, Li HY, et al. Inflammatory cytokines in pediatric obstructive sleep apnea. Med (Baltimore) (2016) 95:e4944. doi: 10.1097/MD.0000000000004944
41. Sharma S, Malur A, Marshall I, Huizar I, Barna BP, Pories W, et al. Alveolar macrophage activation in obese patients with obstructive sleep apnea. Surgery (2012) 151:107–12. doi: 10.1016/j.surg.2011.06.035
42. Wang W, Xu Z, Zhang J, Wang S, Ge W, Li X, et al. Tim-3 is a potential regulator that inhibits monocyte inflammation in response to intermittent hypoxia in children with obstructive sleep apnea syndrome. Clin Immunol (2021) 222:108641. doi: 10.1016/j.clim.2020.108641
43. Mayat Z, Giardina EV, Liao M, Aggarwal B. Associations of inflammation, physical activity, and sleep in a diverse population of women. J Womens Health (Larchmt) (2020) 29:1007–16. doi: 10.1089/jwh.2019.7663
44. Rocchi C, Valentina C, Totaro V, Broggi S, Lattanzi S, Viticchi G, et al. Inflammation markers in moderate and severe obstructive sleep apnea: the influence of sex. Sleep Breath (2022). doi: 10.1007/s11325-021-02537-3
45. Yi M, Tan Y, Pi Y, Zhou Y, Fei Q, Zhao W, et al. Variants of candidate genes associated with the risk of obstructive sleep apnea. Eur J Clin Invest (2022) 52:e13673. doi: 10.1111/eci.13673
46. Gaines J, Vgontzas AN, Fernandez-Mendoza J, Calhoun SL, He F, Liao D, et al. Inflammation mediates the association between visceral adiposity and obstructive sleep apnea in adolescents. Am J Physiol Endocrinol Metab (2016) 311:E851–e858. doi: 10.1152/ajpendo.00249.2016
47. Khaodhiar L, Ling PR, Blackburn GL, Bistrian BR. Serum levels of interleukin-6 and c-reactive protein correlate with body mass index across the broad range of obesity. JPEN J Parenter Enteral Nutr (2004) 28:410–5. doi: 10.1177/0148607104028006410
48. Chirakalwasan N, Ruxrungtham K. The linkage of allergic rhinitis and obstructive sleep apnea. Asian Pac J Allergy Immunol (2014) 32:276–86.
49. Kong DL, Qin Z, Shen H, Jin HY, Wang W, Wang ZF. Association of obstructive sleep apnea with asthma: a meta-analysis. Sci Rep (2017) 7:4088. doi: 10.1038/s41598-017-04446-6
50. Kheirandish-Gozal L, Dayyat EA, Eid NS, Morton RL, Gozal D. Obstructive sleep apnea in poorly controlled asthmatic children: effect of adenotonsillectomy. Pediatr Pulmonol (2011) 46:913–8. doi: 10.1002/ppul.21451
51. Brasier AR. The nuclear factor-kappaB-interleukin-6 signalling pathway mediating vascular inflammation. Cardiovasc Res (2010) 86:211–8. doi: 10.1093/cvr/cvq076
52. Díaz-García E, García-Tovar S, Alfaro E, Jaureguizar A, Casitas R, Sánchez-Sánchez B, et al. Inflammasome activation: A keystone of proinflammatory response in obstructive sleep apnea. Am J Respir Crit Care Med (2022) 205:1337–48. doi: 10.1164/rccm.202106-1445OC
53. Arnardottir ES, Maislin G, Schwab RJ, Staley B, Benediktsdottir B, Olafsson I, et al. The interaction of obstructive sleep apnea and obesity on the inflammatory markers c-reactive protein and interleukin-6: the icelandic sleep apnea cohort. Sleep (2012) 35:921–32. doi: 10.5665/sleep.1952
54. Wittert G. The relationship between sleep disorders and testosterone in men. Asian J Androl (2014) 16:262–5. doi: 10.4103/1008-682X.122586
55. Fletcher EC. Sympathetic over activity in the etiology of hypertension of obstructive sleep apnea. Sleep (2003) 26:15–9. doi: 10.1093/sleep/26.1.15
Keywords: obstructive sleep apnea, Mendelian randomization, inflammation, interleukin, IL-6
Citation: Yi M, Zhao W, Fei Q, Tan Y, Liu K, Chen Z and Zhang Y (2022) Causal analysis between altered levels of interleukins and obstructive sleep apnea. Front. Immunol. 13:888644. doi: 10.3389/fimmu.2022.888644
Received: 14 March 2022; Accepted: 29 June 2022;
Published: 27 July 2022.
Edited by:
Surya Prakash Bhatt, All India Institute of Medical Sciences, IndiaReviewed by:
Hyun Jik Kim, Seoul National University, South KoreaErnesto Prado Montes De Oca, CONACYT Centro de Investigación y Asistencia en Tecnología y Diseño del Estado de Jalisco (CIATEJ), Mexico
Copyright © 2022 Yi, Zhao, Fei, Tan, Liu, Chen and Zhang. This is an open-access article distributed under the terms of the Creative Commons Attribution License (CC BY). The use, distribution or reproduction in other forums is permitted, provided the original author(s) and the copyright owner(s) are credited and that the original publication in this journal is cited, in accordance with accepted academic practice. No use, distribution or reproduction is permitted which does not comply with these terms.
*Correspondence: Yuan Zhang, emhhbmd5dWFuOTE5NEBjc3UuZWR1LmNu
†These authors have contributed equally to this work and share first authorship