 Kyra van der Pan1
 Sandra de Bruin-Versteeg1Daniela Damasceno2
 Alejandro Hernández-Delgado2Alita J. van der Sluijs-Gelling1
 Wouter B. L. van den Bossche1,3
 Inge F. de Laat1
 Paula Díez1Brigitta A. E. Naber1
 Annieck M. Diks1
 Magdalena A. Berkowska1Bas de Mooij1Rick J. Groenland1Fenna J. de Bie1
 Indu Khatri1Sara Kassem1
 Anniek L. de Jager1Alesha Louis1
 Julia Almeida2
 Jacqueline A. M. van Gaans-van den Brink4
 Alex-Mikael Barkoff5
 Qiushui He5Gerben Ferwerda6
 Pauline Versteegen4Guy A. M. Berbers4
 Alberto Orfao2
 Jacques J. M. van Dongen1,2*
 Cristina Teodosio1,2 on behalf of the TiMaScan, IMI2, PERISCOPE, EuroFlow Consortia
- 1Department of Immunology, Leiden University Medical Center, Leiden, Netherlands
- 2Translational and Clinical Research Program, Cancer Research Center (IBMCC; University of Salamanca - CSIC), Cytometry Service, NUCLEUS, Department of Medicine, University of Salamanca (Universidad de Salamanca, and Institute of Biomedical Research of Salamanca (IBSAL), Salamanca, Spain
- 3Department of Immunology, Department of Neurosurgery, Brain Tumor Center, Erasmus Medical Center, University Medical Center Rotterdam, Rotterdam, Netherlands
- 4Centre for Infectious Disease Control, National Institute for Public Health and the Environment (RIVM), Bilthoven, Netherlands
- 5Institute of Biomedicine, Research Center for Infections and Immunity, University of Turku (UTU), Turku, Finland
- 6Section of Paediatric Infectious Diseases, Laboratory of Medical Immunology, Radboud Institute for Molecular Life Sciences, Nijmegen, Netherlands
Innate myeloid cell (IMC) populations form an essential part of innate immunity. Flow cytometric (FCM) monitoring of IMCs in peripheral blood (PB) has great clinical potential for disease monitoring due to their role in maintenance of tissue homeostasis and ability to sense micro-environmental changes, such as inflammatory processes and tissue damage. However, the lack of standardized and validated approaches has hampered broad clinical implementation. For accurate identification and separation of IMC populations, 62 antibodies against 44 different proteins were evaluated. In multiple rounds of EuroFlow-based design-testing-evaluation-redesign, finally 16 antibodies were selected for their non-redundancy and separation power. Accordingly, two antibody combinations were designed for fast, sensitive, and reproducible FCM monitoring of IMC populations in PB in clinical settings (11-color; 13 antibodies) and translational research (14-color; 16 antibodies). Performance of pre-analytical and analytical variables among different instruments, together with optimized post-analytical data analysis and reference values were assessed. Overall, 265 blood samples were used for design and validation of the antibody combinations and in vitro functional assays, as well as for assessing the impact of sample preparation procedures and conditions. The two (11- and 14-color) antibody combinations allowed for robust and sensitive detection of 19 and 23 IMC populations, respectively. Highly reproducible identification and enumeration of IMC populations was achieved, independently of anticoagulant, type of FCM instrument and center, particularly when database/software-guided automated (vs. manual “expert-based”) gating was used. Whereas no significant changes were observed in identification of IMC populations for up to 24h delayed sample processing, a significant impact was observed in their absolute counts after >12h delay. Therefore, accurate identification and quantitation of IMC populations requires sample processing on the same day. Significantly different counts were observed in PB for multiple IMC populations according to age and sex. Consequently, PB samples from 116 healthy donors (8-69 years) were used for collecting age and sex related reference values for all IMC populations. In summary, the two antibody combinations and FCM approach allow for rapid, standardized, automated and reproducible identification of 19 and 23 IMC populations in PB, suited for monitoring of innate immune responses in clinical and translational research settings.
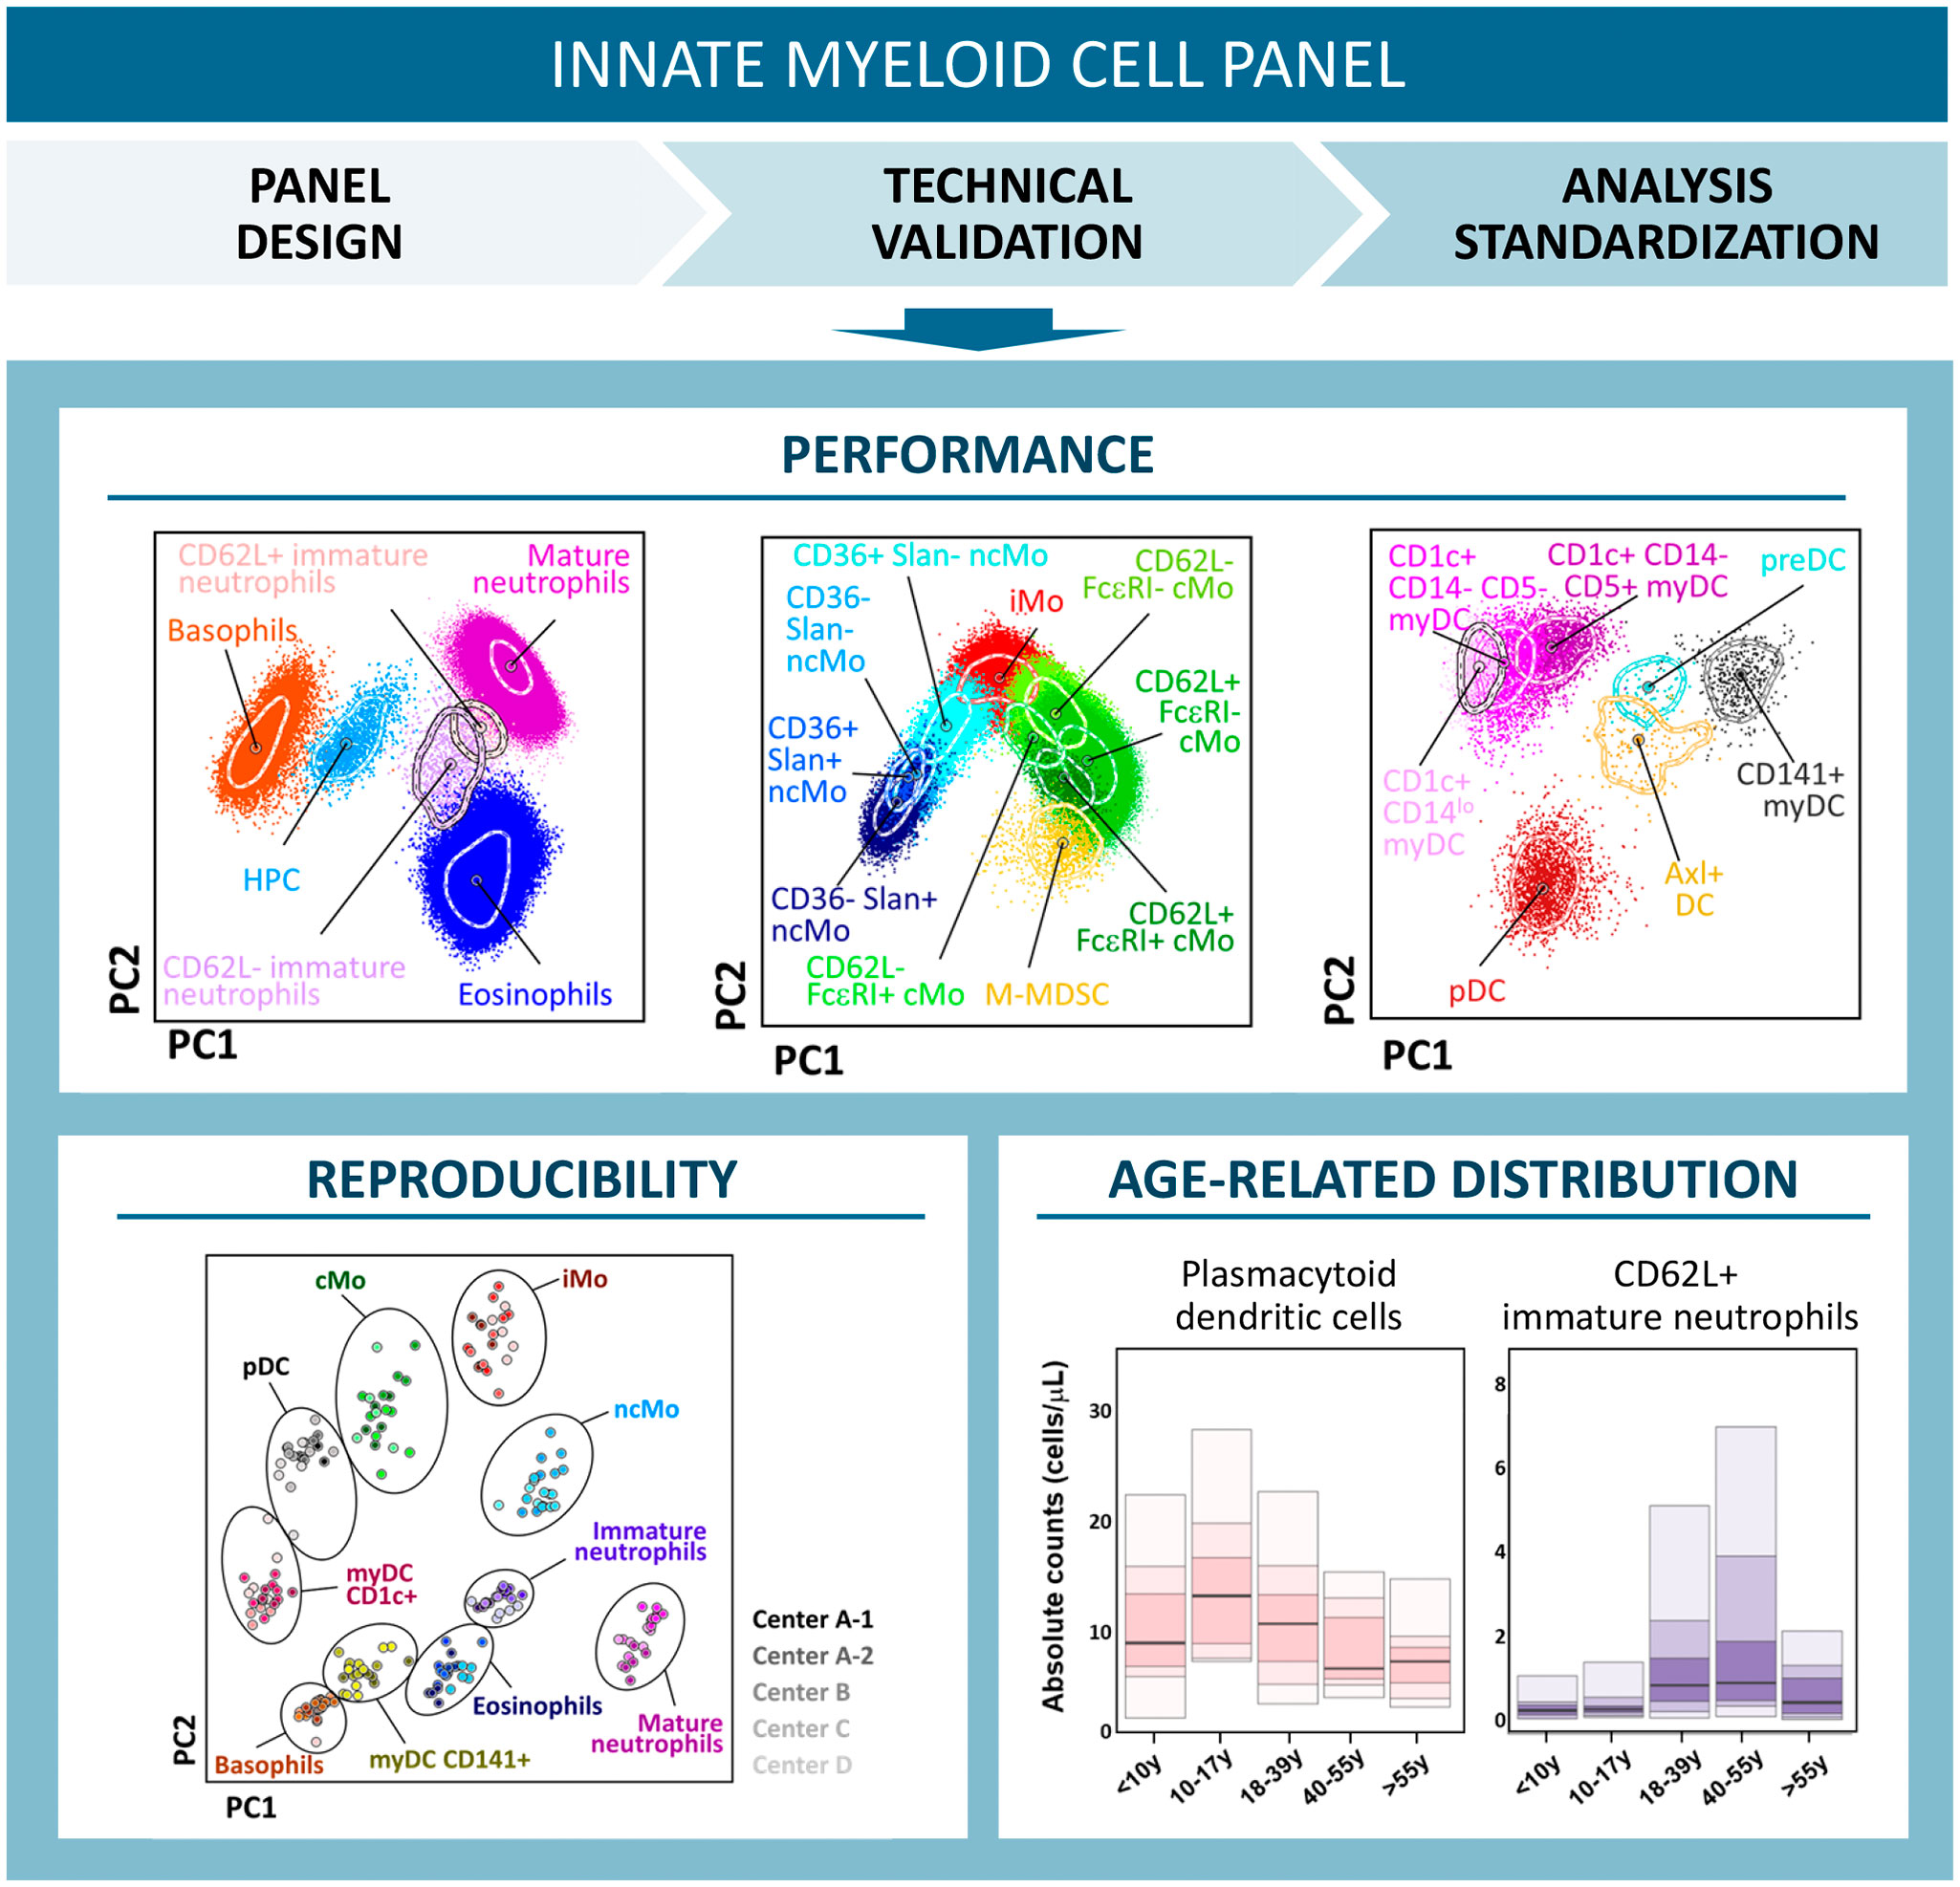
Graphical Abstract
Introduction
Monocytes, dendritic cells (DCs) and granulocytes, together also called innate myeloid cells (IMCs), play key roles in multiple different processes related to maintenance of tissue homeostasis, including sensing of tissue damage, induction and/or resolution of inflammation, antigen presentation and pathogen eradication (1–9). While some of these cell populations, such as mast cells and macrophages, are merely tissue-resident, others like monocytes, DCs, basophils, eosinophils and neutrophils circulate via peripheral blood (PB) with the ability to sense micro-environmental changes (such as inflammatory processes) and migrate to tissues where they modulate local responses in both physiological and disease conditions (10–12). This great plasticity and functional heterogeneity of IMCs renders them into ideal candidates for monitoring disturbances in body homeostasis at the systemic level, e.g. in PB. Consequently, the clinical utility of monitoring IMCs in PB for diagnosis, staging, prognostic assessment and/or evaluating response to treatment in multiple disease conditions has been demonstrated previously (9, 13–24).
However, monitoring IMCs for translational research and diagnostic patient care is currently hampered by the lack of standardized approaches. This includes the absence of immunophenotypic consensus criteria for the definition of the distinct IMC subsets, due to their great heterogeneity and plasticity (25–31) and the limited availability of lineage-specific proteins, which have led to the introduction of e.g., marker cocktails for lineage exclusion and highly variable strategies and/or extensive sets of markers for correct identification of the target populations (25–27, 29, 31–34). Additionally, new monocytes and DCs have been identified, leading to progressively more complex antibody panels and data analysis procedures. For example, new subsets of classical (cMo) and non-classical (ncMo) monocytes have recently been defined based on the expression pattern of CD9, CD62L, CD93 and/or FcϵRI and CD9, CD36 and Slan, respectively (35–39). Likewise, CD1c+ myeloid dendritic cells (myDCs) are now known to include different functional subsets, that can be identified based on CD14 expression (CD14- non-inflammatory and a CD14lo pro-inflammatory CD1c+ myDC population) (40) and CD5: CD5hi CD1c+ myDCs with higher ability to migrate to the lymph nodes and induce T cell proliferation, and CD5- CD1c+ myDCs with a closer functional profile to monocytes (41, 42). In addition, the new subset of Axl+ and SIGLEC6+ DC (Axl+ DCs) has been described recently, which was previously included in the plasmacytoid dendritic cell (pDC) population and exhibits mixed gene expression and functional profiles between pDCs and myDCs (40). In parallel, a new population of DC precursors has been described, co-expressing CD34int and CD100hi, with the ability to generate in vitro both CD1c+ and CD141+ myDCs (31, 40, 43).
In recent years, different 8-12 to 38 color panels have been designed and proposed for monitoring monocytic and DC populations in PB by flow cytometry (FCM) and mass cytometry, respectively (26, 44–46). However, careful analysis of these FCM antibody panels shows that they typically include multiple redundant markers for defining IMC populations (e.g., CD123, CD303 and/or CD304 for identification of pDCs) and/or they require the use of antibody cocktails for exclusion (e.g., “dump channel”) of e.g. lymphoid cells, which prevent the addition of other relevant markers (29, 45). In contrast, a previously described 38-color mass cytometry antibody panel allows identification and characterization of virtually all monocyte, monocyte-derived macrophage, DC and myeloid-derived suppressor cell populations (47). However, mass cytometry is not readily available in many centers and, most importantly, has a very low throughput (250-350 cells/sec) and limited levels standardization, which limit its use in clinical settings. Furthermore, none of the previously reported antibody panels allow identification of the recently described DC and monocyte populations. At the same time these antibody panels did not use standardized and validated procedures for antibody panel design and data analysis in a multicentric setting, and failed to provide age-matched related ranges for the IMC populations (26, 44–46, 48, 49).
Here we designed and validated two (11- and 14-color) antibody panels for standardized, automated, and reproducible identification of 19 to 23 IMC populations in human blood by FCM, and provide age and sex-matched reference values for more objective interpretation of altered IMC profiles in multicentric clinical settings. Ultimately, the antibody panels developed will allow to set a new benchmark for IMC in both clinical and translational research settings.
Material and methods
Samples
For this study, 261 PB samples (195 ethylenediaminetetraacetic acid -EDTA- and 66 sodium heparin-anticoagulated) obtained from 205 healthy donors (HD) were evaluated. From them, 242 samples from 197 donors were used for antibody panel development and evaluation (72 men, 118 women and 7 donors lacking sex information, with median age of 32 years -y- ranging from 5y to 99y). For assessment of the technical performance of the antibody panels, construction & validation of the reference database for automated gating (50) 57 samples from 48 donors were used (20 men, 25 women; median age 38y; range: 5y – 85y; of note, sex information was not available for 3 donors). A total of 116 samples from 67 women and 45 men (unknown sex in 4 donors) with median age 30y (range: 8y-69y) were processed for defining age- and sex-related normal reference ranges. Additionally, 4 cord blood (CB) samples collected in EDTA were also included for the study of infrequent populations in steady-state PB, which are reported to be increased in CB (e.g., myeloid-derived suppressor cells -MDSC-, immature neutrophils). All samples were collected after informed consent was provided by each donor according to the Declaration of Helsinki and the guidelines of the local ethics committees and review boards. Of note, this study includes pre-vaccination samples collected and processed in the context of the Dutch ‘BERT study’, which was initiated by the Innovative Medicines Initiative (IMI)2 PERISCOPE consortium (51, 52) and was approved by the Medical Research Ethics Committees United (MEC-U, NL60807.100.17-R17.039) and registered at the EU Clinical trial registry (EudraCT number 2016-003678-42).
Immunophenotypic studies
Samples were processed within 4 hours (h) after collection, according to the EuroFlow bulk lysis and sample preparation and staining standard operating procedures (SOP) (52, 53) for surface membrane (Sm) only and Sm plus cytoplasmic (Cy) labeling of 107 cells, employing the antibodies (Supplementary Table 1) and antibody combination depicted in Table 1 and Supplementary Tables 2, 3. Protocols are described in detail in the Supplementary Methods section and on the EuroFlow website (www.EuroFlow.org ).
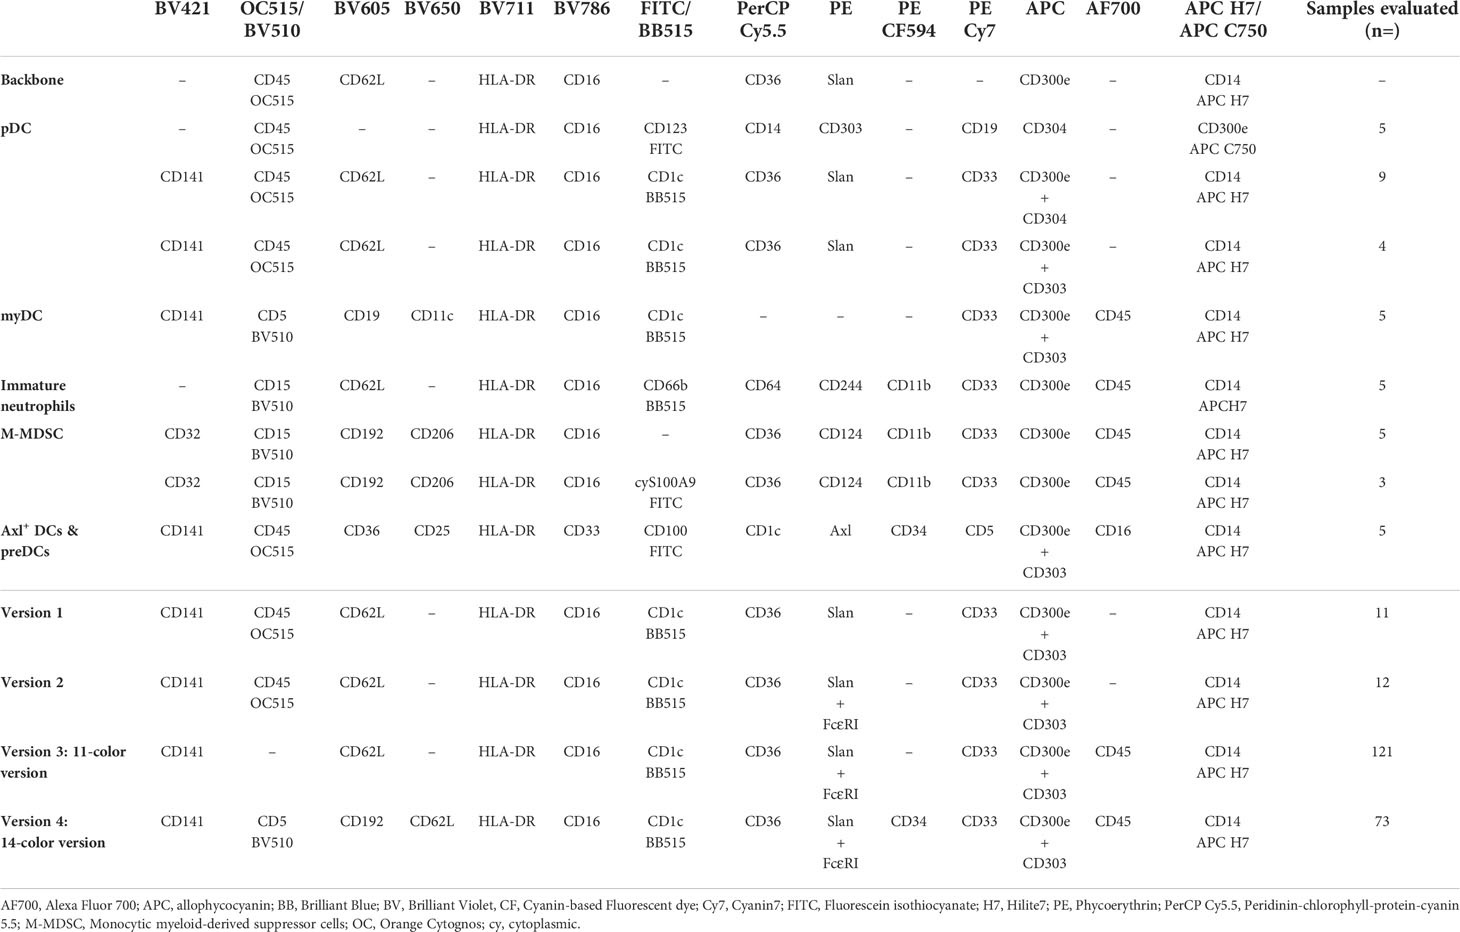
Table 1 Antibody combinations used to stain peripheral blood for the selection of the best marker combination for identification of the different innate myeloid cell populations, and overview of the distinct versions evaluated during the multiple design cycles (four rounds) of the EuroFlow innate myeloid cell (IMC) flow cytometry tubes.
Stained cells were stored at 4°C and measured within 1h by FCM. Absolute counts were assessed employing a double platform method based on quantitation of nucleated cells obtained in the Sysmex XP-300 automated hematological analyzer (Sysmex Europe GmbH, Norderstedt, Germany).
In vitro activation assay of monocytes and DCs
Short-term in vitro activation assays were performed using sodium heparin anti-coagulated PB, as described elsewhere (53). Briefly, 500 μl of PB diluted 1/1 (vol/vol) with RPMI 1640 medium (Sigma-Aldrich, Zwijndrecht, The Netherlands) were incubated for 6h at 37°C in a sterile environment containing 5% CO2 in the presence of 100 ng/ml of lipopolysaccharide (LPS) (Sigma-Aldrich). For those experiments in which intracellular detection of cytokines was performed, 10 μg/ml of Brefeldin A (Sigma-Aldrich) was added to block cytokine secretion. For each condition, an unstimulated aliquot of the same sample was processed in parallel in an identical way. Stimulated PB samples were then stained with a panel of monoclonal antibodies (MoAb) (Supplementary Table 2) using the EuroFlow bulk lysis and sample preparation and staining SOPs (www.EuroFlow.org) as previously described (54).
Sample acquisition and analysis
For each sample evaluated, 2.5 to 5 x 10⁶ cells were measured using LSR Fortessa (Becton Dickinson Biosciences (BD), San José, CA) instruments equipped with 4 lasers (405nm, 488nm, 561nm and 640nm) or a 3-laser (405nm, 488nm, 640nm) Aurora (Cytek, Fremont, CA) instrument. BD Fortessa flow cytometers were set-up at each center according to the EuroFlow guidelines (www.EuroFlow.org) and calibrated daily by use of BD™ Setup and Tracking (CS&T) beads (BD Biosciences), their performance being checked daily by acquisition of SPHERO™ Rainbow calibration particles (Cytognos S.L., Salamanca, Spain). Calibration and daily quality control of the Aurora flow cytometer was performed according to the SOP recommended by the manufacturer. For data analysis, the Infinicyt™ software (version 2.0.2.d.000; Cytognos S.L., Salamanca, Spain) was used. Gates were defined based on internal negative and fluorescence-minus-one (FMO) controls, for general population identification and immunophenotypic characterization, respectively.
Antibody evaluation and selection for the EuroFlow IMC tubes
To design accurate and reproducible antibody combinations for IMC detection in PB, 62 antibodies against 44 proteins were stepwise evaluated in several rounds of EuroFlow-based design–testing–evaluation–redesign (Table 1, Supplementary Table 1). In a first step, 8 antibodies were used as backbone to accurately identify the major monocytic populations (CD14, CD16, CD45, CD300e, HLA-DR) and their subsets (CD36, CD62L and Slan) (Table 1) (9, 37, 39). Selection of different reagents was carried out for each target antigen, based on discrimination between positive and negative reference populations, employing stain index values [calculated as (MFI PRP – MFI NRP)/2 x rSDNRP; where MFI, median fluorescence intensity; PRP, positive reference population; NRP, negative reference population; rSD, robust standard deviation], as previously described (55).
In a subsequent step, selection of the minimum set of the most informative markers for identification of additional subsets of IMC was performed per cell population, e.g., pDCs, myDCs, Axl+ DCs, CD100+ preDCs, myeloid-derived suppressor cells (MDSCs) (Table 1), using counter-staining with the backbone markers for the major population identification (CD14, CD16, CD45, CD300e, HLA-DR). Selection of individual markers and marker combinations was based on specificity, redundancy, population discrimination and lack of cross-contamination by other cell subsets, as assessed by principal component analysis (PCA) and canonical multivariate analysis (CA) using Infinicyt™ (56). For Axl+ DCs, accuracy of the set of markers used for their identification was further validated (Supplementary Table 2), employing in vitro stimulation of PB samples (n=5).
Based on the above strategies, a first version of the IMC tube was designed (version 1; Table 1), further modified to include the anti-FcεRI antibody (version 2; Table 1), for better identification of basophils and further subsetting of cMos (36). Subsequently, to improve the discrimination of leukocytes from debris and platelets, and better identify immature neutrophils, the CD45 antibody reagent was replaced with a brighter conjugate in the 11-color version of the tube (version 3; Table 1). At a later stage, an extended 14-color version (version 4, Table 1) was designed, which also included i) CD5 for further subsetting of CD1c+ CD14- myDCs; ii) CD34 for identification of hematopoietic precursor cells (HPCs) and CD100+ CD34int pre-DCs; and iii) CD192 for identification of M-MDSCs. Additionally, the fluorochrome conjugated to CD62L was changed to minimize its spread on the FcεRI channel, as required for clear cut subsetting of cMos (Table 1).
Technical performance of the EuroFlow IMC tubes
The technical performance of the EuroFlow IMC tube was evaluated in a Fortessa X20 (BD) for different anti-coagulants (EDTA vs. sodium heparin) (assessed in 7 paired PB samples stained with versions 2 (n=3) and 3 (n=4) of the IMC tube; Table 1), immediate vs. delayed (storage at RT for 6h, 12h and 24h) (n=3; version 3) and fresh vs. frozen (n=3; version 4) staining of (EDTA anti-coagulated) PB samples. To compare the performance of the EuroFlow IMC tube in different instruments (i.e., conventional vs. spectral flow cytometers), PB samples from 5 donors were stained with version 4 of the tube (Table 1) and measured in parallel in a 4-laser Fortessa X20 (BD) conventional flow cytometer (405nm, 488nm, 561nm and 640nm lasers) and a 3-laser Aurora (Cytek) (405nm, 488nm, 640nm) spectral flow cytometer.
Intra- and inter-assay reproducibility
Intra-assay variation of the EuroFlow IMC tube, expressed by the intra-assay coefficient of variation (%CV) was determined in duplicates of 5 EDTA-anticoagulated PB samples, processed in parallel (version 3; Table 1) and measured in a Fortessa X20 (BD) flow cytometer. In addition, inter-center reproducibility was also evaluated via analysis of PB samples from HD locally collected, processed (version 3; Table 1) and measured at 4 centers: Leiden University Medical Center (LUMC) (n=9), University of Salamanca (USAL) (n=5), National Institute for Public Health and the Environment (RIVM) (n=3), and University of Turku (UTU) (n=4), using five different instruments (2 LSR Fortessa and 3 Fortessa X20). For this purpose, the %CV of the median fluorescence intensity (MFI) obtained for each marker in pre-determined positive reference cell populations was first calculated per center (intra-center variation), and the technical variability between centers (inter-center variation) estimated based on the median MFI of each marker per center.
Reproducibility of manual data analysis
To evaluate the inter-operator reproducibility of manual analysis, flow cytometry standard (.FCS) sample files from 6 adult HD (stained with version 3 of the EuroFlow IMC tube) were independently analyzed in parallel by an experienced (expert 1 – E1) and a novice (expert 2 – E2) flow cytometrist. Intra-operator variability was assessed for E1, who analyzed the files twice within a time lapse of ≥2 months.
Database construction for automated data analysis
For construction of the database for automated analysis of the 11-color version of the EuroFlow IMC tube (version 3, Table 1), 18 PB samples from healthy adults were processed and measured in Fortessa X20 and LSR Fortessa instruments, at the four different sites mentioned above, within the framework of the Horizon 2020/IMI multicenter PERISCOPE consortium (http://periscope-project.eu/): LUMC (n=5), USAL (n=8), RIVM (n=2), and UTU (n=3). Flow cytometry data files from those 18 samples that fulfilled all the selection criteria (described in detail in Supplementary Methods) were then merged into a single data file used as database tool, implemented in Infinicyt™ (Cytognos) (57). For validation of the database vs. manual analysis performed by an experienced flow cytometrist (E1), a second set of PB samples from HD (n=6), processed and acquired at LUMC (n=3) and USAL (n=3), was prospectively used. For these samples, analysis was repeated at two different timepoints set ≥2 months apart from each other.
Results
Selection of markers for identification of dendritic cell populations
Based on earlier work (9, 37–39), a set of eight markers (CD14, CD16, CD36, CD45, CD62L, CD300e, HLA-DR and Slan) that allows for identification and subsetting of monocytic cells, was pre-selected as backbone (Table 1), based on antibody clones that had previously shown to perform well technically (Supplementary Table 1) (9, 37, 39, 58). Three markers (CD123, CD303 and CD304) were evaluated for the specific identification of pDCs (25, 27, 31) in combination with the backbone combination required for identification of the major populations of monocytes and granulocytes (CD14, CD16, CD45, CD300e and HLA-DR). All three markers individually allowed clear identification of pDCs within the HLA-DR+/CD14-/CD16- cell compartment (Figures 1A–F). However, whereas the CD303 and CD304 expression was highly specific for pDCs, CD123 was also present in other cell populations (Figures 1A–C), such as HPCs, myDC and some B-cell (sub)populations (40, 59). While no significant differences were observed for population purity (Figures 1G–I), multivariate analysis (PCA) showed the highest discrimination power for CD303 (28.8%) vs. CD123 (26.3%) and CD304 (14.6%) (Figures 1J–M), even when CD303 and CD304 antibody reagents conjugated with the same fluorochrome were compared (p=0.03, Figure 1N). Importantly, since CD303 and the backbone marker CD300e are not expressed on the same cells (i.e., monocytes/myDCs vs. pDCs, respectively) (Supplementary Figure 1), both antibodies could be used in the later versions of the antibody combination with the same fluorochrome.
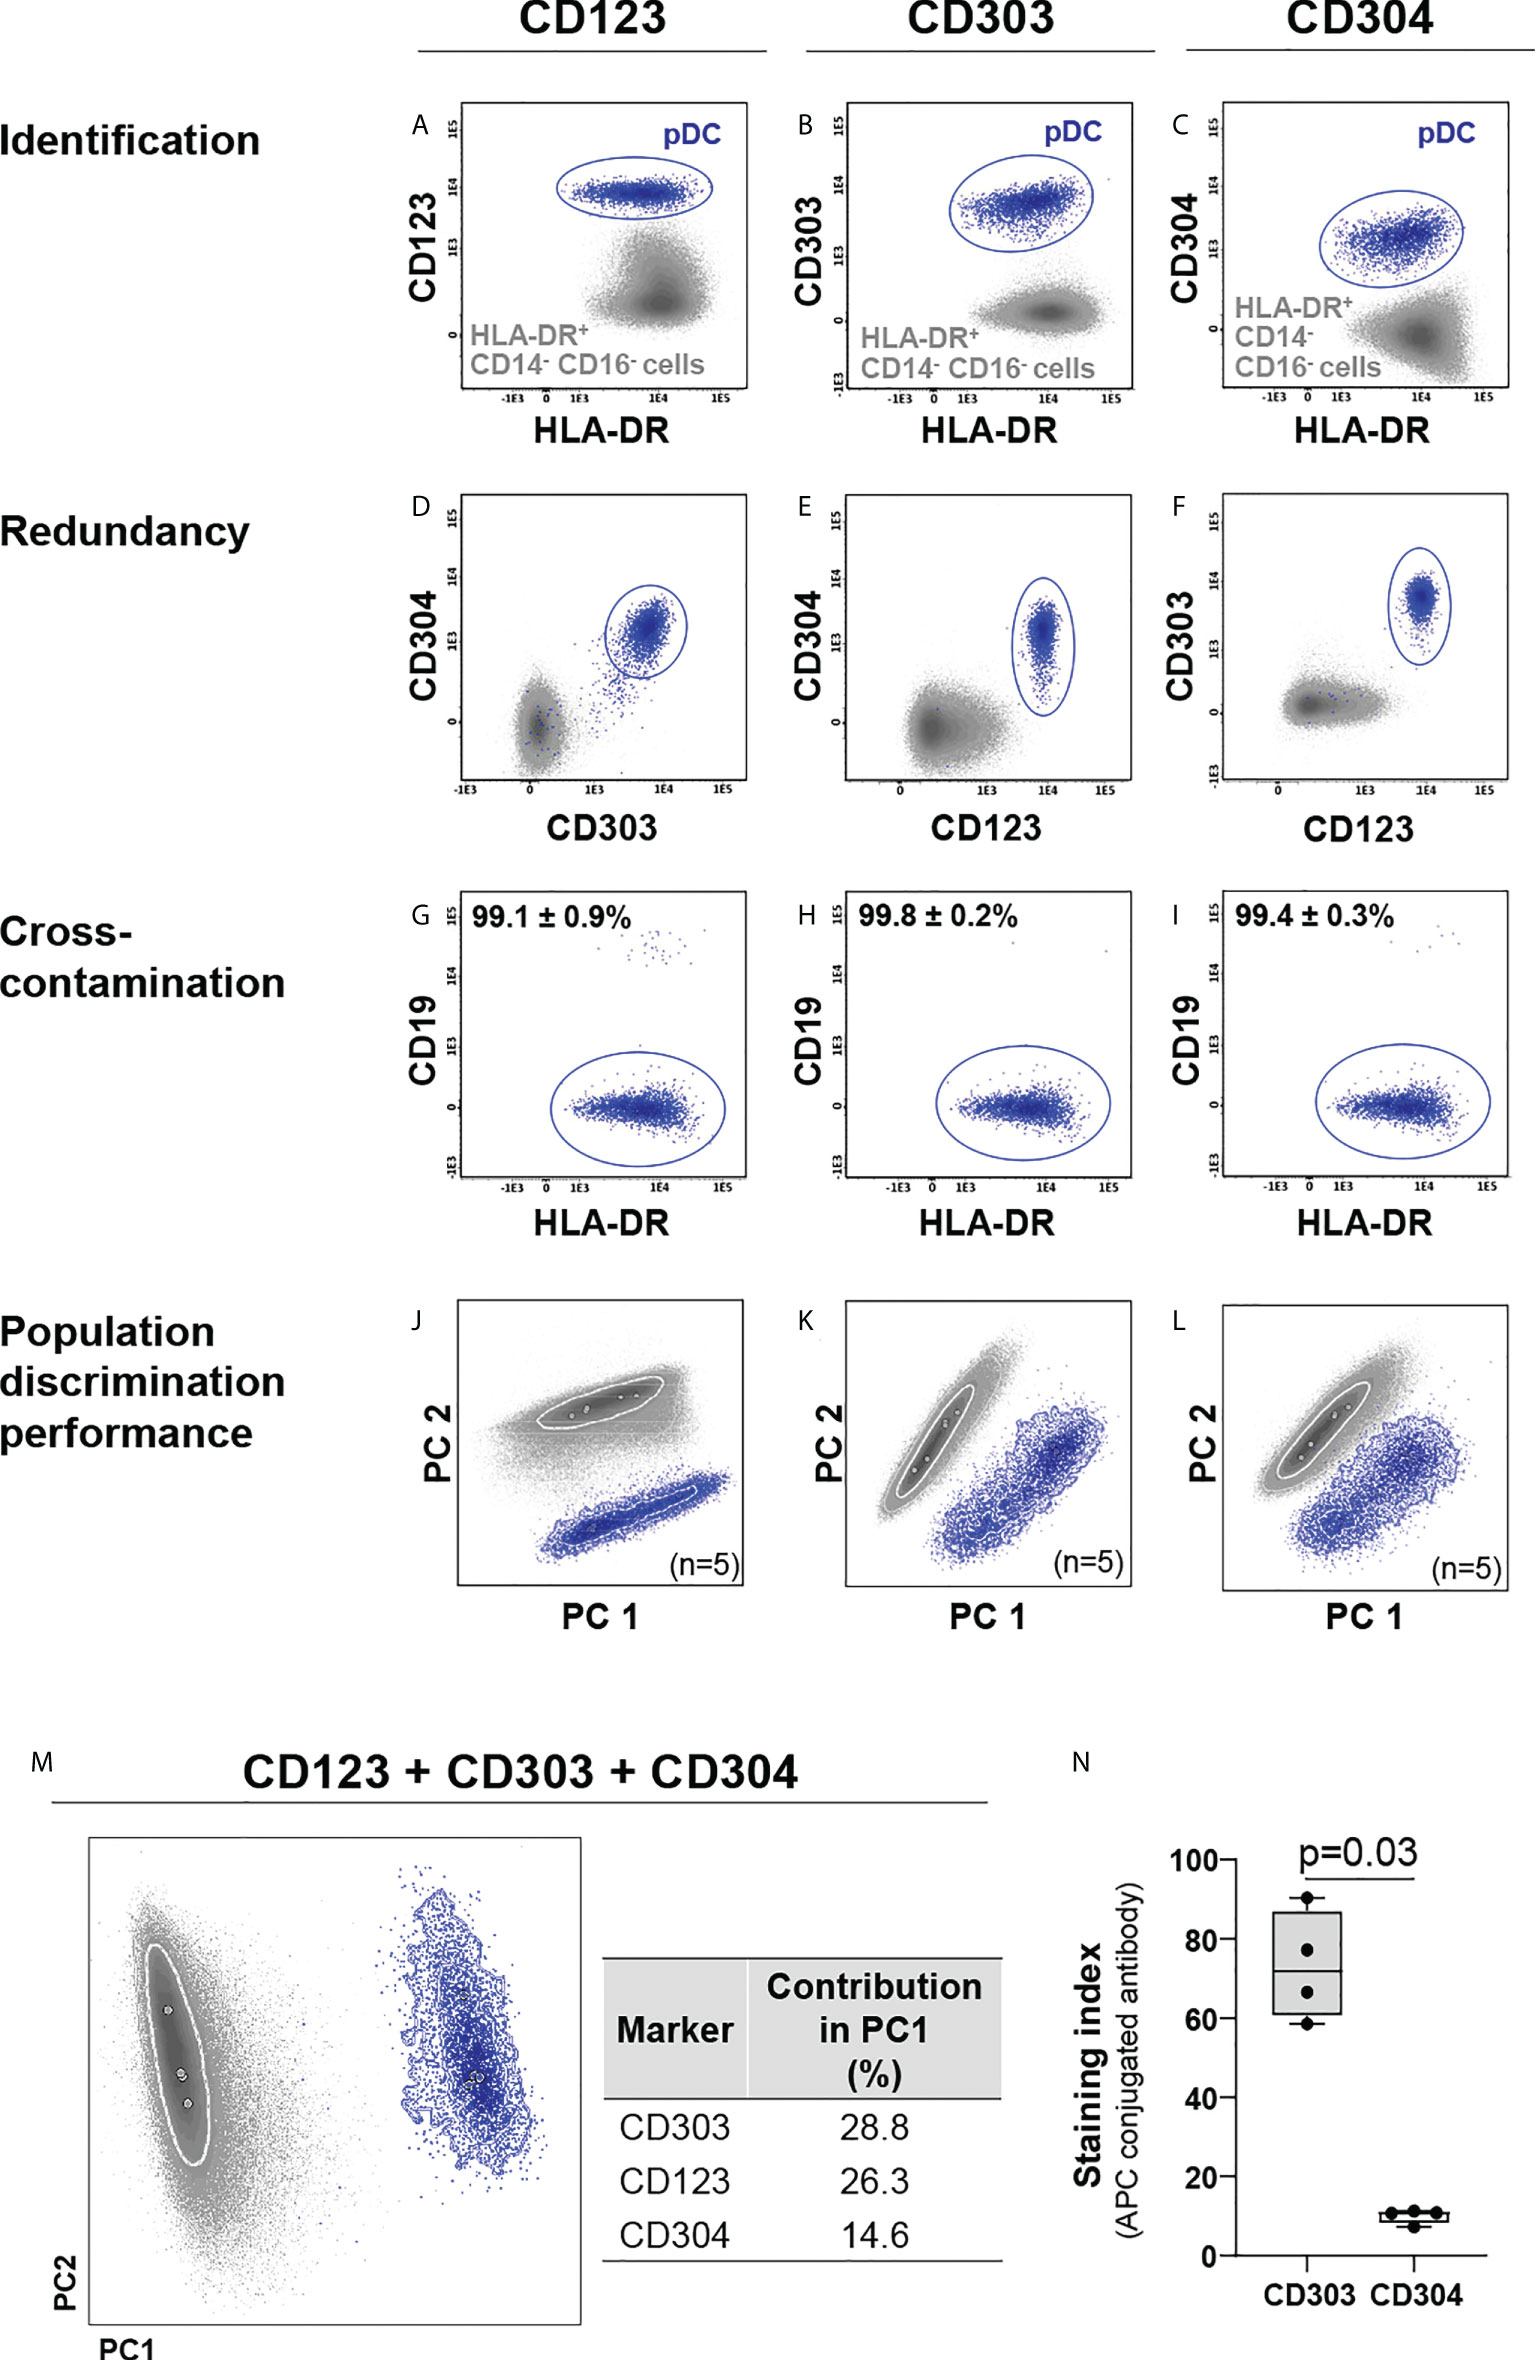
Figure 1 Comparison of the performance of CD123, CD303 and CD304 for identification of plasmacytoid dendritic cells (pDCs). CD123, CD303 and CD304 were individually employed for identification of pDCs (A–C) within the HLA-DR+ CD14- CD16- cell population. Redundancy of each marker vs. the other two (D–F) and cross-contamination of pDCs with other cells (G–I), were evaluated. Marker performance for discrimination of pDCs vs. other HLA-DR+ CD14- CD16- cells was determined using principal component (PC) analysis (PCA) in the context of cross-staining with CD14, CD16, CD45, CD300e, HLA-DR for the individual markers (J–L) and in the combination of all markers (M). The contribution of CD123, CD304 and CD303 to the separation of pDCs vs. other HLA-DR+ CD14- CD16- cells is depicted in the table. (N) exhibits the staining index of allophycocyanin (APC)-conjugated CD303 and CD304 reagents. To test differences, the Mann-Whitney test was used. Solid circles in all PCA plots represent median values for the parameters evaluated and dotted lines depict the first standard deviation for each population identified. pDC, plasmacytoid dendritic cells; PC, principal component; APC, allophycocyanin.
For myDCs, CD11c and CD33 were selected to be tested (38, 41, 42) in combination with the backbone markers. As expected, both markers allowed accurate identification of myDCs within the HLA-DR+/CD14-/lo/CD16- cell compartment (Figures 2A–D), with a similar discrimination power (Figures 2G–I). Nevertheless, CD33 exhibited higher specificity than CD11c (purity of 99.8% ± 0.1% vs. 91.5% ± 5.1%, respectively) (Figures 2E, F) and was, therefore selected for identification of myDCs. Further discrimination among myDCs between conventional type 1 (cDC1) and 2 (cDC2) DCs, based on CD141 (BDCA3) and CD1c (BDCA-1) was then successfully evaluated (Figure 2J) (27, 60–62). Additional subsetting of CD1c+ myDCs has been recently reported based on the low vs. absent expression of CD14 with functional implications (the former show a more inflammatory gene expression profile) (40). Likewise, low vs. high expression of CD5 provided the ability for further functional subclassification of CD1c+ myDC (42), and this marker was therefore included in the extended version 4 of the IMC tube (Table 1), which allowed for unequivocal identification of three subsets of CD1c+ myDC (CD14lo, CD14- CD5- and CD14- CD5+) (Supplementary Figure 2).
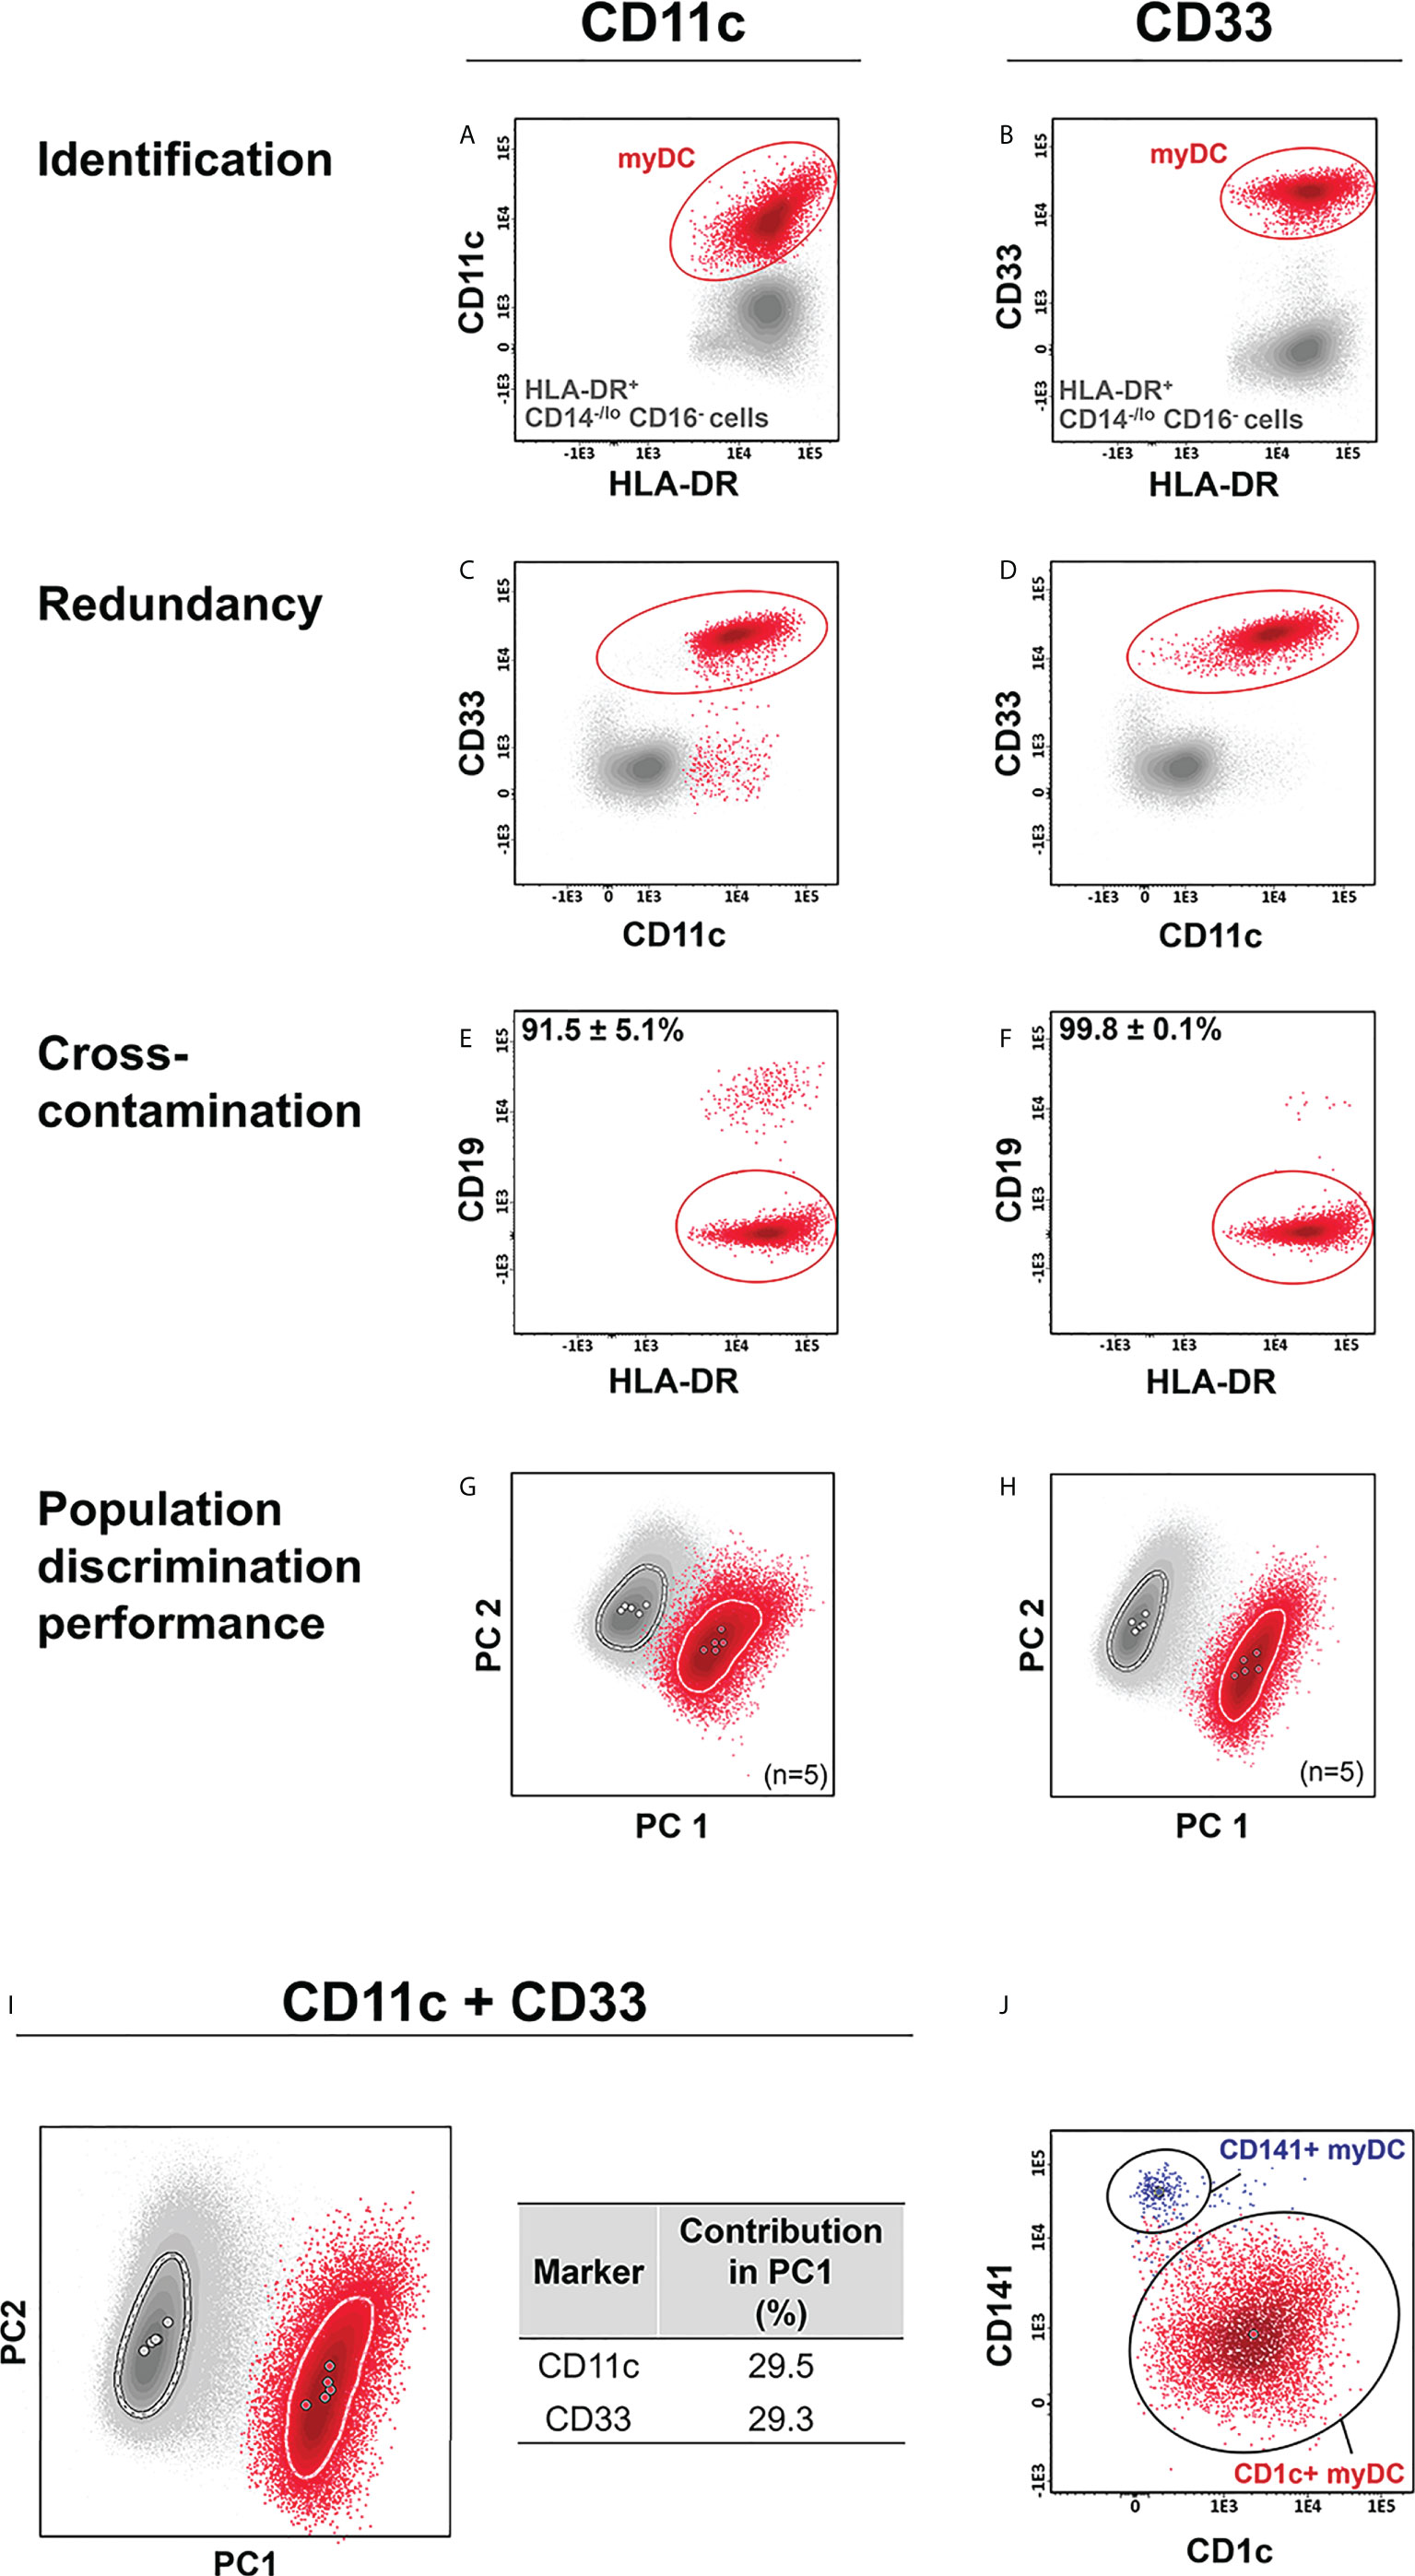
Figure 2 Comparison of the performance of CD11c vs. CD33 for identification of myeloid dendritic cells (myDCs). CD11c and CD33 were individually employed for identification of myDCs (A, B) within the HLA-DR+ CD14-/lo, CD16- cell population. Redundancy of each marker vs. the other (C, D), and cross-contamination with other cells (E, F), was evaluated. Marker performance for identification of myDCs vs. other HLA-DR+ CD14-/lo, CD16- cells was determined using principal component (PC) analysis (PCA) in the context of cross-staining with CD14, CD16, CD45, HLA-DR for the individual markers (G, H) and in the combination of all markers (I). The contribution of CD11c and CD33 for the discrimination of the two populations is depicted in the table. (J) shows a representative example of CD1c+ myDCs and CD141+ myDCs subsetting within the myDC population, previously identified based on expression of CD33. Solid circles in all principal component plots represent median values for the parameters evaluated and dotted lines depict the first standard deviation for each population identified. myDC, myeloid dendritic cells; PC, principal component.
Detection of CD100+ preDCs in PB does not need a CD100 antibody
Even though the definition of the myDC precursor is still elusive, a PB population identified based on a CD34int CD100hi immunophenotype (Supplementary Figure 3), with the ability to differentiate to both CD1c+ and CD141+ myDC, has been described in PB (40). PCA performed on PB cells stained with CD34 and CD100 in combination with CD14, CD16, CD33, CD45, CD300e, CD303 and HLA-DR exhibited a clear separation between CD34+ HPC and CD100+ DC precursors mostly due to their different pattern of expression of HLA-DRhi and CD34int (Supplementary Figure 3B), showing that CD100 is not critically required, as a similar discrimination power was observed when CD100 was excluded (Supplementary Figures 3C-D). Based on these results, CD34, but not CD100, was included in the extended 14-color version 4 of the IMC antibody panel (Table 1).
Detection of Axl+ DCs does not need an Axl antibody
In 2017, Villani et al. (40) described a new population of DCs that overlaps with pDCs, when classical identification markers are used, but that could be accurately discriminated based on the expression of Axl. In order to identify Axl+ DC, Axl was combined with CD1c, CD14, CD16, CD33, CD45, CD141, CD303, CD300e and HLA-DR. Overall, inclusion of Axl in the antibody combination proved not to be critically required for identification of this DC population, as the expanded backbone combination allowed for the separation of the Axl+ DCs from pDCs and myDC populations based on its unique pattern of expression of CD33lo, CD141+ and CD303lo (Figures 3A–G). This was further confirmed by multivariate analysis, which revealed similar population discrimination patterns, independently of the presence or absence of Axl (Figures 3H,I), associated with similar Axl+ DC counts (Figure 3J). Axl+ DCs have been reported to display a mixed gene expression signature between myDC and pDC, with shared immunophenotypic features with pDCs (e.g., CD123 and CD303 expression) and functional characteristics of myDCs (e.g., response to LPS) (40). Therefore, we further validated the functional identity of the Axl+ DC population, identified based on the restricted set of markers selected for evaluation of DC populations, (Table 1; Supplementary Table 2). Our results showed that in unstimulated samples, expression of CD11b was restricted to myDCs, whereas CD33 was also (dimly) expressed on Axl+ DCs, but not on pDCs. In turn, steady-state Axl+ DCs displayed a higher frequency of pro-inflammatory cytokine producing cells vs. myDCs CD1c+ CD14- (p<0.02 for IL1β and IL12) and pDCs (p<0.003 for IL1β and IL8) (Supplementary Figures 4, 5). Upon exposure to LPS, CD1c+ myDCs populations displayed a strong response to LPS, while pDCs and CD141+ myDCs were mostly unresponsive, Axl+ DCs exhibited an overall intermediate activation pattern, associated with a unique profile for those markers that showed significant differences in steady-state and/or in LPS-stimulated samples (CD33, CD62L, CD63, CD69, CD83, CD86, IL1β, IL6, IL8, IL12 and TNFα) (Figures 3K, L).
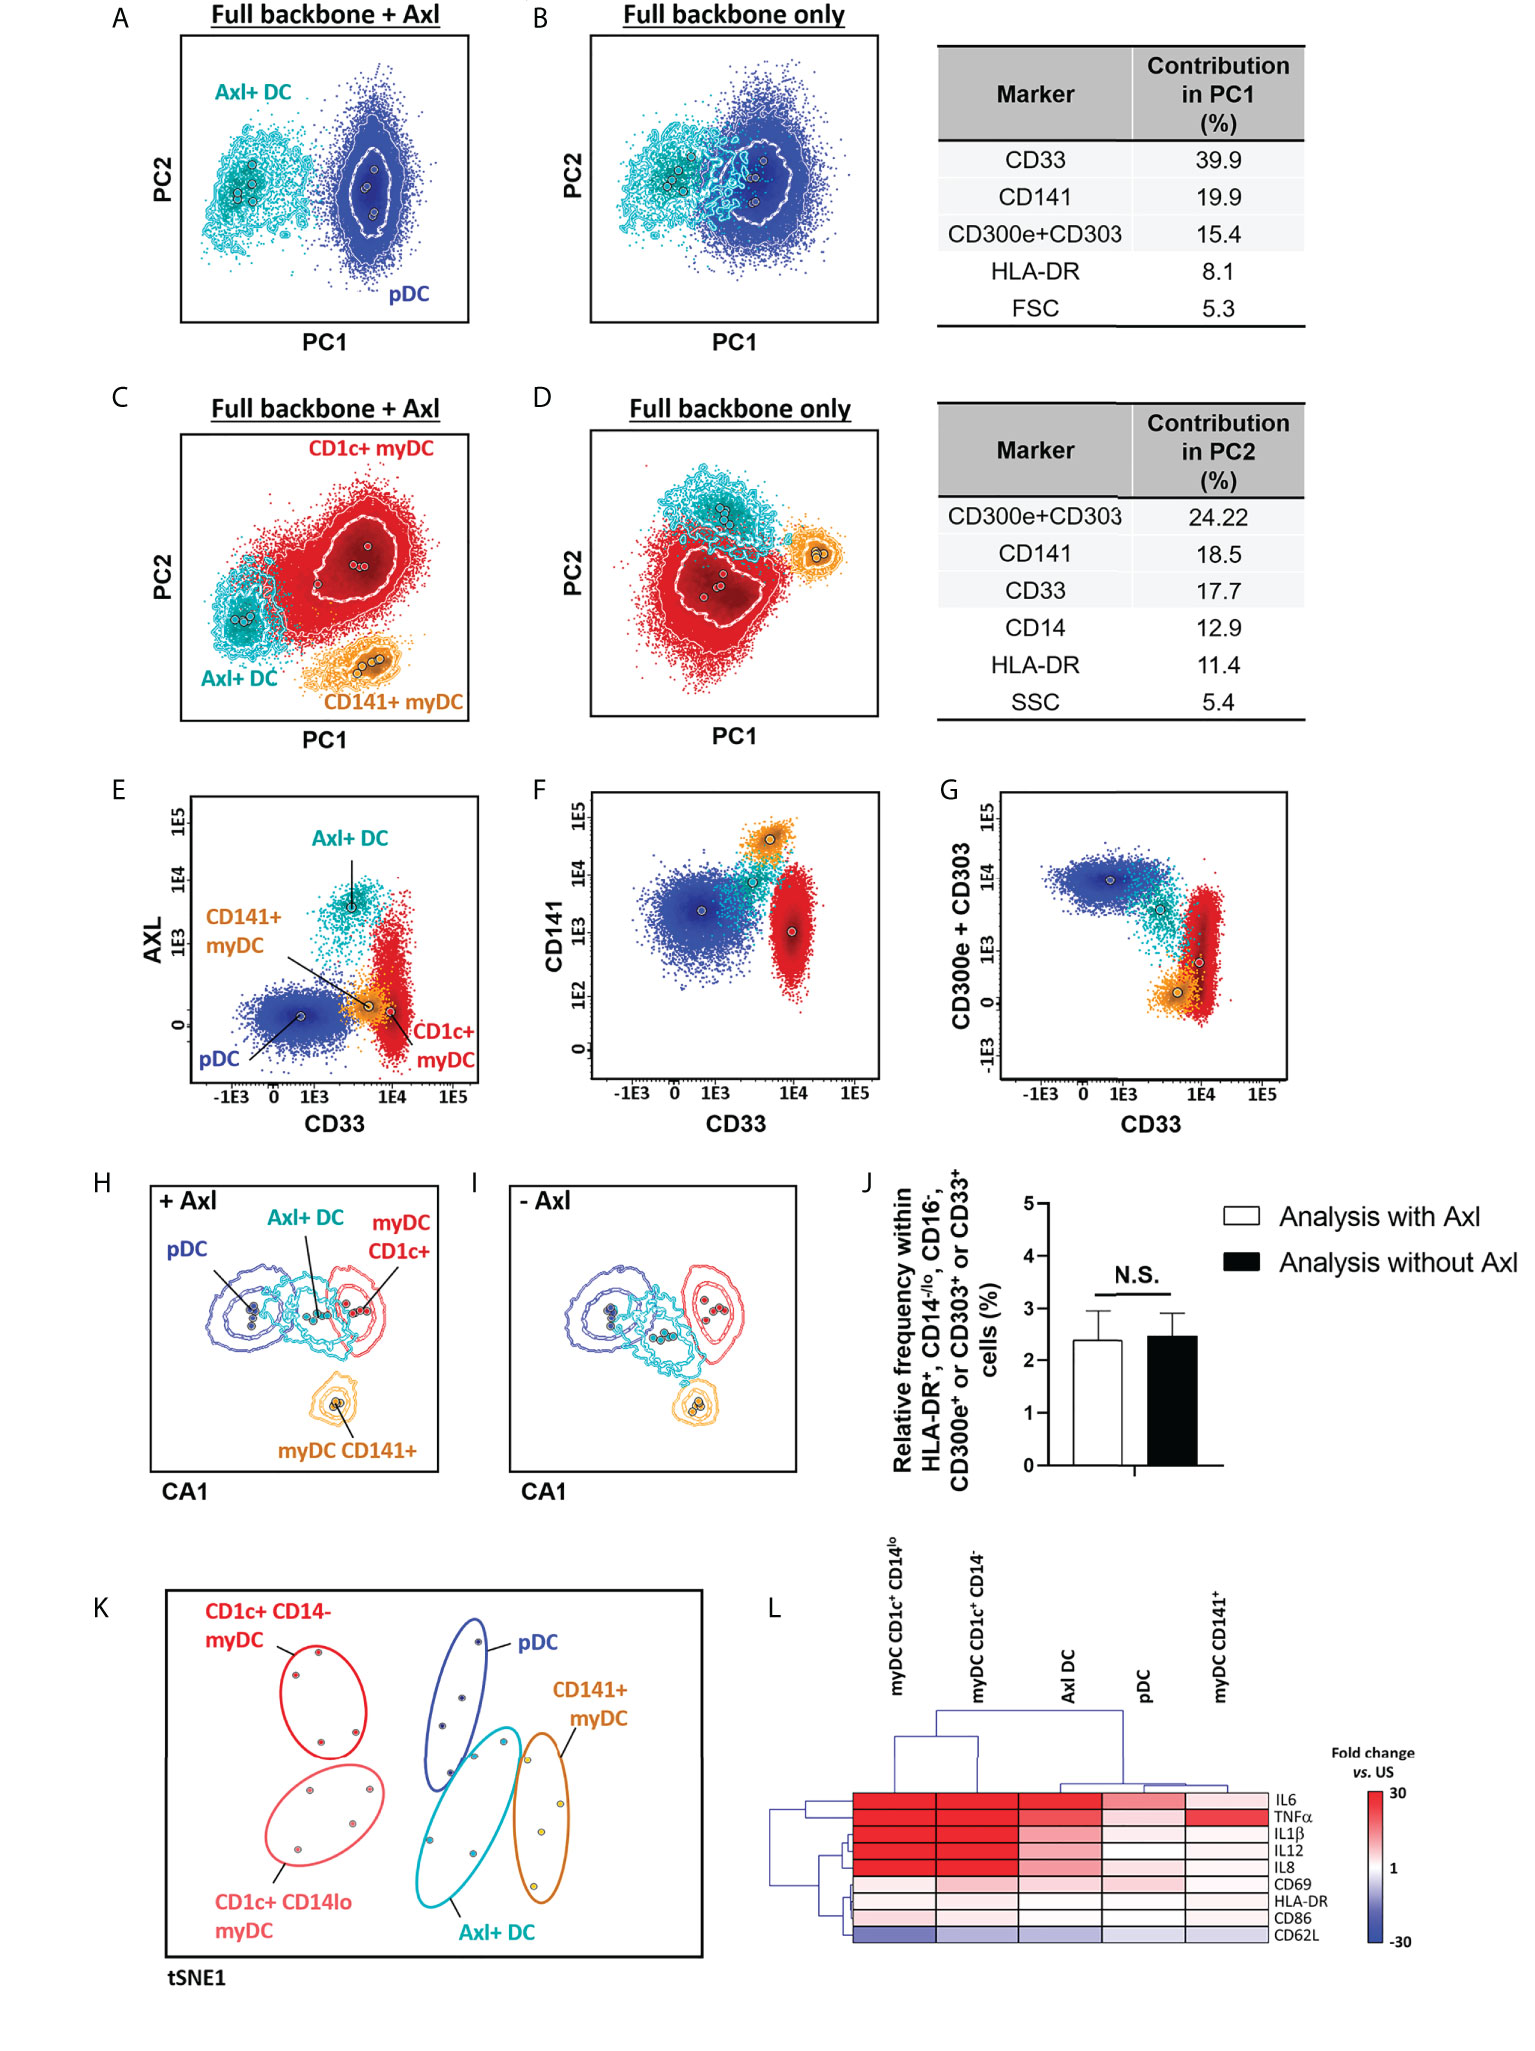
Figure 3 Identification and functional characterization of Axl+ dendritic cells (DCs) vs. other DC populations. Identification of Axl+ DCs within the HLA-DR+ CD14-/lo, CD16-, CD300e+ or CD303+ or CD33+ cell population vs. plasmacytoid (A, B) and myeloid (C, D) DCs, in the context of staining with CD1c, CD14, CD16, CD33, CD45, CD141, CD300e+CD303 (i.e. full backbone) alone (B, D) or in combination with Axl (A, C) (n=5) is shown. Performance of the full backbone for discrimination of Axl+ DCs vs. other DCs, and the relative contribution of the most informative markers (>5%) for the separation between populations is depicted in (B, D). Expression patterns of the minimum set of markers required for identification of Axl+ DCs are shown in panels (E–G), respectively. (H, I) represent the canonical multivariate analysis (CA) for overall discrimination of DC populations (n=5 donors). Relative frequency of Axl+ DCs after staining with CD33, CD141 and CD300e+CD303 with and without Axl, is depicted in (J) (n=5). The t-distributed stochastic neighbor embedding (t-SNE) plot in (K) depicts the overall expression of activation- and maturation-related markers which showed statistically significantly different expression patterns at steady-state and in response to stimulation with LPS (TNFα, IL1β, IL6, IL8, IL12, CD33, CD62L, CD63, CD69, CD83, CD86 and HLA-DR) between the distinct DC populations (n=4 donors). (L) shows a hierarchical clustering analysis of the response to stimulation with LPS (given as fold change vs. steady-state) of the distinct DC populations identified employing the backbone set of markers. Statistical differences were evaluated employing Kruskall-Wallis and Wilcoxon tests with a false discovery rate (FDR) of 5% to correct for multiple comparisons, to compare between populations and steady-state vs. stimulation, respectively. Solid circles in all principal component, canonical analysis and tSNE plots represent median values for the parameters evaluated, inner dotted and outer solid lines depict the first standard and second standard deviations for each population identified. pDC, plasmacytoid dendritic cells; myDC, myeloid dendritic cells; PC, principal component; CA, canonical multivariate analysis; N.S., not statistically significant (p value>0.05); tSNE, t-distributed stochastic neighbor embedding; US, unstimulated.
Selection of markers for identification of immature vs. mature neutrophils
In order to determine whether additional markers are required for accurate identification of immature vs. mature neutrophils, PCA-based evaluation of the performance of the IMC tube extended backbone (i.e., backbone markers plus the markers required for identification of DCs) vs. the extended backbone plus CD11b, CD15 and CD66b, for identification of different polymorphonuclear (PMN) cells, including immature neutrophils, was performed. Of note, combined usage of cell size (forward scatter – FSC-) and internal complexity (side scatter – SSC-) plus CD45 allowed for clear separation of granulocyte and lymphocyte populations. Likewise, the SSChi CD16- CD33lo CD62Lhi, SSClo CD16- CD33hi CD62Lhi and SSChi CD16hi CD33lo CD62Lhi phenotypic profiles allowed clear discrimination among eosinophils, basophils, and mature neutrophils, respectively, as well as their distinction from SSCint CD16-/lo CD33+ CD62L-/lo immature neutrophils, with no clear added value of the other myeloid markers evaluated (Figures 4A,B). This was also confirmed by the expression pattern of markers known to be associated and/or modulated during neutrophil maturation (Figure 4C), as cells identified based on an HLA-DR- CD14- CD16-/lo CD33+ CD45lo CD300e- phenotype in fact correspond to immature (CD11b-/+, CD15+, CD66b+, CD244-/lo) neutrophils. Interestingly, neutrophils could be further subclassified based on expression of CD16 and CD62L (Figure 4D) as mature neutrophils (CD16hi CD62L+), a phenotype previously reported to be associated with segmented neutrophils (63), immature neutrophils CD16lo CD62L+, compatible with band neutrophils (63), and other, even more immature subsets of CD16-/lo CD62L- neutrophils, that might include an admixture of promyelocytes (CD11b-), myelocytes (CD11b+) and metamyelocytes (CD16lo/+) (Figures 4C, D) (64). As expected (65), significantly higher frequencies of immature neutrophils were observed in CB samples vs. adult PB with the extended backbone (Figure 4E), with similar immature neutrophil counts in the presence vs. absence of additional neutrophil-associated markers (Figure 4F).
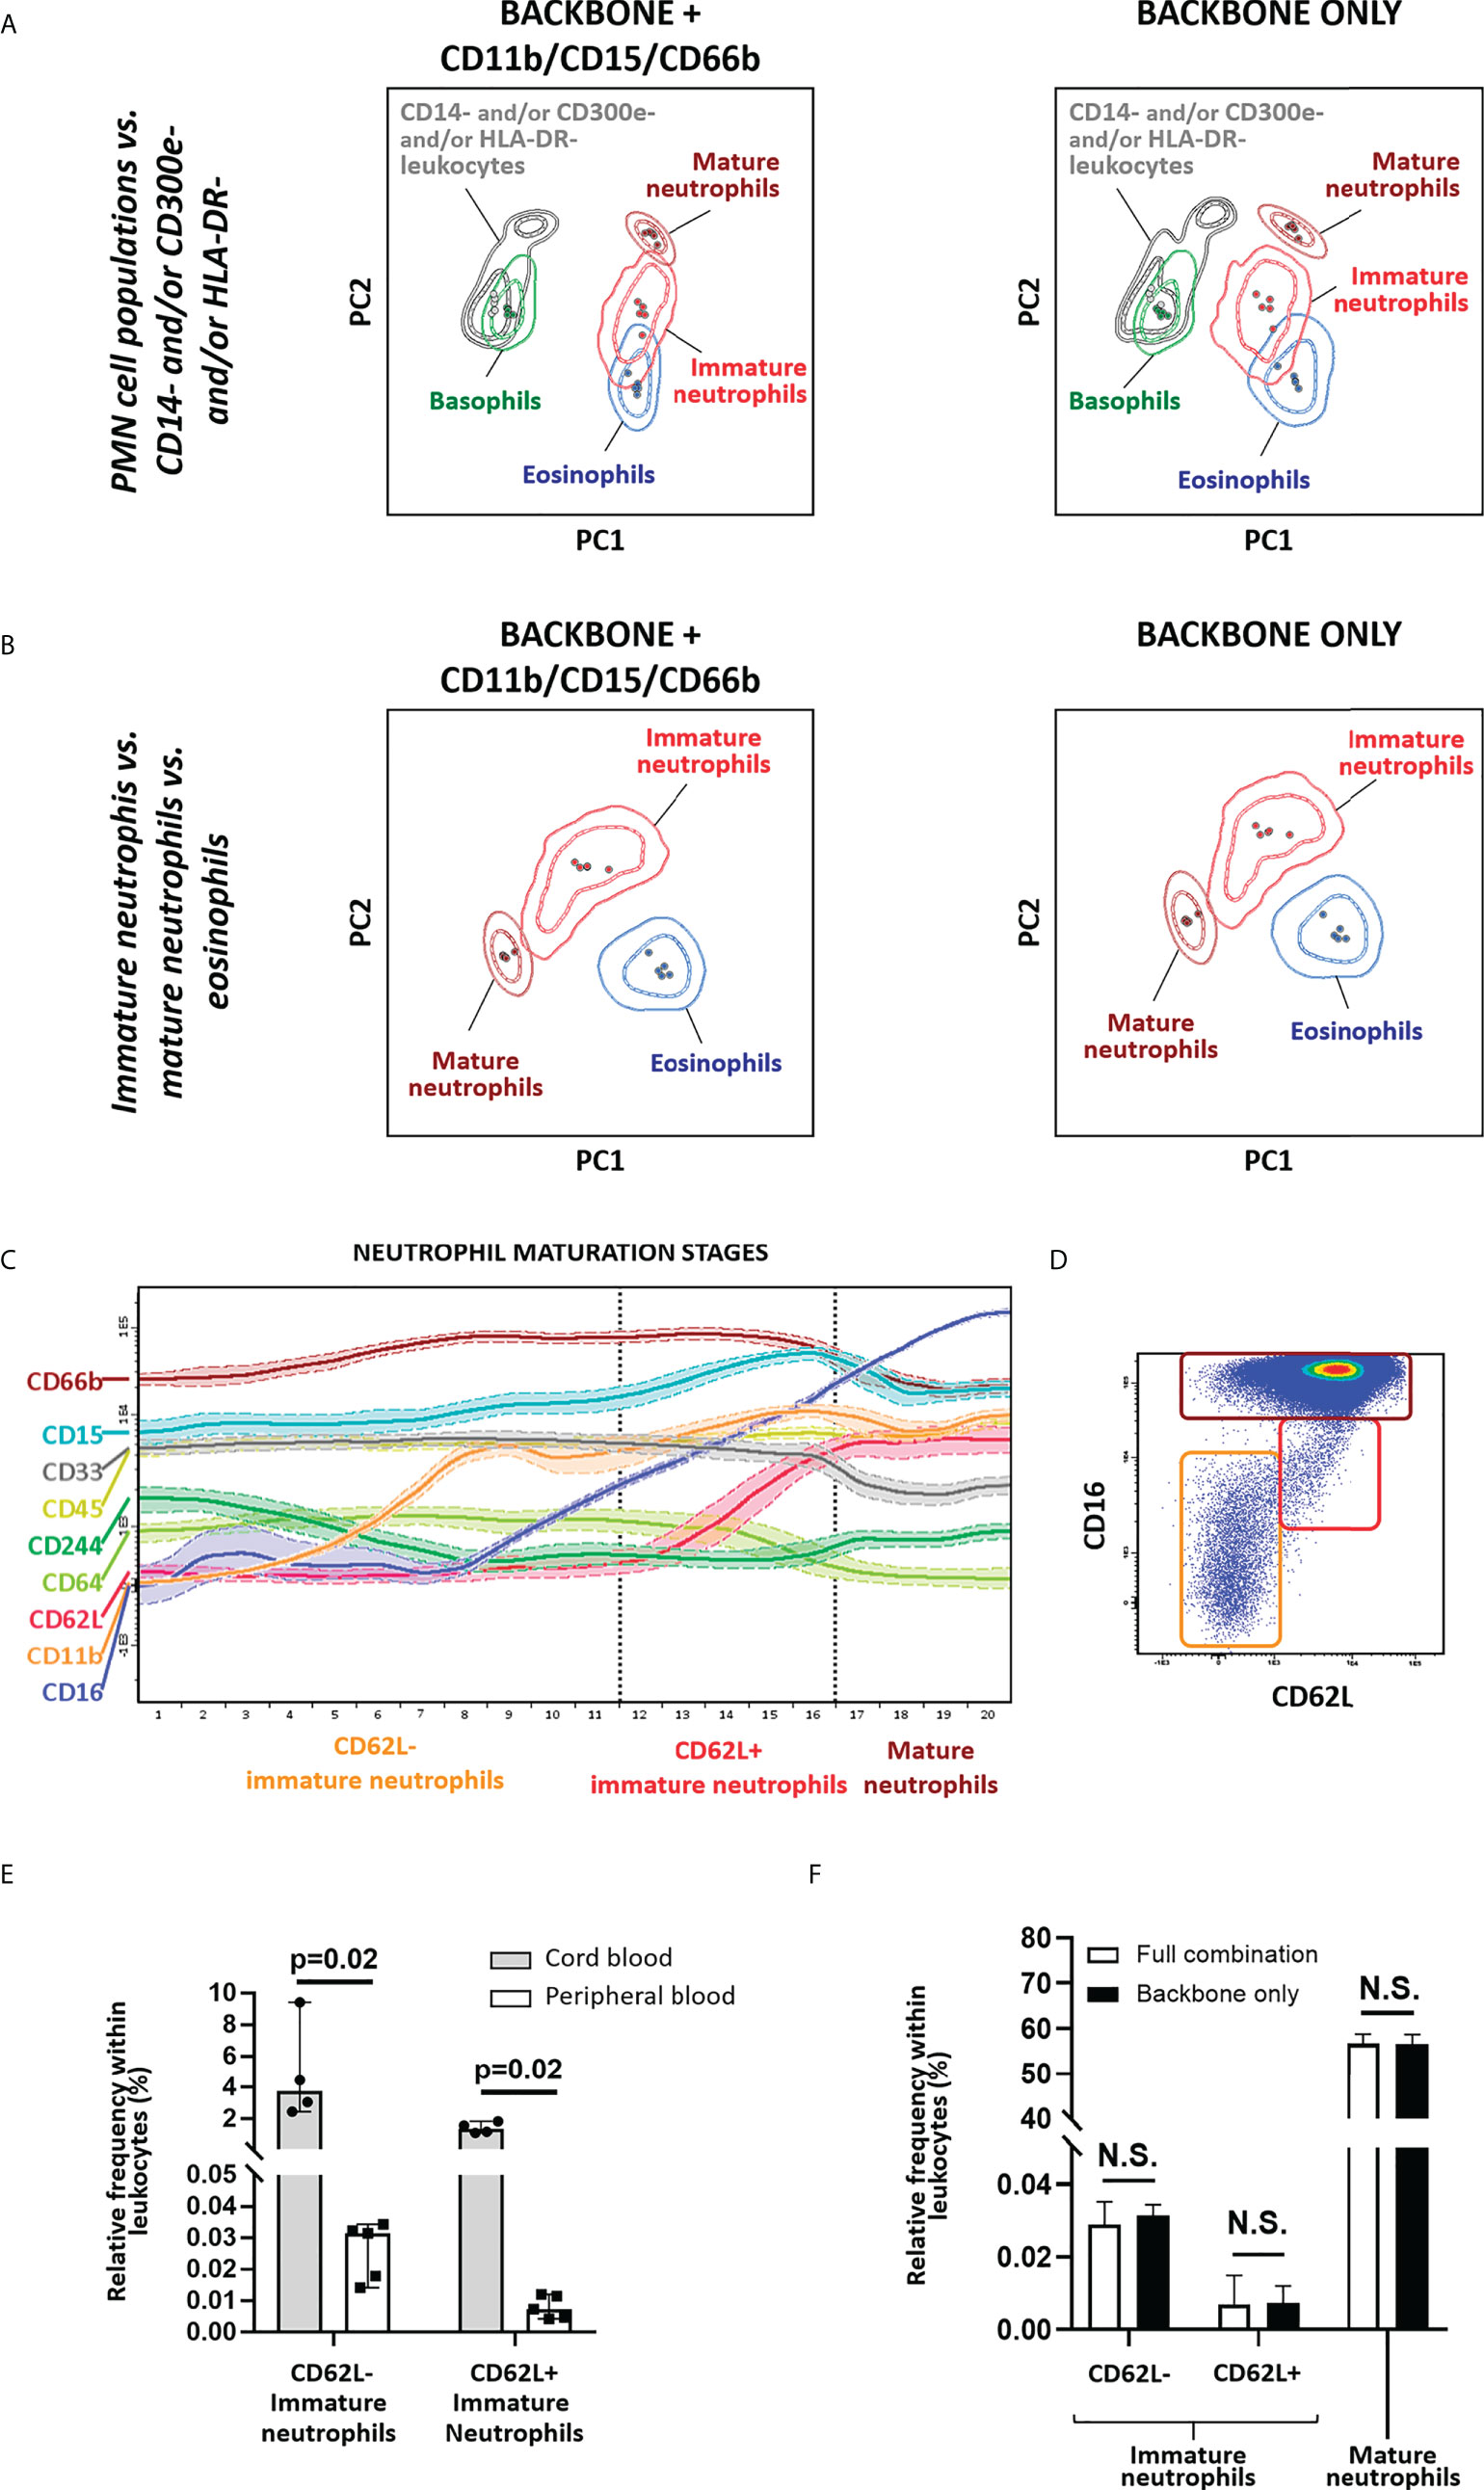
Figure 4 Identification of immature neutrophils. Principal component analysis (PCA) plots depicting the overall performance of backbone markers for general monocytic and dendritic cell identification (CD14, CD16, CD33, CD45, CD62L, CD300e, HLA-DR) in combination with size (FSC) and internal complexity (SSC) vs. same combination plus CD11b, CD15, CD66b, for identification of polymorphonuclear (PMN) cell populations (basophils, eosinophils and neutrophils) (A) and for identification of immature vs. mature neutrophils and eosinophils, within the SSChi cell compartment (B). Wanderlust plot exhibiting the modulation of markers related with neutrophil maturation is depicted in (C), whereas a dot plot depicting the different neutrophil populations identified employing the backbone markers is shown in (D). (E) depicts the relative frequency of immature neutrophils in cord blood (CB) (n=4) vs. adult peripheral blood (PB) (n=5), whereas (F) displays the impact on the relative frequency of the populations with inclusion of CD11b, CD15 and CD66b vs. backbone combination only. Statistical differences were evaluated employing Wilcoxon and Mann-Whitney tests, to compare between gating strategies and CB vs. PB, respectively. Solid circles in the PCA plot represent median values for the parameters evaluated, inner dotted and outer solid lines depict the first standard and second standard deviations for each population identified. Expression in the Wanderlust plot is reported as median fluorescence intensity (solid line) and one standard deviation (dotted line). Bars on graphs depict the median and 95% confidence interval. PMN, polymorphonuclear; PC, principal component. N.S., not statistically significant (p value>0.05).
Selection of markers for identification of monocytic myeloid-derived suppressor cells
Monocytic M-MDSCs have been classically identified as CD14+ CD11b+ (or CD33+) CD15− and HLA-DR−/lo cells (32). This combination relies on the expression of HLA-DR as the discriminating marker vs. cMos, which requires FMO or internal negative controls for accurate identification of this cell population. To specifically identify markers that would allow for an improved identification of M-MDSCs, we evaluated the pattern of expression of monocyte and M-MDSC-related markers on cMos vs. CD14+ HLA-DR-/lo cells from CB and/or adult PB samples (Supplementary Figure 6A). Our results confirmed the absence of CD15 together with expression of CD11b on CD14+ HLA-DR-/lo M-MDSCs, and showed significant (p=0.03) up-regulation of CD16 and down-regulation of CD123 and CD192 on CD14+/HLA-DR-/lo cells vs. cMos (Supplementary Figures 6B, C). PCA revealed that only CD16, HLA-DR and CD192 had significant (independent) impact on the discrimination between the two populations (Supplementary Figure 6D), with addition of CD123 having negligible value for identification and quantification of the population (Supplementary Figure 6E). When comparing the frequency of M-MDSC in CB vs. adult PB, defined based on a CD14+ HLA-DR-/lo or CD14+ HLA-DR-/lo CD192-/lo phenotype, lower frequencies were overall observed with the latter, more stringent, criteria (Supplementary Figure 6F). Importantly, statistically significantly higher frequencies of M-MDSCs in CB vs. adult PB were only observed when the CD14+ HLA-DR-/lo CD192-/lo criteria was used (Supplementary Figure 6F), suggesting that the addition of CD192 could allow for a more accurate identification of M-MDSCs.
Comparison of the performance of versions 3 and 4 of the EuroFlow IMC tubes
As described above, two different versions of EuroFlow IMC antibody combinations were designed, which included a more restricted 11-color combination (version 3, Table 1) suitable for in vitro diagnostics (CE-IVD)-certified instruments (e.g., BD FACSLyric™ flow cytometer), and an extended 14-color version (version 4, Table 1) for additional identification of other minor (and less frequently reported) populations, such as HPCs, M-MDSCs, preDCs, and further subsetting of CD1c+ CD14- myDCs into their CD5- and CD5+ subsets (Figure 5 and Supplementary Figure 7). Both versions of the EuroFlow IMC tube allow for the identification of 5 subsets of granulocytes (basophils, eosinophils, mature neutrophils, immature neutrophils CD62L- and CD62L+), 9 populations of monocytes (4 subpopulations of cMos defined based on CD62L+ FcϵRI+, CD62L+ FcϵRI-, CD62L- FcϵRI- and CD62L- FcϵRI+ expression patterns, iMo and 4 subsets of ncMos identified as CD36+ Slan+, CD36+ Slan-, CD36- Slan- and CD36- Slan+) and 5 populations of DC (CD1c+ CD14lo, CD1c+ CD14- and CD141+ myDCs, pDCs and Axl+ DCs) (Figure 5; Supplementary Figure 7 and Supplementary Table 4).
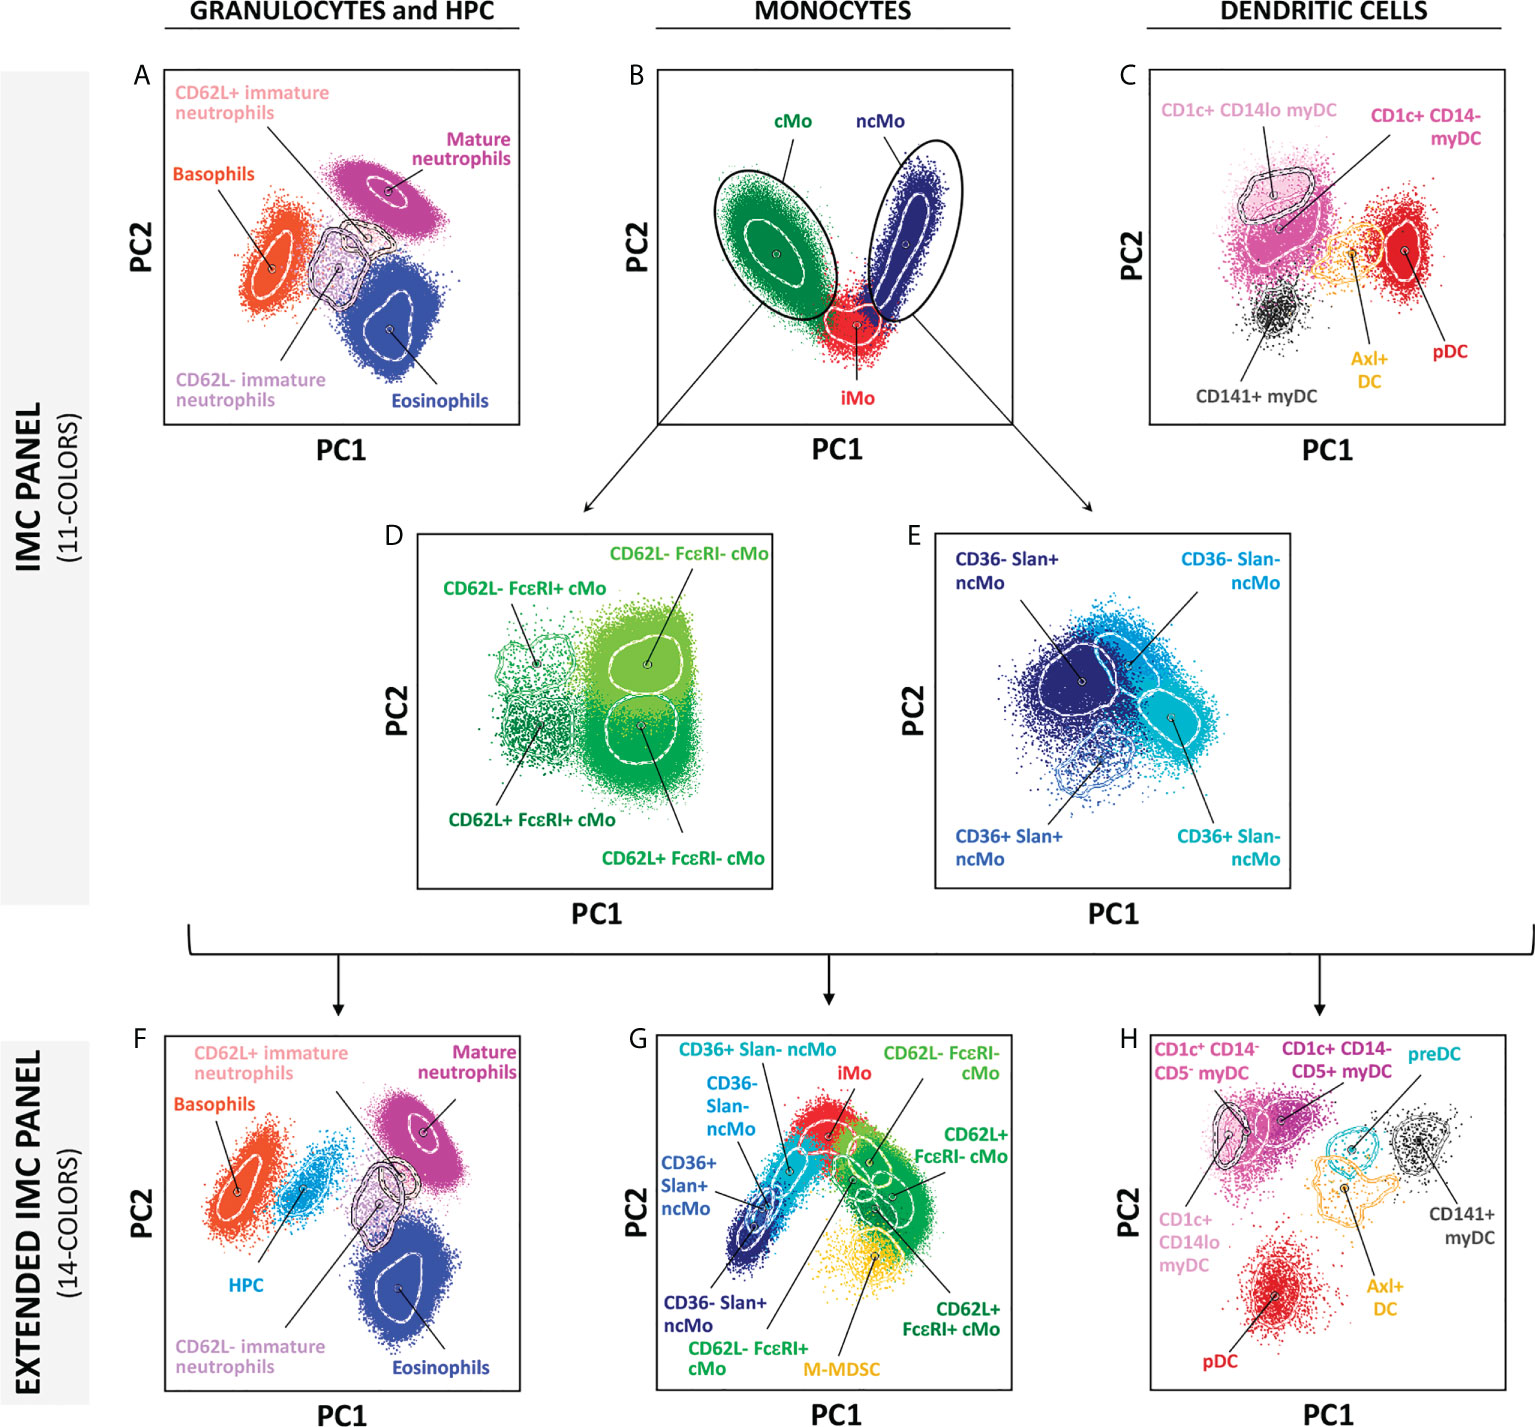
Figure 5 Multidimensional representation (principal component analysis – PCA) of the cell populations identified in one representative adult blood sample, employing the two versions of the innate myeloid cell panel. (A–E) show the 19 populations identified using version 3 (11-colors) antibody combination, whereas (F–H) depict the 23 populations identified in the extended version of the panel (version 4; 14-colors). Solid circles represent median values for the parameters evaluated, inner dotted lines depict the first standard deviations for each population identified. PC, principal component; cMo, classical monocytes; iMo, intermediate monocytes; ncMo, non-classical monocytes; myDC, myeloid dendritic cells; pDC, plasmacytoid dendritic cells; M-MDSC, monocytic-myeloid derived suppressor cells; HPC, hematopoietic precursor cells; preDC, CD100+ dendritic cell precursors.
Impact of the anticoagulant, delayed sample preparation and freezing on identification of IMC populations
Since the performance of the EuroFlow IMC tube was evaluated on PB collected in EDTA and, in some settings, sodium heparin (e.g., for functional assays) is required, which might affect the staining patterns and quantification of IMC populations (66), staining of samples collected with EDTA vs. sodium heparin was compared. Except for CD300e that showed lower expression on monocytes from heparin samples (median stain index reduction in heparin vs. EDTA of 38.4%; range: 14.2%-71.1%; p=0.02), no significant differences were observed in the stain index of individual markers between samples collected with these two anticoagulants (data not shown). However, despite the lower CD300e expression on heparin-anticoagulated samples, multivariate PCA analyses revealed no significant impact on the overall discrimination of the distinct populations of IMCs (Figure 6A). Likewise, no significant differences were observed on the absolute counts of the populations between the two anticoagulants with exception of a lower absolute count of CD1c+ CD14lo myDC observed in heparin samples (p=0.02) (Figures 6B–V).
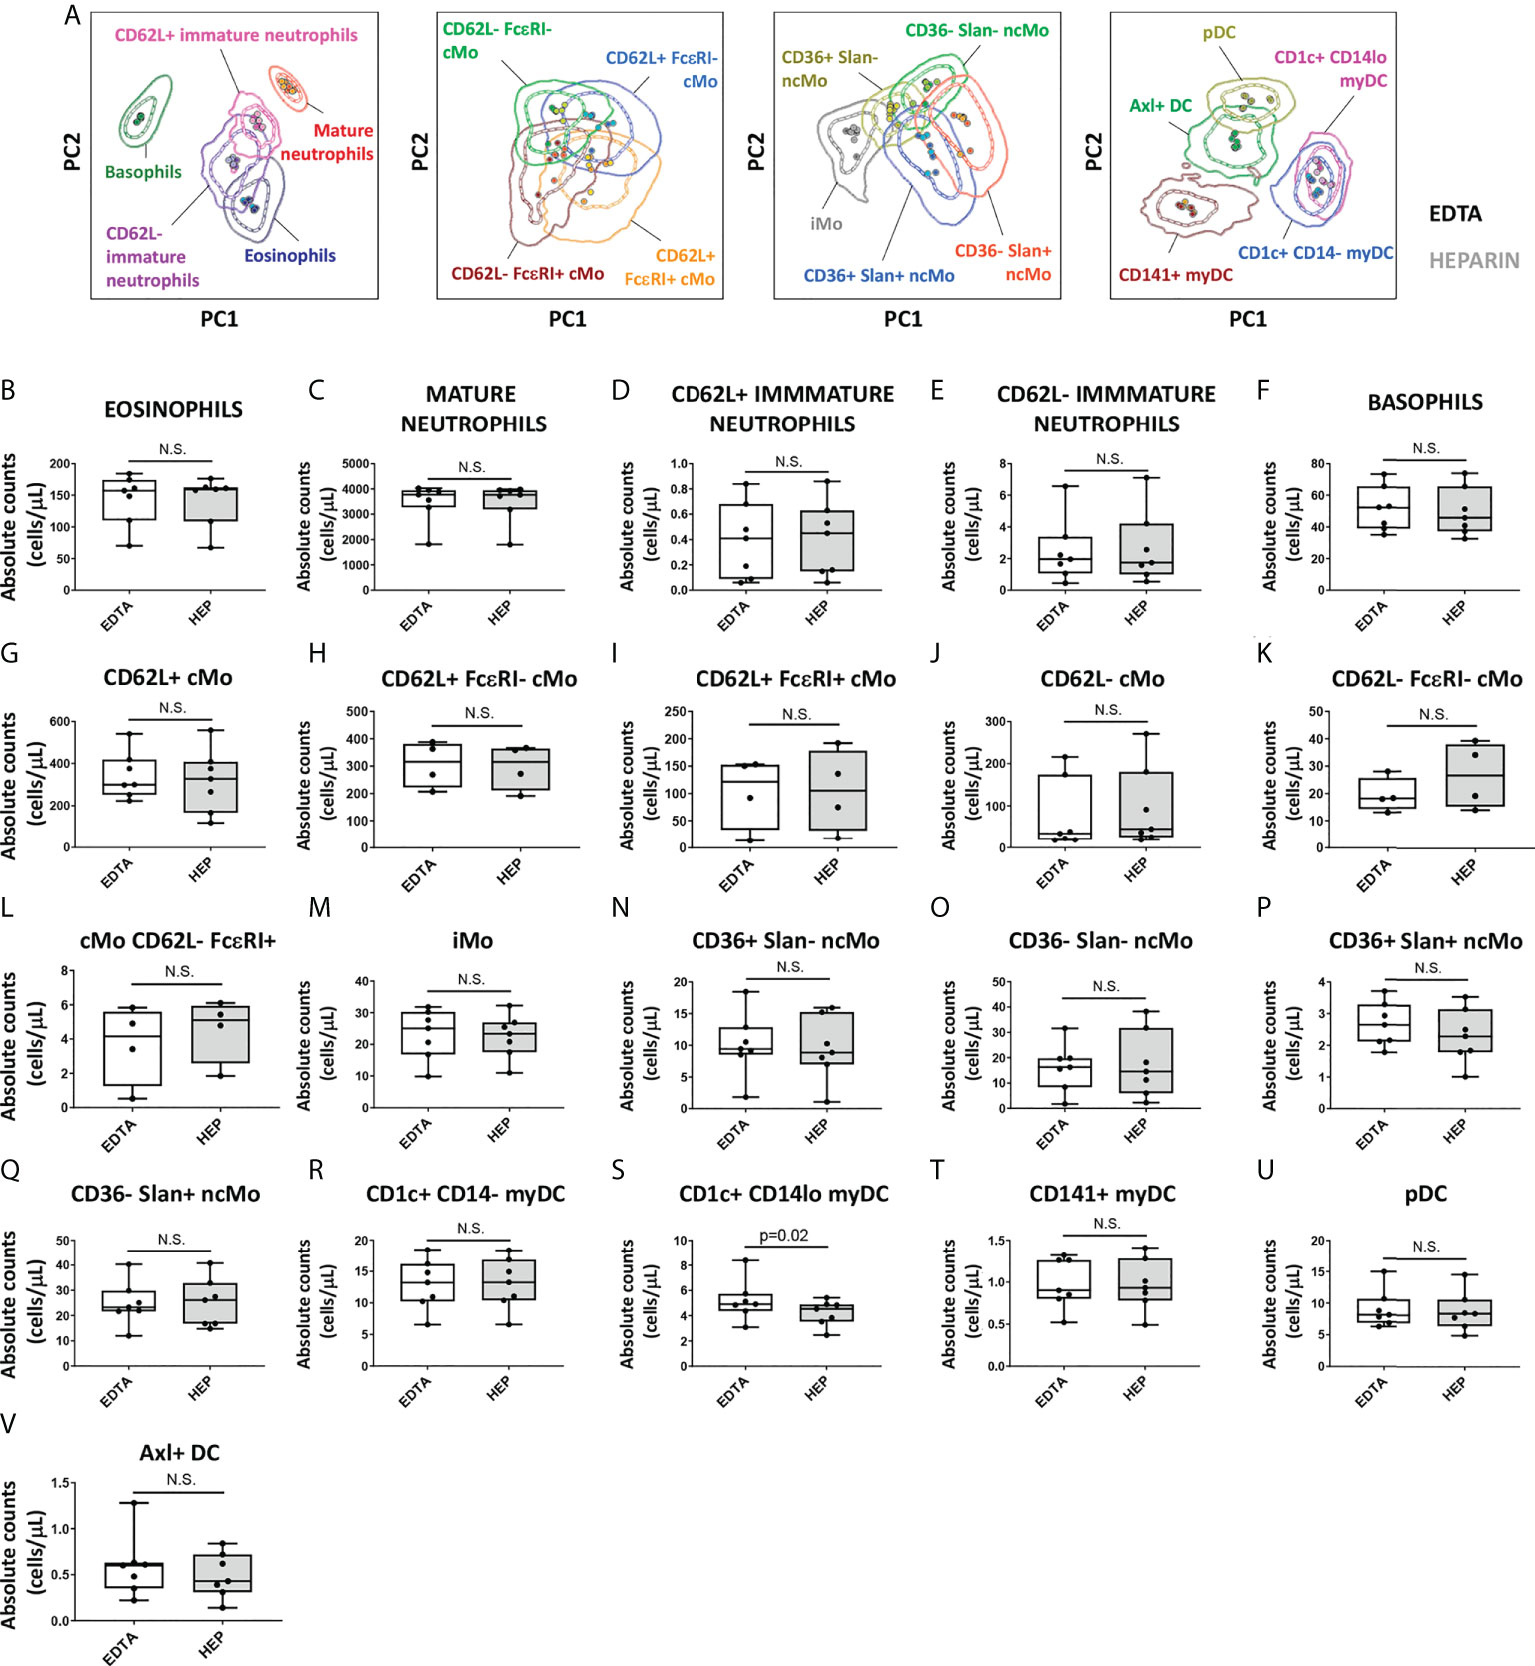
Figure 6 Impact of the anticoagulant on the staining patterns and IMC population (absolute) counts in blood. Peripheral blood samples (n=7) were collected into K3 ethylenediaminetetraacetic acid (EDTA) and sodium heparin (HEP) tubes and stained with versions 2 (n=3) and 3 (n=4) of the EuroFlow immunemonitoring innate myeloid tube. (A) depicts principal component analysis (PCA) plots comparing the staining patterns for the populations identified in samples collected in EDTA vs. HEP (version 3; n=4). (B-V) show the impact of the anticoagulant used for sample collection on the absolute counts of the different IMC populations identified using the EuroFlow innate myeloid cell tube. Statistical differences were evaluated empoying the Wilcoxon test. Solid circles in all PCA plots represent median values for the parameters evaluated in each sample, inner dotted and outer solid lines depict the first standard and second standard deviations for each population identified in the EDTA-anticoagulated samples. cMo, classical monocytes; iMo, intermediate monocytes; ncMo, non-classical monocytes; pDC, plasmacytoid dendritic cells; myDC, myeloid dendritic cells; PC, principal component; EDTA, ethylenediaminetetraacetic acid; HEP, sodium heparin. N.S., not statistically significant (p value>0.05).
Regarding immediate vs. delayed sample preparation and staining for 6h, 12h and 24h with the EuroFlow IMC tube, similar stain index values were observed for all markers evaluated (data not shown), except for CD16 (median decrease in stain index of 25.3%, 38.5% and 41.9%, respectively) and Slan (median decrease in stain index of 43.2%, 5.4% and 8.1%, respectively), also confirmed by PCA analyses, as all populations evaluated for all timepoints tested clustered within one standard deviation of the 0h staining pattern (Figure 7A). Despite no significant impact was detected on the overall discrimination among the different cell populations up to 24h after sample collection, delayed sample preparation was associated with differences vs. 0h >10% for 62.5% (15/24) of the populations evaluated (Figures 7B–Y). More specifically, one population (4.2%; 1/24) displayed highly variable distribution across the timepoints tested (i.e., cell doublets) (Figure 7C), while 33.3% (8/24) and 25% (6/24) of IMC populations showed altered cell counts at >6h and >12h, respectively. Of note, quantification of CD62L- cMo populations was more strongly affected than CD62L+ cMo, leading to underestimation of the frequency of the former cMo populations (Figures 7M, N). Similarly, CD36- ncMo populations, eosinophils and CD62L+ immature neutrophils displayed decreased numbers (vs. 0h) when sample preparation was delayed for >12h (Figures 7E, G, R, T). Conversely, overestimation of iMos, was observed at all timepoints tested (Figure 7O). While pDCs and CD1c+ CD14- myDC remained stable up to 24h, delayed sample preparation was generally associated with an overestimation of (minor) DC populations (Figures 7V, W, Y).
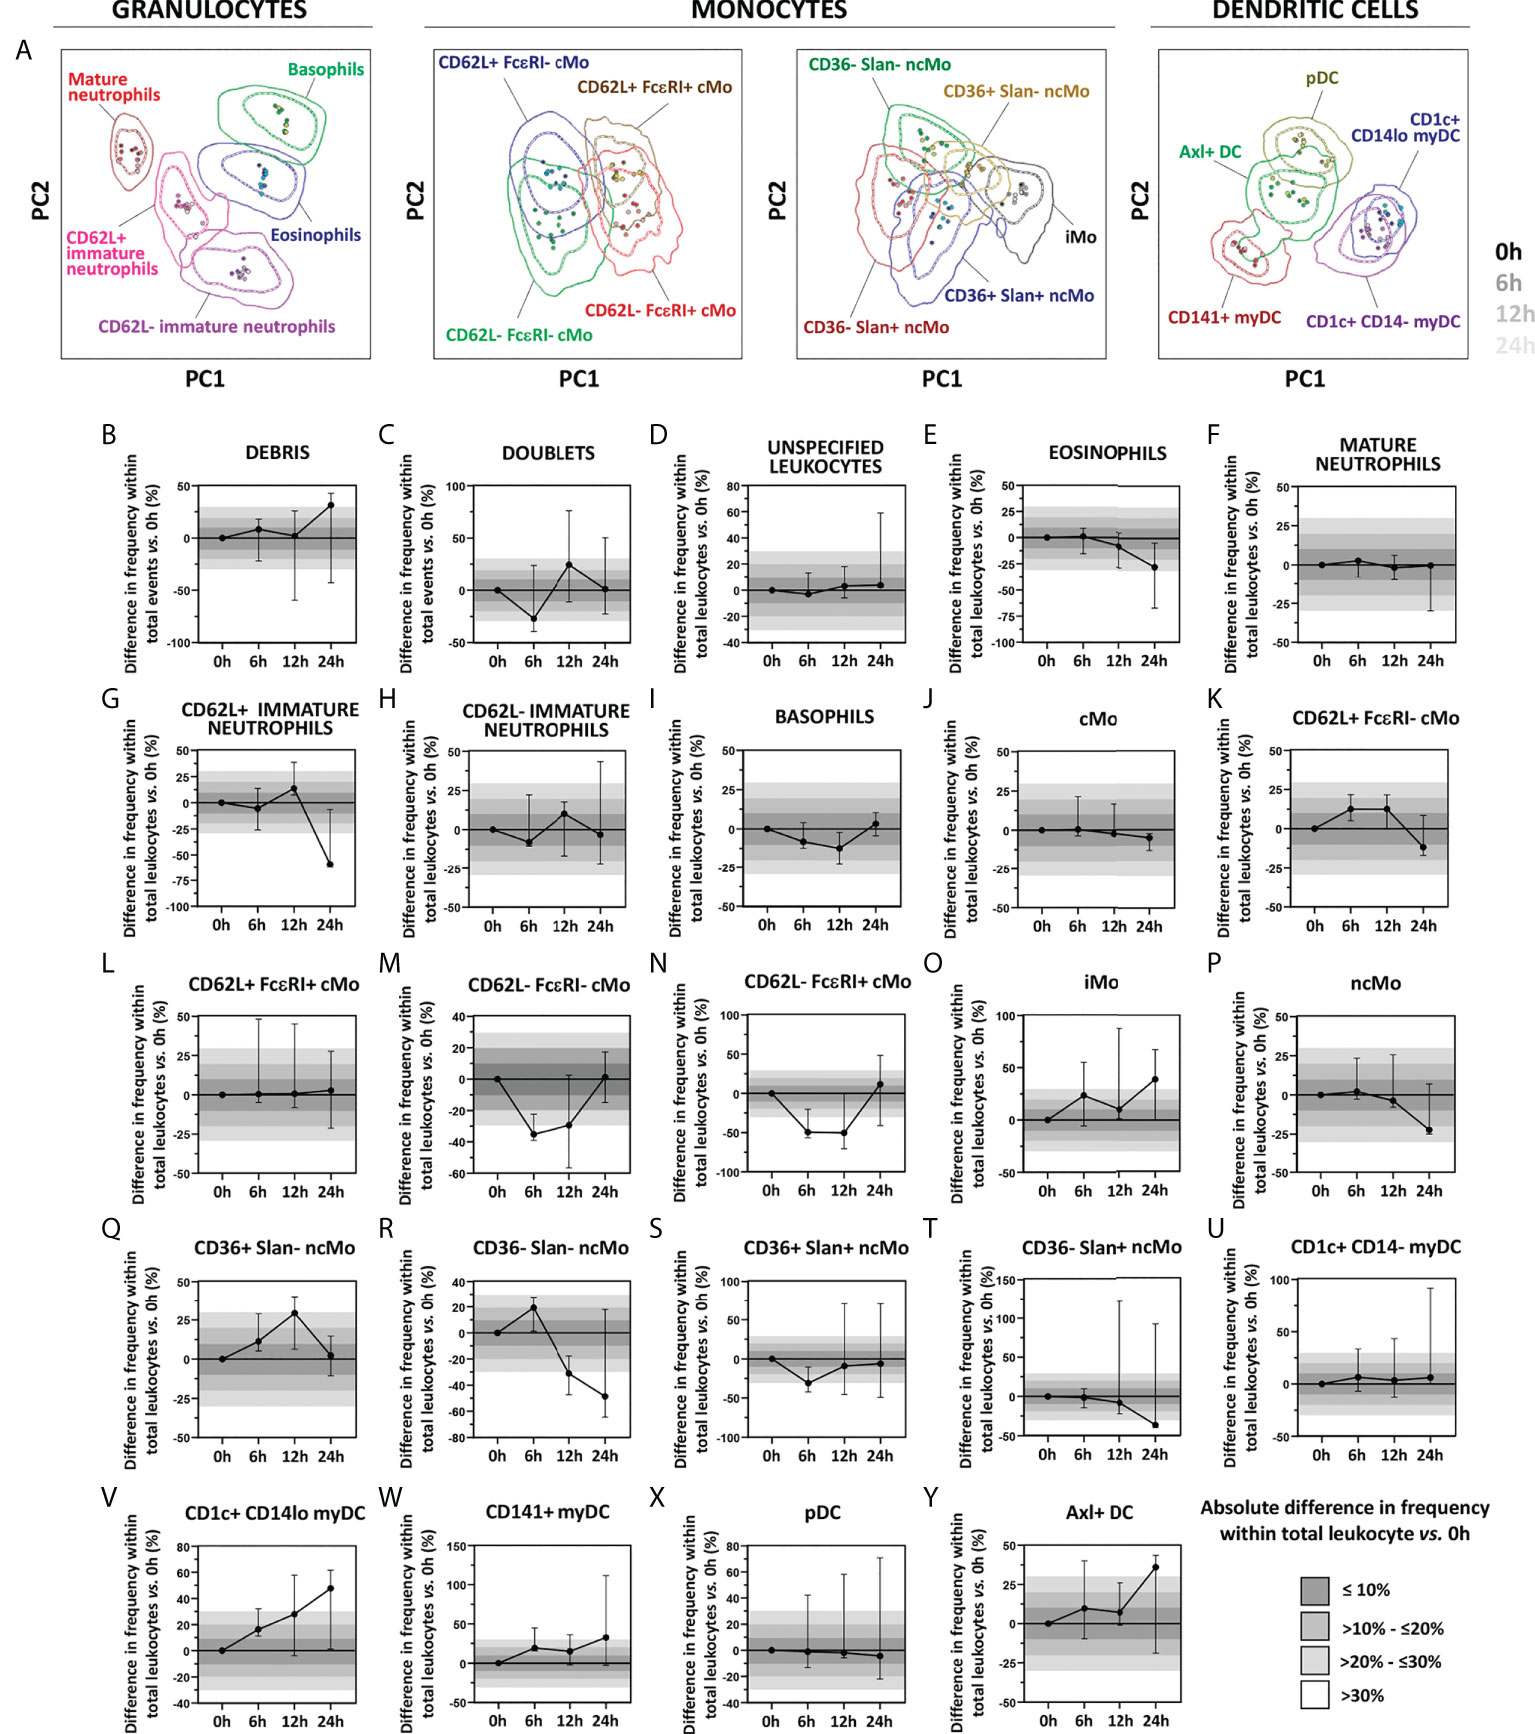
Figure 7 Impact of delayed sample processing on the overall performance of the innate myeloid panel for population identification and quantification of innate myeloid cell (IMC) populations in blood. Principal component analysis (PCA) plots reflecting the impact of sample storage (6h, 12h and 24h, shown as different shades of the population color) on the immunophenotypic patterns vs. samples processed immediately upon collection (0h) are depicted in Panel A. Differences in frequency of the IMC populations detected with version 3 of the innate myeloid cell tube as a result of delayed processing vs. freshly stained samples are shown in Panels B–Y. Absolute differences vs. 0h staining are depicted with bars of different shades of grey. Solid circles in all PCA plots represent median values for the parameters evaluated in each sample, inner dotted and outer solid lines depict the first standard and second standard deviations for each population identified in 0h condition. Data in the timecourse plot is reported as median and 95% confidence interval. cMo, classical monocytes; iMo, intermediate monocytes; ncMo, non-classical monocytes; pDC, plasmacytoid dendritic cells; myDC, myeloid dendritic cells; PC, principal component.
Analysis of paired freshly processed vs. frozen PB mononuclear cells (PBMCs) revealed that, despite freezing induced a significant (>15%) reduction in the MFI of PRP for Slan (-24.8% ± 5.7%), CD192 (-28.4% ± 3.9%), CD5 (-33.0% ± 5.0%) and CD62L (-52.2% ± 10.1%), with the exception of immature neutrophils, which could not be detected in frozen samples, all IMC populations could be identified in both conditions (Supplementary Figure 8). Furthermore, the freezing process had a significant impact on the relative frequency of several populations, leading to e.g., overestimation of DCs, CD62L- vs. CD62L+ cMos and CD36+ vs. CD36- ncMos (Supplementary Figure 8).
Technical performance of the EuroFlow IMC tubes: intra-assay variability, reproducibility in different flow cytometer platforms and multicentric applicability
To determine the assay reproducibility, duplicates of the same EDTA-anticoagulated PB samples (n=5) were stained and measured in the same instrument and analyzed manually by an expert cytometrist. Overall, an average intra-assay %CV of 5.0% ± 4.5% was observed across the 26 populations evaluated, with 80.8% (21/26) of the populations displaying an intra-assay %CV <10% and only CD36- Slan- ncMo exhibiting a median intra-assay %CV >15% (Supplementary Table 5).
Comparison of the performance of the EuroFlow IMC tube between different instruments with distinct detector/optical configurations (conventional vs. spectral, and 3- vs. 4-laser flow cytometers) was evaluated. Overall, a significant correlation (R2>0.90; p<0.05) was observed for virtually all (92%; 23/25) IMC populations identified, with no significant differences and a limited bias (absolute mean normalized bias <15%) being detected between instruments. The only exceptions were CD62L+ FcεRI+ cMos and CD36+ Slan+ ncMos which were overestimated (bias: +17.5%) and underestimated (bias: -32%) in the data files generated in the Aurora vs. Fortessa X20 instruments, respectively (Table 2).
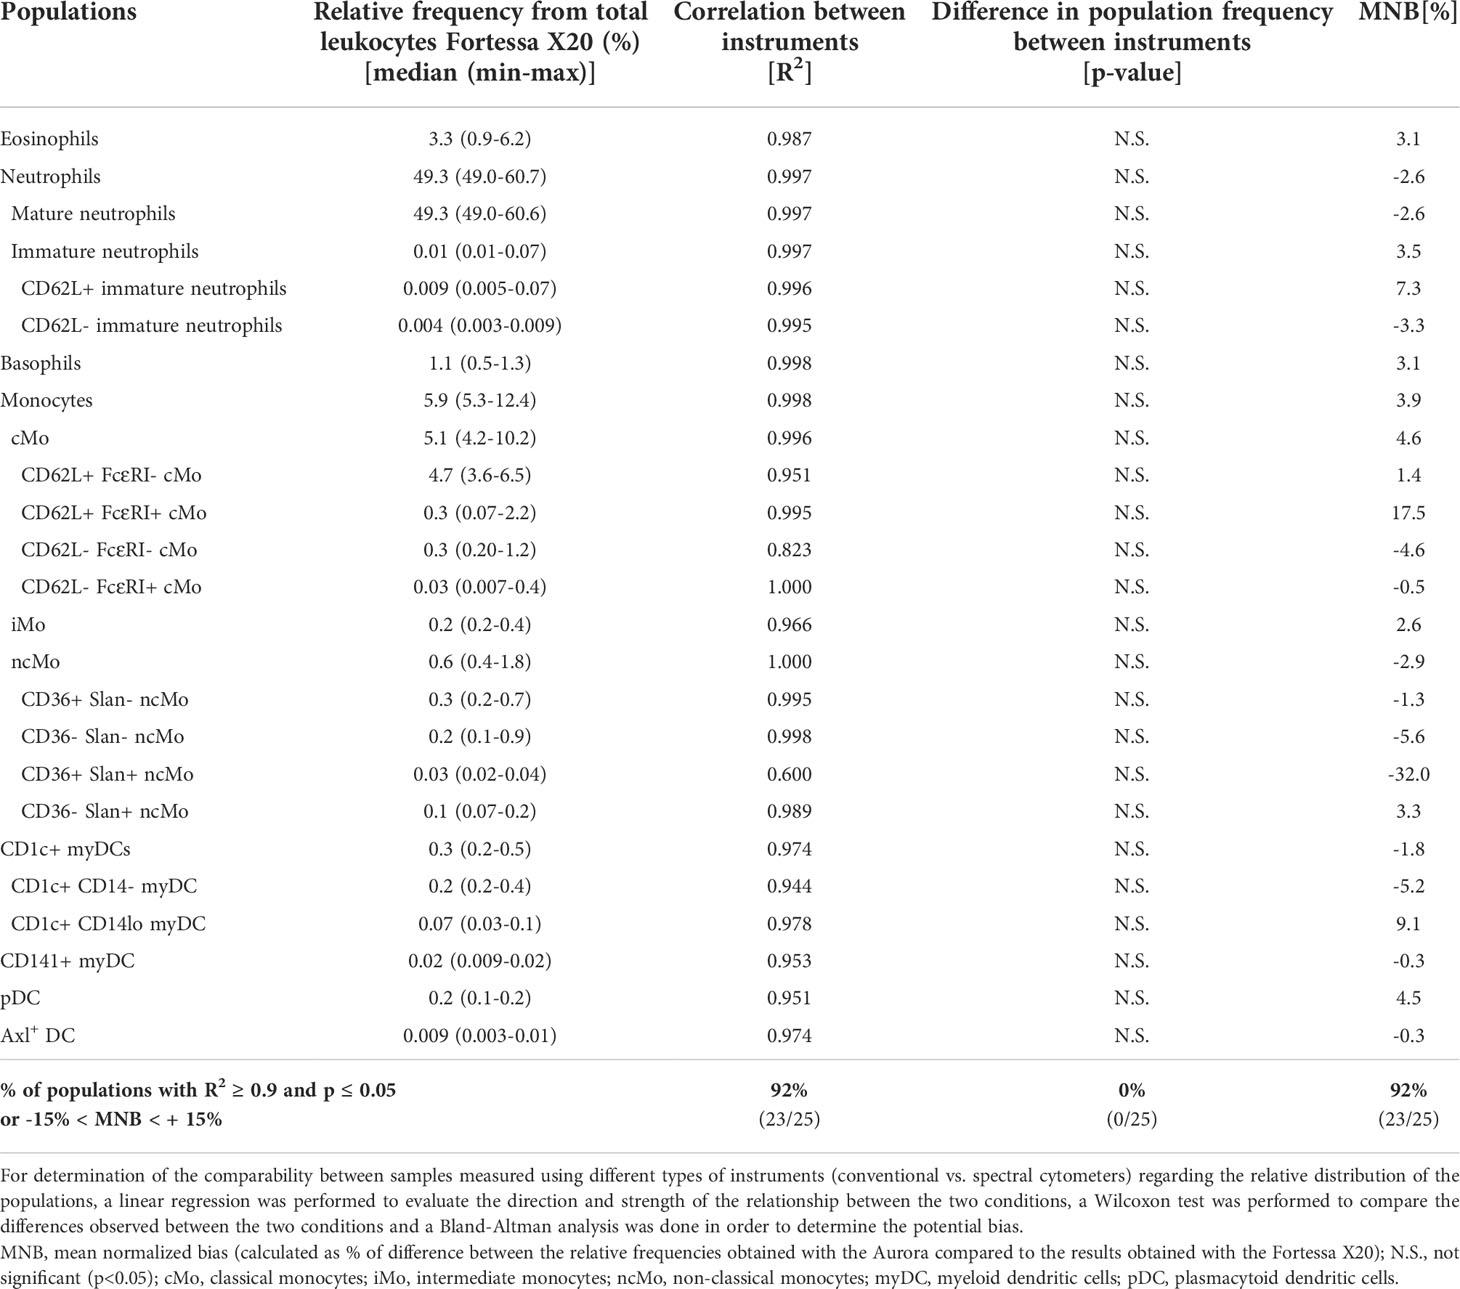
Table 2 Comparative evaluation of the relative frequency of the innate myeloid cell (IMC) (sub)populations identified with the 14-color version (version 4) of the EuroFlow Innate Myeloid Cell tube in paired samples measured employing two different instruments [Fortessa X20 (BD Biosciences) and Aurora (Cytek)] (n=5).
To further evaluate the feasibility of using the EuroFlow IMC tube in multicentric settings, 21 samples were locally collected, processed, and measured at 4 distinct facilities (LUMC, USAL, RIVM and UTU) using 5 distinct instruments. PCA revealed fully comparable and reproducible results for all centers/instruments (Figure 8A). Furthermore, when comparing the assay %CV for MFI values of predefined positive reference IMC populations (PRP) for the different markers evaluated, the inter-center assay %CV was within the range of the observed biological variability (i.e., intra-assay %CV) within individual centers (Figure 8B) (median assay %CV and range of 33.8% [13.9% - 60.3%] vs. 30.7% [1.2% – 90.4%], respectively).
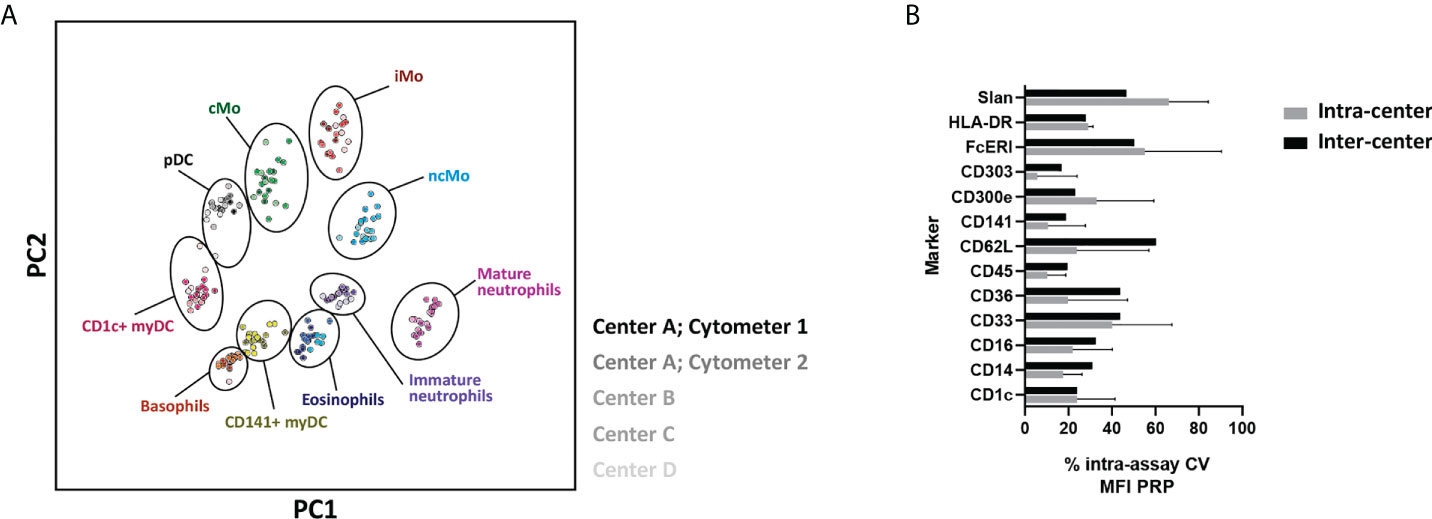
Figure 8 Performance of the EuroFlow immunemonitoring innate myeloid cell (IMC) tube in a multicentric setting. (A) Principal component analysis (PCA) plot depicting the staining profile of 21 healthy adult peripheral blood samples processed at 4 centers and measured in 5 different instruments, employing the 11-color version (version 3) of the EuroFlow innate myeloid cell tube. Solid circles, represent the median values of the populations and the shades of color represent different centers and/or instruments. (B) depicts the intra-assay % of coefficient of variation for individual markers within centers (intra-center; biological variation) and between centers (inter-center, technical variation). cMo, classical monocytes; iMo, intermediate monocytes; ncMo, non-classical monocytes; pDC, plasmacytoid dendritic cells; myDC, myeloid dendritic cells; PC, principal component; CV, coefficient of variation; MFI PRP, Median Fluorescence Intensity of Positive Reference Population.
Reproducibility of expert-based manual analysis
Reproducibility of expert-based manual analysis of the EuroFlow IMC tube was evaluated by experienced (E1) and novice (E2) analysts in 6 ,FCS files, stained with version 3 (Table 1) of the combination. Overall, a good correlation (R2>0.90; p-value <0.05) with a limited bias - absolute mean normalized bias (MNB) <15% - in population counts was observed between the experts (71.4%; 20/28) (Table 3). However, a lower correlation and degree of agreement were observed for populations identified based on a limited number of heterogeneously expressed markers (e.g., cMo populations defined based on CD62L and FcεRI expression and ncMo populations, defined based on expression of CD36 and Slan) and infrequent (<0.05% of total leukocytes) IMC populations (e.g., Axl+ DCs). To establish the intra-operator variability, expert E1 repeated the analysis of the files with a ≥2-month interval. Of note, even though the overall degree of correlation increased compared to expert E1 vs. E2 (significant correlation of 78.6%; 22/28 vs. 71.4%; 20/28) and agreement (absolute MNB <15% of 82.1%; 23/28 vs. 71.4%; 20/28), the same patterns for populations with lower degree of agreement (i.e., population defined based on limited and heterogeneous markers and infrequent subsets), were observed (Table 3 and Supplementary Table 6).
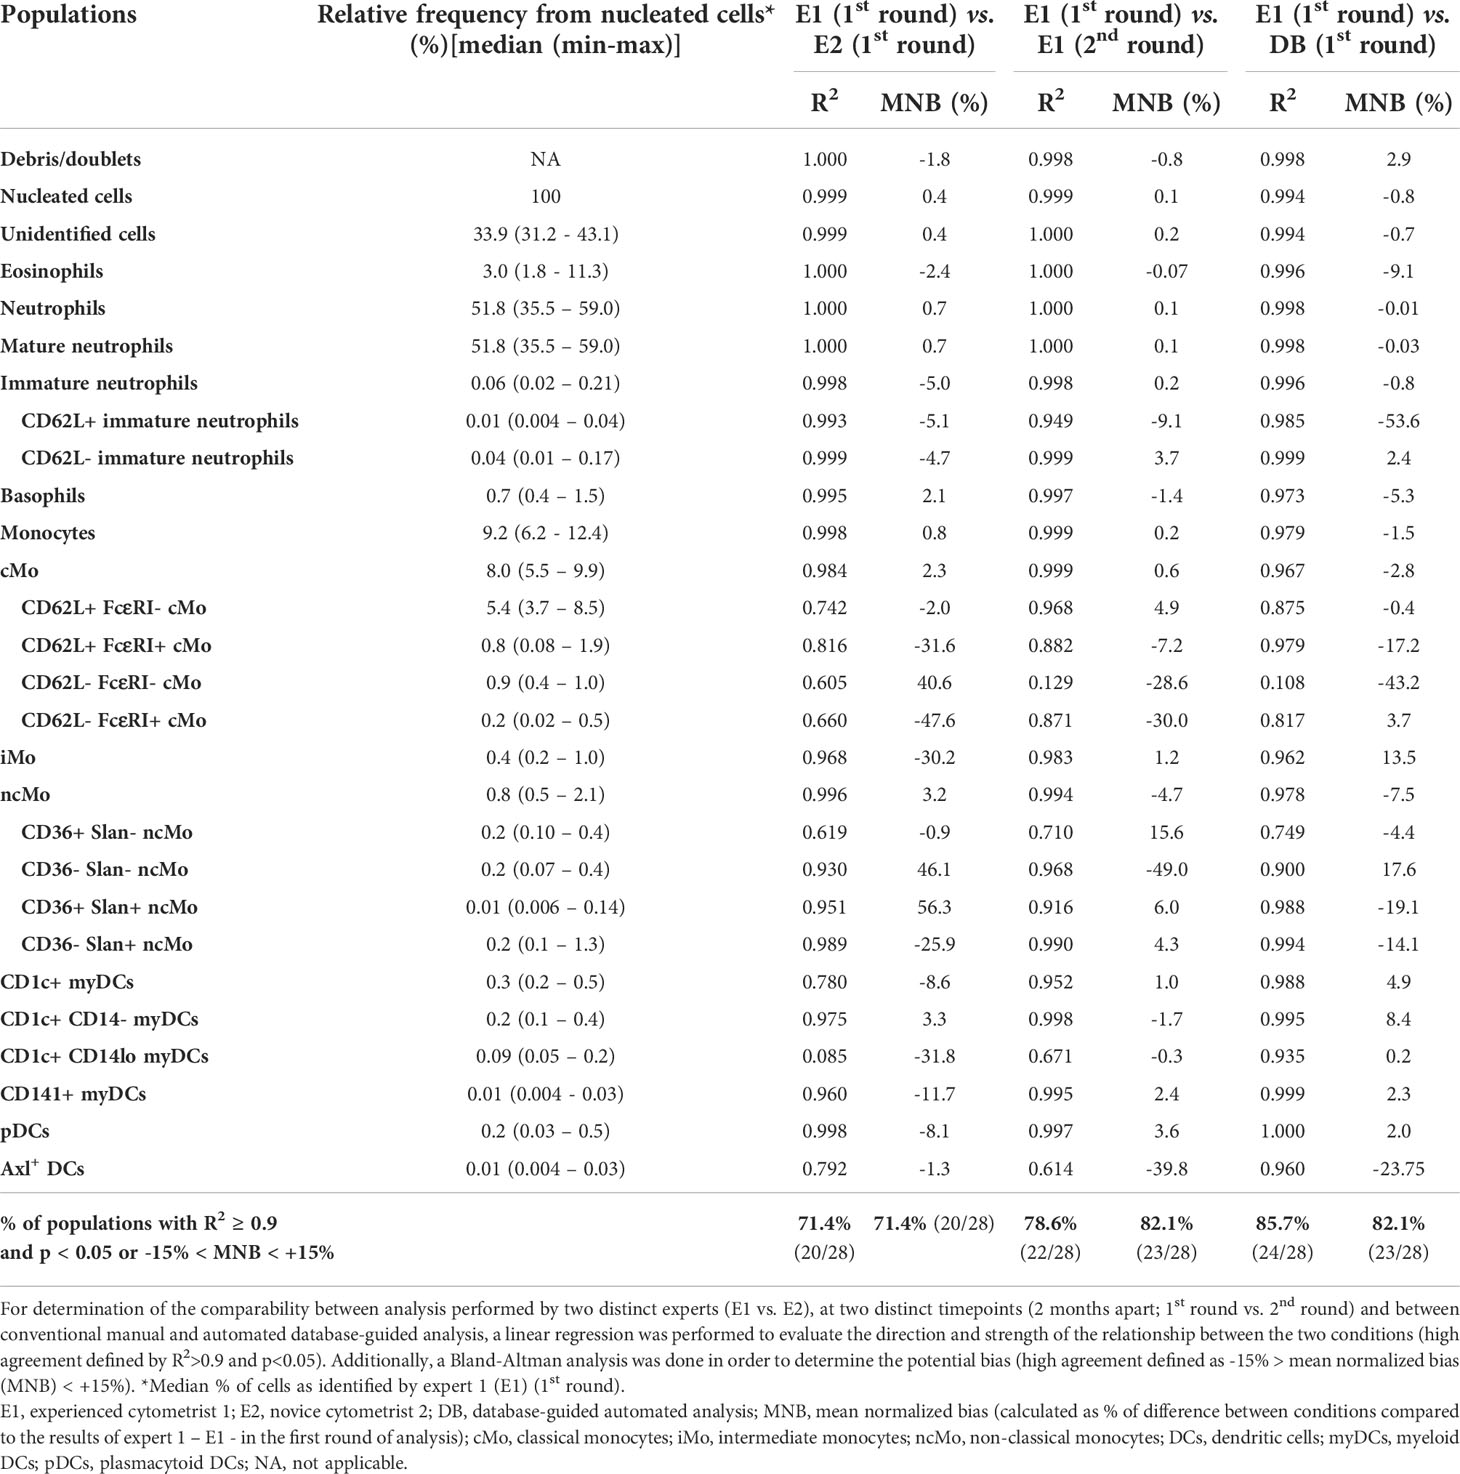
Table 3 Reproducibility of manual analysis and automated database-guided analysis for the identification of all innate myeloid cell (IMC) and non-IMC populations (n=28) in EDTA-anticoagulated peripheral blood samples (n=6) stained with version 3 of the EuroFlow IMC tube.
Database construction and automated data analysis
Comparison of manual expert-based vs. database-guided automated gating showed a better degree of correlation (85.7%; 24/28) and agreement (82.1%; 23/28), compared to intra- and inter-operator manual analysis (Table 3), with an improved identification of some IMC populations defined based on the expression of heterogeneous markers (i.e., most of the ncMo subsets). Despite this, low correlation and/or degree of agreement was still observed for cMo subsets, defined based on the expression of CD62L and FcεRI, and IMC populations present at low frequency (<0.05%) such as Axl+ DC or CD62L+ immature neutrophils. Of note, database-guided automated gating and identification (AGI) performed at two different timepoints displayed a 100% correlation and degree of agreement for the 28 (IMC and non-IMC) populations tested, which clearly improves reproducibility compared to both intra- and inter-operator manual analysis.
Age-related distribution of IMC populations in PB of HD
Overall, no significant age-related kinetics were observed for basophils, CD36+ Slan- ncMo, CD141+ myDCs, HPC, M-MDSC and preDCs (Figure 9). In contrast, eosinophils and CD1c+ CD14lo myDCs displayed decreased absolute counts in PB with age (Figures 9A, R), and CD36- Slan+ ncMo tended to increase with ageing (Figure 9N). In turn, several IMC populations exhibited unique profiles around adolescence (10-17y), with CD62L+ FcεRI+ cMos, pDCs, Axl+ DCs and peaking in this age group (Figures 9G, T, U, respectively). Mature neutrophils, iMos and some populations of ncMos (CD36- Slan- and CD36+ Slan+ncMos) showed reduced numbers until the age of 10-17y with a rise again in young adults (18-39y) and stable numbers thereafter (Figures 9B, J, L), except for CD36+ Slan+ ncMos (Figure 9M) which decreased in the latter age group and CD62L- FcεRI- cMos (Figure 9H) which further increased in older adults (>55y). Conversely, CD62L+ FcεRI- cMos peaked in young adults (18-39y), while they were reduced in older individuals (>55y) (Figure 9F), whereas CD1c+ CD14- myDCs showed a decrease until 18-39y and remained stable thereafter (Figure 9O). Interestingly, both immature neutrophil populations (CD62L- and CD62L+) displayed similar kinetics, peaking in middle aged adults (40-55y) and declining in older adults (>55y) (Figures 9C, D). Conversely, CD62L- FcεRI+ cMos exhibited a decrease in absolute counts until the age of 40-55y, followed by a slight rise in older adults (Figure 9I).
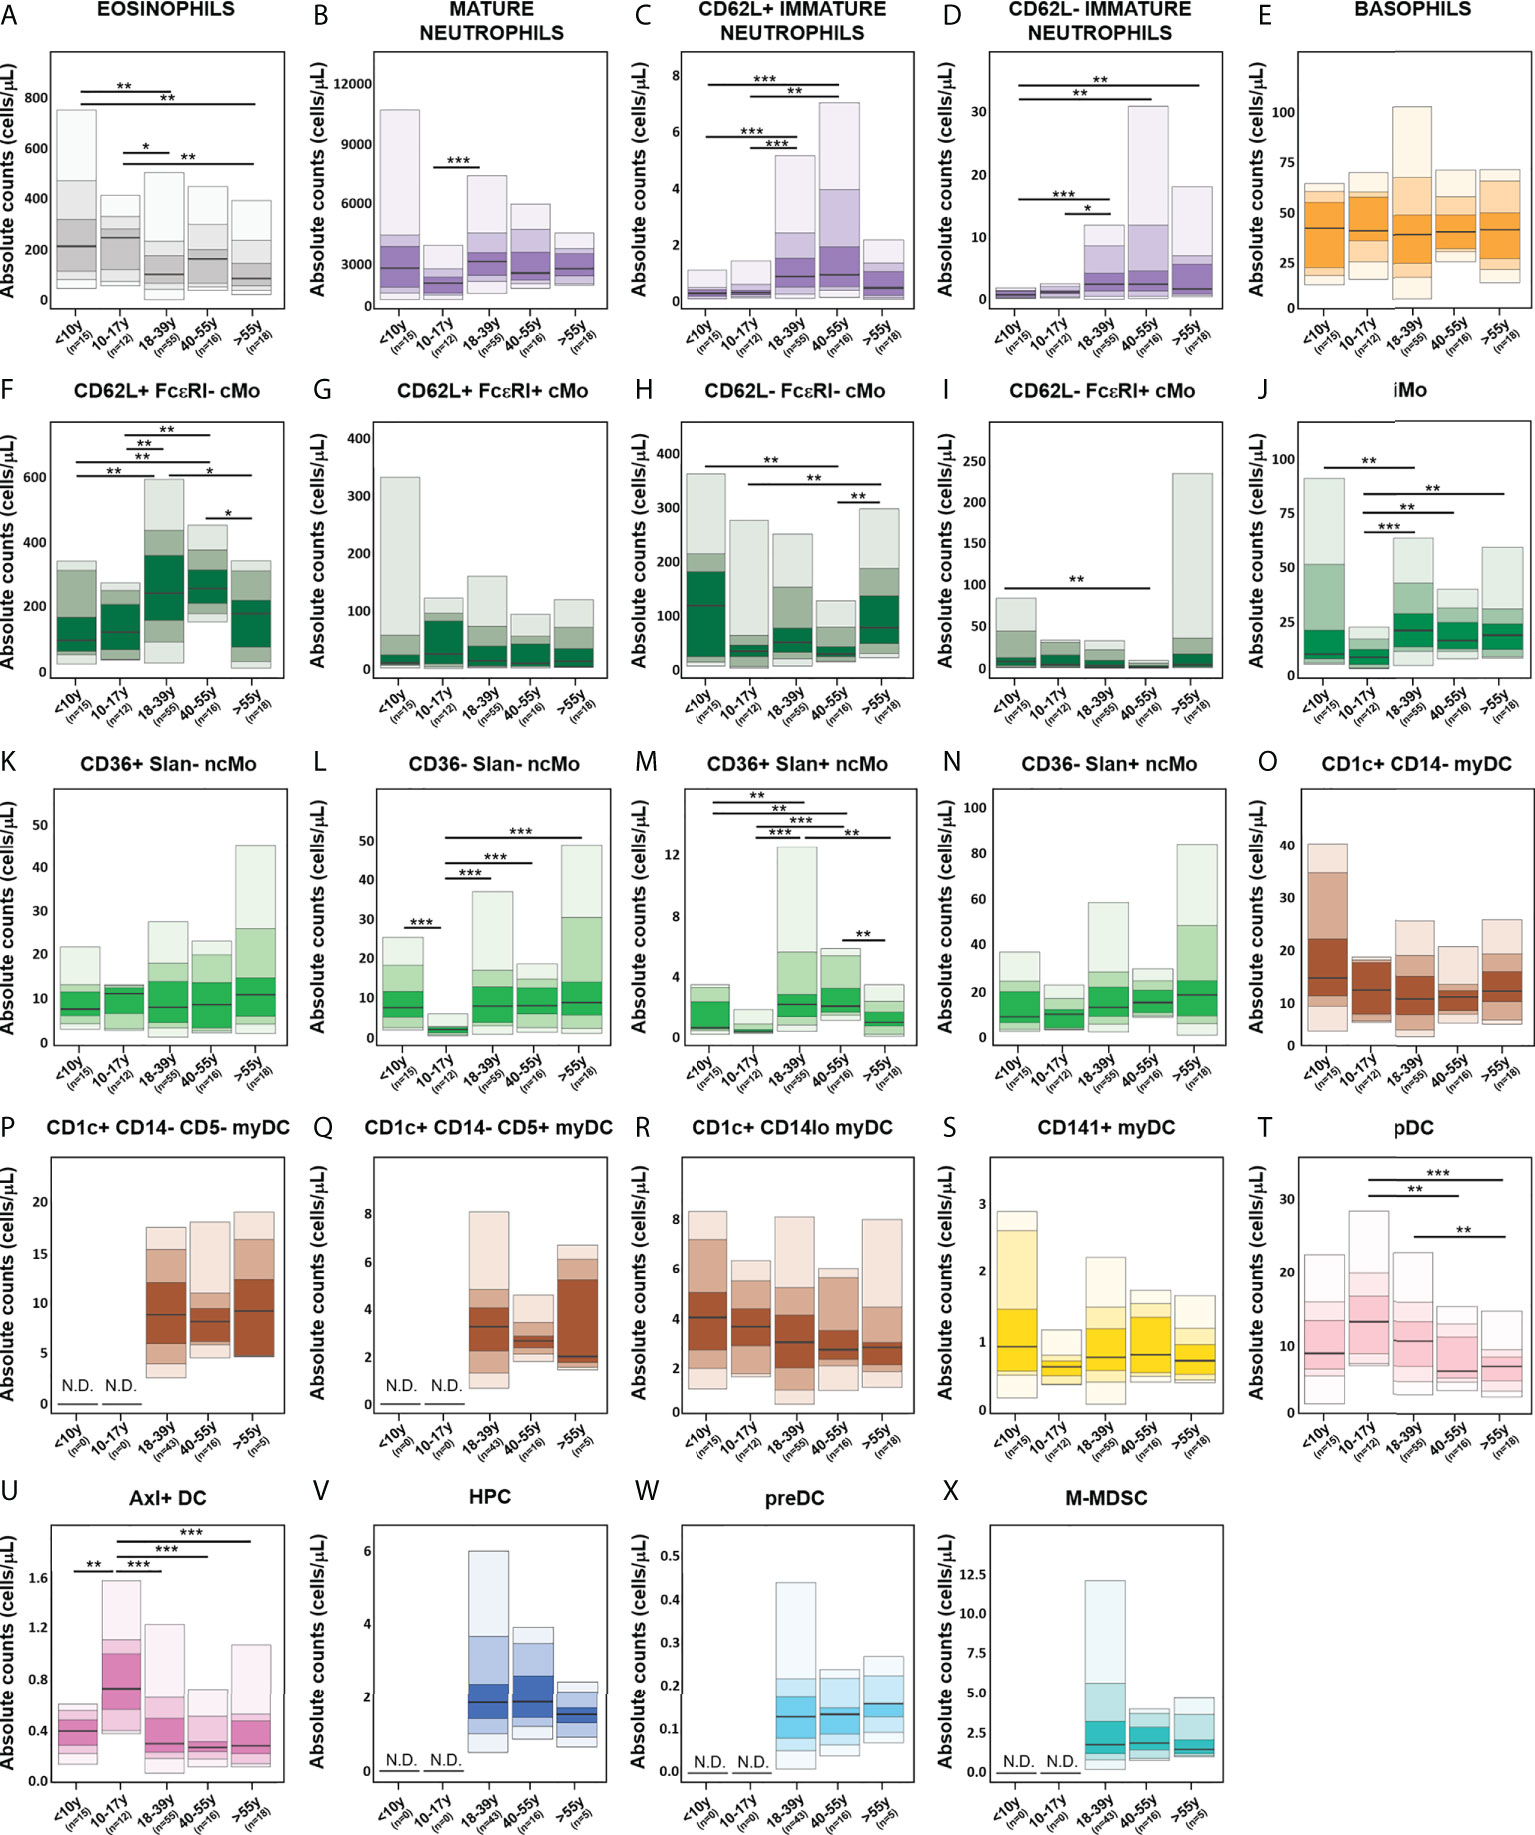
Figure 9 Age-related distribution of innate myeloid cell (IMC) populations identified using the EuroFlow IMC tube, based on the evaluation of blood samples from 116 healthy individuals. Reference ranges for all IMC populations identified with the innate myeloid (IMC) tube [granulocytic cells (A–E), monocytic populations (F–N), dendritic cell (DC) populations (O–U), hematopoietic precursor cells (HPC) (V), preDC (W) and monocytic myeloid-derived suppressor cells (M-MDSC) (X)] in different age categories. Minimum, percentiles 10, 25, 50 (median), 75 and 90, and maximum values are shown. Statistically significant differences were evaluated using a Kruskal-Wallis test and false discovery rate (FDR) of 5% to correct for multiple comparisons (* p-value < 0.05; ** p-value < 0.01; *** p-value < 0.001). cMo, classical monocytes; iMo, intermediate monocytes; ncMo, non-classical monocytes; DC, dendritic cells; myDC, myeloid dendritic cells; pDC, plasmacytoid dendritic cells; HPC, hematopoietic precursor cells; M-MDSC; monocytic myeloid-derived suppressor cells; N.D., not determined.
When evaluating the potential impact of sex on the distribution of different IMC populations in PB, significantly lower mature neutrophil counts were observed in younger adults (18-39y) (Supplementary Figure 9) for men vs. women (p=0.04), whereas CD62L- immature neutrophils (p=0.004) and CD62L- cMo populations (CD62L- FcεRI- cMos, p=0.01; CD62L- FcεRI+ cMos, p=0.008) were significantly increased in men vs. women.
Discussion
Monitoring of IMC populations for diagnostic patient care has been historically hampered by the lack of standardized criteria for population identification and data analysis, coupled to the continuous developments in the field, with recent description of previously unknown (sub)populations of monocytes and DC (25, 26, 35, 40, 42, 44–46).
Here, we employed for the first time a stepwise unbiased approach for the development of two alternative antibody combinations for monitoring of up to 23 different IMC populations in normal PB, including recently described populations, such as Axl+ DCs and preDCs: an 11-color tube (with 13 antibodies), compatible with CE-IVD certified FCM instruments which identifies 19 IMC populations, and an extended 14-color variant (with 16 antibodies), allowing identification of 4 additional, less frequently reported, IMC populations. For fast translation to diagnostic laboratories, we evaluated the impact on both IMC population phenotypes and counts in PB, of different anticoagulants, immediate vs. delayed sample preparation and the usage of distinct types (conventional vs. spectral) of FCM instruments in single vs. multicenter settings. Finally, we developed a database-guided automated analysis approach for standardized data analysis and provided normal age- and sex-matched reference values as a basis for future immune-monitoring in patient care.
A backbone previously identified and validated by the EuroFlow and TiMaScan consortia for immune-monitoring of major granulocytic and monocytic (sub)populations (9, 37, 39, 67), was employed as a basis for panel design. This combination already allowed for identification of eosinophils, mature neutrophils, two populations of cMos (CD62L+ and CD62L-), iMo and four populations of ncMos (defined based on CD36 and Slan expression). Of note, previous reports suggested that CD9 instead of CD36 might also be used for ncMo subsetting within the Slan+ compartment (35). However, the expression of the two markers is redundant within Slan+ cells (35) and CD36 further allows for identification on an additional Slan- ncMo population and at the same time, it is more specific for monocytes and DCs than CD9.
In a second step, markers classically employed for identification of pDCs (i.e., CD123, CD303 and CD304) (25, 27, 31, 41) and myDCs (i.e., CD11c and CD33) (38, 41, 42, 45, 68) were tested. CD303 and CD33 showed the best performance for clear discrimination of pDCs and myDCs, respectively, overcoming the need for an exclusion cocktail of lymphoid-associated markers. This is due to the fact that CD303 is highly specific for pDCs (69), and CD33 cross-contamination would result mainly from monocytes (70), which can be excluded based on counterstaining with the backbone markers. Other markers, e.g., CD11c are also expressed on B cells (71), and would require the inclusion of an exclusion B-cell marker. Although a splicing polymorphism has been reported for CD33, leading to loss of epitopes recognized by anti-CD33 antibodies (72), the usage of a bright fluorochrome (i.e., PE Cy7) in combination with other markers in the panel (e.g., FcεRI, CD14, CD16, CD1c, CD141, CD303) still allowed for accurate identification of myDCs, also in individuals displaying CD33lo expression (data not shown).
Recent reports have highlighted the great heterogeneity of the myDC compartment (40, 42). For example, CD1c+ myDCs (or cDC2) are comprised of functionally distinct subsets that can be discriminated based on CD14 expression (CD14lo inflammatory myDCs vs. CD14- myDCs) (40). Likewise, Yin et al. (42) reported two populations of CD1c+ myDCs with distinct gene expression, cytokine production, migration potential, antigen presentation and T-cell polarization profiles, identified based on the expression of CD5hi vs. CD5lo. Combining both markers allowed identification of three distinct populations of CD1c+ myDCs with the EuroFlow IMC tube: i) CD1c+ CD14lo myDCs, ii) CD1c+ CD14- CD5 myDCs - and iii) CD1c+ CD14- CD5+ myDCs. Since both the CD14lo and CD14- CD5- subsets of CD1c+ myDCs have been recently shown to display gene expression patterns closer to monocytes (40, 42), further transcriptomics, proteomics and/or functional comparative analyses are required to better understand the relationship among these subsets.
Classical gating strategies for pDCs identification have been associated with cross-contamination with the recently described Axl+ DCs (40). As these cells show myDC and pDC mixed transcriptomic and functional profiles, this could lead to potentially inaccurate data interpretation (40). Here we identified CD303+ Axl+ DC vs. pDCs and myDCs, in the absence of an anti-Axl antibody, based on a distinctive immunophenotypic profile (HLA-DR+ CD33lo CD141+ CD303lo). This CD303lo Axl+ DC population also showed unique functional features both at steady-state and in response to LPS. As described by Villani et al (40), the Axl+ DCs, here identified employing the above-mentioned combination, displayed higher CD86 and CD5 baseline expression vs. pDCs and produced IL6, IL8 and TNFα in response to TLR4 stimulation, with an intermediate degree of response between pDCs and CD1c+ myDCs, further supporting that Axl+ DCs can be identified based on the HLA-DR+ CD33lo CD141+ CD303lo phenotype. In addition to the pDC-like Axl+ DCs (CD11c-/lo, CD123+, Axl+), another Axl-expressing DC population has been reported in the literature (CD11c+ CD123lo Axl+ DCs), which exhibits an immunophenotypic profile (CD11c+ CD14- CD5+) (25, 40) similar to CD1c+ CD14- CD5+myDCs. In line with this, both populations have also been reported to induce strong CD4+ T-cell proliferation (40, 42), suggesting that these two DC populations might be (at least partly) overlapping subsets. Further studies are required to confirm these observations.
While the nature of the myDCs precursor in PB is still a matter of debate (31, 40, 43), a population defined by a CD100hi CD34int phenotype, ability to proliferate and differentiate into CD1c+ myDCs and CD141+ myDCs has been reported (40). Remarkably, CD100 was not critically required for its identification since the HLA-DRhi CD34int phenotype showed a high discrimination power vs. other CD34+ cells. Interestingly, several recently described preDC populations, based on different antibody combinations, show significant overlapping features. For example, CD45RA+ CD33+ CD123+ HLA-DR+ preDCs described by See et al. (31) in fact correspond to Axl+ DC as proposed by Villani et al. (40) Altogether, these findings highlight the need for a standardized nomenclature of IMC populations for more direct comparison of data derived from different panels and studies.
Identification of immature neutrophil populations was accurately achieved using the backbone combination alone, which even allowed their further subsetting based on the pattern of expression of CD16 and CD62L. Interestingly, these populations displayed immunophenotypic features overlapping not only with immature neutrophil populations (promyelocytes, myelocytes and metamyelocytes) (63, 64), but also with polymorphonuclear myeloid-derived suppressor cells (PMN-MDSCs) (CD11b+, CD14-, CD15+, CD33+, CD66b+) (32), as previously reported by others (73–76). In fact, despite the guidelines for identification of PMN-MDSC vs. neutrophils require a standard density (e.g., Ficoll) gradient centrifugation step (32), previous groups have addressed the identification of PMN-MDSCs in whole blood (77). In line with our data, these groups also reported similar immunophenotypic profile to the one observed among immature neutrophils (CD3-, CD11b+, CD14, CD15+, CD16-, CD19-, CD20-, CD33+, CD45+, CD56-, CD45+, HLA-DR-) (Figure 4). Furthermore, as previously reported for PMN-MDSCs (78), an increased frequency of immature neutrophils was observed in CB vs. adult PB, further supporting the notion that these might be (at least in part) overlapping IMC populations. Further functional, immunophenotypic, biochemical and molecular studies (e.g., inhibition of T-cell proliferation, reactive oxygen species production or expression of Arginase 1, Lox-1 or VEGFR1) (32, 79, 80) in e.g. PB from cancer patients are required to determine the degree of overlap between these populations and which additional markers would potentially be required to differentiate them.
Discrimination of M-MDSCs from cMos frequently depends solely on the pattern of expression of HLA-DR, which ultimately requires FMO or internal controls to set the gates for their arbitrary identification (32). While several studies have reported markers with the potential to improve the discrimination from cMos (e.g., CD64, CD86, CD124, CD163, S100A9) (32, 81), no comprehensive evaluation of the expression of high numbers (n>30) of proteins in cMos vs. M-MDSCs has been previously performed. In line with earlier reports (32, 81, 82), a trend for lower expression of CD32, CD64, CD86 and CD163 and increased expression of CD124 and S100A9 was observed in M-MDSCs vs. cMos. Despite this, only CD16, CD123 and CD192 showed overall statistically significant different expression in M-MDSCs vs. cMos. This might be due to the fact that normal CB and healthy adult PB samples were tested in our study, whereas other reports evaluated these markers in cancer, infection and/or inflammatory conditions (81, 82), that can potentially lead to more pronounced distinct phenotypes. Multivariate analysis further revealed that only CD192 was of additional value for discrimination of the two populations and therefore, only this marker was included in the extended version of the EuroFlow IMC tube. Interestingly, when CD192 was used, a significantly higher frequency of M-MDSC was observed in CB vs. adult PB, a pattern previously reported for PMN-MDSCs but not M-MDSCs (78), suggesting that the more restricted CD14+, HLA-DR-/lo, CD192-/lo phenotype could potentially more accurately identify CD14+ HLA-DR-/lo M-MDSCs. Further T-cell proliferation inhibition assays are required to confirm this hypothesis. Based on all the above, we can conclude that the number of markers required to identify all distinct target populations of IMC was optimized in the EuroFlow IMC combinations.
For increased flexibility, two versions of the EuroFlow IMC tube were designed. A more limited, smaller 11-color antibody combination (13 antibodies), aimed for the clinical setting, in which available IVD-certified instruments frequently have the ability to detect fewer parameters, and an extended 14-color tube (16 antibodies), that further allows identification of less frequent and/or more recently discovered IMC populations (e.g., M-MDSCs and preDCs), mostly aimed at the discovery/research settings, in which instruments allowing simultaneous detection of >12 colors are more commonly available.
In line with previous reports (66, 83), both antibody combinations can be used in EDTA vs. sodium heparin anticoagulated samples, although slightly lower counts of CD1c+ CD14lo myDCs might be detected in heparin samples. Similarly, no significant impact on the overall staining patterns and individual marker resolution was observed for samples stored at RT for up to 24h prior to staining, except for lower CD16 and Slan levels, according to previously reported findings for CD16 (66). However, an increasing time lapse between sample collection and sample processing had a significant impact on the absolute counts of specific IMC populations, already at >12 hours and particularly at ≥ 24h, when >60% of all IMC populations evaluated exhibited some degree of altered (>10% variation vs. 0h) cell counts, in line with previous studies (66, 77). However, it should be noted that delayed sample preparation mainly affected infrequent populations (e.g., Axl+ DCs, CD1c+ CD14dim myDCs, CD141+ myDCs), leading to an overestimation of their counts, which might be due to the lower viability of more frequent populations, as supported by an increased percentage of cell debris, particularly at 24h. Conversely, underestimation of populations of (particularly CD36-) ncMos was observed after 12h, probably because ncMos have been reported to be more prone to spontaneous apoptosis (84). Interestingly, CD62L- cMos were more sensitive to delayed processing than CD62L+ cMos. Downregulation of CD62L by mechanisms such as cleavage from the cell surface membrane has been shown in apoptotic mature neutrophils (85). A similar process might occur in monocytes. Of note, our time course experiments were performed at RT, aiming at mimicking transportation of the samples between centers. However, the performance of the EuroFlow IMC tube could be improved by storage/transportation of samples at 4°C in sodium heparin-anticoagulated tubes, as recommended by Diks et al. (66) who reported good stability of major myeloid populations up to 24h under these conditions. A frequently employed alternative approach for the study of samples that cannot be evaluated within a short period upon collection is freezing. However, while the overall staining resolution of samples with the EuroFlow IMM combination was not significantly affected by the freezing process, and still allowed for identification of all IMC populations present in the sample, a clear impact on the relative frequency of populations was observed. Overall, this suggests, that despite the combination can be employed for characterization of frozen PBMCs, in the context of comparison of samples processed with the same method, the interpretation and reporting of the results on relative frequency of populations should consider the bias vs. freshly obtained samples induced by freezing procedure.
Further evaluation of the EuroFlow IMC tube showed a very good reproducibility both in single center, multi-instrument, and multi-center settings. Of note, the highly comparable results obtained in conventional vs. spectral instruments support the possibility of employing the EuroFlow IMC tube as a basis for expansion with additional application-dependent characterization markers, when high-end (>20 colors) instruments are used in a research setting. Noteworthy, as the frequency of some of the IMC population can be as low as 0.1 cells/μL in healthy donors, to reliably and reproducibility identify and quantify these populations also in situations in which a significantly decreased frequency is observed, staining of 107 cells is recommended. While the EuroFlow IMC combination can be employed for processing of lower numbers of cells, in case of limited sample availability, the limits of detection (LOD) and quantitation (LOQ) (≥30 and ≥50 events to define a cell population, respectively) should be taken into account for data analysis and reporting.
A high correlation between automated vs. expert-based manual analysis was observed for population identification and quantification, in line with previous reports (56, 57, 86). The higher reproducibility observed for repeated database-guided AGI procedures vs. expert-based manual analysis, together with the faster (approximately 5min vs. 20min for analysis of one sample, respectively) and less labor-intensive features of AGI, further support the potential of database-guided automated analysis to reduce operator-related variability and allow for more efficient and reproducible data analysis. These features become particularly relevant in the diagnostic clinical setting and in cases where a high number of parameters and/or IMC populations are investigated (57, 86, 87). Interestingly, less than optimal performance observed for database-guided automated analysis was restricted to the analysis of minimally represented IMC populations (<0.05% of all leukocytes) close to the limit of quantification (LOQ) of the tube, and populations defined by a limited number of gating markers with heterogeneous expression patterns (e.g., ncMo or cMo subsets). Improvement of the performance of the database-guided analytical procedures might be potentially achieved by staining and acquisition of higher numbers of cells (e.g., 10 million) and fine-tuning of Wanderlust trajectory-based automated gating on heterogenous markers (50, 86).
The frequency of IMC populations has been previously shown to be modulated throughout life (37). Therefore, knowledge of the normal age-related distribution of the populations is crucial for clinical translation of the data. Overall, three major patterns were observed for the absolute counts of PB IMC populations in relation with age: i) stable cell counts, ii) modulation during adolescence and iii) changes in older (>55y) adults. Since the distribution of several immune cell populations has been reported to occur within the first 2 years of life most prominently (37, 86), it is possible that earlier kinetic changes in populations have been missed, as our cohort only includes children >8 years. Further inclusion of samples from younger infants would allow for applicability of the reference values in the pediatric settings. Overall, several populations displayed clear kinetics around adolescence (10-17y) (e.g., pDCs, Axl+ DCs and CD36-/Slan- ncMos), most likely associated with the physiological changes observed in puberty (e.g., hormonal variations and increased tissue remodeling). In turn, other IMC populations showed modulation in older adults (e.g. eosinophils, immature neutrophils, CD62L+ FcεRI- cMos and CD36+ Slan+ ncMos), potentially as a result of a skewing of hematopoiesis towards myeloid vs. lymphoid lineages, decrease in the function of neutrophil, monocytes and DCs and possibly also low-grade inflammation also known as “inflamm-aging” (88, 89).
In contrast to age, limited sex-related differences were observed, except for the more mature neutrophils (more frequent in women), immature neutrophils and CD62L- cMos (more frequent in men), similarly to what has been previously reported for neutrophils and lymphocytes (90, 91).
In summary, we developed two standardized, and highly reproducible versions of the EuroFlow IMC tube, which are suitable for clinical and research/discovery studies, even in multi-instrument and multi-center settings, allowing for robust and accurate identification and quantitation of 19 to 23 IMC populations in blood. By addressing distinct (i.e., pre-analytical, analytical and post-analytical) variables that might impact the reproducibility of laboratory testing, and providing normal age- and sex-related reference ranges, our study sets the basis for standardized immune-monitoring of IMC in distinct disease and treatment conditions, in the context of clinical trials and/or patient care such as in inflammatory diseases, various forms of tissue damage as well as for monitoring immune responses to infectious diseases, vaccination or immunotherapy.
Data availability statement
The raw data supporting the conclusions of this article will be made available by the authors, without undue reservation.
Ethics statement
The studies involving human participants were reviewed and approved by Medical Research Ethics Committees United (MEC-U, NL60807.100.17-R17.039), Medisch Ethische Toetsingscommissie (METC) – LUMC, Comité de Ética de la Investigación con medicamentos del Área de Salud de Salamanca. Written informed consent to participate in this study was provided by the participants’ legal guardian/next of kin.
Author contributions
CT, AO, and JD designed the study. KP, SB-V, DD, WB, IL, BN, PD, SK, AL, and AJ performed the flow cytometry experiments. KP and IL performed the in vitro activation assays. GF, provided the cord blood samples. DD, AH-D, JA, JVG, A-MB, QH, AO, and CT were involved in the multicentric validation. KP, CT, IL, BN, PD, AJ, A-MD, MB, BM, PV, GB and RG contributed to the collection, processing and/or analysis of samples of healthy donors for calculation of the reference values. AS-G, FB, A-MD, MB, BM, and RG performed the technical evaluation of the tube. AH-D, DD, and CT constructed and validated the database for automated analysis. CT, KP, and IK made the figures and performed the statistical analyses. KP, CT, and JD wrote the manuscript. All authors contributed to manuscript revision and approved the submitted version.
Funding
The presented work was funded by the European Research Council under the European Union’s Horizon 2020 Research and Innovation Programme with an ERC Advanced Grant (ERC-2015-AdG 695655, TiMaScan) and the IMI2 PERISCOPE project, financed by the Innovative Medicines Initiative 2 Joint Undertaking (grant number 115910). This joint undertaking receives support from the European Union’s Horizon 2020 Research and Innovation Programme, the European Federation of Pharmaceutical Industries and Associations (EFPIA), and The Bill and Melinda Gates Foundation (BMGF). This manuscript only reflects the author’s views. The Joint Undertaking is not responsible for any use that may be made of the information this manuscript contains. The coordination and innovation processes of this study were supported by the EuroFlow Consortium. The EuroFlow Consortium received support from the FP6-2004-LIFESCIHEALTH-5 program of the European Commission (grant LSHB-CT-2006-018708) as Specific Targeted Research Project (STREP).
Acknowledgments
We would like to acknowledge and thank the LUMC Vrijwillige Donoren Service – Direct Gebruik (LuVDS-DG; B18.031) and donors for supplying the peripheral blood samples (request code L18.001) and the Flow cytometry Core Facility (FCF) of the Leiden University Medical Center (LUMC), The Netherlands (https://www.lumc.nl/research/facilities/fcf), coordinated by M. Hameetman, run by the FCF operators, D.M. Lowie, S. van de Pas, G.IJ. Reyneveld, and former FCF coordinator dr. K Schepers and former operators J.P. Jansen, E.F.E de Haas, G.M. De Roo, R.J. Mclaughlin and S.A.J. Veld (Directors: Prof. F.J.T. Staal and Prof. J.J.M. van Dongen) for their technical support.
Conflict of interest
JD and AO report to be chairmen of the EuroFlow scientific foundation, which receives royalties from licensed patents, which are collectively owned by the participants of the EuroFlow Foundation. These royalties are exclusively used for continuation of the EuroFlow collaboration and sustainability of the EuroFlow consortium. JD and AO report an Educational Services Agreement from BD Biosciences (San José, CA) and a Scientific Advisor Agreement with Cytognos; all related fees and honoraria are for the involved university departments at Leiden University Medical Center and University of Salamanca. AH-D is an employee of Cytognos (Salamanca, Spain). Lastly, JD, CT, AO, JA, WB, KP, MB, AD, DD, and AH-D, are listed as (co)inventors on the patent “Means and methods for multiparameter cytometry-based leukocyte subsetting” (NL2844751, filing date 5 November 2019), owned by the EuroFlow scientific consortium, which describes the flow cytometry panels developed in this study.
The remaining authors declare that the research was conducted in the absence of any commercial or financial relationships that could be construed as a potential conflict of interest.
Publisher’s note
All claims expressed in this article are solely those of the authors and do not necessarily represent those of their affiliated organizations, or those of the publisher, the editors and the reviewers. Any product that may be evaluated in this article, or claim that may be made by its manufacturer, is not guaranteed or endorsed by the publisher.
Supplementary material
The Supplementary Material for this article can be found online at: https://www.frontiersin.org/articles/10.3389/fimmu.2022.935879/full#supplementary-material
References
1. Amulic B, Hayes G. Neutrophil extracellular traps. Curr Biol (2011) 21(9):R297–8. doi: 10.1016/j.cub.2011.03.021
2. Groh L, Keating ST, Joosten LAB, Netea MG, Riksen NP. Monocyte and macrophage immunometabolism in atherosclerosis. Semin Immunopathol (2018) 40(2):203–14. doi: 10.1007/s00281-017-0656-7
3. Jenmalm MC, Cherwinski H, Bowman EP, Phillips JH, Sedgwick JD. Regulation of myeloid cell function through the CD200 receptor. J Immunol (2006) 176(1):191–9. doi: 10.4049/jimmunol.176.1.191
4. Kolaczkowska E, Kubes P. Neutrophil recruitment and function in health and inflammation. Nat Rev Immunol (2013) 13(3):159–75. doi: 10.1038/nri3399
5. Lee J, Tam H, Adler L, Ilstad-Minnihan A, Macaubas C, Mellins ED. The MHC class II antigen presentation pathway in human monocytes differs by subset and is regulated by cytokines. PloS One (2017) 12(8):e0183594. doi: 10.1371/journal.pone.0183594
6. MacDonald KP, Munster DJ, Clark GJ, Dzionek A, Schmitz J, Hart DN. Characterization of human blood dendritic cell subsets. Blood (2002) 100(13):4512–20. doi: 10.1182/blood-2001-11-0097
7. Steinman RM, Inaba K. Myeloid dendritic cells. J leukocyte Biol (1999) 66(2):205–8. doi: 10.1002/jlb.66.2.205
8. Varga G, Foell D. Anti-inflammatory monocytes-interplay of innate and adaptive immunity. Mol Cell Pediatr (2018) 5(1):5. doi: 10.1186/s40348-018-0083-4
9. van den Bossche WBL, Rykov K, Teodosio C, Ten Have B, Knobben BAS, Sietsma MS, et al. Flow cytometric assessment of leukocyte kinetics for the monitoring of tissue damage. Clin Immunol (Orlando Fla) (2018) 197:224–30. doi: 10.1016/j.clim.2018.09.014
10. de Oliveira S, Rosowski EE, Huttenlocher A. Neutrophil migration in infection and wound repair: going forward in reverse. Nat Rev Immunol (2016) 16(6):378–91. doi: 10.1038/nri.2016.49
11. Gerhardt T, Ley K. Monocyte trafficking across the vessel wall. Cardiovasc Res (2015) 107(3):321–30. doi: 10.1093/cvr/cvv147
12. Porcheray F, Viaud S, Rimaniol AC, Leone C, Samah B, Dereuddre-Bosquet N, et al. Macrophage activation switching: an asset for the resolution of inflammation. Clin Exp Immunol (2005) 142(3):481–9. doi: 10.1111/j.1365-2249.2005.02934.x
13. Matarraz S, Almeida J, Flores-Montero J, Lecrevisse Q, Guerri V, Lopez A, et al. Introduction to the diagnosis and classification of monocytic-lineage leukemias by flow cytometry. Cytometry B Clin Cytom (2017) 92(3):218–27. doi: 10.1002/cyto.b.21219
14. Valet G, Repp R, Link H, Ehninger A, Gramatzki MM. Pretherapeutic identification of high-risk acute myeloid leukemia (AML) patients from immunophenotypic, cytogenetic, and clinical parameters. Cytometry B Clin Cytom (2003) 53(1):4–10. doi: 10.1002/cyto.b.10028
15. Haschka D, Tymoszuk P, Bsteh G, Petzer V, Berek K, Theurl I, et al. Expansion of neutrophils and classical and nonclassical monocytes as a hallmark in relapsing-remitting multiple sclerosis. Front Immunol (2020) 11:594. doi: 10.3389/fimmu.2020.00594
16. Kashiwagi M, Imanishi T, Ozaki Y, Taruya A, Nishiguchi T, Katayama Y, et al. Prognostic value of human peripheral monocyte subsets for future coronary events in patients without significant coronary artery stenosis. Circ J Off J Japanese Circ Soc (2019) 83(11):2250–6. doi: 10.1253/circj.CJ-19-0520
17. Naicker SD, Cormican S, Griffin TP, Maretto S, Martin WP, Ferguson JP, et al. Chronic kidney disease severity is associated with selective expansion of a distinctive intermediate monocyte subpopulation. Front Immunol (2018) 9:2845. doi: 10.3389/fimmu.2018.02845
18. Tsukamoto M, Seta N, Yoshimoto K, Suzuki K, Yamaoka K, Takeuchi T. CD14(bright)CD16+ intermediate monocytes are induced by interleukin-10 and positively correlate with disease activity in rheumatoid arthritis. Arthritis Res Ther (2017) 19(1):28.
19. Rogacev KS, Zawada AM, Hundsdorfer J, Achenbach M, Held G, Fliser D, et al. Immunosuppression and monocyte subsets. Nephrology dialysis Transplant Off Publ Eur Dialysis Transplant Assoc - Eur Renal Assoc (2015) 30(1):143–53. doi: 10.1093/ndt/gfu315
20. Sabado RL, O'Brien M, Subedi A, Qin L, Hu N, Taylor E, et al. Evidence of dysregulation of dendritic cells in primary HIV infection. Blood (2010) 116(19):3839–52. doi: 10.1182/blood-2010-03-273763
21. Royo J, Rahabi M, Kamaliddin C, Ezinmegnon S, Olagnier D, Authier H, et al. Changes in monocyte subsets are associated with clinical outcomes in severe malarial anaemia and cerebral malaria. Sci Rep (2019) 9(1):17545. doi: 10.1038/s41598-019-52579-7
22. Lapuc I, Bolkun L, Eljaszewicz A, Rusak M, Luksza E, Singh P, et al. Circulating classical CD14++CD16- monocytes predict shorter time to initial treatment in chronic lymphocytic leukemia patients: Differential effects of immune chemotherapy on monocyte-related membrane and soluble forms of CD163. Oncol Rep (2015) 34(3):1269–78. doi: 10.3892/or.2015.4088
23. Martens A, Wistuba-Hamprecht K, Geukes Foppen M, Yuan J, Postow MA, Wong P, et al. Baseline peripheral blood biomarkers associated with clinical outcome of advanced melanoma patients treated with ipilimumab. Clin Cancer Res (2016) 22(12):2908–18. doi: 10.1158/1078-0432.CCR-15-2412
24. Pirozyan MR, McGuire HM, Emran AA, Tseng HY, Tiffen JC, Lee JH, et al. Pretreatment innate cell populations and CD4 T cells in blood are associated with response to immune checkpoint blockade in melanoma patients. Front Immunol (2020) 11:372. doi: 10.3389/fimmu.2020.00372
25. Alcantara-Hernandez M, Leylek R, Wagar LE, Engleman EG, Keler T, Marinkovich MP, et al. High-dimensional phenotypic mapping of human dendritic cells reveals interindividual variation and tissue specialization. Immunity (2017) 47(6):1037–50.e6. doi: 10.1016/j.immuni.2017.11.001
26. Autissier P, Soulas C, Burdo TH, Williams KC. Evaluation of a 12-color flow cytometry panel to study lymphocyte, monocyte, and dendritic cell subsets in humans. Cytometry Part A J Int Soc Analytical Cytology (2010) 77(5):410–9. doi: 10.1002/cyto.a.20859
27. Bachem A, Guttler S, Hartung E, Ebstein F, Schaefer M, Tannert A, et al. Superior antigen cross-presentation and XCR1 expression define human CD11c+CD141+ cells as homologues of mouse CD8+ dendritic cells. J Exp Med (2010) 207(6):1273–81. doi: 10.1084/jem.20100348
28. Hofer TP, van de Loosdrecht AA, Stahl-Hennig C, Cassatella MA, Ziegler-Heitbrock L. 6-sulfo LacNAc (Slan) as a marker for non-classical monocytes. Front Immunol (2019) 10:2052. doi: 10.3389/fimmu.2019.02052
29. Patel AA, Zhang Y, Fullerton JN, Boelen L, Rongvaux A, Maini AA, et al. The fate and lifespan of human monocyte subsets in steady state and systemic inflammation. J Exp Med (2017) 214(7):1913–23. doi: 10.1084/jem.20170355
30. Ziegler-Heitbrock L, Ancuta P, Crowe S, Dalod M, Grau V, Hart DN, et al. Nomenclature of monocytes and dendritic cells in blood. Blood (2010) 116(16):e74–80. doi: 10.1182/blood-2010-02-258558
31. See P, Dutertre CA, Chen J, Gunther P, McGovern N, Irac SE, et al. Mapping the human DC lineage through the integration of high-dimensional techniques. Sci (New York NY) (2017) 356(6342):eaag3009. doi: 10.1126/science.aag3009
32. Bronte V, Brandau S, Chen SH, Colombo MP, Frey AB, Greten TF, et al. Recommendations for myeloid-derived suppressor cell nomenclature and characterization standards. Nat Commun (2016) 7:12150. doi: 10.1038/ncomms12150
33. Ong SM, Teng K, Newell E, Chen H, Chen J, Loy T, et al. A novel, five-marker alternative to CD16-CD14 gating to identify the three human monocyte subsets. Front Immunol (2019) 10:1761. doi: 10.3389/fimmu.2019.01761
34. Thomas GD, Hamers AAJ, Nakao C, Marcovecchio P, Taylor AM, McSkimming C, et al. Human blood monocyte subsets: A new gating strategy defined using cell surface markers identified by mass cytometry. Arteriosclerosis thrombosis Vasc Biol (2017) 37(8):1548–58. doi: 10.1161/ATVBAHA.117.309145
35. Hamers AAJ, Dinh HQ, Thomas GD, Marcovecchio P, Blatchley A, Nakao CS, et al. Human monocyte heterogeneity as revealed by high-dimensional mass cytometry. Arteriosclerosis thrombosis Vasc Biol (2019) 39(1):25–36. doi: 10.1161/ATVBAHA.118.311022
36. Shin JS, Greer AM. The role of FcepsilonRI expressed in dendritic cells and monocytes. Cell Mol Life Sci (2015) 72(12):2349–60. doi: 10.1007/s00018-015-1870-x
37. Damasceno D, Teodosio C, van den Bossche WBL, Perez-Andres M, Arriba-Méndez S, Muñoz-Bellvis L, et al. Distribution of subsets of blood monocytic cells throughout life. J Allergy Clin Immunol (2019) 144(1):320–3.e6. doi: 10.1016/j.jaci.2019.02.030
38. Damasceno D, Andres MP, van den Bossche WB, Flores-Montero J, de Bruin S, Teodosio C, et al. Expression profile of novel cell surface molecules on different subsets of human peripheral blood antigen-presenting cells. Clin Trans Immunol (2016) 5(9):e100. doi: 10.1038/cti.2016.54
39. Damasceno D, Almeida J, Teodosio C, Sanoja-Flores L, Mayado A, Perez-Pons A, et al. Monocyte subsets and serum inflammatory and bone-associated markers in monoclonal gammopathy of undetermined significance and multiple myeloma. Cancers (Basel) (2021) 13(6):1454. doi: 10.3390/cancers13061454
40. Villani AC, Satija R, Reynolds G, Sarkizova S, Shekhar K, Fletcher J, et al. Single-cell RNA-seq reveals new types of human blood dendritic cells, monocytes, and progenitors. Sci (New York NY) (2017) 356(6335):eaah4573. doi: 10.1126/science.aah4573
41. Collin M, Bigley V. Human dendritic cell subsets: an update. Immunology (2018) 154(1):3–20. doi: 10.1111/imm.12888
42. Yin X, Yu H, Jin X, Li J, Guo H, Shi Q, et al. Human blood CD1c+ dendritic cells encompass CD5high and CD5low subsets that differ significantly in phenotype, gene expression, and functions. J Immunol (Baltimore Md 1950) (2017) 198(4):1553–64. doi: 10.4049/jimmunol.1600193
43. Breton G, Lee J, Zhou YJ, Schreiber JJ, Keler T, Puhr S, et al. Circulating precursors of human CD1c+ and CD141+ dendritic cells. J Exp Med (2015) 212(3):401–13. doi: 10.1084/jem.20141441
44. Draxler DF, Madondo MT, Hanafi G, Plebanski M, Medcalf RL. A flowcytometric analysis to efficiently quantify multiple innate immune cells and T cell subsets in human blood. Cytometry Part A J Int Soc Analytical Cytology (2017) 91(4):336–50. doi: 10.1002/cyto.a.23080
45. Fromm PD, Kupresanin F, Brooks AE, Dunbar PR, Haniffa M, Hart DN, et al. A multi-laboratory comparison of blood dendritic cell populations. Clin Trans Immunol (2016) 5(4):e68. doi: 10.1038/cti.2016.5
46. Hasan M, Beitz B, Rouilly V, Libri V, Urrutia A, Duffy D, et al. Semi-automated and standardized cytometric procedures for multi-panel and multi-parametric whole blood immunophenotyping. Clin Immunol (Orlando Fla) (2015) 157(2):261–76. doi: 10.1016/j.clim.2014.12.008
47. Roussel M, Ferrell PB Jr., Greenplate AR, Lhomme F, Le Gallou S, Diggins KE, et al. Mass cytometry deep phenotyping of human mononuclear phagocytes and myeloid-derived suppressor cells from human blood and bone marrow. J Leukocyte Biol (2017) 102(2):437–47. doi: 10.1189/jlb.5MA1116-457R
48. Barreau S, Green AS, Dussiau C, Alary AS, Raimbault A, Mathis S, et al. Phenotypic landscape of granulocytes and monocytes by multiparametric flow cytometry: A prospective study of a 1-tube panel strategy for diagnosis and prognosis of patients with MDS. Cytometry B Clin Cytom (2019) 98(3):226–37. doi: 10.1002/cyto.b.21843
49. Donaubauer AJ, Ruhle PF, Becker I, Fietkau R, Gaipl US, Frey B. One-tube multicolor flow cytometry assay (OTMA) for comprehensive immunophenotyping of peripheral blood. Methods Mol Biol (Clifton NJ) (2019) 1904:189–212. doi: 10.1007/978-1-4939-8958-4_8
50. Pedreira CE, Costa ESD, Lecrevise Q, Grigore G, Fluxa R, Verde J, et al. From big flow cytometry datasets to smart diagnostic strategies: The EuroFlow approach. J Immunol Methods (2019) 475:112631. doi: 10.1016/j.jim.2019.07.003
51. Consortium P. PERISCOPE: road towards effective control of pertussis. Lancet Infect Dis (2019) 19(5):e179–86.
52. Versteegen P, Valente Pinto M, Barkoff AM, van Gageldonk PGM, van de Kassteele J, van Houten MA, et al. Responses to an acellular pertussis booster vaccination in children, adolescents, and young and older adults: A collaborative study in Finland, the Netherlands, and the united kingdom. EBioMedicine (2021) 65:103247. doi: 10.1016/j.ebiom.2021.103247
53. Bueno C, Almeida J, Alguero MC, Sanchez ML, Vaquero JM, Laso FJ, et al. Flow cytometric analysis of cytokine production by normal human peripheral blood dendritic cells and monocytes: comparative analysis of different stimuli, secretion-blocking agents and incubation periods. Cytometry (2001) 46(1):33–40. doi: 10.1002/1097-0320(20010215)46:1<33::AID-CYTO1035>3.0.CO;2-S
54. Kalina T, Flores-Montero J, van der Velden VH, Martin-Ayuso M, Bottcher S, Ritgen M, et al. EuroFlow standardization of flow cytometer instrument settings and immunophenotyping protocols. Leukemia (2012) 26(9):1986–2010. doi: 10.1038/leu.2012.122
55. Flores-Montero J, Kalina T, Corral-Mateos A, Sanoja-Flores L, Perez-Andres M, Martin-Ayuso M, et al. Fluorochrome choices for multi-color flow cytometry. J Immunol Methods (2019) 475:112618. doi: 10.1016/j.jim.2019.06.009
56. Costa ES, Pedreira CE, Barrena S, Lecrevisse Q, Flores J, Quijano S, et al. Automated pattern-guided principal component analysis vs expert-based immunophenotypic classification of b-cell chronic lymphoproliferative disorders: a step forward in the standardization of clinical immunophenotyping. Leukemia (2010) 24(11):1927–33. doi: 10.1038/leu.2010.160
57. Flores-Montero J, Grigore G, Fluxa R, Hernandez J, Fernandez P, Almeida J, et al. EuroFlow lymphoid screening tube (LST) data base for automated identification of blood lymphocyte subsets. J Immunol Methods (2019) 475:112662. doi: 10.1016/j.jim.2019.112662
58. van Dongen JJ, Lhermitte L, Bottcher S, Almeida J, van der Velden VH, Flores-Montero J, et al. EuroFlow antibody panels for standardized n-dimensional flow cytometric immunophenotyping of normal, reactive and malignant leukocytes. Leukemia (2012) 26(9):1908–75. doi: 10.1038/leu.2012.120
59. Sato N, Caux C, Kitamura T, Watanabe Y, Arai K, Banchereau J, et al. Expression and factor-dependent modulation of the interleukin-3 receptor subunits on human hematopoietic cells. Blood (1993) 82(3):752–61. doi: 10.1182/blood.V82.3.752.752
60. Alculumbre S, Pattarini L. Purification of human dendritic cell subsets from peripheral blood. Methods Mol Biol (Clifton NJ) (2016) 1423:153–67. doi: 10.1007/978-1-4939-3606-9_11
61. Jongbloed SL, Kassianos AJ, McDonald KJ, Clark GJ, Ju X, Angel CE, et al. Human CD141+ (BDCA-3)+ dendritic cells (DCs) represent a unique myeloid DC subset that cross-presents necrotic cell antigens. J Exp Med (2010) 207(6):1247–60. doi: 10.1084/jem.20092140
62. Segura E, Amigorena S. Cross-presentation by human dendritic cell subsets. Immunol Letters (2014) 158(1-2):73–8. doi: 10.1016/j.imlet.2013.12.001
63. Hellebrekers P, Hesselink L, Huisman A, Ten Berg M, Koenderman L, Leenen LPH, et al. Recognizing the mobilization of neutrophils with banded nuclei early after trauma. Int J Lab Hematol (2020) 42(5):e224–7. doi: 10.1111/ijlh.13272
64. Orfao A, Matarraz S, Perez-Andres M, Almeida J, Teodosio C, Berkowska MA, et al. Immunophenotypic dissection of normal hematopoiesis. J Immunol Methods (2019) 475:112684. doi: 10.1016/j.jim.2019.112684
65. Prabhu SB, Rathore DK, Nair D, Chaudhary A, Raza S, Kanodia P, et al. Comparison of human neonatal and adult blood leukocyte subset composition phenotypes. PloS One (2016) 11(9):e0162242. doi: 10.1371/journal.pone.0162242
66. Diks AM, Bonroy C, Teodosio C, Groenland RJ, de Mooij B, de Maertelaere E, et al. Impact of blood storage and sample handling on quality of high dimensional flow cytometric data in multicenter clinical research. J Immunol Methods (2019) 475:112616. doi: 10.1016/j.jim.2019.06.007
67. van den Bossche WBL, Vincent A, Teodosio C, Koets J, Taha A, Kleijn A, et al. Monocytes carrying GFAP detect glioma, brain metastasis and ischaemic stroke, and predict glioblastoma survival. Brain Commun (2021) 3(1):fcaa215. doi: 10.1093/braincomms/fcaa215
68. Lertjuthaporn S, Khowawisetsut L, Keawvichit R, Polsrila K, Chuansumrit A, Chokephaibulkit K, et al. Identification of changes in dendritic cell subsets that correlate with disease severity in dengue infection. PloS One (2018) 13(7):e0200564. doi: 10.1371/journal.pone.0200564
69. Dzionek A, Fuchs A, Schmidt P, Cremer S, Zysk M, Miltenyi S, et al. BDCA-2, BDCA-3, and BDCA-4: three markers for distinct subsets of dendritic cells in human peripheral blood. J Immunol (Baltimore Md 1950) (2000) 165(11):6037–46. doi: 10.4049/jimmunol.165.11.6037
70. Crocker PR, Varki A. Siglecs, sialic acids and innate immunity. Trends Immunol (2001) 22(6):337–42. doi: 10.1016/S1471-4906(01)01930-5
71. Golinski ML, Demeules M, Derambure C, Riou G, Maho-Vaillant M, Boyer O, et al. CD11c(+) b cells are mainly memory cells, precursors of antibody secreting cells in healthy donors. Front Immunol (2020) 11:32. doi: 10.3389/fimmu.2020.00032
72. Laszlo GS, Beddoe ME, Godwin CD, Bates OM, Gudgeon CJ, Harrington KH, et al. Relationship between CD33 expression, splicing polymorphism, and in vitro cytotoxicity of gemtuzumab ozogamicin and the CD33/CD3 BiTE(R) AMG 330. Haematologica (2019) 104(2):e59–62. doi: 10.3324/haematol.2018.202069
73. Janols H, Bergenfelz C, Allaoui R, Larsson AM, Ryden L, Bjornsson S, et al. A high frequency of MDSCs in sepsis patients, with the granulocytic subtype dominating in gram-positive cases. J Leukocyte Biol (2014) 96(5):685–93. doi: 10.1189/jlb.5HI0214-074R
74. Sagiv JY, Michaeli J, Assi S, Mishalian I, Kisos H, Levy L, et al. Phenotypic diversity and plasticity in circulating neutrophil subpopulations in cancer. Cell Rep (2015) 10(4):562–73. doi: 10.1016/j.celrep.2014.12.039
75. Cassetta L, Baekkevold ES, Brandau S, Bujko A, Cassatella MA, Dorhoi A, et al. Deciphering myeloid-derived suppressor cells: isolation and markers in humans, mice and non-human primates. Cancer Immunol Immunother (2019) 68(4):687–97. doi: 10.1007/s00262-019-02302-2
76. Brandau S, Trellakis S, Bruderek K, Schmaltz D, Steller G, Elian M, et al. Myeloid-derived suppressor cells in the peripheral blood of cancer patients contain a subset of immature neutrophils with impaired migratory properties. J leukocyte Biol (2011) 89(2):311–7. doi: 10.1189/jlb.0310162
77. Apodaca MC, Wright AE, Riggins AM, Harris WP, Yeung RS, Yu L, et al. Characterization of a whole blood assay for quantifying myeloid-derived suppressor cells. J Immunother Cancer (2019) 7(1):230. doi: 10.1186/s40425-019-0674-1
78. Gervassi A, Lejarcegui N, Dross S, Jacobson A, Itaya G, Kidzeru E, et al. Myeloid derived suppressor cells are present at high frequency in neonates and suppress in vitro T cell responses. PloS One (2014) 9(9):e107816. doi: 10.1371/journal.pone.0107816
79. Condamine T, Dominguez GA, Youn JI, Kossenkov AV, Mony S, Alicea-Torres K, et al. Lectin-type oxidized LDL receptor-1 distinguishes population of human polymorphonuclear myeloid-derived suppressor cells in cancer patients. Sci Immunol (2016) 1(2):aaf8943. doi: 10.1126/sciimmunol.aaf8943
80. Rodriguez PC, Ernstoff MS, Hernandez C, Atkins M, Zabaleta J, Sierra R, et al. Arginase I-producing myeloid-derived suppressor cells in renal cell carcinoma are a subpopulation of activated granulocytes. Cancer Res (2009) 69(4):1553–60. doi: 10.1158/0008-5472.CAN-08-1921
81. Bernsmeier C, Triantafyllou E, Brenig R, Lebosse FJ, Singanayagam A, Patel VC, et al. CD14(+) CD15(-) HLA-DR(-) myeloid-derived suppressor cells impair antimicrobial responses in patients with acute-on-chronic liver failure. Gut (2018) 67(6):1155–67. doi: 10.1136/gutjnl-2017-314184
82. Zhao F, Hoechst B, Duffy A, Gamrekelashvili J, Fioravanti S, Manns MP, et al. S100A9 a new marker for monocytic human myeloid-derived suppressor cells. Immunology (2012) 136(2):176–83. doi: 10.1111/j.1365-2567.2012.03566.x
83. Karai B, Miltenyi Z, Gergely L, Szaraz-Szeles M, Kappelmayer J, Hevessy Z. The impact of delayed sample handling and type of anticoagulant on the interpretation of dysplastic signs detected by flow cytometry. Biochem Med (Zagreb) (2018) 28(2):020704. doi: 10.11613/BM.2018.020704
84. Zhao C, Tan YC, Wong WC, Sem X, Zhang H, Han H, et al. The CD14(+/low)CD16(+) monocyte subset is more susceptible to spontaneous and oxidant-induced apoptosis than the CD14(+)CD16(-) subset. Cell Death Dis (2010) 1:e95.
85. Atallah M, Krispin A, Trahtemberg U, Ben-Hamron S, Grau A, Verbovetski I, et al. Constitutive neutrophil apoptosis: regulation by cell concentration via S100 A8/9 and the MEK-ERK pathway. PloS One (2012) 7(2):e29333. doi: 10.1371/journal.pone.0029333
86. Botafogo V, Perez-Andres M, Jara-Acevedo M, Barcena P, Grigore G, Hernandez-Delgado A, et al. Age distribution of multiple functionally relevant subsets of CD4+ T cells in human blood using a standardized and validated 14-color EuroFlow immune monitoring tube. Front Immunol (2020) 11:166. doi: 10.3389/fimmu.2020.00166
87. Flores-Montero J, Sanoja-Flores L, Paiva B, Puig N, Garcia-Sanchez O, Bottcher S, et al. Next generation flow for highly sensitive and standardized detection of minimal residual disease in multiple myeloma. Leukemia (2017) 31(10):2094–103. doi: 10.1038/leu.2017.29
88. Simon AK, Hollander GA, McMichael A. Evolution of the immune system in humans from infancy to old age. Proc Biol Sci (2015) 282(1821):20143085. doi: 10.1098/rspb.2014.3085
89. Chung HY, Kim DH, Lee EK, Chung KW, Chung S, Lee B, et al. Redefining chronic inflammation in aging and age-related diseases: Proposal of the senoinflammation concept. Aging Dis (2019) 10(2):367–82. doi: 10.14336/AD.2018.0324
90. Andreu-Ballester JC, Garcia-Ballesteros C, Benet-Campos C, Amigo V, Almela-Quilis A, Mayans J, et al. Values for alphabeta and gammadelta T-lymphocytes and CD4+, CD8+, and CD56+ subsets in healthy adult subjects: assessment by age and gender. Cytometry B Clin Cytom (2012) 82(4):238–44. doi: 10.1002/cyto.b.21020
Keywords: immune-monitoring, flow cytometry, innate myeloid cells, age-related reference values, standardization
Citation: van der Pan K, de Bruin-Versteeg S, Damasceno D, Hernández-Delgado A, van der Sluijs-Gelling AJ, van den Bossche WBL, de Laat IF, Díez P, Naber BAE, Diks AM, Berkowska MA, de Mooij B, Groenland RJ, de Bie FJ, Khatri I, Kassem S, de Jager AL, Louis A, Almeida J, van Gaans-van den Brink JAM, Barkoff A-M, He Q, Ferwerda G, Versteegen P, Berbers GAM, Orfao A, van Dongen JJM and Teodosio C (2022) Development of a standardized and validated flow cytometry approach for monitoring of innate myeloid immune cells in human blood. Front. Immunol. 13:935879. doi: 10.3389/fimmu.2022.935879
Received: 04 May 2022; Accepted: 18 August 2022;
Published: 14 September 2022.
Edited by:
Ildiko Rita Dunay, University Hospital Magdeburg, GermanyReviewed by:
Mary Canavan, Trinity College Dublin, IrelandNobuyuki Onai, Kanazawa Medical University, Japan
Copyright © 2022 van der Pan, de Bruin-Versteeg, Damasceno, Hernández-Delgado, van der Sluijs-Gelling, van den Bossche, de Laat, Díez, Naber, Diks, Berkowska, de Mooij, Groenland, de Bie, Khatri, Kassem, de Jager, Louis, Almeida, van Gaans-van den Brink, Barkoff, He, Ferwerda, Versteegen, Berbers, Orfao, van Dongen and Teodosio. This is an open-access article distributed under the terms of the Creative Commons Attribution License (CC BY). The use, distribution or reproduction in other forums is permitted, provided the original author(s) and the copyright owner(s) are credited and that the original publication in this journal is cited, in accordance with accepted academic practice. No use, distribution or reproduction is permitted which does not comply with these terms.
*Correspondence: Jacques J. M. van Dongen, Si5KLk0udmFuX0RvbmdlbkBsdW1jLm5s