 Laura Quotti Tubi1,2†
 Elisa Mandato1,2,3†
 Sara Canovas Nunes1,2,4
 Arash Arjomand1,2
 Fortunato Zaffino1,2
 Sabrina Manni1,2Alessandro Casellato1,2Paolo Macaccaro1,2
 Nicola Vitulo5
 Sara Zumerle6
 Odile Filhol7
 Brigitte Boldyreff8Christian W. Siebel9
 Antonella Viola6
 Giorgio Valle5Federica Mainoldi10
 Stefano Casola10Valeria Cancila11Alessandro Gulino11
 Claudio Tripodo10,11
 Marco Pizzi12
 Angelo Paolo Dei Tos12Livio Trentin1,2
 Gianpietro Semenzato1,2
 Francesco Piazza1,2*
- 1Department of Medicine, Division of Hematology, University of Padova, Padova, Italy
- 2Unit of Normal and Malignant Hematopoiesis, Laboratory of Myeloma and Lymphoma Pathobiology, Veneto of Molecular Medicine (VIMM), Padova, Italy
- 3Department of Medical Oncology, Dana-Farber Cancer Institute, Boston, MA, United States
- 4Division of Hematology/Oncology, Boston Children's Hospital, Harvard Medical School, Boston, MA, United States
- 5Department of Biology, Interdepartmental Research Center for Biotechnologies (CRIBI) Biotechnology Center, University of Padova, Padova, Italy
- 6Department of Biomedical Sciences, University of Padova, Padova, Italy
- 7Institut National de la Santé Et de la Recherche Médicale (INSERM) U1036, Institute de Recherches en Technologies et Sciences pour le Vivant/Biologie du Cancer et de l’Infection, Grenoble, France
- 8Kinase Detect ApS, Krusaa, Denmark
- 9Department of Discovery Oncology, Genentech, Inc., South San Francisco, CA, United States
- 10IFOM-ETS-The AIRC Institute of Molecular Oncology, Milan, Italy
- 11Tumor Immunology Unit, University of Palermo, Palermo, Italy
- 12Department of Medicine, Cytopathology and Surgical Pathology Unit, University of Padova, Padova, Italy
Serine-Threonine kinase CK2 supports malignant B-lymphocyte growth but its role in B-cell development and activation is largely unknown. Here, we describe the first B-cell specific knockout (KO) mouse model of the β regulatory subunit of CK2. CK2βKO mice present an increase in marginal zone (MZ) and a reduction in follicular B cells, suggesting a role for CK2 in the regulation of the B cell receptor (BCR) and NOTCH2 signaling pathways. Biochemical analyses demonstrate an increased activation of the NOTCH2 pathway in CK2βKO animals, which sustains MZ B-cell development. Transcriptomic analyses indicate alterations in biological processes involved in immune response and B-cell activation. Upon sheep red blood cells (SRBC) immunization CK2βKO mice exhibit enlarged germinal centers (GCs) but display a limited capacity to generate class-switched GC B cells and immunoglobulins. In vitro assays highlight that B cells lacking CK2β have an impaired signaling downstream of BCR, Toll-like receptor, CD40, and IL-4R all crucial for B-cell activation and antigen presenting efficiency. Somatic hypermutations analysis upon 4-Hydroxy-3-nitrophenylacetyl hapten conjugated to Chicken Gamma Globulin (NP-CGG) evidences a reduced NP-specific W33L mutation frequency in CK2βKO mice suggesting the importance of the β subunit in sustaining antibody affinity maturation. Lastly, since diffuse large B cell lymphoma (DLBCL) cells derive from GC or post-GC B cells and rely on CK2 for their survival, we sought to investigate the consequences of CK2 inhibition on B cell signaling in DLBCL cells. In line with the observations in our murine model, CK2 inactivation leads to signaling defects in pathways that are essential for malignant B-lymphocyte activation.
1 Introduction
In B lymphocytes intra- and intercellular signaling pathways are instrumental for cell fate commitment and acquisition of effector functions (1). Studies in the mouse have shown that two mature B cell subsets form the splenic white pulp, follicular (Fo) B cells that home in the follicles but can recirculate through the bone marrow (BM) upon activation and marginal zone (MZ) B cells that reside around the follicles at the edge between white and red pulp (2). The commitment of transitional type 2 (T2) B cells towards a Fo or a MZ B cell fate depends on the strength of the B cell receptor (BCR) signaling and on the activation of the NOTCH2 pathway (3). The “signal strength” model supports the concept that a strong BCR signal, which blocks the activation of NOTCH2, promotes Fo B cell development. After antigen (Ag) encounter, Fo B cells give rise to germinal centers (GCs), eventually generating long-lived memory B cells or plasma cells (PCs) homing to the BM (4). During the process of malignant B lymphocyte transformation, several genetic and epigenetic alterations can occur affecting B cell signaling (5). Components of the BCR cascade like CD79B and CARD11 or of the Toll-like Receptor (TLR) signaling, like MYD88, are mutated at high frequency in B-cell lymphomas (5–8). Besides genetic alterations, lymphoma B-cell growth is controlled by constitutively active protein kinases as demonstrated by the successful therapeutic strategy targeting Bruton’s Tyrosine Kinase (BTK) or Phosphoinositide 3 kinase (PI3K) in non-Hodgkin lymphomas (9). The Ser/Thr kinase CK2 is a tetramer composed of two catalytic α and two regulatory β subunits. These latter are required for substrate recruitment and kinase activity modulation (10). CK2 has been found overexpressed in a wide array of solid and hematologic tumors (11–15) and shown to sustain survival and proliferation of malignant B cells in chronic lymphocytic leukemia, multiple myeloma, mantle cell lymphoma, B-acute lymphoblastic leukemia and diffuse large B cell lymphoma (DLBCL) (13, 16–22). Multiple proteins taking part in hemo-lymphopoiesis are CK2 substrates, however, the physiological role of this kinase in B cell biology has been poorly explored. A recent work has shown that conditional knockout (KO) of the catalytic CK2α subunit in B cells causes a perturbed peripheral B cell differentiation characterized by an accumulation of MZ B cells driven by NOTCH2 (23).
To investigate the function of the regulatory β subunit of CK2 in B lymphocytes, we generated CK2β KO mice in CD19-expressing cells. Our data have highlighted increased NOTCH2 activation and impaired BCR signaling in CK2β-deficient cells, which skew splenic B cells towards a MZ rather than a Fo commitment. Intriguingly, CK2β-deficient B cells form larger germinal centers (GCs) and are defective in generating class-switched GC B cells. We show that CK2β exerts a major function in BCR, TLR, IL-4R and CD40 signaling pathways, impinging on multiple cascades, as its loss leads to a significantly reduced phosphorylation of BTK, NF-κB, AKT, and ERK1/2 upon receptors engagement. Of note, AKT-dependent FOXO1 phosphorylation as well as NF-κB and ERK1/2-mediated upregulation of AID, IRF4 and BCL6 are impaired. Consequently, CK2β-deficient B cells are unable to acquire full competency to generate an effective GC reaction and undergo class-switch recombination (CSR) and affinity maturation.
Our findings establish CK2β as a pivotal controller of peripheral B cell commitment and function with implications in B cell physiology and pathobiology.
2 Materials and methods
2.1 Mouse strains
Mice of the C57BL/6 and C57BL/6 CD19-Cre strains were purchased from Jackson Laboratories, USA. Mice carrying a loxP-flanked Csnk2b allele (Csnk2bfl) were provided by B. Boldyreff. To obtain Csnk2bfl/fl; CD19-Cre (CK2βκO) mice, Csnk2bwt/fl (24) and CD19-Cre mice were intercrossed. Csnk2b+/+; CD19-Cre mice were used as controls (CK2βCTRL). Mice were bred and housed in a pathogen–free colony at the animal facility of the Venetian Institute of Molecular Medicine (VIMM), Padova. The University of Padova Organism in charge for animal wellness (OPBA) approved the experimentation and declared that it fulfilled the National and European rules for animal studies. All the experimental procedures were authorized by the Italian Ministry of Health (Prot. number 126/2015 and Prot. 205/2022). Mice were sacrificed at 8-12 weeks to perform experiments.
2.2 Cell purification
Spleen and lymph nodes (LN) were disrupted and filtered from cell debris through a 70 μm cell strainer to prepare cell suspensions. BM cells were isolated from hind limbs. Bones were flushed with PBS + 2% FCS and filtered through a 70 μm cell strainer. Peripheral blood (PB) was obtained from the retro orbital venous plexus. Erythrocytes were removed using a lysis buffer (BD). B cells were purified by negative selection using EasySep™ Mouse B Cell Isolation Kit (Stemcell). Fo and MZ B cell subpopulations were purified with FACSAria (BD) using CD23-PE (B3B4), CD21-APC (7G6), B220/CD45R-APC-Cy7 (RA3-6B2), CD19-PerCP-Cy5.5 (1D3), all BD. After immunization with NP-CGG, GC B cells (B220high, IgD-, CD38low/-, PNA+, CD95+) were sorted by FACSAria (BD) using B220/CD45R-APC-Cy7 (RA3-6B2), IgD-V450, CD38-PE, peanut agglutinin (PNA-FITC) and CD95-PE-Cy7 (Jo2).
2.3 Flow cytometry
The following Abs were used: CD19-FITC (1D3), CD5-FITC (53-7.3), IgD-FITC (11-26c.2a), B220/CD45R-FITC (RA3-SB2), CD19-PE (1D3), IgM-PE (R6-60.2), CD184(CXCR4)-PE (2B11), CD138-PE (281-2), CD23-PE (B3B4), CD95(Fas)-PE-Cy7 (Jo2), CD19-PerCP-Cy5.5 (1D3), Streptavidin-PerCP-Cy5.5, CD25-APC (PC61), B220/CD45R-APC (RA3-6B2), CD21-APC (7G6), IgG1-APC (A85-1), CD86-APC (GL1), IgM-PE-Cy7 (R6-60.2), c-Kit(CD117)-PE-Cy7 (2B8), B220/CD45R-APC-Cy7 (RA3-6B2), IgD-V450 (11-26c.2a), biotin-IgG3 (R40-82) (all BD), CD27-AF647 (LG3A10) (BioLegend), Lectin from Arachis hypogaea-FITC (Sigma). Data were acquired on a FACSCanto or FACSAria cytometer and analyzed using FACSDiva 6.0 (BD) software. Cells were stained in PBS for 10 min at room temperature (RT) with Abs to the appropriate markers, preceded by the blockade of Fc receptors with CD16/CD32 Fc block (2.4G2) (BD) for 5 min at 4°C. Staining for BrdU was done as follows: after surface staining, cells were washed, resuspended in Cytofix/Cytoperm buffer (BD), incubated on ice for 20 min, washed with Perm/Wash buffer (BD) and incubated in Cytoperm permeabilization Buffer (BD) for 10 min on ice. After that, cells were washed with Perm/Wash buffer and incubated with DNase I (Sigma, 300μg/ml) in PBS plus Ca++ and Mg++ for 1 hour at 37°C. After washing, cells were incubated with FITC-conjugated anti-BrdU (BD) at RT for 30 min.
2.4 Absolute cell counts by flow cytometry
To determine the absolute number of B cells in peripheral blood, spleen and bone marrow we used the volumetric method in flow cytometry (25). In detail, 100µl of whole blood (with EDTA) was stained with anti-B220 antibody and then diluted in 2ml of lysis buffer; 200µl of sample were transferred into 96 well U bottom plate and read immediately in duplicate by FacsCanto using the same settings of flow rate (1µl/s) and sample volume (150µl) for all the samples analyzed. The absolute count of B220+ cells/µl was obtained using the formula: events recorded/150µl * dilution factor.
A similar approach and reading parameters were used also for spleen and bone marrow: total spleen and a smaller fraction of this organ were subsequently weighted. The smaller piece was smashed in PBS and filtered keeping a fixed resuspension volume of 2ml. For the bone marrow, one femur was processed for each mouse and bone flushing with PBS was followed by bone crushing and filtering keeping a fixed volume of 2ml. 200µl of this suspension were transferred into a 96 well V bottom plate, centrifuged, resuspended in 50µl of supernatant, and stained with anti-B220 antibody without lysing. Wash with 150µl of PBS and resuspended in 200µl final volume. Absolute counts were expressed as events in the whole spleen or femur.
2.5 Histology, immunohistochemistry and in situ mRNA hybridization
Samples were fixed in formalin and embedded in paraffin; 4 μm-thick sections were stained with H&E. The frequency of GCs was calculated by manually counting the number of GCs on spleen sections and dividing this value by the total spleen section area, in a blinded manner (four mice per genotype). The ratio MZ/lymphoid follicle area was esteemed as previously described (26). Image acquisition was performed using Leica DMD108 Digital Microimaging Device and Software (Leica Microsystems, Germany). Pictures were acquired using 4x, 10x, 20x and 40x objectives at RT. IHC analysis was performed using an automated platform (Bond-maX; Leica, Newcastle Upon Tyne, UK). Tissue sections were treated with the Bond Dewax Solution (Leica) at 72°C. The CPS/EDTA or Heat/EDTA Ag retrieval methods were used, according to the manufacturer’s instructions. Abs: polyclonal BCL6 (Santa Cruz). AICDA transcript (ID: 11628) was detected using RNAscope 2·5 HD Detection Reagent-BROWN (Advanced Cell Diagnostic) in accordance with the manufacturer’s protocol. Quantitative analyses of Aicda mRNA in situ hybridization signals were performed by calculating the average percentage of positive signals in five nonoverlapping fields at high-power magnification (X400) using the Positive Pixel Count v9 ImageScope software, Leica Biosystems.
2.6 Immunofluorescence
Spleens were fixed with 4% paraformaldehyde for 3 hours, washed with PBS and left overnight in 20% sucrose to dehydrate. Eight μm thick-sections were blocked with 5% BSA in PBS, stained with surface Abs, washed and blocked with 5% BSA plus 0.3% Triton X-100 in PBS, stained with intracellular Abs in 0.3% Triton X-100 in PBS and mounted with a Fluoromount Aqueous Mounting Medium (Sigma) without DAPI. Abs used: FITC anti-CD169 (MOMA1; AbD Serotec), PE anti-IgM (R6-60.2, BD), V450 anti-IgD (R6-60.2; BD). Images were acquired with Zeiss LSM 700 confocal microscope and analyzed with ZEN software. Pictures were acquired using 10x/0.3 dry and 20x/0.8 dry objectives at RT and merged in three-color images with ImageJ.
2.7 mRNA preparation and sequencing
Total RNA samples were processed according to Dynabeads® mRNA DIRECT™ Purification Kit (Ambion) to isolate mRNA. The template library was prepared using the Ion Total RNA-Seq Kit v2 (Life Technologies). Quantity and size distribution of the library were analyzed using the Agilent Bioanalyzer 2100 DNA HS chip. Emulsion PCR using 10μl of 100pM library was performed using a OneTouch 2 instrument (Life Technologies) with an Ion PI Template OT2 200 kit following manufacturer’s instructions. The enrichment of template library was achieved using the Ion OneTouch ES enrichment system (Life Technologies). Ion Proton sequencer and IPv2 chip were prepared according to the manufacturer’s recommendations.
2.8 Reads mapping and identification of differentially expressed genes
Sequencing adapters were trimmed using cutadapt software (27) and reads shorter than 16bp were removed. Reads were aligned on the reference mouse genome (GTCm38/mm10 version) downloaded from Ensembl (http://www.ensembl.org/) using a two-step procedure. At first, reads were aligned using the STAR program (28). All reads that did not align were realigned with bowtie (29) using a local alignment strategy. Gene expression was quantified using the Ensembl gene annotation, version 75, with htseq-count program (http://www-huber.embl.de/users/anders/HTSeq/doc/count.html). The row count matrix was normalized to consider the GC content biases and the different coverage depth. Normalization was performed using the full quantile normalization implemented EDASeq R package (30); the differentially expression analysis with the EdgeR package (31). Genes with a p value lower or equal 0.05 after false discovery rate correction were considered significantly differentially expressed.
To determine whether an a priori defined set of genes shows statistically significant, concordant differences between the two phenotypes, the normalized GSE89082 matrix was used for gene set enrichment analysis (GSEA) by doing 1000 gene set permutations and weighted signal2noise statistical analysis.
2.9 qRT-PCR
RNA was extracted with the RNeasy mini kit (Qiagen) and reverse transcribed using the Reverse Transcription System (Promega). qRT-PCR was performed on the ABI PRISM 7000 Sequence Detection System (Applied Biosystems) using the FastStart Universal SYBR GREEN master (ROX) (Roche) or with QuantStudio 5 (Thermofisher) using Luna Universal qPCR Master Mix (New England BiLabs). Data were analyzed with the ABI PRISM 7000 software (Applied Biosystems) and with on-line tools on the Applied Biosystems platform (Thermo Fisher cloud); mRNA levels were normalized on the expression of Gapdh/Actin. Results are presented as ratio between normalized expression of the gene of interest in the target and in the calibrator samples. The complete list of primers is reported in Supplemental Table 1.
2.10 Amplification of VH1-72 rearrangements from splenic GC B cells
NP-specific V-gene analysis was performed as described in (32). PCR primers used for amplification of the VH1-72 rearrangements are reported in Supplemental Table 2. Briefly, genomic DNA and RNA were extracted from sorted GC B cells with RNeasy AllPrep MicroKit (QIAGEN) following the manufacturer’s protocol. For VH1-72 gene amplification 2 rounds of PCR amplification were performed using 5µl Pfu Buffer (10x), 1µl Pfu polymerase, 1µl dNTPs 10mM, 1ul of each primer (VH186.2 Fw and JH2 Rv for the first round; VH186.2 inner primer Fw and JH2 Rv for the second round), water and DNA to reach 50µl final volume. After initial denaturation at 95° for 2’30’’, samples were subjected to 20 (the first PCR round) or 30 cycles (the second PCR round) of PCR amplification (30’’ at 95°C, 30 s at 70°C, and 1’30’’ at 72°C) with final elongation for 5’ at 72°C. To inactivate Pfu polymerase, second-round PCR products were incubated for 30’ at -20°C. PCR products were gel-purified and cloned into pGEM-T easy vector (Promega). Plasmids containing inserts were subjected to Sanger sequencing. IgV gene mutational analysis was performed using IgBlast software.
2.11 Cell lysis and Western Blot (WB)
Five-7 x 10⁶ cells were prepared by lysis in a buffer made up of 20 mM Tris, 150 mM NaCl, 2 mM EDTA (ethylenediaminetetraacetic acid), 2 mM EGTA (ethylene glycol-tetra-acetic acid), 0.5% v/v Triton X-100 supplemented with protease inhibitor cocktail (Sigma), 1 mM DTT (dithiothreitol; Amersham Biosciences), 1 mM PMSF (phenyl-methyl-sulfonyl fluoride; Sigma), 1 mM okadaic acid (Sigma) and phosphatase inhibitor cocktail (Thermo Scientific). Proteins were subjected to SDS-PAGE, transferred to PVDF membranes and immunoblotted with the following primary Abs: anti-CK2α (provided by Dr. M. Ruzzene, University of Padova, Italy), anti-CK2β, anti-RELA, anti-FOXO1 (Abcam), anti-pRELA S529 (recognizes S527 in mouse), anti-IRF4, anti-BLIMP-1, anti-BCL6 (Santa Cruz), anti-GAPDH (Ambion), anti-pAKT S129 (provided by Dr. M. Ruzzene, University of Padova, Italy), anti-AID (Invitrogen), anti-NOTCH2 (D76A6), anti-pAKT S473, anti-AKT, anti-pERK1/2 T202/Y204, anti-pBTK Y223, anti-ERK1/2, anti-pPTEN S380/T382/T383, PTEN, anti-pFOXO1 S256, anti-pSTAT6 Y705, anti-STAT6 (Cell Signaling). Secondary Abs: anti-rabbit IgG HRP-linked Ab (Cell Signaling), HRP labeled goat anti-mouse IgG (KPL), goat anti-rat IgG HRP-conjugated (Calbiochem), donkey anti-goat IgG HRP-conjugated (Santa Cruz).
2.12 B cell culture
Splenic B cells were cultured (106 cells/ml) in RPMI (Euroclone) + 10% FCS (Euroclone) and 2-mercaptoethanol (50 mM; Life Technologies) for 72h with 20 μg/ml LPS (Sigma) ± 10 ng/ml IL-4 (Sigma) or for 48h with 10 μg/ml anti-CD40 (BD Pharmingen) ± 10 ng/ml IL-4 (Sigma). To perform fast stimulation 5x10⁶ B cells were resuspended in 400ul PBS without FCS and treated for 5 and 10 minutes with 10μg/ml anti-CD40 (BD Pharmingen) ± 10 ng/ml IL-4 or for 1, 5, 10 minutes with 10 μg/ml anti-Mouse IgM (Jackson Immuno Research); the incubation was performed in water bath at 37°C followed by the addiction of ice-cold PBS to stop the stimulation; cells were immediately pelleted and lysed. DLBCL cell lines OCI-Ly1, OCI-Ly18 and Pfeiffer were purchased from the Deutsche Sammlung von Mikroorganismen und Zellkulturen (DSMZ, Germany). OCI-Ly1 were maintained in IMDM (Invitrogen) + 20% FBS + 2-Mercaptoethanol (50 mM); OCI-Ly18 in RPMI + 10% FBS + 2-Mercaptoethanol (50 mM); Pfeiffer in RPMI + 10% FBS + Sodium Pyruvate 1 mM. The cells were maintained in an incubator at 37°C in a modified atmosphere with 5% CO2. Testing for Mycoplasma infection was carried out on a monthly basis. All procedures of handling were carried out under a sterile hood.
2.13 In vivo immunization
Mice were immunized intraperitoneally with 200 μl of SRBC (Microbiol) diluted 1:10 in PBS or with 100 μl of Keyhole Limpet Hemocyanin (NP-CGG) (Biosearch Technologies) previously dissolved in PBS and mixed at 1:1 ratio with Alum (Thermo Scientific). After 14 days, PB was withdrawn to perform ELISA and spleens were removed for immunohistochemical and cytometric analysis.
2.14 Continuous Brdu labeling
Mice were given sterile drinking water containing 0.5 mg/ml BrdU (Sigma) plus 1% sucrose for 6 days. BrdU-containing drinking water was changed after 3 days.
2.15 In vivo inhibition of NOTCH2 activation
Mice were injected intraperitoneally with 15 mg/kg α-NRR2, provided by Dr. C.W. Siebel (Genentech, CA, USA) or IgG (Jackson ImmunoResearch Laboratories, Inc.). After 72 hours from the injection of a single dose of α-NRR2, mice were sacrificed to analyze the spleen.
2.16 In vitro CK2 kinase activity assay
CK2 activity in whole cell lysates was measured using Casein Kinase 2 Assay Kit (Millipore) with a CK2β-specific substrate peptide, provided by Prof. O. Marin (University of Padova, Italy). Cell lysates (2.5 μg) were incubated with the peptide (200 μM) in ADBI buffer, according to the manufacturer’s instructions. Counts per minute (Cpm) of enzyme samples were normalized to those of control samples containing no peptide. CK2β-specific peptide sequence: MSGDEMIFDPTMSK8P(NH2)
2.17 Enzyme linked immunosorbent assay
For measurements of Ig production after immunization with SRBC or B cell stimulation with LPS ± IL-4, ELISA assays were performed on mouse serum or cell culture supernatant with Mouse Immunoglobulin Isotyping ELISA kit (BD), according to the manufacturers’ instructions. To evaluate the immune response after NP-CGG immunization, a direct ELISA test was performed to measure IgG1 production against NP-23 and NP-4 antigens; detailed information about this procedure can be found in Supplemental Material.
2.18 Analysis of Ca2+ mobilization
Splenic B cells pretreated or not with CX-4945 (Sellekchem) 5μM for 3 hours, were loaded with Fluo4-AM (4μg/ml; Molecular Probes) and FuraRed (16μg/ml; Molecular Probes), sulfinpyrazone (250μM; Sigma) and Pluronic F-127 (0,1% w/v, Life Technologies) in RPMI for 30 min at 37°C in the dark. Cells were washed with RPMI and resuspended in warm PBS at the density of 106 cells/ml. After recording for 30 sec to establish the baseline, cells were stimulated with 20 μg/ml F(ab’)2 rabbit anti–mouse IgM (Jackson ImmunoResearch Laboratories, Inc.) for 6.5 min. Then, ionomycin (2 μg/ml) was added to allow the complete emptying of Ca++ stores. Measurements were monitored using a FACSCanto cytometer and analyzed using FlowJo software (Tree Star).
2.19 IP3 uncaging
B cells were seeded on poly-L-lysine (100 μg/ml, Sigma) coated coverslips (105 cells) and loaded with caged-IP3 (1 μM; Enzo Life Science), Fluo-4-AM (0,5 μM; Molecular Probes), Pluronic F-127 (0,1% w/v; Life Technologies), sulfinpyrazone (250 μM; Sigma) in RPMI without FCS for 30 min at 37°C. Live calcium imaging was performed in HBSS using a Zeiss LSM700 laser scanning confocal microscope. Time-lapse images were acquired for 1 min (0,6 frame/sec), using a 40x water immersion objective (Zeiss W Plan-Apochromat 40x/1.0 DIC M27). Fluo-4-AM was excited with a 488-nm laser (0,5% power). Regions of interest (ROIs) were drawn on four distinct cells per field; the UV laser (405 nm, 100% power, 10 ms pulse) was used to release active IP3 within the ROIs. Images were analyzed using ImageJ software. Fluo-4 traces were generated by averaging pixel signals within the ROIs and normalized on the baseline fluorescence of the first five frames (ΔF/F0).
2.20 Statistical analysis
Data were evaluated for their statistical significance with the two-tailed Student’s t test. Values were considered significant at p value below 0.05. Prism 6 (GraphPad Software) was used for analyses.
2.21 Accession number
The complete RNA-seq data are available at the Gene Expression Omnibus (http://www.ncbi.nlm.nih.gov/geo) under accession number GSE89082.
3 Results
3.1 Loss of CK2β causes a reduction in recirculating B cells and hypogammaglobulinemia
To study the in vivo role of CK2β in B cell development, we generated a conditional B-cell specific KO model by crossing Csnk2b+/+ or Csnk2bfl/fl to CD19-Cre transgenic mice obtaining Csnk2b+/+; CD19-Cre control (CK2βCTRL) and Csnk2bfl/fl; CD19-Cre KO (CK2βKO) mice, respectively. Analysis of B cells purified from bone marrow (BM) and spleen confirmed that CK2βKO mice had markedly decreased CK2β mRNA and protein levels when compared to CK2βCTRL animals (Figures 1A, B). Of note, we observed a stronger CK2β deletion in the spleen than in the BM, without alterations in CK2α expression (Figure 1B). The residue levels of CK2β in KO samples is due to the suboptimal activity of Cre recombinase in CD19-Cre mouse model; indeed, as already reported, the CD19 promoter is not 100% efficient showing 75-80% cutting capability in bone marrow-derived pre-B cells that reaches 90-95% in splenic B cells (33, 34). The decreased levels of the β subunit impair CK2α catalytic activity compromising the function of the holoenzyme, as demonstrated by in vitro kinase assays in splenic B lymphocytes (Figure 1C). To confirm the reduced catalytic capacity of CK2 we assessed the phosphorylation levels of the transcription factor p65/RelA and the kinase AKT, which are well established CK2 targets. Western blot (WB) analysis demonstrated a marked reduction in CK2-mediated phosphorylation of p65/RelAS527 and AKTS129 in CK2βKO relative to CK2βCTRL B cells (Figure 1D).
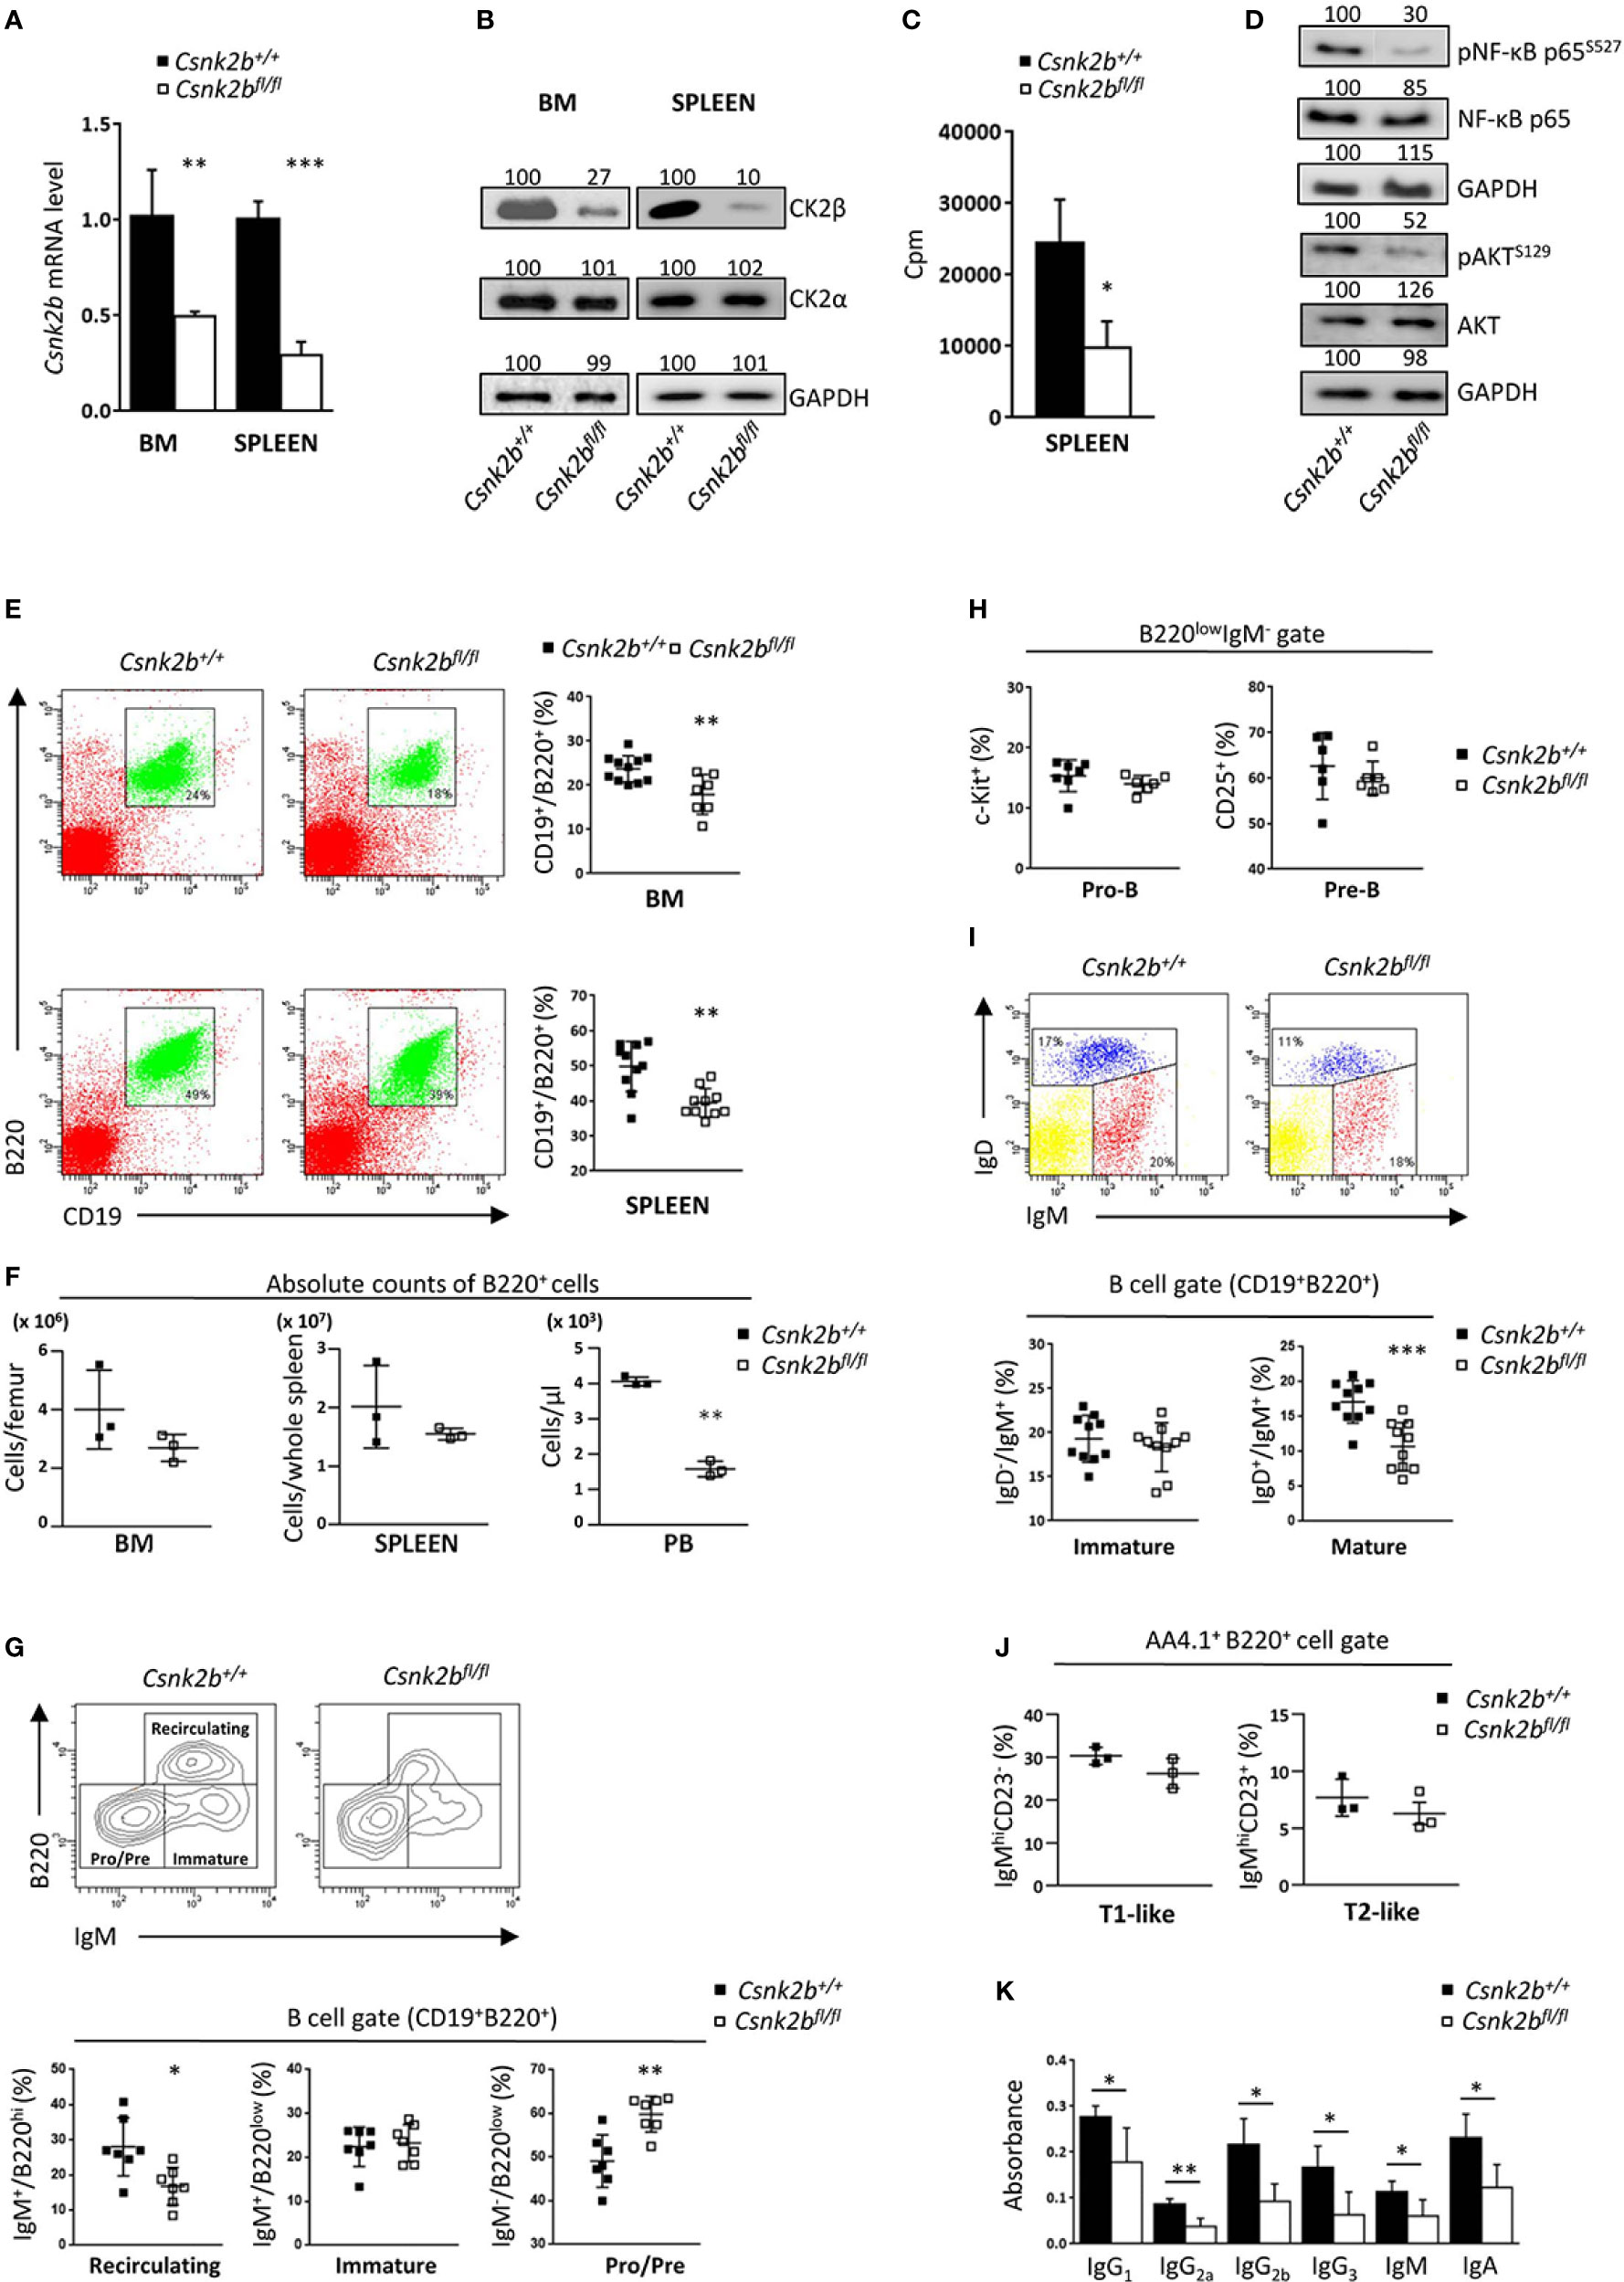
Figure 1 CK2β KO in B cells affects B cell number and Igs production. (A) CD19+ sorted marrow and splenic B cells analyzed for the expression of Csnk2b by qRT-PCR. The expression was corrected for Actin levels and normalized to CTRL B cells. Data are shown as mean ± SD (n=4 BM, n=5 spleen). Statistical significance was determined by Student’s t test (**p < 0.01; ***p < 0.001). (B) CK2α and β levels in CK2βCTRL and CK2βκO marrow and splenic purified B cells were assessed by WB. GAPDH was used as loading control (whole cell lysates; one representative of 3 independent experiments). Band quantitation was calculated using Quantity One 4.6.6 software; obtained values are reported on top of each band. (C) CK2 kinase activity in purified splenic B cells from CK2βCTRL and CK2βκO mice. Data are shown as mean ± SD (n=3 mice per genotype, 2 independent experiments). Statistical significance was determined by Student’s t test (*p < 0.05). In (A-C) the purity of sorted B cells was ≥94%. (D) p65/RELA and AKT phosphorylation in purified splenic B cells obtained by magnetic separation from CK2βCTRL and CK2βκO mice was assessed by WB. GAPDH was used as a loading control (whole cell lysates, one representative of 3 independent experiments). Band quantitation was calculated using Quantity One 4.6.6 software; obtained values are reported on top of each band. (E) Right, Scatter plots representing the percentage of CD19+B220+ cells in BM and spleen of CK2βCTRL and CK2βκO mice, with each symbol representing a mouse. Left, for each genotype one representative dot plot is shown, numbers in gates indicate the percentage of CD19+B220+ cells. Statistical significance was determined by Student’s t test (**p < 0.01). (F) Graphs summarizing absolute counts of B220+ cells in BM, spleen and PB. Data are reported as mean ± SD, statistical significance was determined by Student’s t test (**p < 0.01). (G) Bottom, Scatter plots summarizing the percentages of recirculating, immature, and Pre/Pro B cell subsets in the BM of CK2βCTRL and CK2βκO mice, with each symbol representing a mouse. Data are shown as mean ± SD. Statistical significance was determined by Student’s t test (**p < 0.01; *p < 0.05). Top, one representative contour plot per genotype shows the gating strategy. (H) Pro-B (CD19+B220lowIgM-c-Kit+) and Pre-B (CD19+B220lowIgM-CD25+) cell percentages in the BM of CK2βCTRL and CK2βκO mice. Data are shown as mean ± SD. Statistical significance was determined by Student’s t test (ns). (I) Bottom, Graphs representing the percentages of BM mature (B220+CD19+IgM+/-IgD+) and immature (B220+CD19+IgM+IgD-) B cells in CK2βCTRL and CK2βκO mice. Data are shown as mean ± SD. Statistical significance was determined by Student’s t test (***p < 0.001). Top, one representative dot plot is shown for each genotype. (J) Graphs showing percentages of T1-like (B220+AA4.1+IgMhiCD23-) and T2-like (B220+AA4.1+IgMhiCD23+) B cells in the BM of CK2βCTRL and CK2βκO mice. Values are reported as mean ± SD. Statistical analysis was performed with Mann-Whitney test (ns). (K) IgH production quantified by ELISA in the sera of CK2βCTRL and CK2βκO mice. Data are shown as mean ± SD (n=4). Statistical significance was determined by Student’s t test (**p < 0.01; *p < 0.05). BM, bone marrow.
Flow cytometric analysis highlighted a significant reduction in the percentages of B cells (CD19+B220+) in BM and spleen of CK2βKO mice (Figure 1E) that was also observed in peripheral blood (PB) and peritoneal cavity (PerC) (Supplemental Figure 1). However, evaluation of B220+ absolute cell counts evidenced no differences in BM and spleen with B lymphopenia limited to PB (Figure 1F). To deepen our analysis, we examined BM B-cell subsets highlighting a significant reduction in recirculating (B220hiIgM+) and an increased percentage of Pre/Pro (B220lowIgM-) without changes in immature (B220lowIgM+) B cells in CK2βKO mice as compared to CK2βCTRL animals (Figure 1G). Quantification of Pro-B (CD19+B220lowIgM-Kit+) and Pre-B (CD19+B220lowIgM-CD25+) cell subsets revealed no significant differences among genotypes (Figure 1H). IgM/IgD surface staining confirmed no changes in immature (B220+CD19+IgM+IgD-) B cells and a significant reduction in mature B cells (B220+CD19+IgM+IgD+) in CK2βKO mice as compared to control animals (Figure 1I). We also investigated the features of immature Transitional (T) T1-like and T2-like B cells finding no differences between CK2βKO and CK2βCTRL mice (Figure 2J).
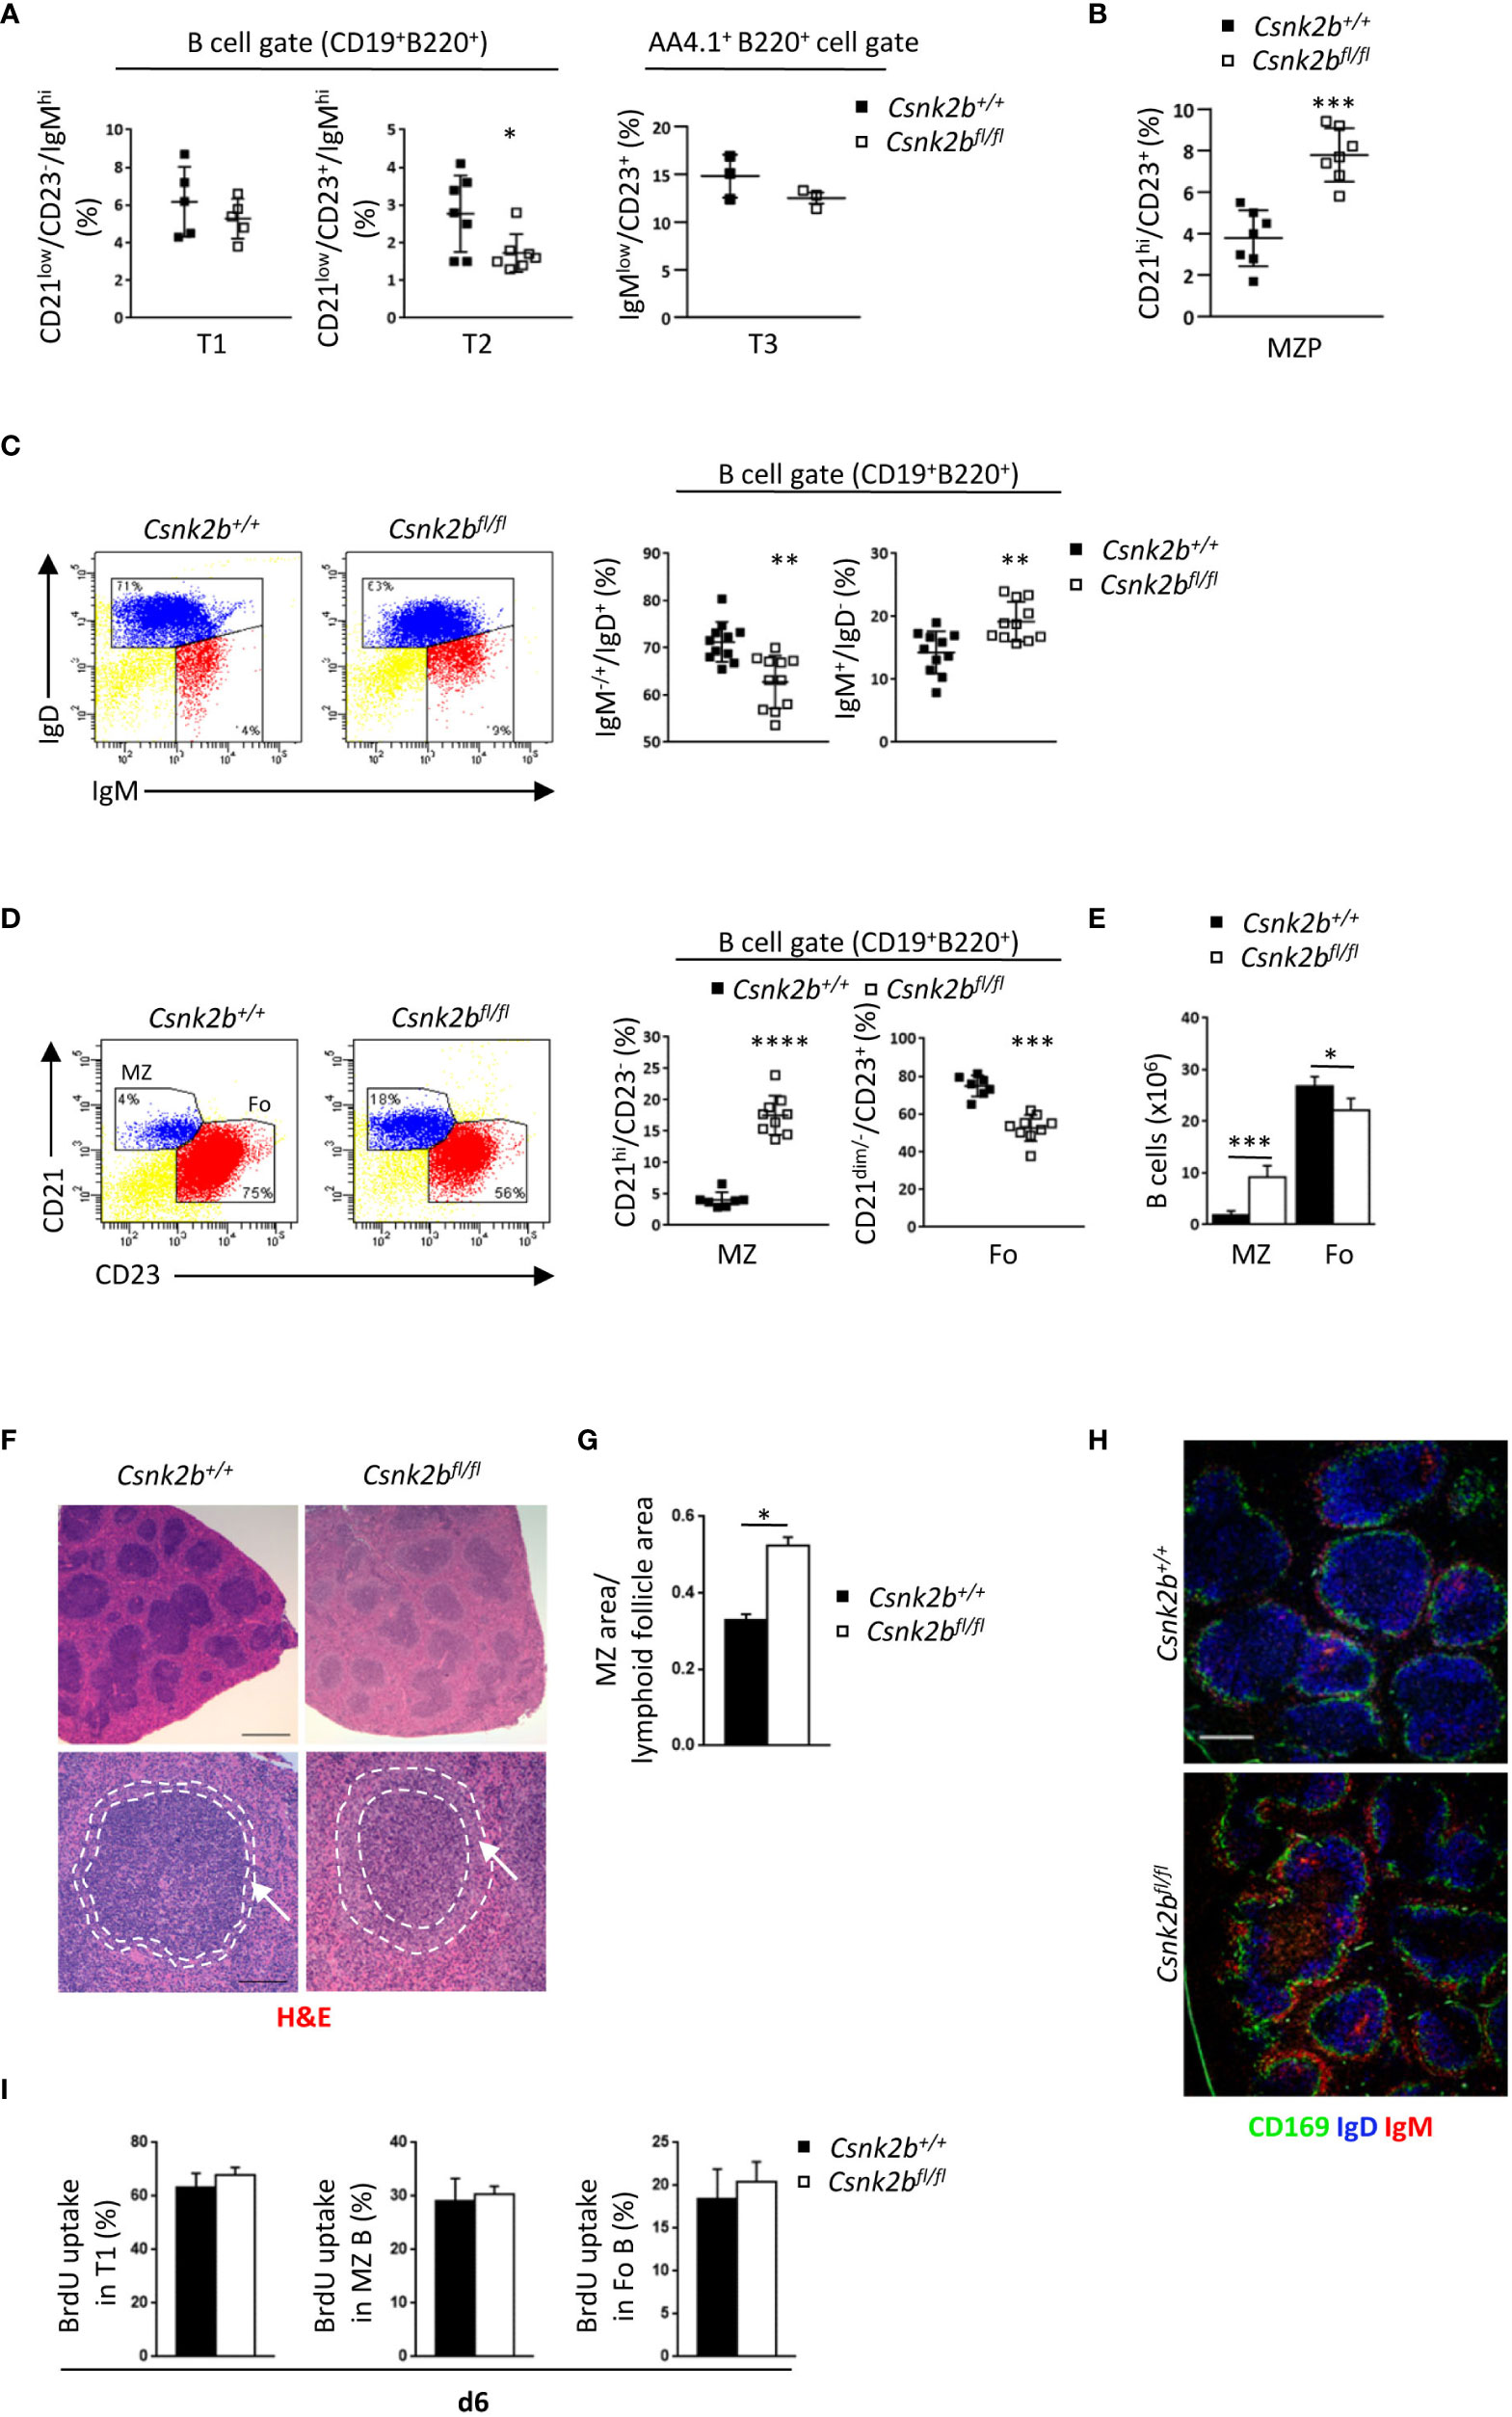
Figure 2 Phenotypic characterization of splenic B cell subsets in CK2βCTRL and CK2βκO mice. (A) Scatter plots summarizing the percentage of T1 (B220+CD19+CD21lowCD23-IgMhi), T2 (B220+CD19+CD21lowCD23+IgMhi) and T3 (B220+AA4.1+IgMlowCD23+) B cells in the spleen of CK2βCTRL and CK2βκO mice, with each symbol representing a mouse. Statistical significance was determined by Student’s t test (*p < 0.05). (B) Scatter plots showing the percentages of MZP (CD21hiCD23+) B cells in the spleen of CK2βCTRL and CK2βκO mice. Data are represented as mean± SD. Statistical significance was determined by Student’s t test (***p < 0.001). (C) Right, Scatter plots representing the percentage of splenic B220+CD19+IgM+/-IgD+ and B220+CD19+IgM+IgD- B cells of CK2βCTRL and CK2βκO mice, with each symbol representing a mouse. Data are shown as mean ± SD. Statistical significance was determined by Student’s t test (**p < 0.01). Left, one representative dot plot is shown for each genotype. (D) (Right) Scatter plots summarizing the percentage of MZ (B220+CD19+CD21hiCD23-) and Fo (B220+CD19+CD21dim/-CD23+) B cells in the spleen of CK2βCTRL and CK2βκO mice. Statistical significance was determined by Student’s t test (***p < 0.001; ****p < 0.0001). Left, one dot plot is presented for each genotype, numbers in gates indicate the percentages of Fo and MZ B cells. (E) Histogram summarizing the absolute number of Fo and MZ B cells in CK2βCTRL and CK2βκO mice. Data are shown as mean ± SD (n=7). Statistical significance was determined by Student’s t test (*p < 0.05; ***p < 0.001). (F) Spleen sections from CK2βCTRL and CK2βκO mice were stained with H&E. Bar, 500μm upper panels; 100μm lower panels. Image acquisition was performed using the Leica DMD108 Digital Microimaging Device and Software (Leica Microsystems, Germany). Data show results from one representative mouse out of 3. Arrows indicate the MZ. (G) Ratio between MZ and lymphoid follicle areas in the spleen of CK2βCTRL and CK2βκO mice was calculated using the Leica DMD108 Digital Microimaging Device and Software (2 mice per genotype; 2 independent experiments; +/+= 32 follicles; fl/fl= 54 follicles). Data are shown as mean ± SD. Statistical significance was determined by Student’s t test (*p < 0.05). (H) CD169 (green), IgD (blue) and IgM (red) expression in spleen sections from CK2βCTRL and CK2βκO mice was analyzed by IF. One representative mouse out of 3 per genotype is shown; 3 independent experiments. Bar, 50μm. Images were acquired with Zeiss LSM 700 confocal microscope and ZEN software. Pictures were acquired using 10x/0.3 dry and 20x/0.8 dry objectives at room temperature and merged in three-color images with ImageJ software. (I) Quantification of the percentage of T1, MZ and Fo B cells that incorporated BrdU after continuous administration for 6 days in CK2βCTRL (n=5) and CK2βκO (n=4) mice. Three independent experiments. MZ, marginal zone.
Remarkably, the quantification of basal serum immunoglobulin (Ig) levels revealed that all the Ig subclasses were significantly reduced in CK2βKO mice as compared to CK2βCTRL animals, with no substantial differences among the isotypes (Figure 1K). These data suggest that CK2β KO does not substantially affect BM B-cell development.
3.2 Decreased Fo and increased MZ B cells in CK2βKO mice
The reduction in BM mature B cells and serum Ig levels in CK2βKO mice, prompted us to evaluate B-cell maturation in the spleen.
We observed no variations in the percentages of transitional type 1 (T1: B220+CD19+CD21lowCD23-IgMhi) and type 3 (T3: B220+ AA4.1+CD23+IgMlow) B cells but evidenced a significant decrease in transitional type 2 (T2: B220+CD19+CD21lowCD23+IgMhi) B cells in CK2βKO as compared to CK2βCTRL mice (Figure 2A). We then analyzed the subset of marginal zone precursors (MZP) that resulted to be expanded in the spleen of CK2βKO mice (Figure 2B).
Moreover, CK2βKO mice showed a reduction in B220+CD19+IgM+/-IgD+ cells (including T2 and Fo B cells), while the B220+CD19+IgM+IgD- subset (including T1 and MZ B cells) was increased in comparison to CK2βCTRL mice (Figure 2C). To gain better insights into the most mature populations, we stained splenic B cells with anti-CD23 and anti-CD21 antibodies and evidenced a significant decrease in Fo (B220+CD19+CD21dim/-CD23+) and an increase in MZ (B220+CD19+CD21hiCD23-) B cells, both in percentages and absolute numbers (Figures 2D, E). To deepen these results, we performed histological and immunofluorescence (IF) analyses of spleen sections. Hematoxylin and eosin (H&E) staining revealed less dense cellular lymphoid cuffs in the white pulp of CK2βKO mice, which on average appeared paler than those of CK2βCTRL animals (Figure 2F, top). MZs appeared expanded in CK2βKO as compared to CK2βCTRL mice (Figure 2F, bottom images) and we quantified a 1.6-fold increase in the ratio of MZ versus lymphoid follicle areas (Figure 2G). IF staining with anti-IgD, anti-CD169 (MOMA1) and anti-IgM confirmed the enlargement of the MZ, composed by the external layer of IgM+ B cells and the decrease in IgD+ Fo B cells within the follicles (Figure 2H). To assess if the decrease in Fo B cells could be the consequence of a reduced lifespan/proliferation of CK2βKO B cells, we performed BrdU incorporation experiments in vivo. No differences could be detected in the percentages of BrdU+ cells in any splenic subpopulation (Figure 2I). These data suggest that in both CK2βCTRL and CK2βKO mice the same amount of T1 B cells migrates to the spleen, but in the latter mice these cells are more skewed towards a MZ rather than a Fo B cell fate.
3.3 RNA sequencing analysis highlights a critical role for CK2β in peripheral B cell activation and the germinal center reaction
To gain insights into the mechanisms underlying the Fo and MZ B cell unbalanced proportions in CK2βKO animals, we performed RNA sequencing (RNAseq) on total splenic B cells purified from mice in basal condition. We identified 844 differentially expressed genes between CK2βKO and CK2βCTRL mice. Precisely, 445 genes were up-regulated and 399 were down-regulated in CK2βKO as compared to CK2βCTRL mice (Supplemental Tables 3, 4).
We performed gene set enrichment analysis (GSEA) on our RNAseq data. Figure 3A depicts the heat map of the top 50 enriched transcripts for each phenotype and their respective enrichment score in KO mice after gene set permutation analysis. This analysis confirmed qRT-PCR results (Figure 1A) evidencing a marked decrease in Csnk2b expression in KO animals (marked with a blue dot in Figure 3A). Interestingly, among the differentially expressed genes in CK2βKO mice, Ackr3 (also known as Cxcr7), a receptor for CXCL12 on MZ B cells, which promotes their retention in the MZ (35), Asb2, which facilitates basic helix-loop-helix transcription factors ubiquitination promoting MZ B cell formation (36), and other bona fide MZ B cell markers such as Rgs10 and Dusp16 (37, 38) (are significantly overexpressed when compared to controls (marked with a red star in Figure 3A). Many genes significantly downregulated in CK2βKO mice when compared to control animals are relevant to GC B-cell biology (all marked with a blue star in Figure 3A). Among them Aicda, whose gene product, activation-induced cytidine deaminase (AID), initiates somatic hypermutation (SHM) and CSR (39), Fas, which encodes a receptor crucial to maintain GC B-cell homeostasis (40), Efnb1 and S1pr2, both important in regulating B-T cell dynamics in the GCs (41, 42). Next, we performed GO enrichment analysis and identified key biological processes significantly downregulated in CK2βKO mice: “Immunoglobulin Production”, “Regulation Of B Cell Activation”, and “Somatic Diversification Of Immunoglobulins” (Heatmaps in Figures 3B-D and they respective GSEA enrichment plots in Figures 3E-G). Within these processes, multiple gene clusters of light chain immunoglobulin kappa variable region (Igkv) and immunoglobulin heavy chain variable region (Ighv) are found downmodulated in CK2βKO mice, hinting towards an ineffective immune response. Of note, also Bcl6, a transcriptional repressor essential for the GC reaction that prevents premature activation and differentiation of GC B cells, and Foxp1, a transcription factor crucial for Fo and B1 B cell development and antibody (Ab) production (43) are under expressed in KO animals (both genes highlighted with a blue star in Figure 3B). These findings lead us to hypothesize that CK2β loss affects peripheral B cell activation by interfering with the GC reaction and by causing increased differentiation of T2 B cells into MZ B cells and decreased somatic diversification.
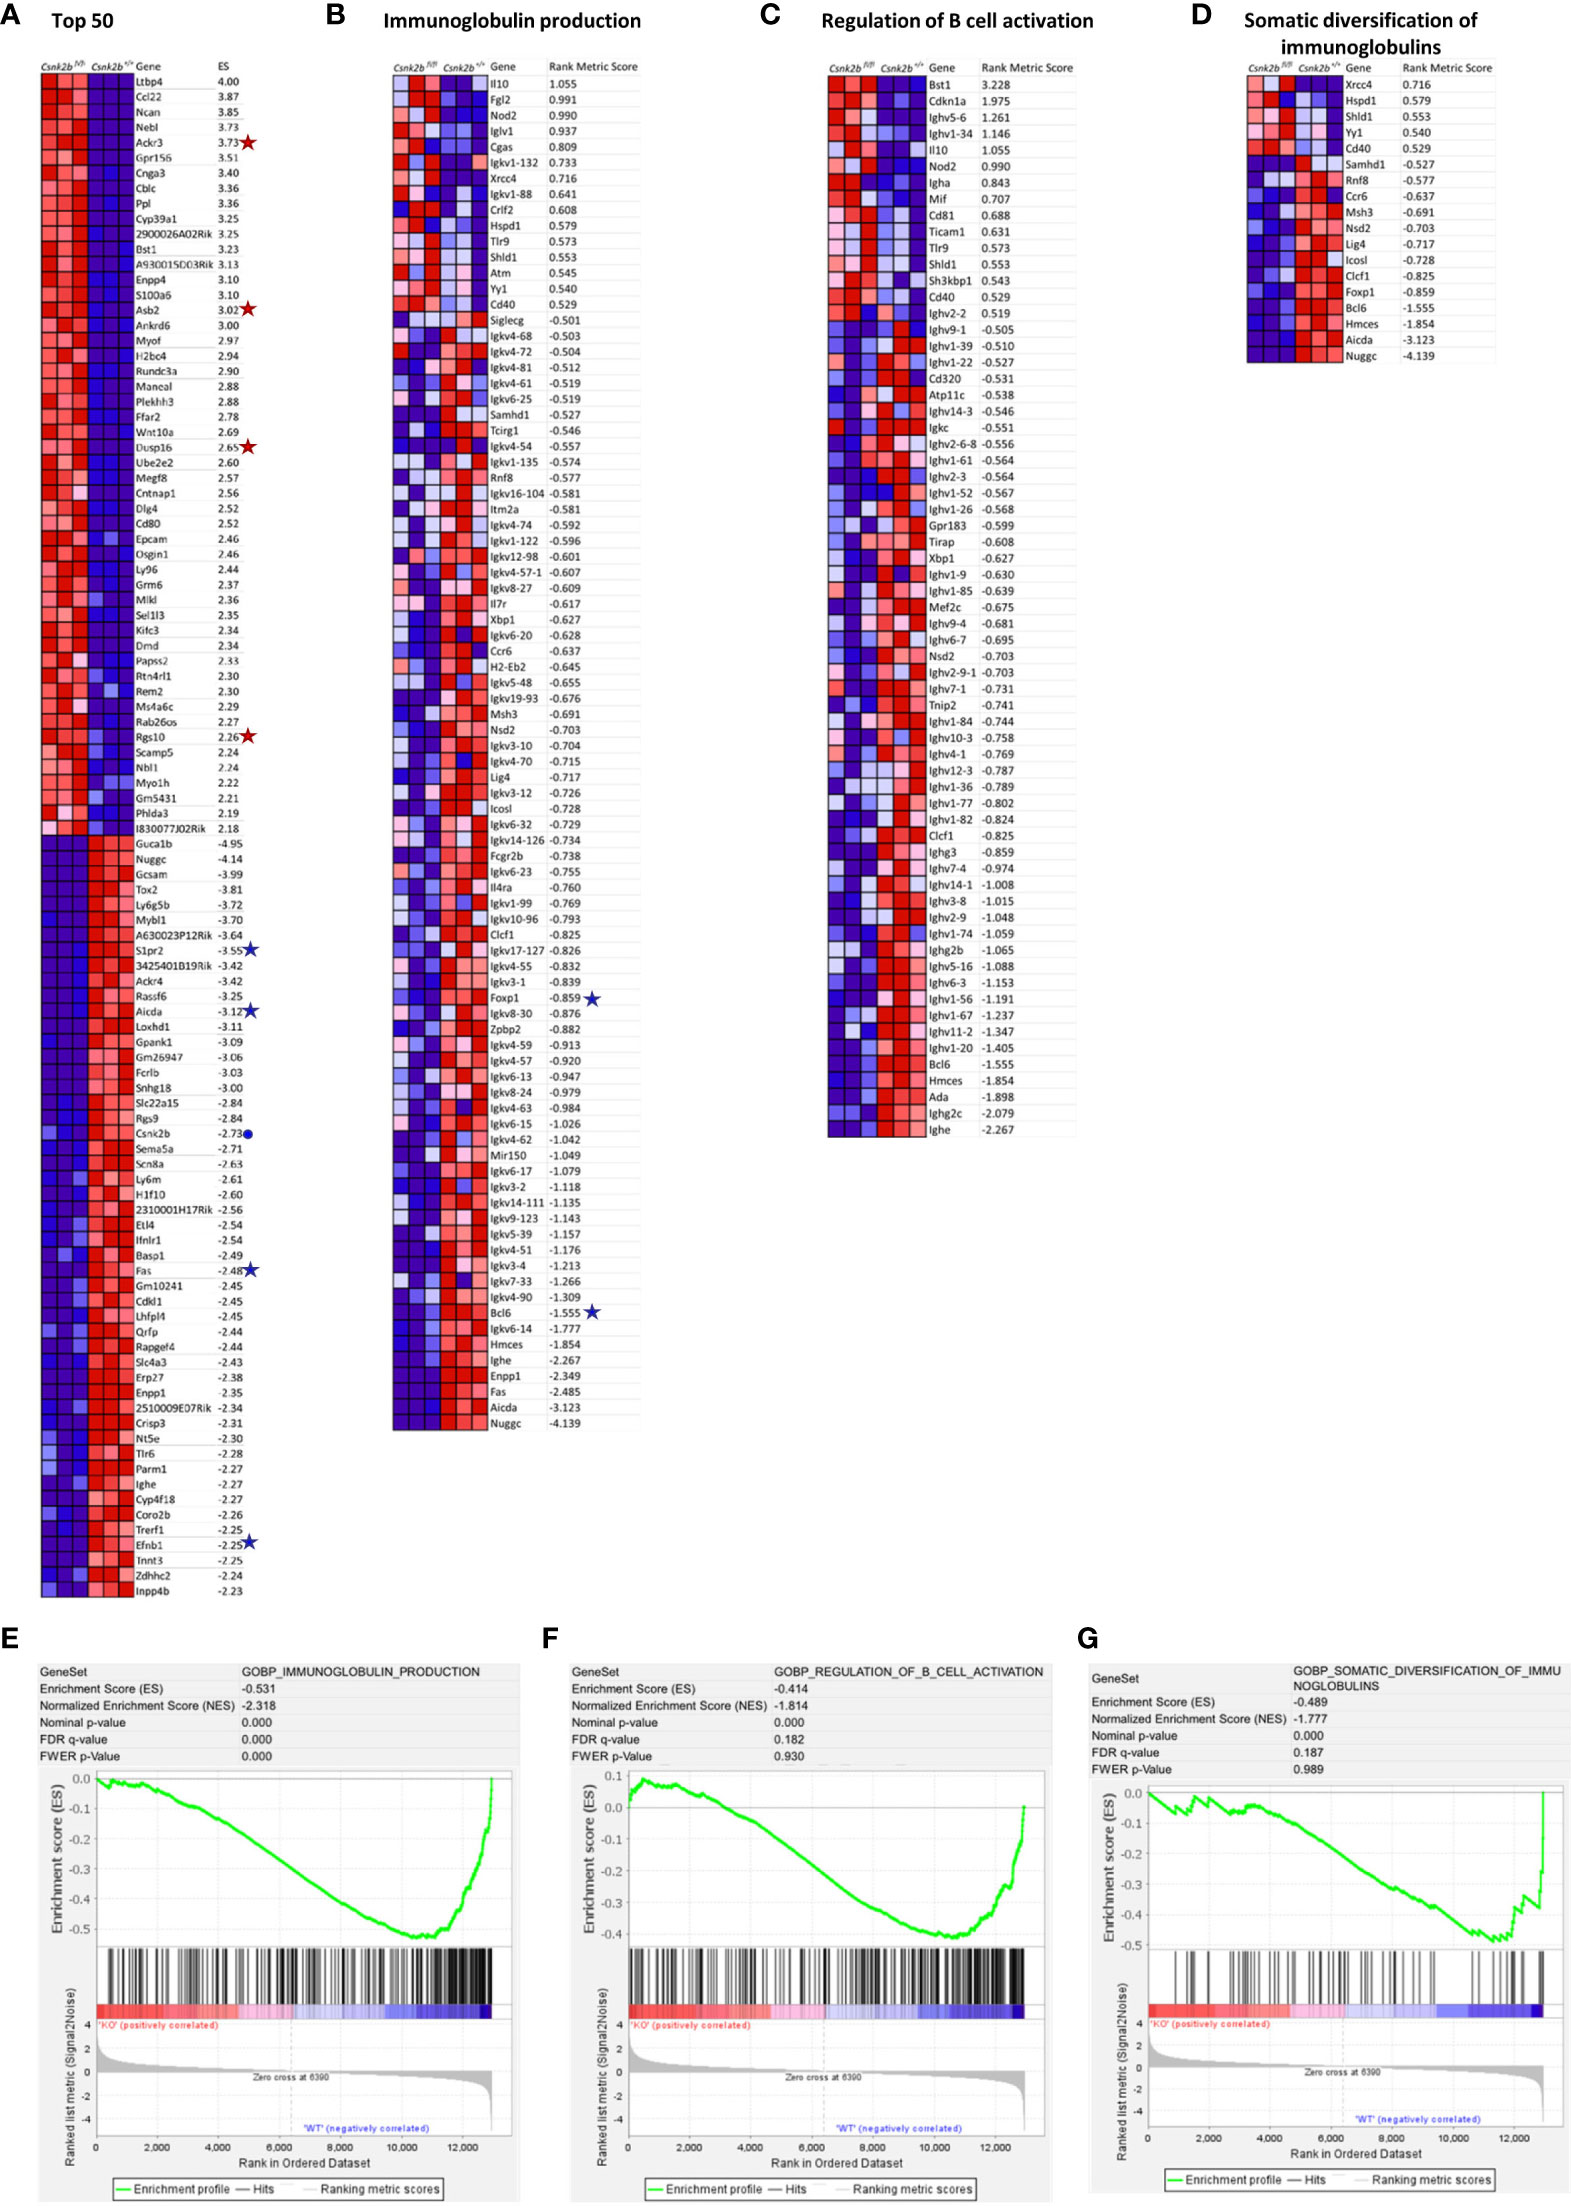
Figure 3 GSEA by gene set permutations of RNAseq data in CK2βCTRL and CK2βκO B cells in basal condition. (A) Heatmap of the top 50 features for each phenotype in GSE89082 as accessed by gene markers analysis. Expression values are represented as colors, where the range of colors (red, pink, light blue, dark blue) shows the range of expression values (high, moderate, low, lowest). (B-D) Heatmaps showing leading edge features (scores >0.5 and <-0.5) related to Gene Set GO biological process Ig production, Regulation of B-cell activation and Somatic Diversification of Igs respectively. (E) Enrichment score curves of significantly enriched Gene Set GO biological process Ig production. (F) Enrichment score curves of significantly enriched Gene Set GO biological process Regulation of B-cell activation. (G) Enrichment score curves of significantly enriched Gene Set GO biological process Somatic Diversification of Igs. In (A, B) genes of interest are flanked by a symbol: a blue dot for Csnk2b, red stars for over-expressed genes and blue stars for down-regulated genes in CK2βKO samples. In this figure the purity of B cells isolated through sorting was >95%.
3.4 CK2βKO B cells show increased activation of the NOTCH2 pathway
Since NOTCH signaling is an essential regulator of MZ B cell commitment (2), we studied the expression of its well-known downstream targets Hes1 and Dtx1 by qRT-PCR (Figure 4A). Although Notch2 mRNA levels did not show any significant variations between CK2βKO and CK2βCTRL mice (Figure 4B), WB analysis revealed significantly higher levels of the active intracellular domain (ICD) of NOTCH2 in CK2βKO as compared to CK2βCTRL B cells (Figure 4C), suggesting post-transcriptional regulation of NOTCH2 in CK2βKO B cells. By FACS analysis we observed a significant increase in NOTCH2 surface expression (measured as MFI) and NOTCH2-expressing cells in the MZ B cell compartment in CK2βKO mice as compared to CK2βCTRL animals (Figure 4D). We did not detect any increase in the mRNA levels of Notch1 nor in the amount of the active form of NOTCH1 protein amidst the genotypes (data not shown). To demonstrate that the observed skewing towards MZ B cell differentiation in CK2βKO mice is NOTCH2 dependent, we performed in vivo treatment with the NOTCH2 blocking antibody anti-negative regulatory region 2 (α-NRR2), which stabilizes NOTCH2 in its quiescent conformation (44). The efficacy of NOTCH2 inhibition was confirmed by qRT-PCR, which evidenced a reduction in the expression of Hes1 and Dtx1 in α-NRR2 treated samples (data not shown). FACS analysis proved that the blockade of the NOTCH2 pathway caused a reduction in CK2βKO MZ B cells whereas treatment with non-specific IgG had no effect (Figure 4E). Moreover, thinning of the MZ was detected by IF analysis of CK2βKO spleen sections stained for CD169, IgD and IgM after α-NRR2 or IgG treatment (Figure 4F). Overall, these results demonstrate that the MZ B cell compartment expansion observed in CK2βKO mice is NOTCH2 dependent.
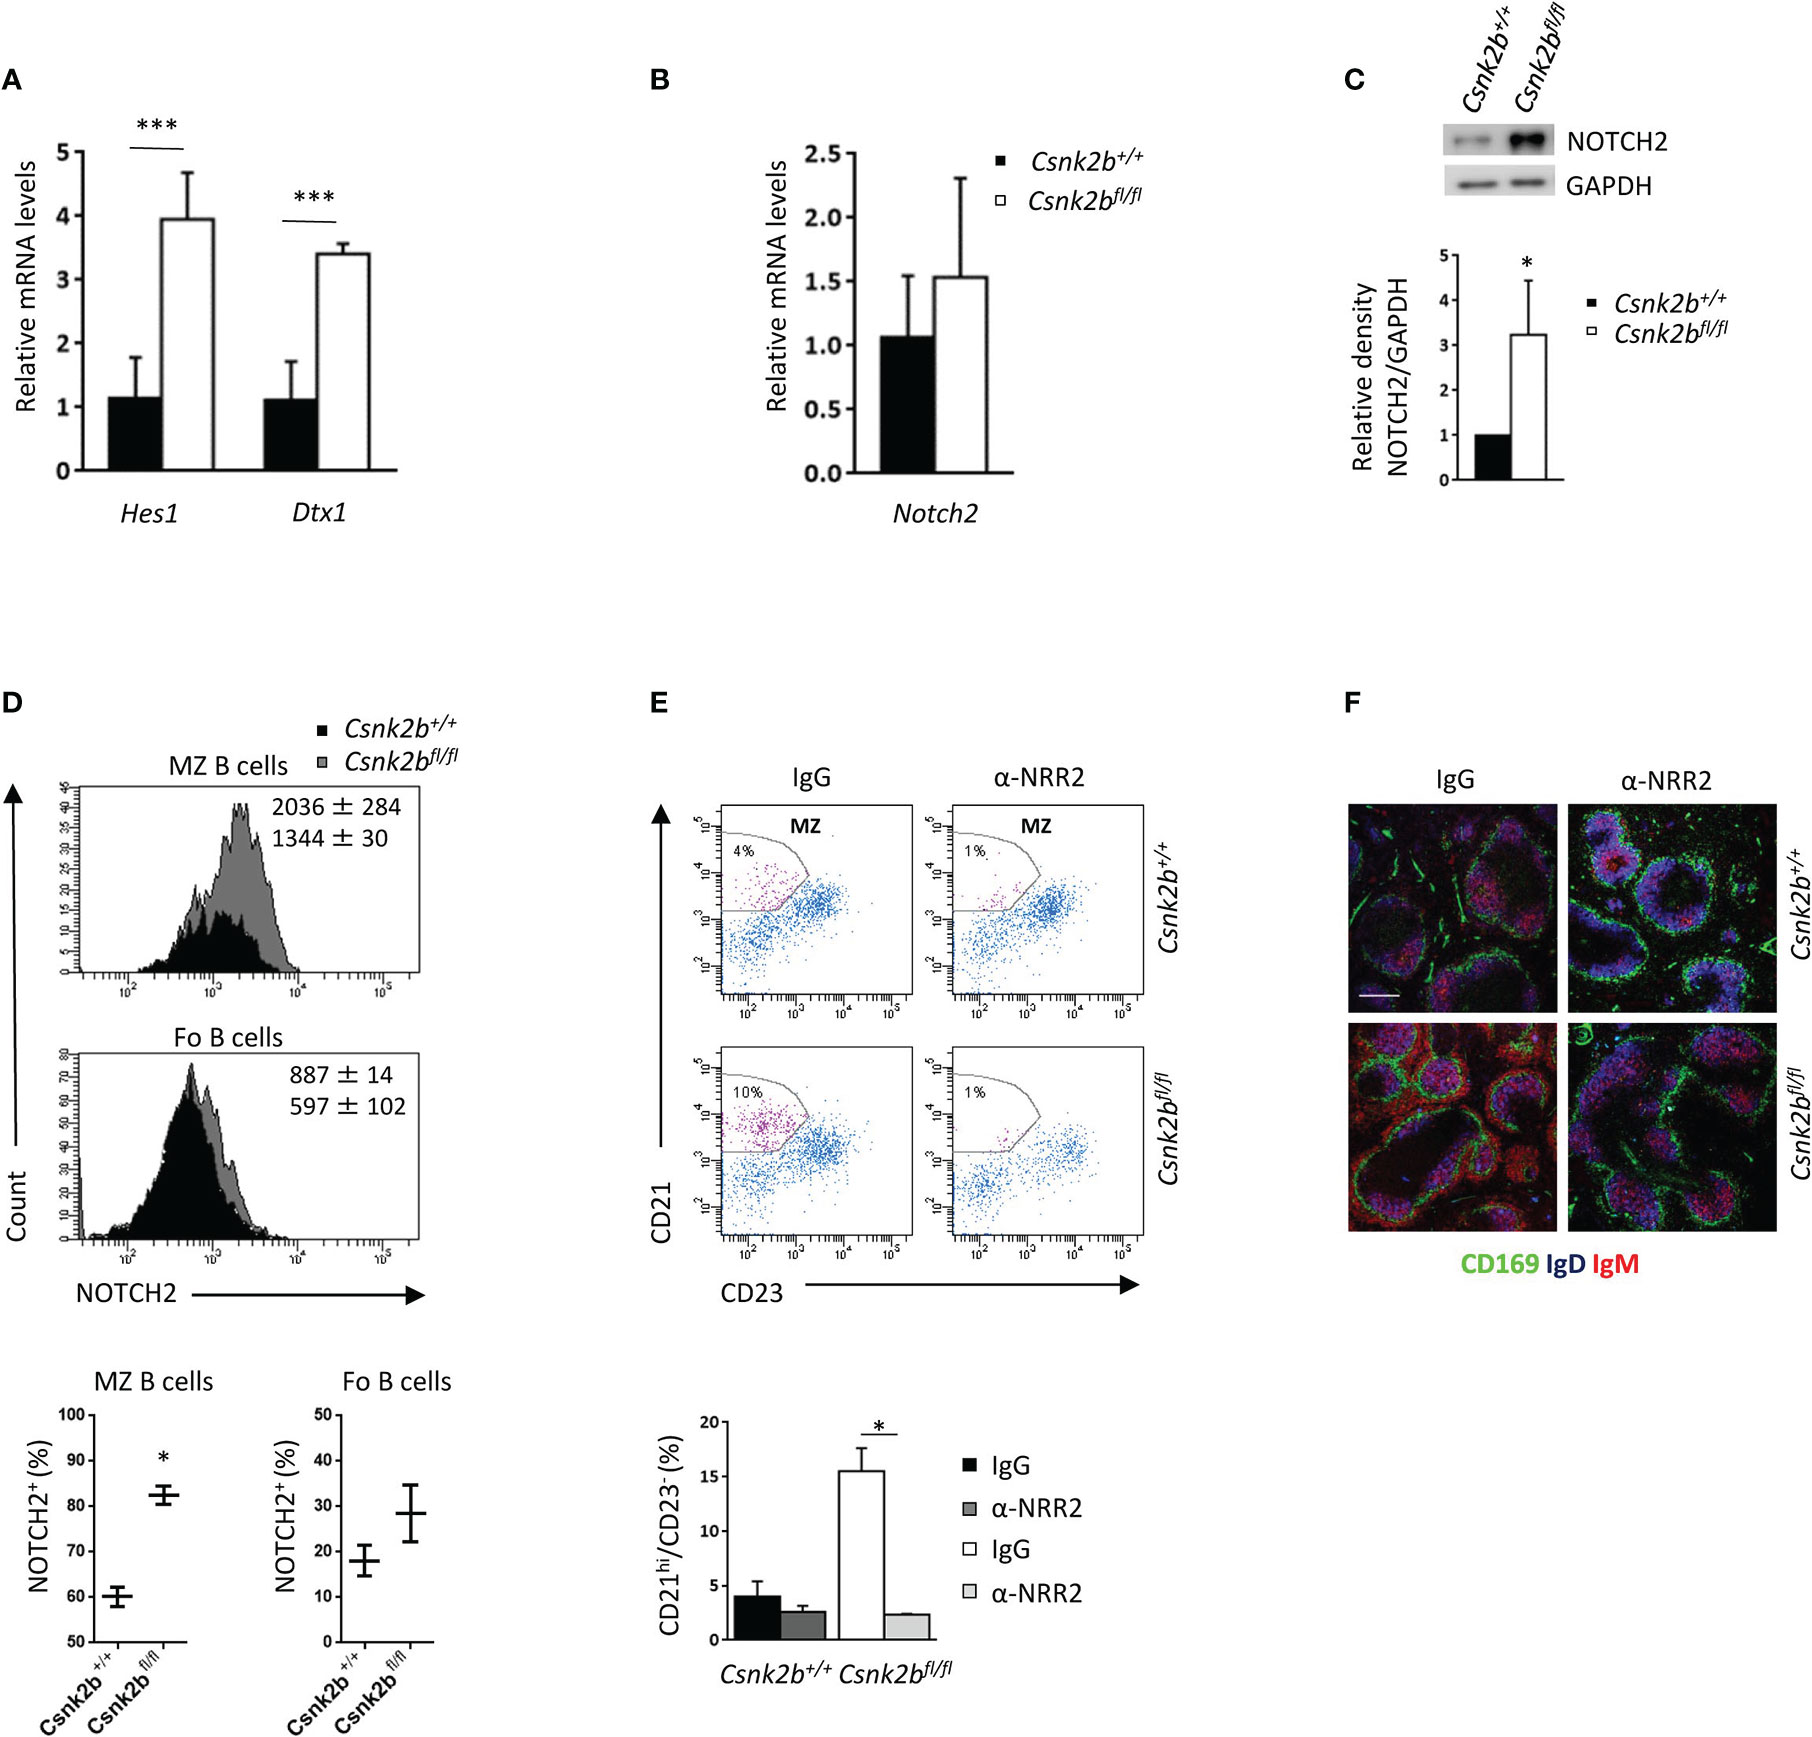
Figure 4 Activation of the NOTCH2 pathway determines an expansion of the MZ. (A) Splenic CD19+ B cells analyzed for the expression of Hes1 and Dtx1 by qRT-PCR. The expression is corrected for Gapdh levels and normalized to CK2βCTRL B cells. Data are shown as mean ± SD (n=4, three independent experiments). Statistical significance was determined by Student’s t test (***p < 0.001). (B) Splenic B cells analyzed for the expression of Notch2 by qRT-PCR. The expression is corrected for Gapdh levels and normalized to CK2βCTRL B cells. Data are shown as mean ± SD (n=5, three independent experiments). (C) Top, NOTCH2 expression in CK2βCTRL and CK2βKO splenic B lymphocytes was determined by WB (whole cell lysates, one representative experiment out of three). Bottom, Mean relative density of three experiments relative to CK2βCTRL B cells. Data are shown as mean ± SD. Statistical significance was determined by Student’s t test (*p < 0.05). In (A-C) the B cell fraction was purified using EasySep™ Mouse B Cell isolation kit (Stemcell) and the purity was ≥97%. (D) Flow cytometry analysis of NOTCH2 expression through intracytoplasmic staining. Top, NOTCH2 MFI in CK2βCTRL and CK2βKO mice, Bottom, graphs summarizing the percentage of NOTCH2 positive cells in the gate of MZ and Fo B cells shown as mean ± SD (two independent experiments). Statistical significance was determined by Student’s t test (*p < 0.05). (E) MZ B cells (CD21hiCD23-) from CK2βCTRL and CK2βκO mice were analyzed by flow cytometry after IgG or α-NRR2 administration. Top, representative dot plots indicating the MZ B cell gate. Bottom, Histograms summarizing the data of two independent experiments shown as mean ± SD. Statistical significance was determined by Student’s t test (*p < 0.05). (F) IF images of spleen sections showing CD169 (green), IgD (blue) and IgM (red) expression in IgG and α-NRR2 treated mice. Bar, 50μm. One representative mouse out of two per group is shown. Images were acquired with Zeiss LSM 700 confocal microscope and analyzed with ZEN software. Pictures were acquired using objectives 10x/0.3 dry and 20x/0.8 dry at room temperature and merged in three-color images with ImageJ software.
3.5 CK2βKO mice present enlarged germinal centers upon immunization
Since CK2βKO mice displayed a reduction in Fo B cells, we investigated the ability of CK2β-deficient B lymphocytes to efficiently mount a GC reaction and an Ab response against T-cell dependent (TD) Ags. To this aim, mice were intraperitoneally injected with sheep red blood cells (SRBCs), which are known to generate a robust immune response, or NP-CGG, which allows for the measurement of specific high-affinity Abs, and sacrificed 14 days later. IF staining of spleen sections from SRBC immunized CK2βCTRL mice (top panels) and immunohistochemistry (IHC) (bottom panels) showed CK2β expression in the GCs (PNA+ cells), suggesting that CK2β might play a role in the GC reaction (Figure 5A). FACS analysis of splenic B cells from SRBC immunized mice showed higher percentages of GC B cells (CD95hiPNAhi) in CK2βKO as compared to CK2βCTRL mice (Figure 5B). No significant changes in GC B cells were instead detected between CK2βKO and CK2βCTRL mice upon immunization with NP-CGG likely due to the less robust response observed with this immunogen (Figure 5C). IHC analysis of GCs, identified through BCL6+ immunostaining in mice immunized with SRBCs, demonstrated that CK2βKO spleens displayed larger GCs as compared to CK2βCTRL samples (Figure 5D). In fact, while the same number of GCs per unit area was scored in both genotypes, CK2βKO mice showed expanded GC areas (Figure 5E). These data indicate that CK2β is to some extent involved in GC progress and maturation. However, DZ and LZ B cell ratios remained unchanged in CK2βKO mice when compared to controls both upon SRBC and NP-CGG immunization (data not shown).
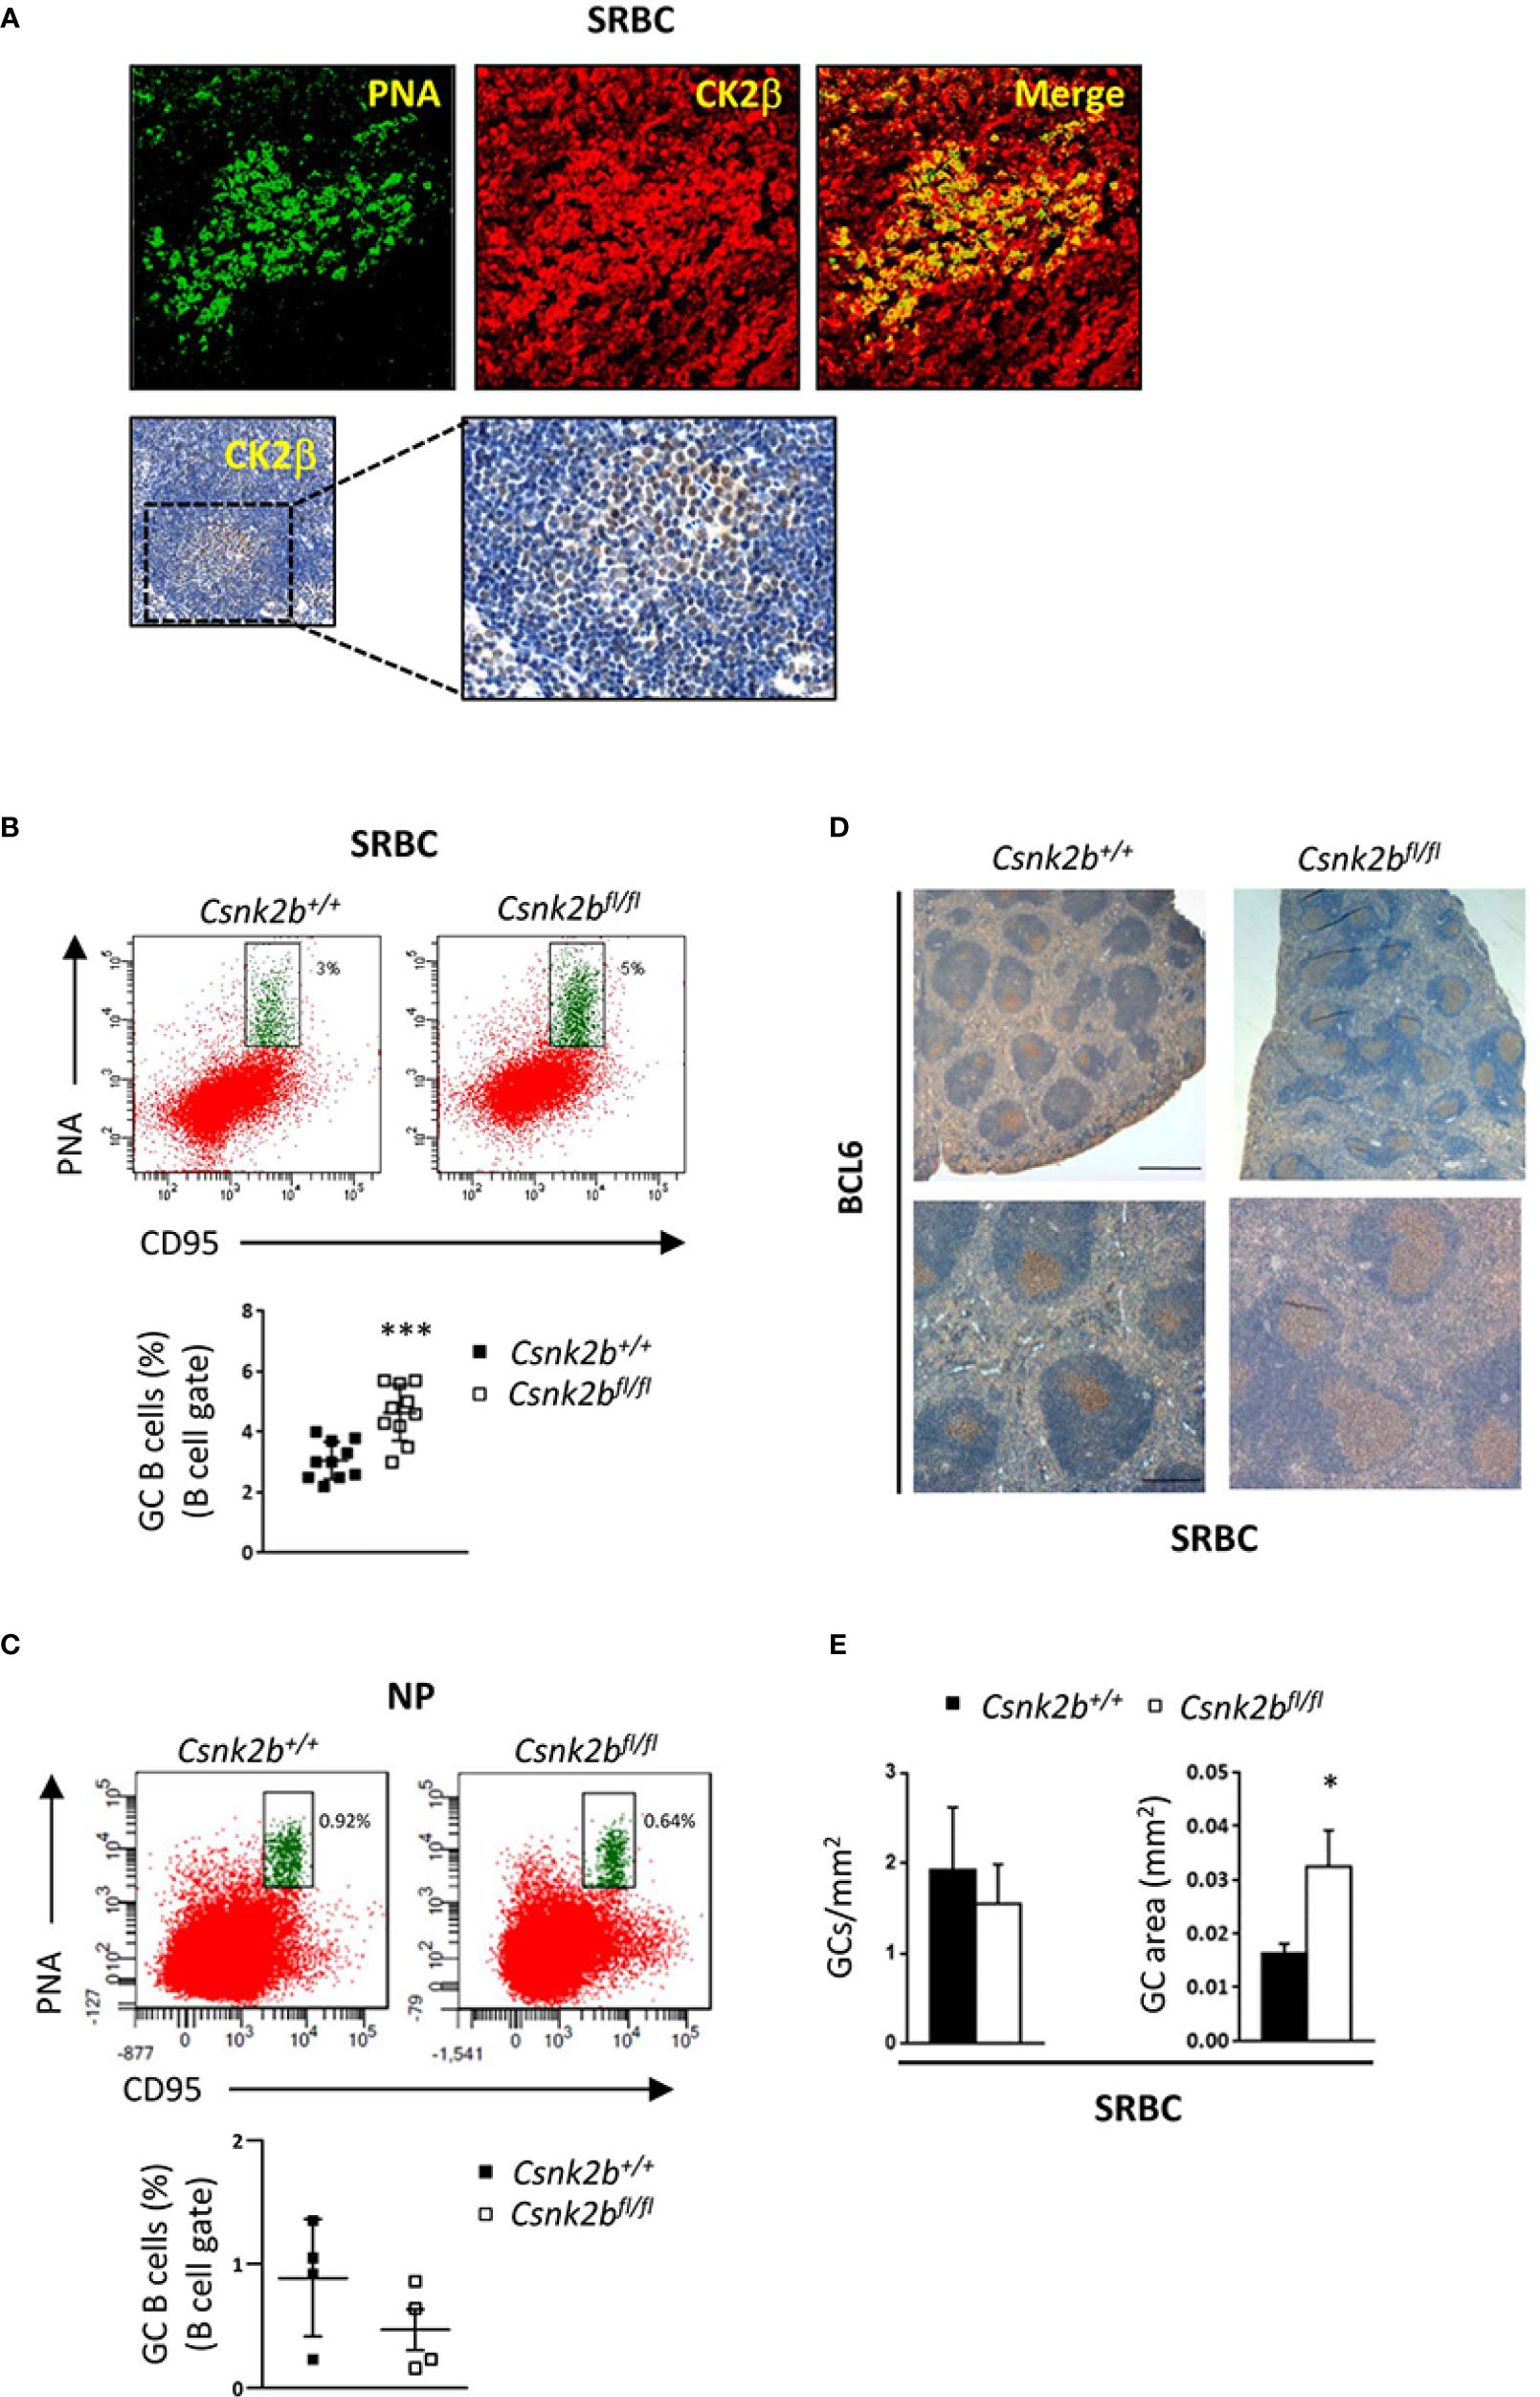
Figure 5 GC expansion after SRBC immunization in CK2βκO mice. CK2βCTRL and CK2βκO mice immunized with SRBC or NP-CGG and analyzed 14 days post-immunization. (A) CK2β expression and localization in the GCs of CK2βCTRL spleens after immunization with SRBC. Top, IF images of spleen sections showing PNA (green) and CK2β (red). Images were acquired with Zeiss LSM 700 confocal microscope and analyzed with ZEN software. Pictures were acquired using objectives 20X, zoom1, and merged in two-color images with ImageJ software. Bottom, IHC of CK2β (Abcam) counterstained with hematoxylin; the magnification highlights the GC region. (B) GCs by Flow Cytometry in CK2βCTRL and CK2βκO mice after immunization with SRBC or (C) with NP. In (B, C) at the bottom, representative scatter plots of the percentage of splenic GC B cells (B220+CD95hiPNAhi) with each symbol representing a mouse. Data are shown as mean ± SD. Statistical significance was determined by Student’s t test (***p < 0.001). Top, a representative dot plot per genotype is depicted, numbers near gates indicate the percentage of B220+CD95hiPNAhi cells. (D) GCs in spleen sections from mice of the corresponding genotypes identified through BCL6 staining and counterstained with hematoxylin. Image acquisition was performed using the Leica DMD108 Digital Microimaging Device and Software (Leica Microsystems, Germany). One representative mouse out of 3 per group is shown. Upper panels: bar, 500μm, lower panels: bar, 200μm (3 independent experiments). (E) Histograms summarizing the number of GCs per unit area (n=4 mice per genotype) and the area of selected GCs (n=3 mice per genotype, 7 GCs per mouse) of spleen sections stained with H&E from CK2βCTRL and CK2βκO mice. Data are shown as mean ± SD. Statistical significance was determined by Student’s t test (*p < 0.05).
3.6 CK2β deficiency impairs GC B cells class switch and plasmablasts generation
Since GSEA analysis evidenced alterations in the expression of genes involved in B cell activation and the GC reaction in CK2βKO mice (Figure 3), and upon SRBC immunization CK2βKO mice developed enlarged GCs (Figure 5), we investigated the impact of Csnk2b KO on B cell ability to perform CSR and SHM. To this aim, we stimulated CK2βCTRL and CK2βKO splenic B cells with lipopolysaccharide (LPS) or LPS + interleukin-4 (IL-4), which trigger IgG3 (41) and IgG1 CSR, respectively (42). Flow cytometric analysis showed that CK2βKO B-cell cultures generated a lower fraction of IgG3- or IgG1-expressing B cells as compared to their CK2βCTRL counterparts (Figure 6A). Quantification of IgG3 and IgG1 in the supernatant of splenic B cell cultures confirmed the reduced capacity of CK2βKO B cells to secrete switched IgGs (Figure 6B). A similar trend was observed upon stimulation of B cells with anti-CD40 + IL-4 (Figure 6C). In line with this observation, in the latter condition CK2βKO B cells exhibited a higher percentage of un-switched IgM+ B cells (Figure 6D). In vitro experiments were supported by in vivo data, since after SRBC immunization CK2βKO mice presented a reduced percentage of splenic GC B cells and lower serum IgG1 levels (Figure 6E, F). Following immunization with NP-CGG, quantification of serum Ab titers showed a trend towards lower total and high-affinity NP-specific IgM and IgG levels in CK2βKO as compared to CK2βCTRL mice, yet these differences did not reach statistical significance (Figure 6G). The decreasing trend of high-affinity NP-specific IgG1 antibodies in serum titers of CK2βKO mice prompted us to evaluate SHM in GC B cells purified by sorting (B220hiIgD-CD38low/-PNAhiCD95+) from spleens of NP-immunized CK2βCTRL and CK2βKO mice, at the peak of the immune response (14 days). Results summarized in Table 1 report mutational analyses of the VH1-72 gene in B cells of three CK2βCTRL and three CK2βKO mice. Data are represented both as values obtained for each mouse and as the mean of mice with the same genotype. Average number of mutations within unique V gene rearrangements, and IgVH mutation frequency were comparable between CK2β control and mutant groups. We also investigated the effect of CK2β deficiency on the selection within VH1-72 rearrangements of replacement mutations leading to the W33L amino-acid substitution, conferring a 10-fold increase in antibody binding to NP (33). With the exception of one CK2βCTRL animal, which lacked the W33L amino acid substitution in any of its VH1-72 rearrangements, possibly due to the acquisition of complementary sets of mutations conferring similar high-affinity Ag binding properties, control animals averaged a 48% frequency of high-affinity anti-NP V gene rearrangements, in line with previous reports (45, 46). In contrast, CK2βKO GC B cells showed a marked reduction in the frequency of VH1-72 rearrangements bearing the W33L substitution, reaching values that were roughly half of those measured in control B cells. FACS analysis also indicated a defective capacity of CK2βKO mice to generate plasmablasts (PBs: B220hi/CD138+) after SRBC immunization, and after in vitro stimulation with LPS ± IL-4 (Figure 6H). No significant variations were detected upon NP immunization (Figure 6H). However, with the exception of B cells stimulated with LPS ± IL-4 where CK2βKO developed PCs to a significantly lower extent than CK2βCTRL ones, we did not observe significant differences in the percentages of PCs upon SRBC or NP immunization (Figure 6I). No significant differences were evidenced in the percentages of memory B cells (CD19+CD27+) in CK2βKO as compared to CK2βCTRL animals (Figure 6J). These results show that CK2β is involved in the regulation of the GC reaction and in PBs generation.
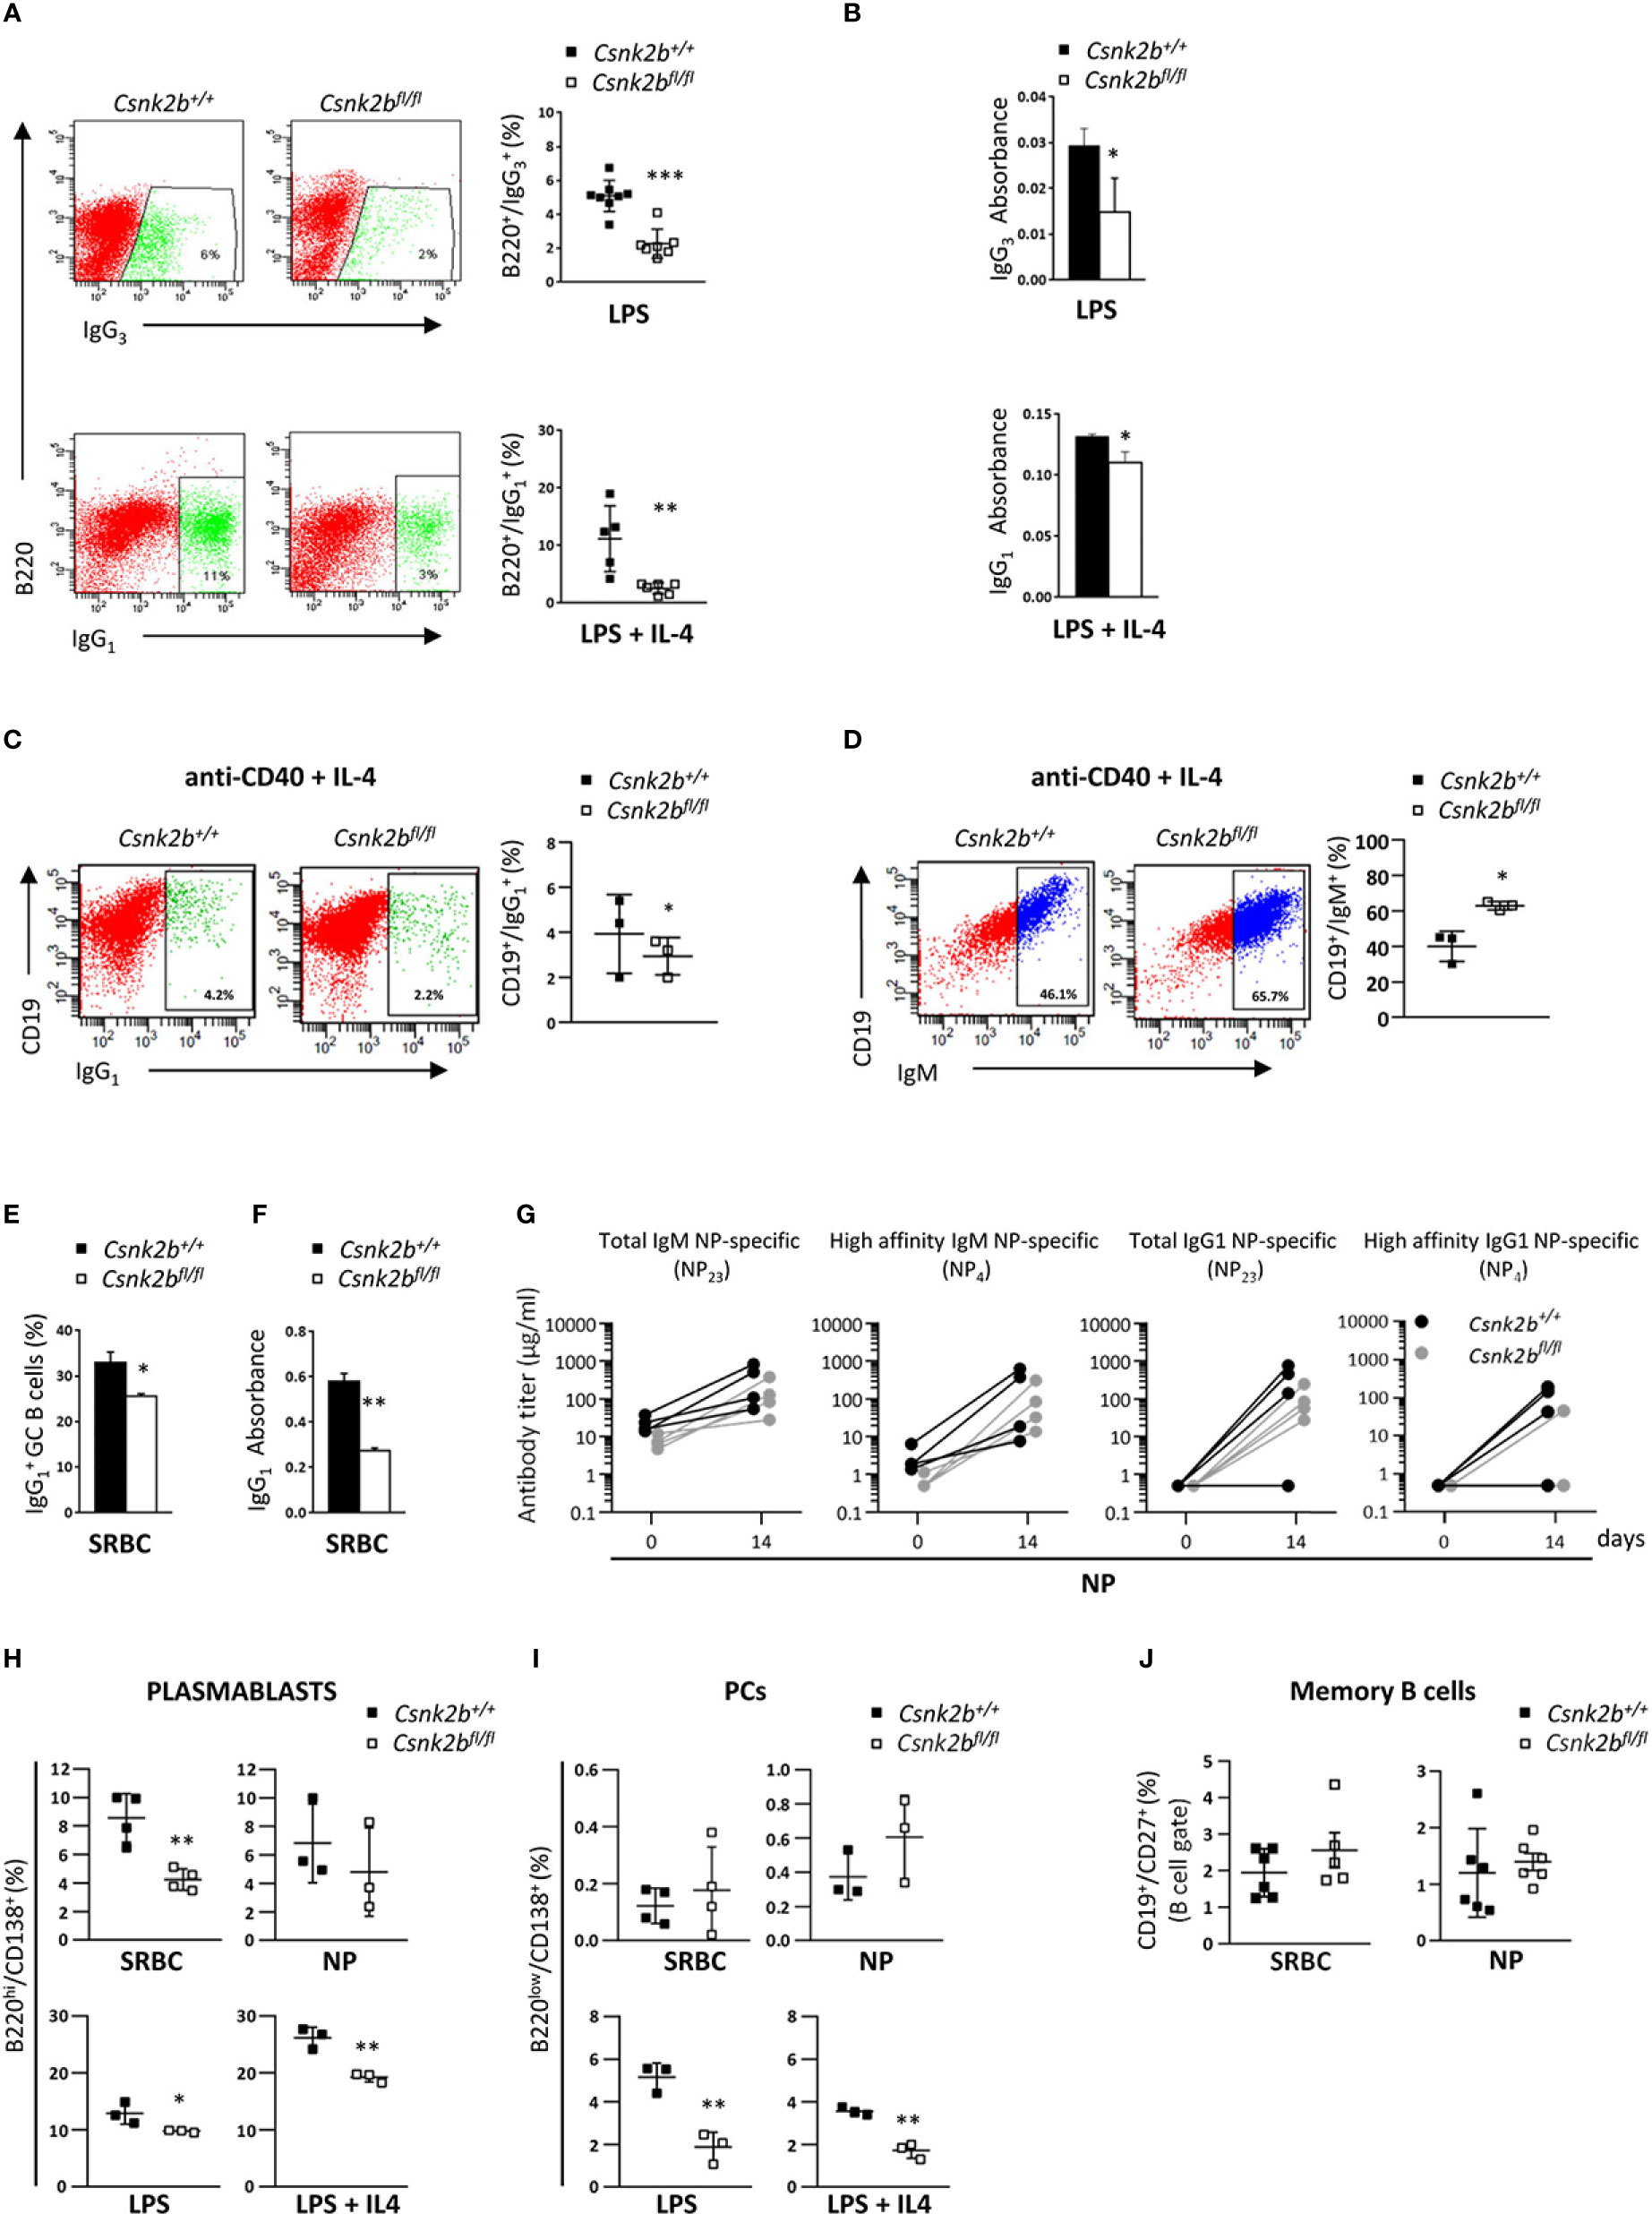
Figure 6 Impaired isotype-switch and Plasmablasts generation in CK2βκO mice after in vitro stimulation and in vivo immunization. (A) CK2βCTRL and CK2βκO purified splenic B cells stimulated in vitro with LPS or LPS+IL-4 and analyzed after 72h. Right, Scatter plot of the percentage of B220+ or B220+ cells measured by Flow Cytometry, with each symbol representing a mouse. Data are shown as mean ± SD. Statistical significance was determined by Student’s t test (**p < 0.01; ***p < 0.001). Left, One representative dot plot per genotype is depicted. (B) IgG3 or IgG1 production quantified by ELISA in the cell media of CK2βCTRL and CK2βκO splenic B cells after exposure for 72h to LPS and LPS+IL4. Data are shown as mean ± SD (n=3 mice per genotype). Statistical significance was determined by Student’s t test (*, p < 0.05). (C) CD19+ and (D) CD19+IgM+ cells from CK2βCTRL and CK2βκO purified splenic B cells stimulated in vitro for 48h with anti-CD40+IL-4. In detail: For both (C, D) Right, Graphs showing the percentage of each gated population, Left, A representative dot plot per genotype. Data are shown as mean ± SD. Statistical significance was determined by Student’s t test (*p < 0.05). (E) Flow Cytometry and (F) ELISA in CK2βCTRL and CK2βKO mice after 14 days of immunization with SRBC. In detail: (E) Histogram summarizing the percentage of splenic IgG1+ GC B cells. Data are shown as mean ± SD (n=3). Statistical significance was determined by Student’s t test (*p < 0.05) and (F) IgG1 production in the serum. Data are shown as mean ± SD. Statistical significance was determined by Student’s t test (**p < 0.01). (G) Evaluation of NP-specific serum Ig titers after 14 days of NP immunization. Data were obtained through direct ELISA test, coating plates with NP23-BSA or NP4-BSA antigens to quantify total and high affinity NP-specific Abs. The concentration of total NP-specific IgM or IgG1 and high-affinity IgM and IgG1 Ab levels against NP23 and NP4 antigens are shown in Spaghetti Graphs that report Ig values before and after immunization. 4 mice per each genotype. Statistical significance was determined by Mann-Whitney U test (ns). (H) Graphs representing plasmablast (B220hiCD138+) percentages in the spleens of mice immunized with SRBC or NP (top) and after in vitro stimulation of purified splenic B cells with LSP or LPS+IL4 (bottom). Data are shown as mean ± SD. Statistical significance was determined by Student’s t test (*p< 0.05; **p < 0.01). (I) Percentages of PCs upon immunization of CK2βCTRL and CK2βKO mice with SRBC or NP (top) and after exposure of purified B cells to LPS or LPS+IL4 (bottom). Scatter plots indicate mean ± SD. Statistical significance was determined by Student’s t test (**p < 0.01). (J) Scatter plots showing memory B cells (CD19+CD27+) in the spleen of CK2βCTRL and CK2βκO mice after immunization with SRBC (left) and NP (right) for 14 days. Data are shown as mean± SD. Statistical significance is determined by Mann-Whitney test (ns). In (A-C, H) B cells were purified with EasySep™ Mouse B Cell Isolation Kit (Stemcell) and purity was ≥97%.
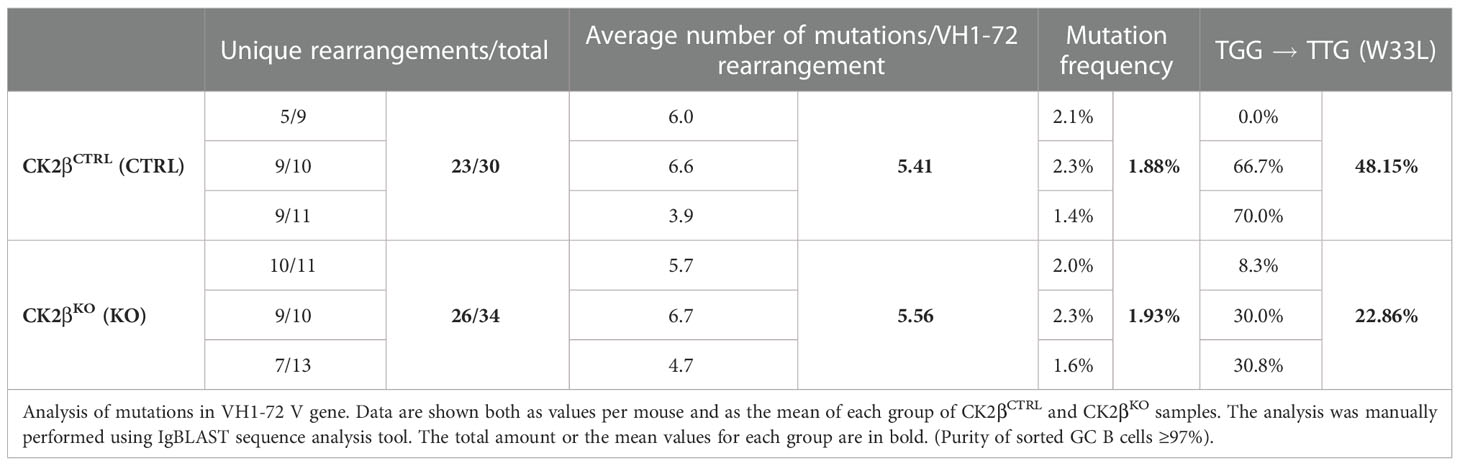
Table 1 Data generated from the analyses of GC B cells sorted from a total of three CTRL and three KO mice.
3.7 Impaired BCR signaling in CK2βKO B cells
The signaling events triggered upon BCR and NOTCH2 engagement are known to be critical for the regulation of B cell fate in the mouse (2) and are central for the initiation and maintenance of the GC reaction (47). The increase in MZ B cells, the decrease in B1 (Supplemental Figure 2) and Fo B cells and the up-regulation of the NOTCH2 pathway observed in CK2βKO mice, suggest a likely impairment of the BCR signaling. To test this hypothesis, we stimulated purified splenic B cells with anti-IgM F(ab)2 Abs to trigger the BCR cascade. Firstly, as a comprehensive distal readout of BCR signaling functionality, we evaluated the intracellular Ca2+ flux and found a dramatic impairment in the rise of cytoplasmic Ca2+ concentration in CK2βKO B cells. Significantly, the same impairment was observed in CK2βCTRL B cells after pharmacological inhibition of CK2 kinase activity with the selective, ATP-competitive compound CX-4945 (Silmitasertib) (48, 49) (Figure 7A). To test if this phenomenon could be a consequence of reduced BCR surface expression in CK2βKO B cells, we stained CK2βCTRL and CK2βKO B cells with anti-IgM Abs. However, there were no variations in the IgM surface levels between the two genotypes (Figure 7B). The increase in cytoplasmic Ca2+ levels is a consequence of its release from the endoplasmic reticulum through specific channels called inositol triphosphate (IP3) receptors, which bind IP3 produced from phosphatidylinositol 4,5-bisphosphate (PIP2) after BCR stimulation (50). Many kinases phosphorylate IP3 receptors, inducing conformational changes that modify their capability to release Ca2+ in the cytoplasm (51). Since the CK2 consensus site has been identified in the IP3 receptor sequence (52), we argued that the reduced Ca2+ mobilization in CK2βKO B cells could depend on impaired functionality of IP3 receptors. B lymphocytes were loaded with photoactivatable caged-IP3 and with the fluorescent Ca2+ indicator Fluo-4 and irradiated with an UV laser source to induce the release of IP3, which would bind its receptors triggering Ca2+ mobilization (53). We did not observe any significant difference between CK2βCTRL and CK2βKO B cells in response to exogenous IP3, suggesting that CK2β loss does not affect IP3 receptors conformation and functionality (Figure 7C).
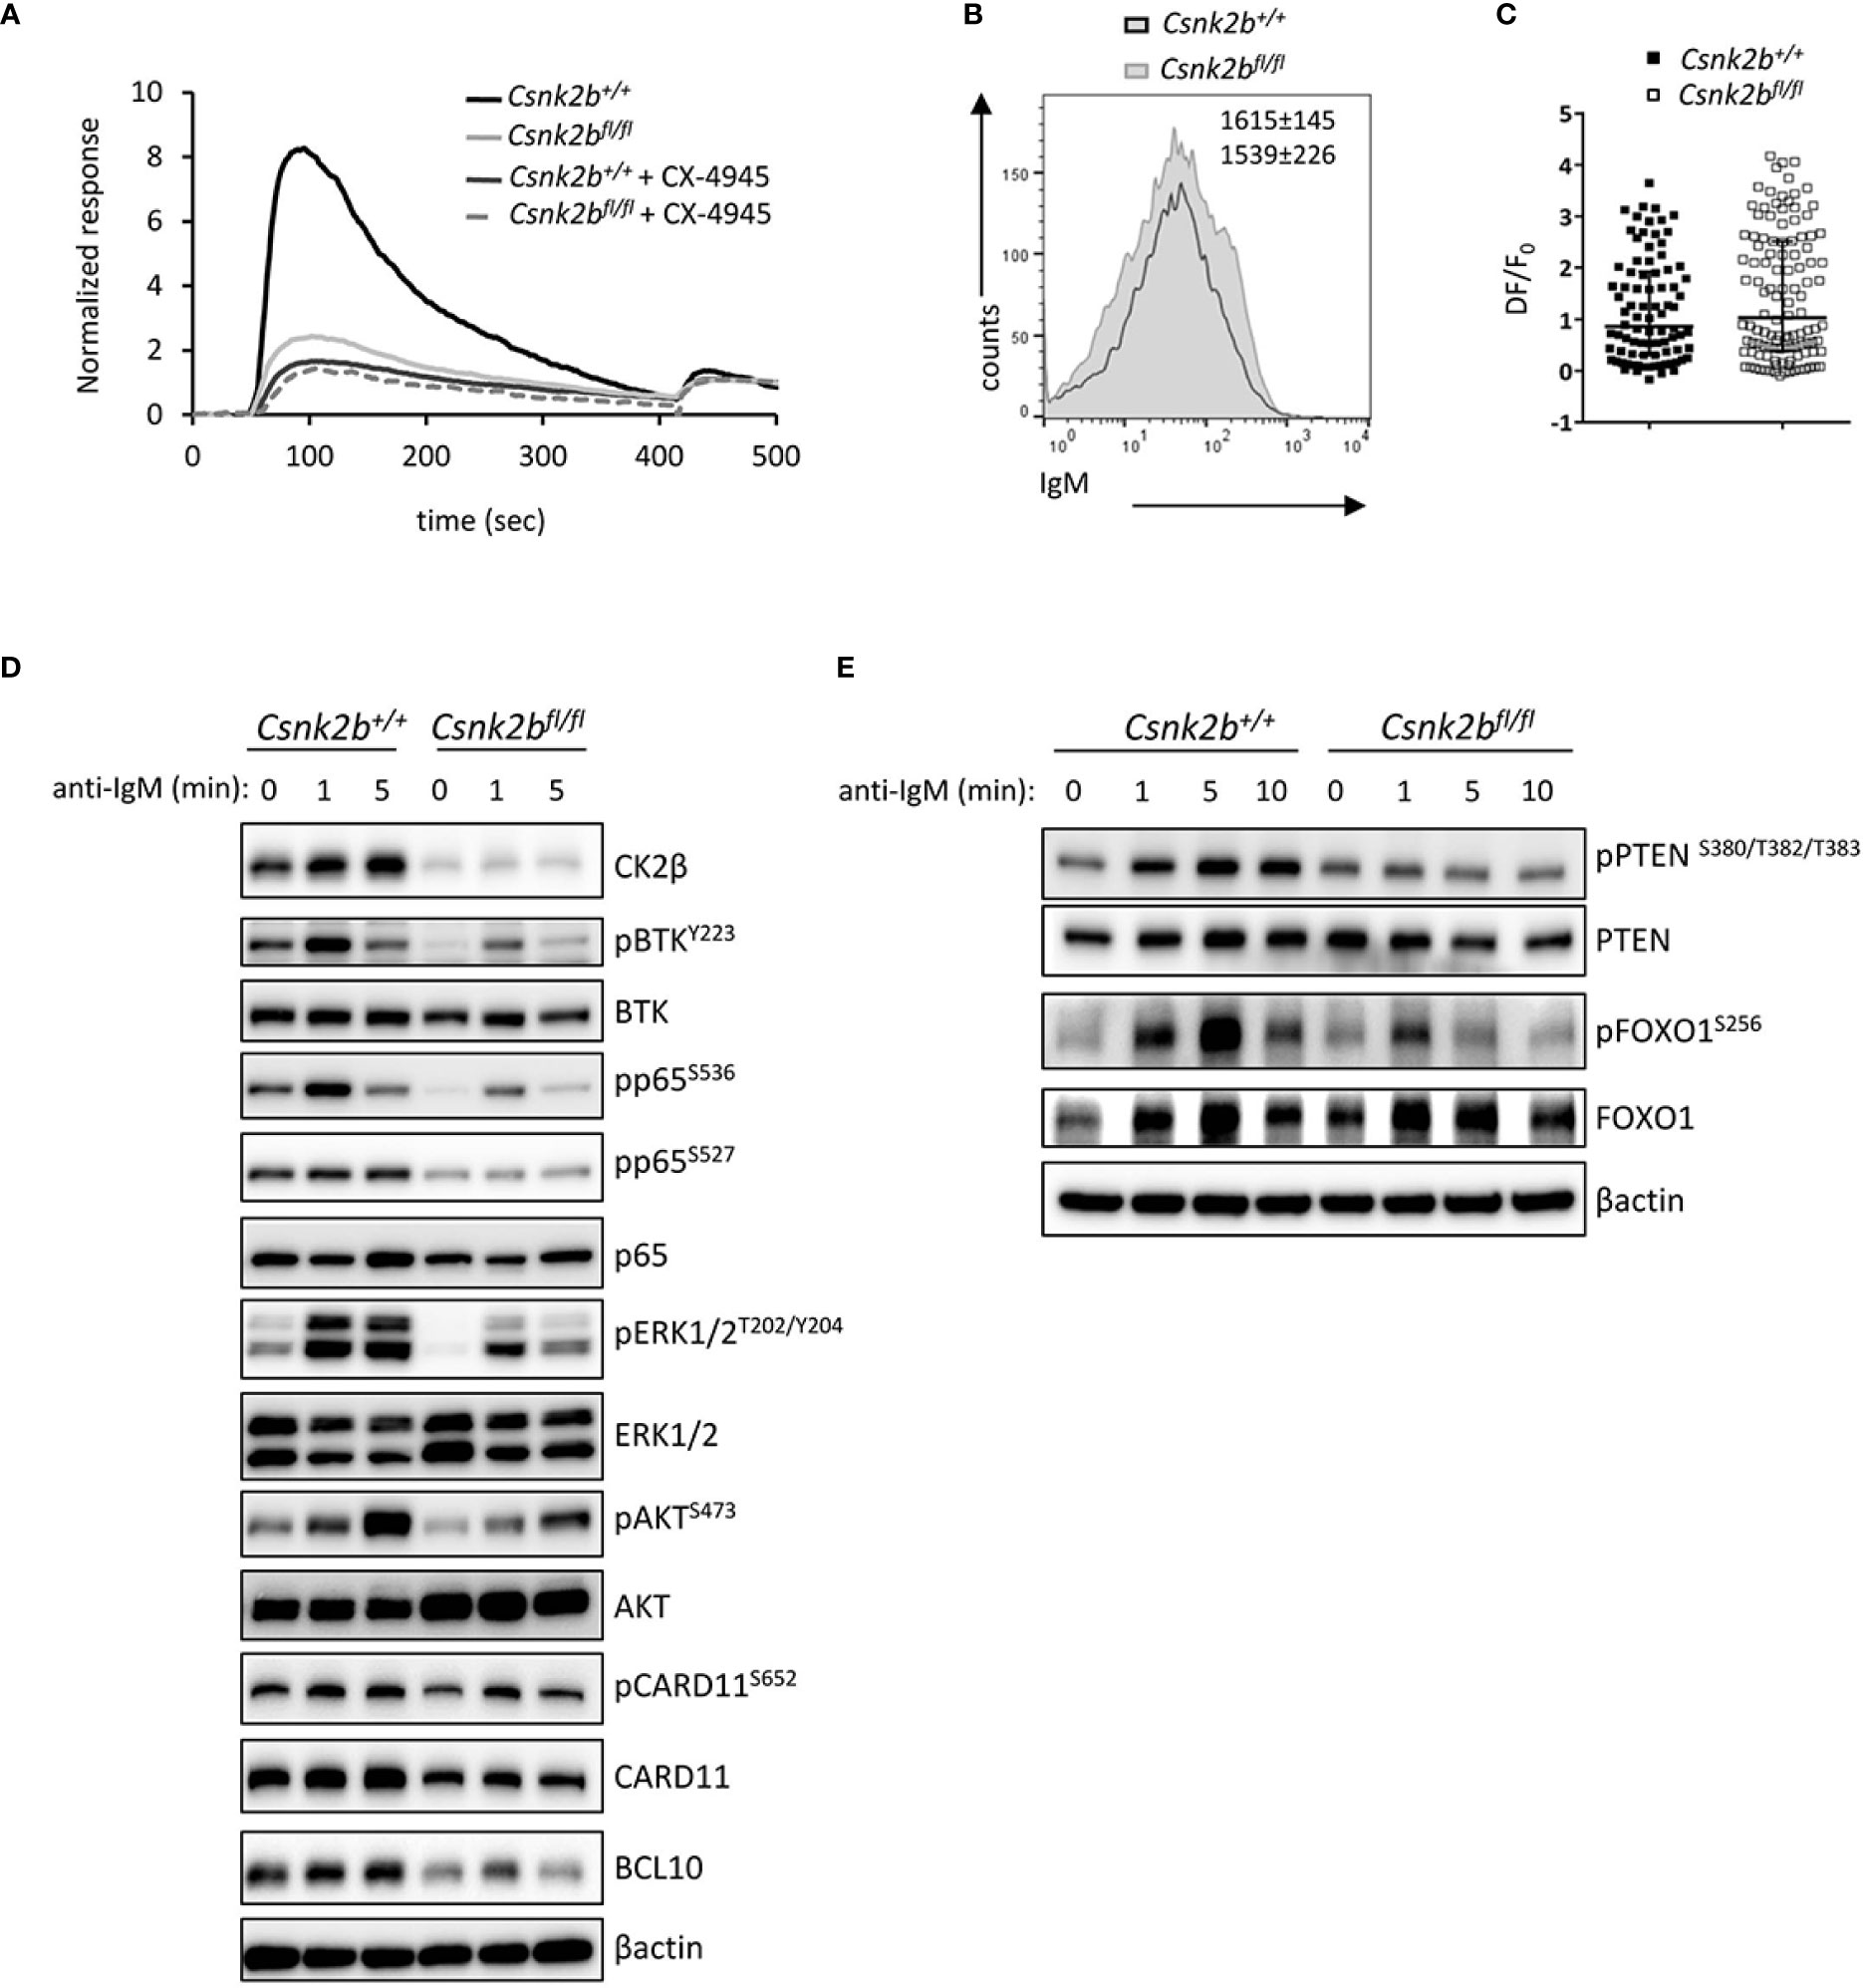
Figure 7 Impaired BCR signaling in CK2βκO mice. (A) Graph representing cytosolic Ca++ waves in CK2βCTRL and CK2βκO mice ± CX-4945 pre-treatment (5μM, 3h). Cells were stimulated with α-IgM at 30 sec and ionomycin at 420 sec (n=3 CK2βCTRL and 3 CK2βκO mice). (B) Expression of IgM on the surface of B cells (CD19+B220+) from CK2βCTRL and CK2βκO mice was assessed by flow cytometry. Numbers on the plot show average MFI ± SD (n=6). (C) Scatter plot of the maximum of fluorescence variation (ΔF/F0) in CK2βCTRL (n=86 individual cells from 2 mice) and CK2βκO (n= 122 individual cells from 3 mice) B cells. Median with interquartile range is shown. Statistical significance was determined by Mann-Whitney test. (D, E) Study of the signaling pathways downstream of the BCR on B cells purified from the spleens of CK2βCTRL and CK2βκO mice treated in vitro for 1, 5 or 10 minutes with anti-IgM antibody. Blots are representative of four independent experiments where at least two spleens were pooled together. In (D, E) the B cell fraction was purified with EasySep™ Mouse B Cell Isolation Kit (Stemcell) and the purity was ≥98%.
Thus, we focused the analysis on the upstream BCR signaling cascade and proximal phosphorylation events, which lead to second messenger generation mediating Ca2+ mobilization (54). To this aim, B cells were incubated with anti-IgM Fab2 for 1, 5 and 10 minutes. The phosphorylation level of pBTKY223, NF-κB pRelA/p65S536 and pRelA/p65S527, pERK1/2T202/Y204, pAKTS473 and pCARD11S652 were significantly reduced in CK2βκO as compared to CK2βCTRL B cells (Figure 7D). Intriguingly, we also observed reduced total CARD11 as well as BCL10 protein levels, two essential components of the CBM1 (CARD11, BCL10, MALT1) complex, which is activated by PKCβ and is essential to induce the IKK-mediated activation of NF-κB (55). An analysis of the PI3K/AKT pathway showed that the negative regulator PTEN was less phosphorylated on S380/T382/T383 in CK2βκO B cells, a status that might correlate with an increased activity (Figure 7E) (56). Furthermore, as AKT-mediated phosphorylation of the transcription factor FOXO1 is a critical event in B-cell activation and function (57), we investigated FOXO1 phosphorylation levels after BCR engagement detecting markedly less pFOXO1S256 in CK2βκO as compared to CK2βCTRL B cells (Figure 7E).
Altogether, these results indicate a critical function for CK2β in regulating the BCR signaling cascades crucial for B-cell activation and evidence a reduced BCR strength in CK2βκO mice.
3.8 CK2β sustains cell signaling foregoing B cell terminal differentiation
To gain further insights into the role of CK2β during the GC reaction, we investigated the signaling downstream of TLR, CD40 and IL-4R, all critical pathways for B cell maturation and terminal differentiation (47). TLRs stimulated with LPS activate the MAPK-ERK1/2 pathway, which has been shown to regulate the transition from activated B cells to pre-PBs (58, 59). Immunoblot analysis after incubation of purified B cells with LPS ± IL-4 showed lower levels of pERK1/2T202/Y204 in CK2βKO as compared to CK2βCTRL B cells (Figure 8A). To mimic the interactions between centrocytes and follicular T helper cells in the LZ of the GCs (60), we stimulated CK2βCTRL and CK2βKO B cells with anti-CD40+IL-4. WB analysis was performed after early (5 and 10 minutes) as well as late (48 hours) time points. As shown in Figure 8B, at the early time points loss of CK2β markedly reduced the phosphorylation of pAKTS473 and pFOXO1S256 but little to no differences were detectable on pRelAS536 and pSTAT6S727. After 48h we evidenced an upregulation of CK2α in CK2βCTRL cells (Figure 8C). We also measured the expression levels of the transcription factors BCL6 and IRF4, which are instrumental for the initiation and maintenance of-, and exit from the GC, respectively (61, 62). Immunoblot analysis indicated a reduced expression of BCL6 and IRF4 after anti-CD40+IL-4 in CK2βKO as compared to CK2βCTRL B cells (Figure 8C). As expected, BCL6 was strongly induced only by the addition of IL-4. Remarkably, in B cells from CK2βKO mice, while CK2α was upregulated similarly as in CK2βCTRL B cells, the rise in IRF4 and BCL6 levels after anti-CD40+IL-4 was much less pronounced (Figure 8C). We also checked the phosphorylation levels of ERK1/2 kinases and STAT6. To note in CK2βKO B cells the level of pERK1/2T202/Y204 was reduced with anti-CD40+IL-4. No significant differences were seen in the levels of STAT6 phosphorylation.
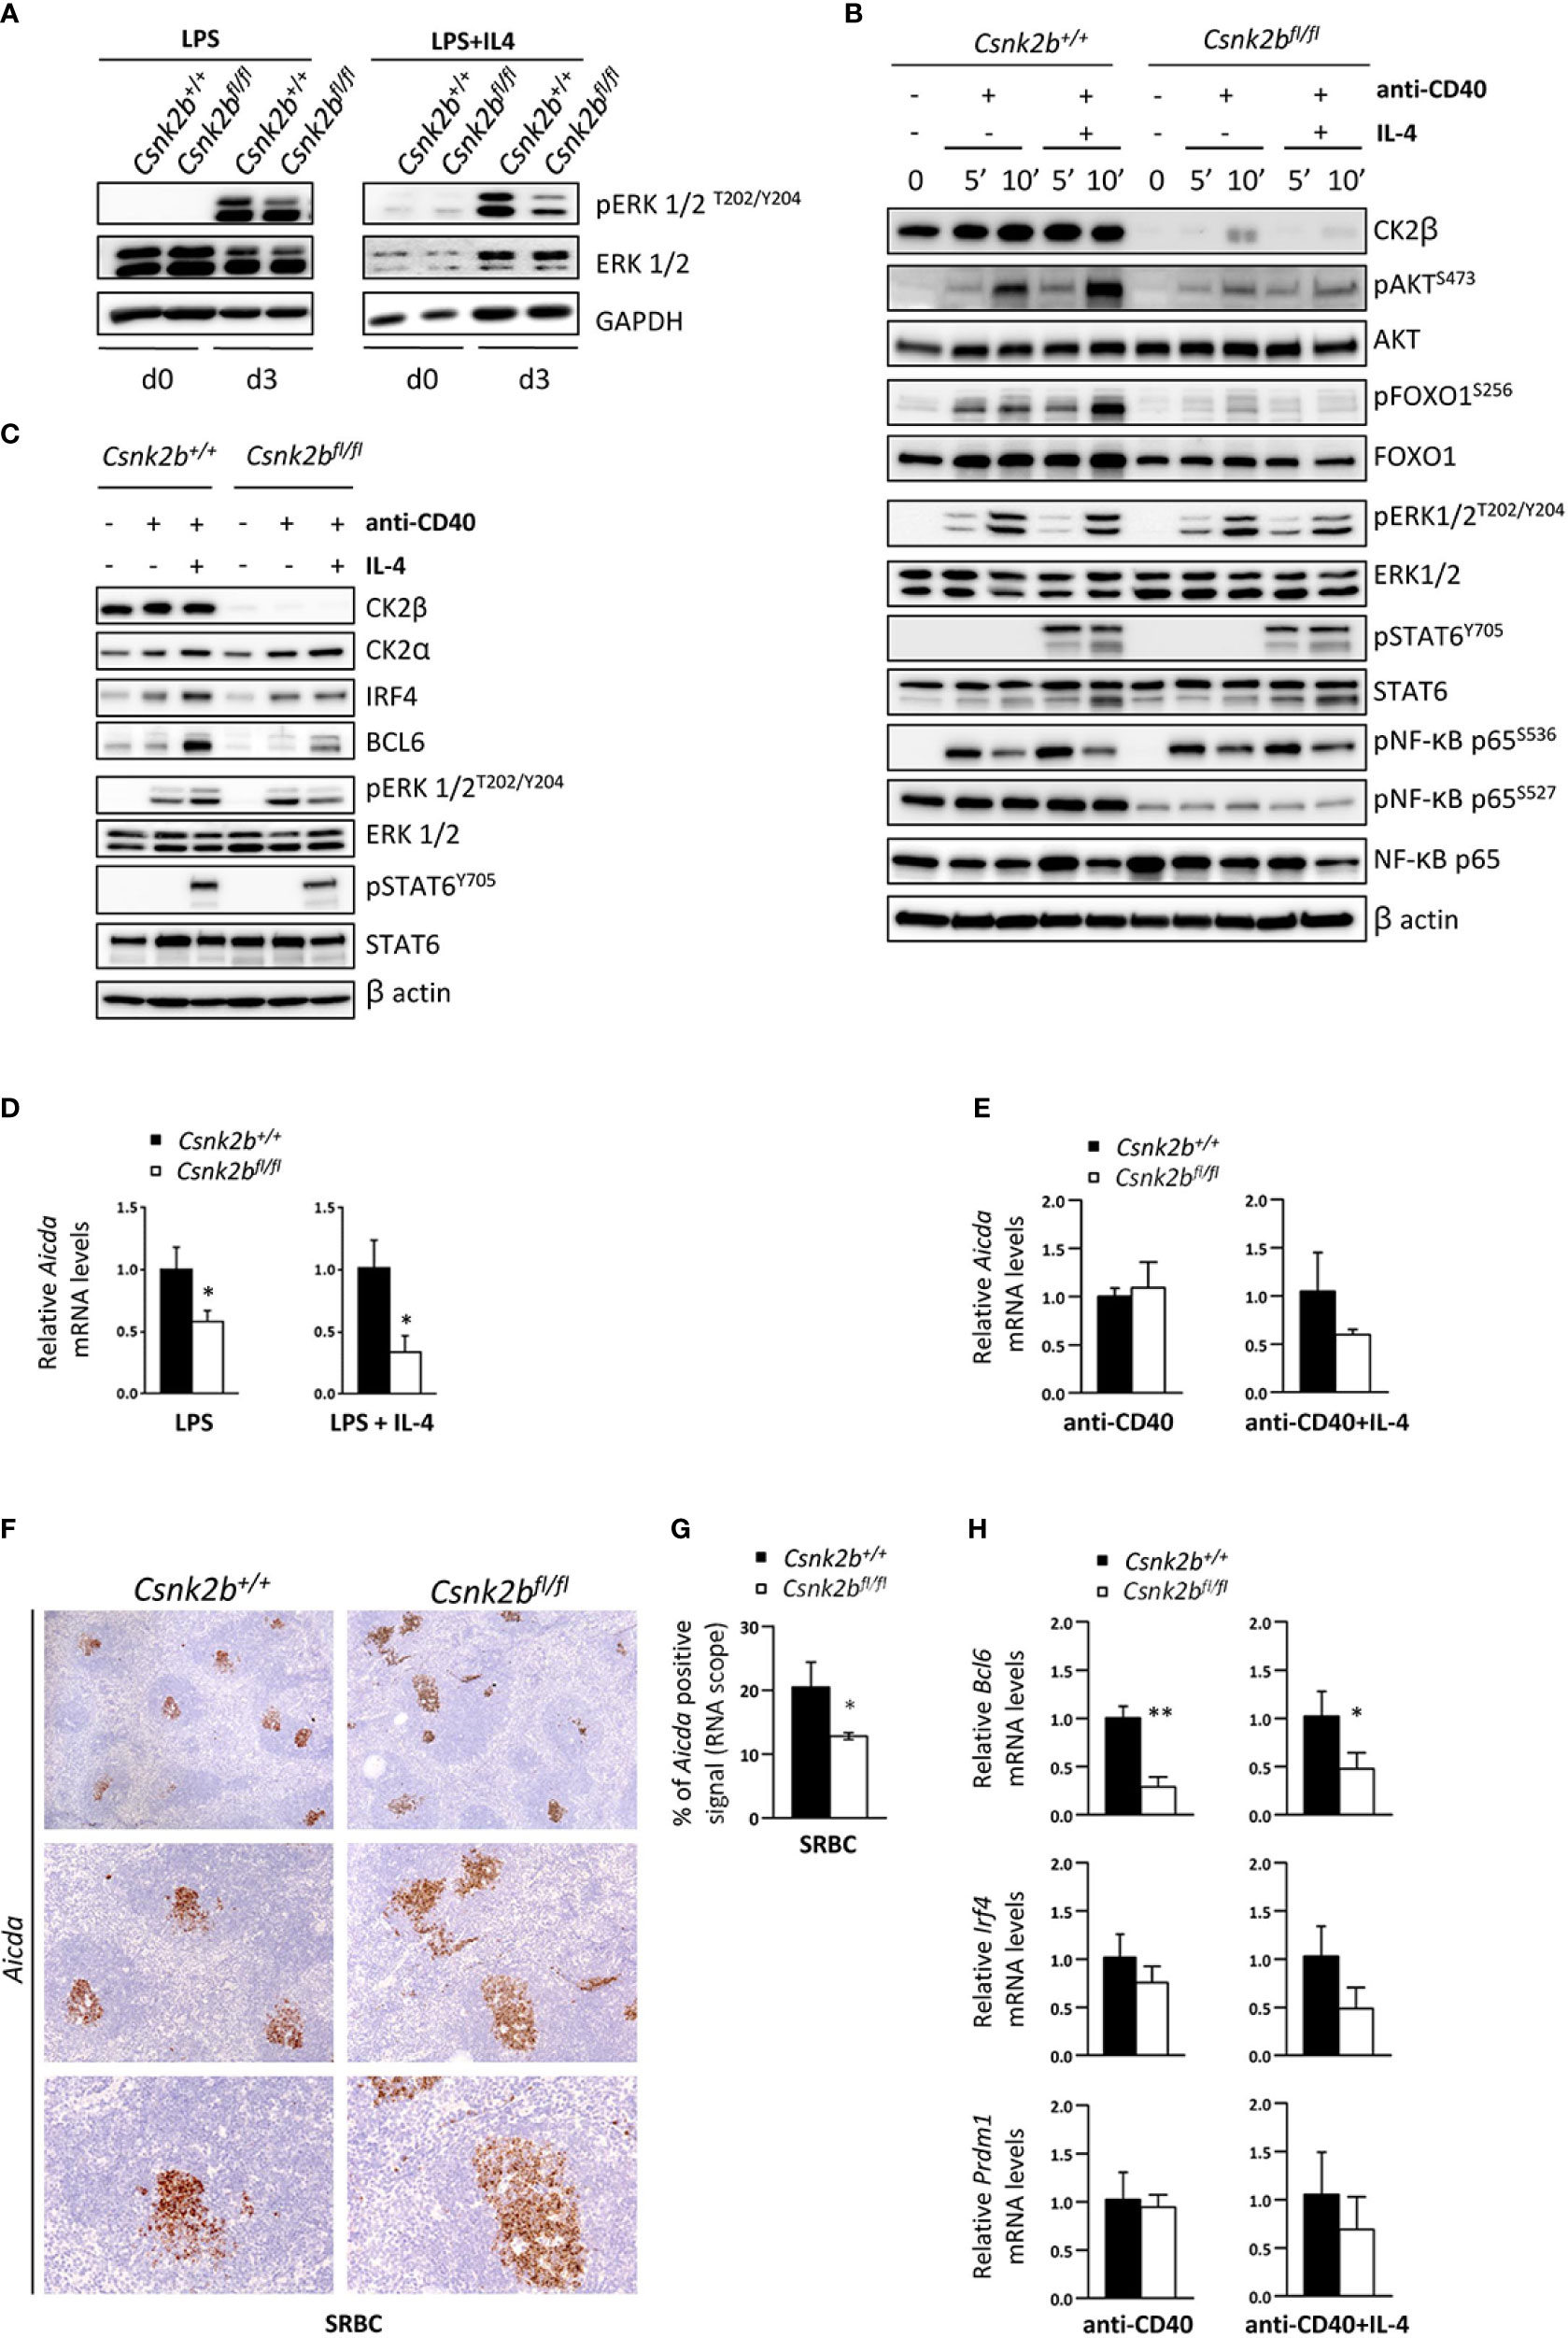
Figure 8 Lack of CK2β alters the activation and expression of molecules important for the GC reaction. (A) WB of pERK1/2 and ERK1/2 in purified splenic B cells at d=0 and d=3 of LPS and LPS+IL4 stimulation. This figure is representative of three independent experiments. (B, C) WB analysis of purified splenic B cells unstimulated and after anti-CD40 ± IL-4. (B) Stimulation for 5 and 10 minutes and (C) for 48 hours. Blots are representative of four independent experiments. In (A-C) at least two spleens were pooled together in each experiment. (D, E) Evaluation by qRT-PCR of Aicda levels in purified splenic B cells after stimulation with LPS ± IL-4 (D) or anti-CD40 ± IL-4 (E). The expression is corrected for Gapdh levels and normalized to CK2βCTRL B cells. Data are shown as mean ± SD (CK2βCTRL n=3; CK2βκO n=3). Statistical significance is determined by Student’s t test (*p < 0.05). (F) Analysis of spleen sections from CK2βCTRL and CK2βκO mice after immunization with SRBC (14 days) stained with RNAscope probes to detect Aicda levels in GCs and counterstained with hematoxylin. In order from top to bottom 4X, 10X, 20X objective magnifications. Images are representative of three controls and three CK2βκO mice. (G) Quantitative analyses of Aicda in situ hybridization signals upon immunization with SRBC for 14 days. Graphs represent mean ± SD obtained by calculating the average percentage of positive signals in five non-overlapping fields for each mouse at high-power magnification using the Positive Pixel Count v9 ImageScope software, Leica Biosystems (n= 3 CK2βCTRL and 3 CK2βκO mice). Statistical significance is determined by Nested t test (*p < 0.05). (H) Bcl6, Irf4 and Prdm1 levels determined by qRT-PCR on purified B cells treated for 48h with anti-CD40 ± IL-4. Data were normalized over Gapdh and CTRL samples, and represented as mean ± SD (n=3). Statistical significance was determined by Student’s t test (*p < 0.05; **p < 0.01). In (A–E, H) the B cell fraction was purified with EasySep™ Mouse B Cell Isolation Kit (Stemcell) and purity was >97%.
We next analyzed the expression of Aicda (AID), the master regulator of SHM and CSR, whose transcription is upregulated upon CD40 and TLR activation (63, 64). LPS or LPS+IL-4 stimulated CK2βKO B cells displayed significantly reduced levels of Aicda as compared to CK2βCTRL B cells (Figure 8D). We observed a trend of reduction also upon anti-CD40+IL-4 treatment (but not with anti-CD40 alone) (Figure 8E). Of note, after SRBC immunization, in situ hybridization with specific probes showed a reduced amount of Aicda in CK2βKO GC regions (Figures 8F, G). Furthermore, we analyzed the expression of the genes encoding for the transcription factors BCL6, IRF4 and BLIMP1 (Prdm1) upon anti-CD40 and anti-CD40+IL-4 stimulation. We observed a lower expression of Bcl6 and a trend of decrease of Irf4 and Prdm1 after anti-CD40+IL-4 in CK2βKO as compared to CK2βCTRL B cells (Figure 8H). Collectively, the results indicate that CK2β positively controls SHM and CSR in GC B cells, while supporting Ag-driven selection of B cells expressing high-affinity Ab variants.
3.9 Chemical CK2 inhibition limits the activation of BCR pathway components in lymphoma cells
We and others previously claimed a potential therapeutic targeting of CK2 in malignant B cells (19, 65, 66). As we implicated CK2 in the GC reaction in healthy murine B cells, we sought to investigate the role of this kinase in malignant GC-derived Diffuse Large B Cell Lymphoma (DLBCL) cells. Firstly, we evaluated the expression levels of CK2α and CK2β, in a panel of ABC- and GCB-DLBCL cell lines. As shown in Figure 9A, immunoblot analysis revealed a similar expression of CK2α in all DLBCL cell lines and variable levels of CK2β. BCL6 and AID are key players in normal GC B cells maturation and BCL6 is implicated in the pathogenesis of certain subtypes of DLBCL (6, 67, 68). Immunoblot analysis indicated variable levels of BCL6 and AID expression in our panel of DLBCL cells (Figure 9A). To test whether CK2 inhibition impaired BCR signaling in DLBCLs, we chose three GCB-DLBCL cell lines, OCI-LY1, OCI-LY18 and Pfeiffer. These cells are BCR-dependent and present high expression of AID and BCL6. We treated these cells with CX-4945 for 6 hours. The blockade of the kinase activity caused a reduced activation of multiple BCR signaling pathway components instrumental for DLBCL survival. Similarly to what was observed in CK2βKO murine B cells, we detected a prominent reduction in pPTENS380/T382/T383, pFOXO1S256, pNF-κBS527 and pAKTS473 after exposure to the inhibitor (Figure 9B). Significantly, we also evidenced in all the three cell lines a notable decrease in BCL6 expression (Figure 9B). Since CX-4945 could affect cell viability and growth, we evaluated apoptosis through AnnexinV/PI staining (Figure 9C), and cell cycle through PI staining (Figure 9D). At the higher dose, CX-4945 caused a mild increase in apoptotic OCI-LY1 and Pfeiffer cells and a slight reduction in PRO-CASPASE 3 levels (Figure 9C). No differences in cell cycle progression were detected in OCI-LY1 and OCI-LY18 cells whereas Pfeiffer showed a limited increase in the subG0/G1 phase accompanied by a modest accumulation of cells in G2/M phase (Figure 9D). The behavior observed in Pfeiffer cells has already been reported by our group in acute myeloid leukemia-derived stem cells (69) and supports the theory of that cell cycle regulation operated by CK2 might be cell-type dependent (70). Since the observed phosphorylation and expression changes are detectable starting from the lower dose of CX-4945, we exclude that they could be due to cell toxicity triggered by CX-4945. These results, mirroring most of the alterations in signaling molecules described in CK2βKO murine B cells, suggest that CK2 is essential in promoting and sustaining the activation of BCR signaling molecules also in DLBCL cells.
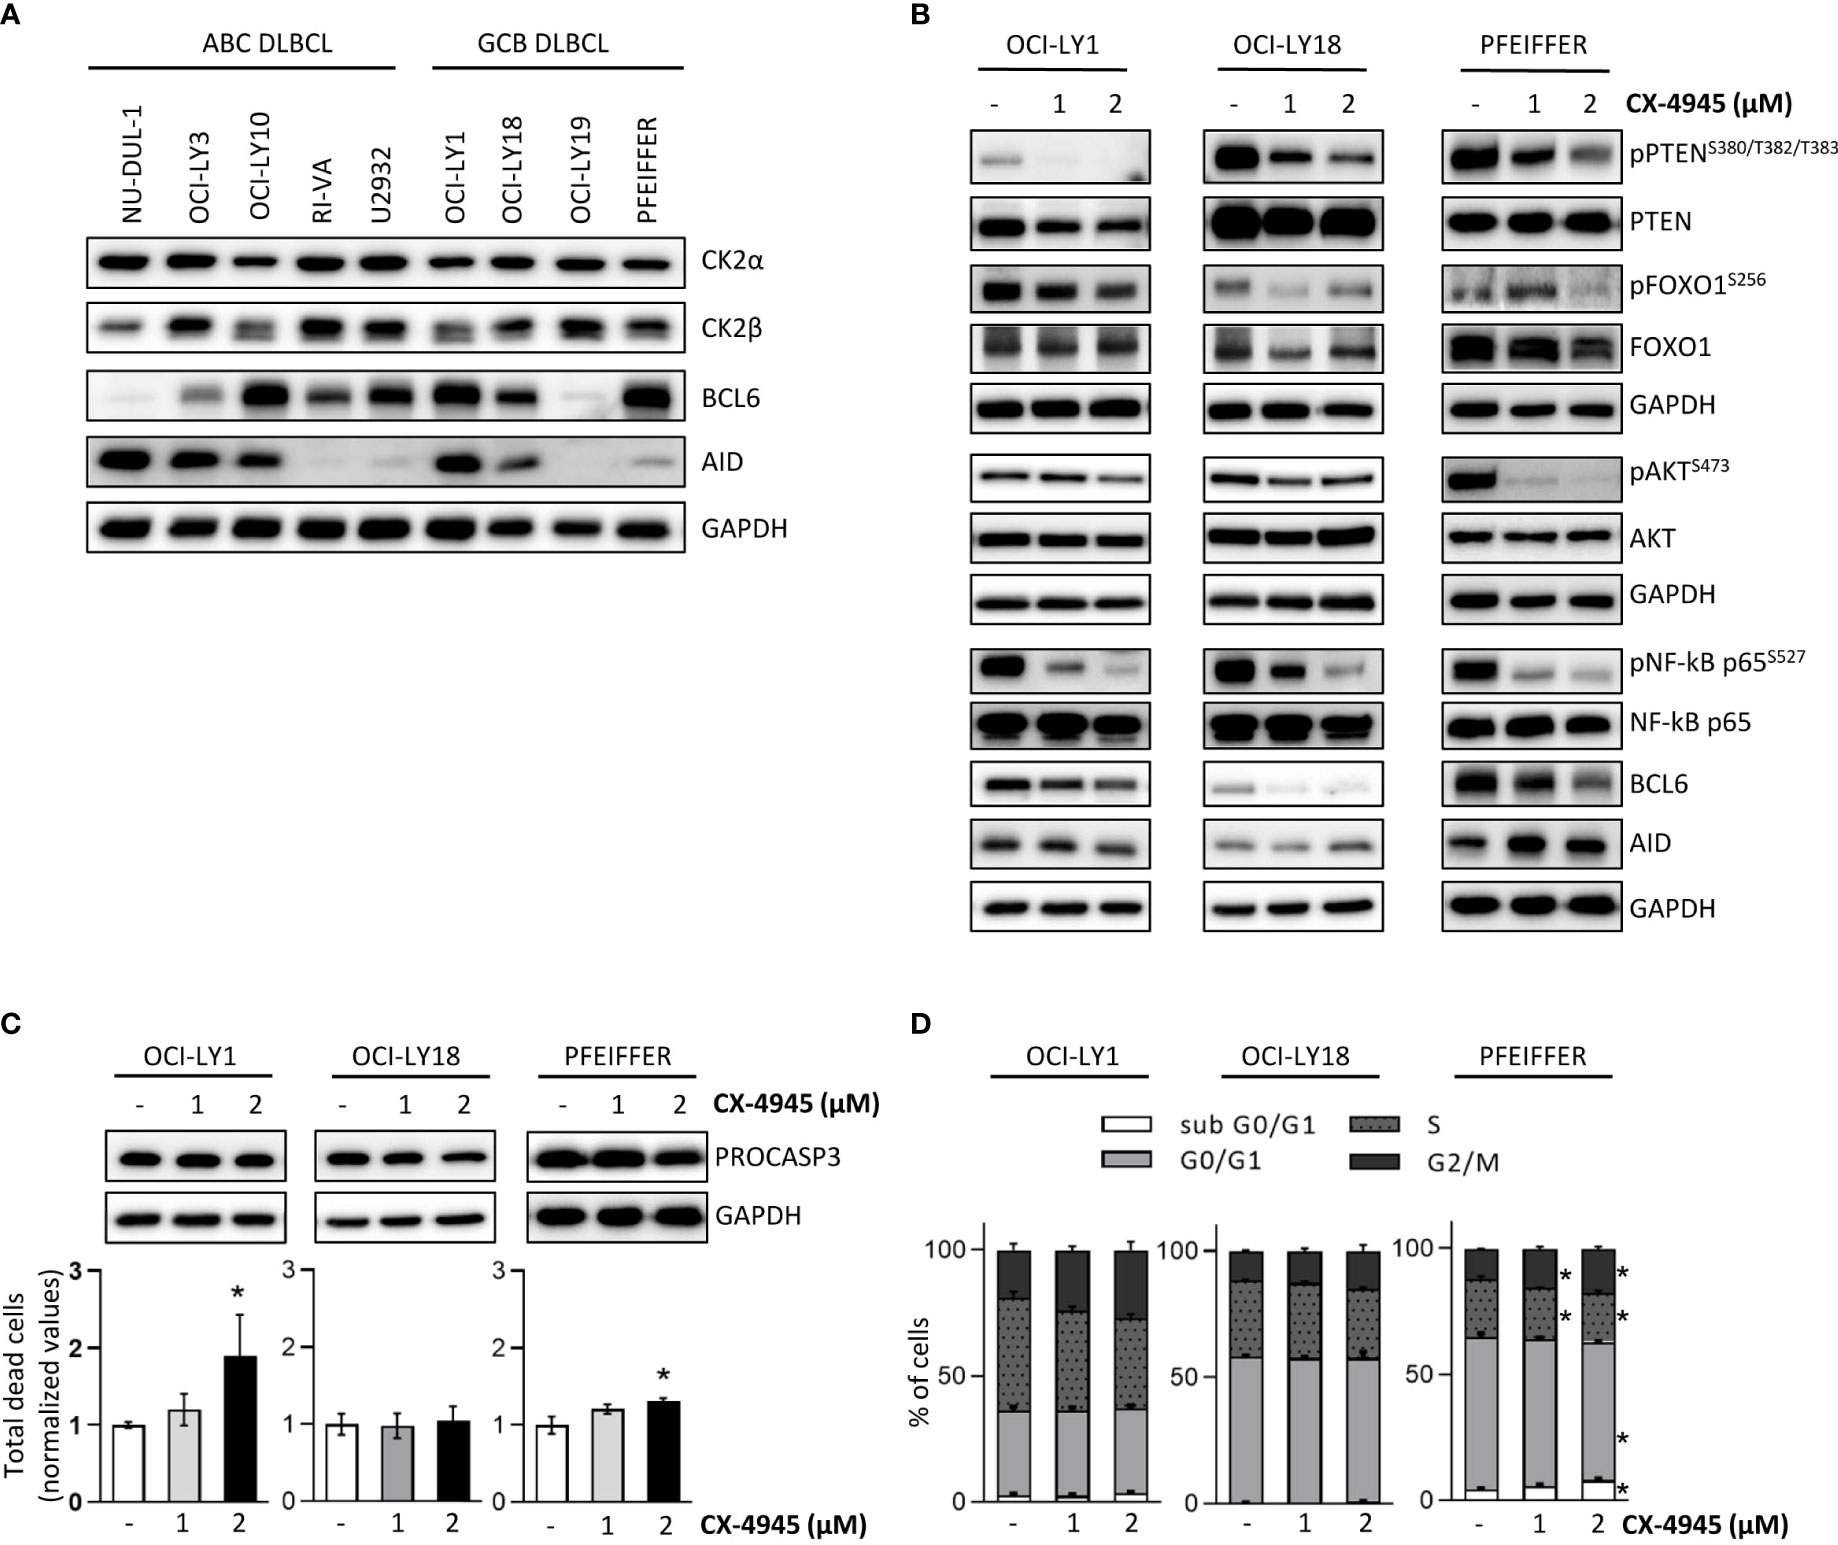
Figure 9 CK2 chemical inhibition reduces the activation and expression of BCR signaling molecules in DLBCL cell lines. (A) WB of CK2α, CK2β, BCL6 and AID baseline expression in a panel of ABC- and GCB DLBCL cell lines. (B) OCI-LY1, OCI-LY18 and Pfeiffer cells treated with CX-4945 (1 and 2µM) for 6 hours. (A, B) are representative of at least three independent experiments. GAPDH was used as a loading control. (C) Evaluation of OCI-LY1, OCI-LY18 and Pfeiffer cell line viability after exposure to CX-4945 (1 and 2µM) for 6 hours. Bottom, Graphs showing the percentages of dead cells after staining with AnnV/PI. Data are represented as mean ± SD of values normalized over the mean of untreated samples. Statistical significance was determined by Mann-Withney test (*p < 0.05) (OCI-Ly1 n=4; OCI-Ly18 n=5; Pfeiffer n=4). Top, representative WB of PRO-CASPASE 3 expression. GAPDH was used as a loading control. (D) Cell cycle analysis in OCI-LY1, OCI-LY18 and Pfeiffer cells upon treatment with CX-4945 (1 and 2µM) for 6 hours. Histograms represent the four phases of the cell cycle. Data are represented as mean ± SD. Statistical significance was determined by Mann-Withney test (*p < 0.05) (OCI-Ly1 n=4; OCI-Ly18 n=5; Pfeiffer n=4).
4 Discussion
In this study, we discovered a novel role for CK2β in normal B cell activation and splenic differentiation. Our results indicate that CK2β is essential for peripheral B cell development, contributes to fully proficient BCR, CD40, IL-4R and TLR signaling, and controls NOTCH2 activity.
Deletion of Csnk2b in CD19+ murine cells led to decreased CK2α kinase activity, reduced recirculating B cells and reduced serum Ab titers, the latter being likely caused to some extent by mild B lymphopenia (Figure 1). In line with a recent report of CK2αKO in B cells (23), our CK2βKO model displayed an increase in MZP and MZ B cells, as evidenced by Flow Cytometry, IF and IHC experiments (Figure 2). Coherently, bona fide MZ B cell markers Rgs10 (71), Ackr3 (35), Asb2 (36) and Dusp16 (37) are upregulated in CK2βKO animals (Figure 3). The essential role of NOTCH2 in promoting a MZ B-cell fate is well known (2, 72) and the observation that NOTCH2 signaling inhibition rescued the MZ B cell accumulation in CK2βKO (Figure 4) and in CK2αKO animals (23) suggests that a balanced MZ B-cell expansion relies on a CK2-dependent mechanism of NOTCH2 regulation. The modulation of the splenic MZ is likely sustained by the previously described CK2-dependent phosphorylation of NOTCH2 (73) and seemingly consequent to the reduced CK2 catalytic activity.
Although CK2αKO and CK2βKO models show similar phenotypes, selective ablation of the catalytic rather than the regulatory subunit is not completely equivalent. Indeed, since α and β components can function in the holoenzyme but also independently from each other, differences between the two models were to be expected. Several authors have described CK2β autonomous functions, in particular as a scaffold protein essential to coordinate and/or assemble multi-protein complexes (74, 75). In detail, the β subunit has been shown to interact with and modulate the activity of a number of other serine/threonine kinases including A-Raf, c-Mos and Chk1 (76, 77). Indeed, we observed a reduction in Fo B cells in CK2βKO mice that was not seen in CK2αKO animals. Since only the loss of β results in decreased levels of Fo B cells, we hypothesize that this regulation might derive from the above-mentioned α-independent functions of CK2β in regulating additional kinases presumably involved in Fo B cell maintenance. In addition, considering that the absolute counts of splenic B cells are not altered in KO mice when compared to control animals, the reduced amount of Fo B cells is to be attributed to the observed differences in BCR signaling strength and NOTCH2 activation (Figures 4, 7).
It has been reported that in basal conditions, commensal microbial population could play a role in the basal stimulation of the immune system and that mice in a pathogen free environment display a fixed number of preexisting niches that are formed by follicular dendritic cells and contain a small amount of GC B cells (78). Indeed, GSEA and GO biological processes enrichment analysis on RNAseq data from purified spleen B cells highlighted in CK2βκO B cells a down-regulation of genes involved in GC biology, regulation of B cell activation and Ig production already at baseline (Figure 3).
Indeed, when using a strong immunizing agent, SRBC, CK2βKO GCs were significantly expanded when compared to controls (Figure 5). This aberrant accumulation of GC B cells was previously described upon Fas deletion (40) and is consistent with the decreased Fas expression observed in CK2βKO mice (Figure 3A). Moreover, results from in vitro stimulation and in vivo immunization experiments indicated that B cells lacking CK2β are less efficient in CSR and in completing NP-specific high affinity maturation through SHM as well as impaired in the capability to generate short-lived PBs (Figure 6). However, only in vitro data highlighted differences in the percentages of PCs between KO and control mice. This discrepancy between in vivo and in vitro results is likely to be partly attributed to the existence of a follicular immune microenvironment comprising T regulatory, T helper and dendritic cells able to trigger PCs generation, which is absent in in vitro settings (79). The evidenced differences between PBs and PCs in CK2βKO mice could be the consequence of potentially different origins of the two populations. While PCs mainly develop from B cells passing through the GC, PBs can also have an extra-follicular origin (80).
In line with GSEA and GO enrichment analysis, CK2βKO B cells displayed lower B cell activation due to impaired signal transduction downstream of multiple surface receptors (Figures 7, 8). Ca2+ mobilization after anti-IgM stimulation was severely defective in KO cells. The altered Ca2+ mobilization upon BCR activation is attributable to upstream signaling defects, as suggested by the flawed phosphorylation of AKT, ERK and p65/RelA in CK2βκO B cells. The reduction in BCR signaling strength, being permissive for NOTCH2 activation, contributes to the skewed differentiation towards a MZ B cell phenotype in CK2βKO mice. In further support of this notion, we found a reduction in B1 B cells, a population developing from fetal liver progenitors (81) that relies on a strong BCR signaling for its development (3, 82). In CK2βKO B cells, acute stimulation with CD40 + IL-4 was associated with an impaired AKT and, to a lower extent, ERK1/2 activation (Figure 8). Upon in vitro stimulation, we observed a compromised PI3K/AKT signaling in CK2βKO B cells with the expected activation of its downstream target FOXO1. Prolonged TLR, CD40 and IL-4R stimulation evidenced a markedly reduced upregulation of critical controllers of the GC reaction and PC development, such as the transcription factors BCL6 and IRF4 in CK2βKO B cells (Figures 8C). Another critical finding, in line with RNAseq data, was the lower Aicda level detected in CK2βKO B cells after LPS stimulation and SRBC immunization (Figures 8D–G). Given the central role of AID in CSR, SHM and affinity maturation of Ag-engaged B cells (83), these findings could in part explain why CK2βKO mice are not able to efficiently produce class-switched Ig and complete Ab affinity maturation, as demonstrated by the reduced frequency of W33L point mutation in VH186.2 genes upon NP immunization (Table 1).
The signaling changes seen in normal murine B cells after CK2β loss prompted us to analyze the consequences of CK2 inactivation in malignant GC-derived B cells. In DLBCL cells, CK2α inhibition caused a reduction in the phosphorylation of AKT, FOXO, and p65/RelA, combined with decreased BCL6 expression (Figure 9B), similarly to what was observed in normal murine B cells (Figures 8B). Together with previously described findings of CK2 upregulation in various cancers, this data supports the hypothesis that, although CK2 by itself is not an oncogene, it might have a role in sustaining the process of malignant transformation, proliferation and survival as previously argued in this and other hematologic malignancies (16, 19, 21, 66, 84–87).
In conclusion, our work has shown that CK2β orchestrates mature B cell fate and is involved in the regulation of the GC reaction by acting at multiple levels in the B cell signaling network. Although the signaling defects observed in KO animals are likely dependent on the impaired activity of the CK2 holoenzyme, we hypothesize that an α-independent role of CK2β is at the basis of the observed reduction in Fo B cells. Further studies are needed to elucidate CK2α-dependent and independent effects in the observed phenotype. Additionally, we also demonstrate that CK2-dependent signaling is exploited by malignant B cells for proliferation and survival.
Data availability statement
The datasets presented in this study can be found in online repositories. The names of the repository/repositories and accession number(s) can be found below: Gene Expression Omnibus (http://www.ncbi.nlm.nih.gov/geo) under accession number GSE89082.
Ethics statement
The animal study was reviewed and approved by Italian Ministry of Health (Prot. number 126/2015 and Prot. 205/2022).
Author contributions
FP devised the study. EM, LQT, SCN, AA, FZ, SM, AC, SZ and PM performed the experiments. EM, LQT, FZ, AC, SM, SZ, and PM developed methodology. AV helped designing the calcium study. OFC and BB provided the mice. MP and AD performed immunohistochemistry. NV and GV performed the RNAseq. SC and FM designed and contributed to execute experiments to analyze germinal center B cell responses. VC, AG, and CT performed RNA scope. EM, LQT, SCN, FZ, AC, FP, MP, SZ, NV, and PM analyzed data and made the figures. CWS provided α-NRR2 reagent. LQT, EM, SCN, SC, FM and FP wrote the manuscript. LT, GS, SM, SC and FP provided funding. All authors contributed to the article and approved the submitted version.
Funding
This work was supported by grants from the Italian Ministry of Education, University and Research (FIRB - Futuro in Ricerca - RBFR086EW9 to FP and PRIN (Progetti di rilevante interesse nazionale)-MIUR Prot.2017ZXT5WR to SM, from the Associazione Italiana per la Ricerca sul Cancro (AIRC; #14481 and #18387 to F:P, #15286 to G.S.; #2524 to LT), from the University of Padova (Progetti di Ricerca di Ateneo; CPDA114940/11) to FP, from Ricerca per Credere nella vita (R.C.V) ODV to LT and from the Italian Association for Cancer Research (AIRC; IG grant #23747) to SC. FZ was supported by FIRC-AIRC ‘Patrizia Baroni’ and FIRC-AIRC ‘Hard Rock Cafè Venezia’ fellowships.
Acknowledgments
The authors thank S. Indraccolo (Istituto Oncologico Veneto, Padova, Italy) for helpful discussion and critical reading of the manuscript; A. Cabrelle (Venetian Institute of Molecular Medicine, Padova, Italy) for FACS sorting; M. Albiero (Venetian Institute of Molecular Medicine, Padova, Italy) for murine retro-orbital blood uptake; V. Guzzardo (Department of Medicine, Cytopathology and Surgical Pathology Unit, University of Padova, Padova, Italy) for tissue inclusions and sections. The authors thank the reviewers for their valuable comments and suggestions to improve the original manuscript.
Conflict of interest
CWS is employed at Genentech, Inc.
The remaining authors declare that the research was conducted in the absence of any commercial or financial relationships that could be construed as a potential conflict of interest.
Publisher’s note
All claims expressed in this article are solely those of the authors and do not necessarily represent those of their affiliated organizations, or those of the publisher, the editors and the reviewers. Any product that may be evaluated in this article, or claim that may be made by its manufacturer, is not guaranteed or endorsed by the publisher.
Supplementary material
The Supplementary Material for this article can be found online at: https://www.frontiersin.org/articles/10.3389/fimmu.2022.959138/full#supplementary-material
References
1. Monroe JG, Dorshkind K. Fate decisions regulating bone marrow and peripheral b lymphocyte development. Adv Immunol (2007) 95:1–50. doi: 10.1016/S0065-2776(07)95001-4
2. Pillai S, Cariappa A. The follicular versus marginal zone b lymphocyte cell fate decision. Nat Rev Immunol (2009) 9(11):767–77. doi: 10.1038/nri2656
3. Casola S, Otipoby KL, Alimzhanov M, Humme S, Uyttersprot N, Kutok JL, et al. B cell receptor signal strength determines b cell fate. Nat Immunol (2004) 5(3):317–27. doi: 10.1038/ni1036
4. Pieper K, Grimbacher B, Eibel H. B-cell biology and development. J Allergy Clin Immunol (2013) 131(4):959–71. doi: 10.1016/j.jaci.2013.01.046
5. Miao Y, Medeiros LJ, Li Y, Li J, Young KH. Genetic alterations and their clinical implications in DLBCL. Nat Rev Clin Oncol (2019) 16(10):634–52. doi: 10.1038/s41571-019-0225-1
6. Chapuy B, Stewart C, Dunford AJ, Kim J, Kamburov A, Redd RA, et al. Molecular subtypes of diffuse large b cell lymphoma are associated with distinct pathogenic mechanisms and outcomes. Nat Med (2018) 24(5):679–90. doi: 10.1038/s41591-018-0016-8
7. Schmitz R, Wright GW, Huang DW, Johnson CA, Phelan JD, Wang JQ, et al. Genetics and pathogenesis of diffuse Large b-cell lymphoma. N Engl J Med (2018) 378(15):1396–407. doi: 10.1056/NEJMoa1801445
8. Treon SP, Xu L, Yang G, Zhou Y, Liu X, Cao Y, et al. MYD88 L265P somatic mutation in waldenstrom's macroglobulinemia. N Engl J Med (2012) 367(9):826–33. doi: 10.1056/NEJMoa1200710
9. Jerkeman M, Hallek M, Dreyling M, Thieblemont C, Kimby E, Staudt L. Targeting of b-cell receptor signalling in b-cell malignancies. J Intern Med (2017) 282(5):415–28. doi: 10.1111/joim.12600
10. Kramerov AA, Ljubimov AV. Focus on molecules: protein kinase CK2. Exp Eye Res (2012) 101:111–2. doi: 10.1016/j.exer.2010.12.011
11. Borgo C, Ruzzene M. Role of protein kinase CK2 in antitumor drug resistance. J Exp Clin Cancer Res (2019) 38(1):287. doi: 10.1186/s13046-019-1292-y
12. Filhol O, Cochet C. Protein kinase CK2 in health and disease: Cellular functions of protein kinase CK2: a dynamic affair. Cell Mol Life Sci (2009) 66(11-12):1830–9. doi: 10.1007/s00018-009-9151-1
13. Piazza F, Manni S, Ruzzene M, Pinna LA, Gurrieri C, Semenzato G. Protein kinase CK2 in hematologic malignancies: reliance on a pivotal cell survival regulator by oncogenic signaling pathways. Leukemia (2012) 26(6):1174–9. doi: 10.1038/leu.2011.385
14. Pinna LA, Allende JE. Protein kinase CK2 in health and disease: Protein kinase CK2: an ugly duckling in the kinome pond. Cell Mol Life Sci (2009) 66(11-12):1795–9. doi: 10.1007/s00018-009-9148-9
15. Salvi M, Borgo C, Pinna LA, Ruzzene M. Targeting CK2 in cancer: a valuable strategy or a waste of time? Cell Death Discovery (2021) 7(1):325. doi: 10.1038/s41420-021-00717-4
16. Piazza FA, Ruzzene M, Gurrieri C, Montini B, Bonanni L, Chioetto G, et al. Multiple myeloma cell survival relies on high activity of protein kinase CK2. Blood (2006) 108(5):1698–707. doi: 10.1182/blood-2005-11-013672
17. Martins LR, Lucio P, Silva MC, Anderes KL, Gameiro P, Silva MG, et al. Targeting CK2 overexpression and hyperactivation as a novel therapeutic tool in chronic lymphocytic leukemia. Blood (2010) 116(15):2724–31. doi: 10.1182/blood-2010-04-277947
18. Manni S, Brancalion A, Mandato E, Tubi LQ, Colpo A, Pizzi M, et al. Protein kinase CK2 inhibition down modulates the NF-kappaB and STAT3 survival pathways, enhances the cellular proteotoxic stress and synergistically boosts the cytotoxic effect of bortezomib on multiple myeloma and mantle cell lymphoma cells. PloS One (2013) 8(9):e75280. doi: 10.1371/journal.pone.0075280
19. Mandato E, Manni S, Zaffino F, Semenzato G, Piazza F. Targeting CK2-driven non-oncogene addiction in b-cell tumors. Oncogene (2016) 35(47):6045–52. doi: 10.1038/onc.2016.86
20. Manni S, Carrino M, Piazza F. Role of protein kinases CK1alpha and CK2 in multiple myeloma: regulation of pivotal survival and stress-managing pathways. J Hematol Oncol (2017) 10(1):157. doi: 10.1186/s13045-017-0529-5
21. Spinello Z, Fregnani A, Quotti Tubi L, Trentin L, Piazza F, Manni S. Targeting protein kinases in blood cancer: Focusing on CK1alpha and CK2. Int J Mol Sci (2021) 22(7). doi: 10.3390/ijms22073716
22. Manni S, Pesavento M, Spinello Z, Saggin L, Arjomand A, Fregnani A, et al. Protein kinase CK2 represents a new target to boost ibrutinib and venetoclax induced cytotoxicity in mantle cell lymphoma. Front Cell Dev Biol (2022) 10:935023. doi: 10.3389/fcell.2022.935023
23. Wei H, Yang W, Hong H, Yan Z, Qin H, Benveniste EN. Protein kinase CK2 regulates b cell development and differentiation. J Immunol (2021) 207(3):799–808. doi: 10.4049/jimmunol.2100059
24. Buchou T, Vernet M, Blond O, Jensen HH, Pointu H, Olsen BB, et al. Disruption of the regulatory beta subunit of protein kinase CK2 in mice leads to a cell-autonomous defect and early embryonic lethality. Mol Cell Biol (2003) 23(3):908–15. doi: 10.1128/MCB.23.3.908-915.2003
25. Saraiva L, Wang L, Kammel M, Kummrow A, Atkinson E, Lee JY, et al. Comparison of volumetric and bead-based counting of CD34 cells by single-platform flow cytometry. Cytometry B Clin Cytom (2019) 96(6):508–13. doi: 10.1002/cyto.b.21773
26. Simonetti G, Carette A, Silva K, Wang H, De Silva NS, Heise N, et al. IRF4 controls the positioning of mature b cells in the lymphoid microenvironments by regulating NOTCH2 expression and activity. J Exp Med (2013) 210(13):2887–902. doi: 10.1084/jem.20131026
27. Martin M. Cutadapt removes adapter sequences from high-throughput sequencing reads. EMBnetjournal (2011) 17(1):10. doi: 10.14806/ej.17.1.200
28. Dobin A, Davis CA, Schlesinger F, Drenkow J, Zaleski C, Jha S, et al. STAR: ultrafast universal RNA-seq aligner. Bioinformatics (2013) 29(1):15–21. doi: 10.1093/bioinformatics/bts635
29. Langmead B, Salzberg SL. Fast gapped-read alignment with bowtie 2. Nat Methods (2012) 9(4):357–9. doi: 10.1038/nmeth.1923
30. Risso D, Schwartz K, Sherlock G, Dudoit S. GC-content normalization for RNA-seq data. BMC Bioinf (2011) 12:480. doi: 10.1186/1471-2105-12-480
31. Robinson MD, McCarthy DJ, Smyth GK. edgeR: a bioconductor package for differential expression analysis of digital gene expression data. Bioinformatics (2010) 26(1):139–40. doi: 10.1093/bioinformatics/btp616
32. Esposito G, Texido G, Betz UA, Gu H, Muller W, Klein U, et al. Mice reconstituted with DNA polymerase beta-deficient fetal liver cells are able to mount a T cell-dependent immune response and mutate their ig genes normally. Proc Natl Acad Sci U S A (2000) 97(3):1166–71. doi: 10.1073/pnas.97.3.1166
33. Allen D, Cumano A, Dildrop R, Kocks C, Rajewsky K, Rajewsky N, et al. Timing, genetic requirements and functional consequences of somatic hypermutation during b-cell development. Immunol Rev (1987) 96:5–22. doi: 10.1111/j.1600-065X.1987.tb00506.x
34. Yasuda T, Saito Y, Ono C, Kawata K, Baba A, Baba Y. Generation and characterization of CD19-iCre mice as a tool for efficient and specific conditional gene targeting in b cells. Sci Rep (2021) 11(1):5524. doi: 10.1038/s41598-021-84786-6
35. Wang H, Beaty N, Chen S, Qi CF, Masiuk M, Shin DM, et al. The CXCR7 chemokine receptor promotes b-cell retention in the splenic marginal zone and serves as a sink for CXCL12. Blood (2012) 119(2):465–8. doi: 10.1182/blood-2011-03-343608
36. Zhang P, Zhao Y, Sun XH. Notch-regulated periphery b cell differentiation involves suppression of e protein function. J Immunol (2013) 191(2):726–36. doi: 10.4049/jimmunol.1202134
37. Kin NW, Crawford DM, Liu J, Behrens TW, Kearney JF. DNA Microarray gene expression profile of marginal zone versus follicular b cells and idiotype positive marginal zone b cells before and after immunization with streptococcus pneumoniae. J Immunol (2008) 180(10):6663–74. doi: 10.4049/jimmunol.180.10.6663
38. Gururajan M, Jacob J, Pulendran B. Toll-like receptor expression and responsiveness of distinct murine splenic and mucosal b-cell subsets. PloS One (2007) 2(9):e863. doi: 10.1371/journal.pone.0000863
39. Xu Z, Pone EJ, Al-Qahtani A, Park SR, Zan H, Casali P. Regulation of aicda expression and AID activity: relevance to somatic hypermutation and class switch DNA recombination. Crit Rev Immunol (2007) 27(4):367–97. doi: 10.1615/CritRevImmunol.v27.i4.60
40. Hao Z, Duncan GS, Seagal J, Su YW, Hong C, Haight J, et al. Fas receptor expression in germinal-center b cells is essential for T and b lymphocyte homeostasis. Immunity (2008) 29(4):615–27. doi: 10.1016/j.immuni.2008.07.016
41. Ise W, Fujii K, Shiroguchi K, Ito A, Kometani K, Takeda K, et al. T Follicular helper cell-germinal center b cell interaction strength regulates entry into plasma cell or recycling germinal center cell fate. Immunity (2018) 48(4):702–15 e4. doi: 10.1016/j.immuni.2018.03.027
42. Lu P, Shih C, Qi H. Ephrin B1-mediated repulsion and signaling control germinal center T cell territoriality and function. Science (2017) 356(6339). doi: 10.1126/science.aai9264
43. Patzelt T, Keppler SJ, Gorka O, Thoene S, Wartewig T, Reth M, et al. Foxp1 controls mature b cell survival and the development of follicular and b-1 b cells. Proc Natl Acad Sci U S A (2018) 115(12):3120–5. doi: 10.1073/pnas.1711335115
44. Wu Y, Cain-Hom C, Choy L, Hagenbeek TJ, de Leon GP, Chen Y, et al. Therapeutic antibody targeting of individual notch receptors. Nature (2010) 464(7291):1052–7. doi: 10.1038/nature08878
45. Weiss U, Rajewsky K. The repertoire of somatic antibody mutants accumulating in the memory compartment after primary immunization is restricted through affinity maturation and mirrors that expressed in the secondary response. J Exp Med (1990) 172(6):1681–9. doi: 10.1084/jem.172.6.1681
46. Smith KG, Light A, Nossal GJ, Tarlinton DM. The extent of affinity maturation differs between the memory and antibody-forming cell compartments in the primary immune response. EMBO J (1997) 16(11):2996–3006. doi: 10.1093/emboj/16.11.2996
47. Basso K. Biology of germinal center b cells relating to lymphomagenesis. Hemasphere (2021) 5(6):e582. doi: 10.1097/HS9.0000000000000582
48. Pierre F, Chua PC, O'Brien SE, Siddiqui-Jain A, Bourbon P, Haddach M, et al. Pre-clinical characterization of CX-4945, a potent and selective small molecule inhibitor of CK2 for the treatment of cancer. Mol Cell Biochem (2011) 356(1-2):37–43. doi: 10.1007/s11010-011-0956-5
49. Pierre F, Chua PC, O'Brien SE, Siddiqui-Jain A, Bourbon P, Haddach M, et al. Discovery and SAR of 5-(3-chlorophenylamino)benzo[c][2,6]naphthyridine-8-carboxylic acid (CX-4945), the first clinical stage inhibitor of protein kinase CK2 for the treatment of cancer. J Med Chem (2011) 54(2):635–54. doi: 10.1021/jm101251q
50. Kurosaki T, Maeda A, Ishiai M, Hashimoto A, Inabe K, Takata M. Regulation of the phospholipase c-gamma2 pathway in b cells. Immunol Rev (2000) 176:19–29. doi: 10.1034/j.1600-065X.2000.00605.x
51. Supattapone S, Danoff SK, Theibert A, Joseph SK, Steiner J, Snyder SH. Cyclic AMP-dependent phosphorylation of a brain inositol trisphosphate receptor decreases its release of calcium. Proc Natl Acad Sci U S A (1988) 85(22):8747–50. doi: 10.1073/pnas.85.22.8747
52. Krizanova O, Ondrias K. The inositol 1,4,5-trisphosphate receptor–transcriptional regulation and modulation by phosphorylation. Gen Physiol Biophys (2003) 22(3):295–311.
53. Zumerle S, Cali B, Munari F, Angioni R, Di Virgilio F, Molon B, et al. Intercellular calcium signaling induced by ATP potentiates macrophage phagocytosis. Cell Rep (2019) 27(1):1–10 e4. doi: 10.1016/j.celrep.2019.03.011
54. Niiro H, Clark EA. Regulation of b-cell fate by antigen-receptor signals. Nat Rev Immunol (2002) 2(12):945–56. doi: 10.1038/nri955
55. Thome M. CARMA1, BCL-10 and MALT1 in lymphocyte development and activation. Nat Rev Immunol (2004) 4(5):348–59. doi: 10.1038/nri1352
56. Torres J, Pulido R. The tumor suppressor PTEN is phosphorylated by the protein kinase CK2 at its c terminus. implications for PTEN stability to proteasome-mediated degradation. J Biol Chem (2001) 276(2):993–8. doi: 10.1074/jbc.M009134200
57. Szydlowski M, Jablonska E, Juszczynski P. FOXO1 transcription factor: a critical effector of the PI3K-AKT axis in b-cell development. Int Rev Immunol (2014) 33(2):146–57. doi: 10.3109/08830185.2014.885022
58. Scheffler L, Feicht S, Babushku T, Kuhn LB, Ehrenberg S, Frankenberger S, et al. ERK phosphorylation is RAF independent in naive and activated b cells but RAF dependent in plasma cell differentiation. Sci Signal (2021) 14(682). doi: 10.1126/scisignal.abc1648
59. Yasuda T, Kometani K, Takahashi N, Imai Y, Aiba Y, Kurosaki T. ERKs induce expression of the transcriptional repressor blimp-1 and subsequent plasma cell differentiation. Sci Signal (2011) 4(169):ra25. doi: 10.1126/scisignal.2001592
60. van Kooten C, Banchereau J. CD40-CD40 ligand. J Leukoc Biol (2000) 67(1):2–17. doi: 10.1002/jlb.67.1.2
61. Ochiai K, Maienschein-Cline M, Simonetti G, Chen J, Rosenthal R, Brink R, et al. Transcriptional regulation of germinal center b and plasma cell fates by dynamical control of IRF4. Immunity (2013) 38(5):918–29. doi: 10.1016/j.immuni.2013.04.009
62. Klein U, Casola S, Cattoretti G, Shen Q, Lia M, Mo T, et al. Transcription factor IRF4 controls plasma cell differentiation and class-switch recombination. Nat Immunol (2006) 7(7):773–82. doi: 10.1038/ni1357
63. Laffleur B, Denis-Lagache N, Peron S, Sirac C, Moreau J, Cogne M. AID-induced remodeling of immunoglobulin genes and b cell fate. Oncotarget (2014) 5(5):1118–31. doi: 10.18632/oncotarget.1546
64. Kumar R, DiMenna LJ, Chaudhuri J, Evans T. Biological function of activation-induced cytidine deaminase (AID). BioMed J (2014) 37(5):269–83. doi: 10.4103/2319-4170.128734
65. Zhou Y, Lian H, Shen N, Korm S, Kwok Ping Lam A, Layton O, et al. The multifaceted role of protein kinase CK2 in high-risk acute lymphoblastic leukemia. Haematologica (2021) 106(5):1461–5. doi: 10.3324/haematol.2020.246918
66. Silva A, Jotta PY, Silveira AB, Ribeiro D, Brandalise SR, Yunes JA, et al. Regulation of PTEN by CK2 and Notch1 in primary T-cell acute lymphoblastic leukemia: rationale for combined use of CK2- and gamma-secretase inhibitors. Haematologica (2010) 95(4):674–8. doi: 10.3324/haematol.2009.011999
67. Cerchietti L, Melnick A. Targeting BCL6 in diffuse large b-cell lymphoma: what does this mean for the future treatment? Expert Rev Hematol (2013) 6(4):343–5. doi: 10.1586/17474086.2013.826928
68. Wright GW, Wilson WH, Staudt LM. Genetics of diffuse Large b-cell lymphoma. N Engl J Med (2018) 379(5):493–4. doi: 10.1056/NEJMc1806191
69. Quotti Tubi L, Canovas Nunes S, Brancalion A, Doriguzzi Breatta E, Manni S, Mandato E, et al. Protein kinase CK2 regulates AKT, NF-kappaB and STAT3 activation, stem cell viability and proliferation in acute myeloid leukemia. Leukemia (2017) 31(2):292–300. doi: 10.1038/leu.2016.209
70. Siddiqui YH, Kershaw RM, Humphreys EH, Assis Junior EM, Chaudhri S, Jayaraman PS, et al. CK2 abrogates the inhibitory effects of PRH/HHEX on prostate cancer cell migration and invasion and acts through PRH to control cell proliferation. Oncogenesis (2017) 6(1):e293. doi: 10.1038/oncsis.2016.82
71. Haller C, Fillatreau S, Hoffmann R, Agenes F. Structure, chromosomal localization and expression of the mouse regulator of G-protein signaling10 gene (mRGS10). Gene (2002) 297(1-2):39–49. doi: 10.1016/S0378-1119(02)00883-1
72. Saito T, Chiba S, Ichikawa M, Kunisato A, Asai T, Shimizu K, et al. Notch2 is preferentially expressed in mature b cells and indispensable for marginal zone b lineage development. Immunity (2003) 18(5):675–85. doi: 10.1016/S1074-7613(03)00111-0
73. Ranganathan P, Vasquez-Del Carpio R, Kaplan FM, Wang H, Gupta A, VanWye JD, et al. Hierarchical phosphorylation within the ankyrin repeat domain defines a phosphoregulatory loop that regulates notch transcriptional activity. J Biol Chem (2011) 286(33):28844–57. doi: 10.1074/jbc.M111.243600
74. Borgo C, Franchin C, Cesaro L, Zaramella S, Arrigoni G, Salvi M, et al. A proteomics analysis of CK2beta((-/-)) C2C12 cells provides novel insights into the biological functions of the non-catalytic beta subunit. FEBS J (2019) 286(8):1561–75. doi: 10.1111/febs.14799
75. Ho Y, Gruhler A, Heilbut A, Bader GD, Moore L, Adams SL, et al. Systematic identification of protein complexes in saccharomyces cerevisiae by mass spectrometry. Nature (2002) 415(6868):180–3. doi: 10.1038/415180a
76. Hagemann C, Kalmes A, Wixler V, Wixler L, Schuster T, Rapp UR. The regulatory subunit of protein kinase CK2 is a specific a-raf activator. FEBS Lett (1997) 403(2):200–2. doi: 10.1016/S0014-5793(97)00011-2
77. Guerra B, Issinger OG, Wang JY. Modulation of human checkpoint kinase Chk1 by the regulatory beta-subunit of protein kinase CK2. Oncogene (2003) 22(32):4933–42. doi: 10.1038/sj.onc.1206721
78. Avancenaa P, Songa T, Yaoa Y, Fehlner-Peachb H, Diamonda B, Gud H, et al. The magnitude of germinal center reactions is restricted by a fixed number of preexisting niches. Pnas (2021) 118(30). doi: 10.1073/pnas.2100576118
79. Mesin L, Ersching J, Victora GD. Germinal center b cell dynamics. Immunity (2016) 45(3):471–82. doi: 10.1016/j.immuni.2016.09.001
80. Khodadadi L, Cheng Q, Radbruch A, Hiepe F. The maintenance of memory plasma cells. Front Immunol (2019) 10:721. doi: 10.3389/fimmu.2019.00721
81. Montecino-Rodriguez E, Leathers H, Dorshkind K. Identification of a b-1 b cell-specified progenitor. Nat Immunol (2006) 7(3):293–301. doi: 10.1038/ni1301
82. Lam KP, Rajewsky K. B cell antigen receptor specificity and surface density together determine b-1 versus b-2 cell development. J Exp Med (1999) 190(4):471–7. doi: 10.1084/jem.190.4.471
83. Feng Y, Seija N, Di Noia JM, Martin A. AID in antibody diversification: There and back again. Trends Immunol (2020) 41(7):586–600. doi: 10.1016/j.it.2020.04.009
84. Pizzi M, Piazza F, Agostinelli C, Fuligni F, Benvenuti P, Mandato E, et al. Protein kinase CK2 is widely expressed in follicular, burkitt and diffuse large b-cell lymphomas and propels malignant b-cell growth. Oncotarget (2015) 6(9):6544–52. doi: 10.18632/oncotarget.3446
85. Kelliher MA, Seldin DC, Leder P. Tal-1 induces T cell acute lymphoblastic leukemia accelerated by casein kinase IIalpha. EMBO J (1996) 15(19):5160–6. doi: 10.1002/j.1460-2075.1996.tb00900.x
86. Channavajhala P, Seldin DC. Functional interaction of protein kinase CK2 and c-myc in lymphomagenesis. Oncogene (2002) 21(34):5280–8. doi: 10.1038/sj.onc.1205640
Keywords: B lymphocyte, B cell development, protein kinase CK2, marginal zone, germinal center, Diffuse large B cell lymphoma, B cell receptor signaling
Citation: Quotti Tubi L, Mandato E, Canovas Nunes S, Arjomand A, Zaffino F, Manni S, Casellato A, Macaccaro P, Vitulo N, Zumerle S, Filhol O, Boldyreff B, Siebel CW, Viola A, Valle G, Mainoldi F, Casola S, Cancila V, Gulino A, Tripodo C, Pizzi M, Dei Tos AP, Trentin L, Semenzato G and Piazza F (2023) CK2β-regulated signaling controls B cell differentiation and function. Front. Immunol. 13:959138. doi: 10.3389/fimmu.2022.959138
Received: 01 June 2022; Accepted: 08 December 2022;
Published: 11 January 2023.
Edited by:
Yoshiya Tanaka, University of Occupational and Environmental Health Japan, JapanReviewed by:
Katia Basso, Columbia University, United StatesJeehee Youn, Hanyang University, South Korea
Copyright © 2023 Quotti Tubi, Mandato, Canovas Nunes, Arjomand, Zaffino, Manni, Casellato, Macaccaro, Vitulo, Zumerle, Filhol, Boldyreff, Siebel, Viola, Valle, Mainoldi, Casola, Cancila, Gulino, Tripodo, Pizzi, Dei Tos, Trentin, Semenzato and Piazza. This is an open-access article distributed under the terms of the Creative Commons Attribution License (CC BY). The use, distribution or reproduction in other forums is permitted, provided the original author(s) and the copyright owner(s) are credited and that the original publication in this journal is cited, in accordance with accepted academic practice. No use, distribution or reproduction is permitted which does not comply with these terms.
*Correspondence: Francesco Piazza, ZnJhbmNlc2NvLnBpYXp6YUB1bmlwZC5pdA==
†These authors have contributed equally to this work