 Alessandra Giannella1†
 Silvia Riccetti2†
 Alessandro Sinigaglia2
 Chiara Piubelli3
 Elisa Razzaboni3Piero Di Battista4
 Matteo Agostini2Emanuela Dal Molin2
 Riccardo Manganelli2,5Federico Gobbi3‡
 Giulio Ceolotto1‡
 Luisa Barzon2,5*‡
- 1Department of Medicine, University of Padova, Padova, Italy
- 2Department of Molecular Medicine, University of Padova, Padova, Italy
- 3Department of Infectious-Tropical Diseases and Microbiology, Istituto di Ricovero e Cura a Carattere Scientifico (IRCCS), Sacro Cuore Don Calabria Hospital, Verona, Italy
- 4Maternal and Child Health Department, University of Padova, Padova, Italy
- 5Microbiology and Virology Unit, Padova University Hospital, Padova, Italy
Background: SARS-CoV-2 induces a spectrum of clinical conditions ranging from asymptomatic infection to life threatening severe disease. Host microRNAs have been involved in the cytokine storm driven by SARS-CoV-2 infection and proposed as candidate biomarkers for COVID-19.
Methods: To discover signatures of circulating miRNAs associated with COVID-19, disease severity and mortality, small RNA-sequencing was performed on serum samples collected from 89 COVID-19 patients (34 severe, 29 moderate, 26 mild) at hospital admission and from 45 healthy controls (HC). To search for possible sources of miRNAs, investigation of differentially expressed (DE) miRNAs in relevant human cell types in vitro.
Results: COVID-19 patients showed upregulation of miRNAs associated with lung disease, vascular damage and inflammation and downregulation of miRNAs that inhibit pro-inflammatory cytokines and chemokines, angiogenesis, and stress response. Compared with mild/moderate disease, patients with severe COVID-19 had a miRNA signature indicating a profound impairment of innate and adaptive immune responses, inflammation, lung fibrosis and heart failure. A subset of the DE miRNAs predicted mortality. In particular, a combination of high serum miR-22-3p and miR-21-5p, which target antiviral response genes, and low miR-224-5p and miR-155-5p, targeting pro-inflammatory factors, discriminated severe from mild/moderate COVID-19 (AUROC 0.88, 95% CI 0.80-0.95, p<0.0001), while high leukocyte count and low levels of miR-1-3p, miR-23b-3p, miR-141-3p, miR-155-5p and miR-4433b-5p predicted mortality with high sensitivity and specificity (AUROC 0.95, 95% CI 0.89-1.00, p<0.0001). In vitro experiments showed that some of the DE miRNAs were modulated directly by SARS-CoV-2 infection in permissive lung epithelial cells.
Conclusions: We discovered circulating miRNAs associated with COVID-19 severity and mortality. The identified DE miRNAs provided clues on COVID-19 pathogenesis, highlighting signatures of impaired interferon and antiviral responses, inflammation, organ damage and cardiovascular failure as associated with severe disease and death.
Introduction
Severe acute respiratory syndrome coronavirus 2 (SARS-CoV-2), the cause of coronavirus disease 2019 (COVID-19), induces a spectrum of clinical conditions ranging from asymptomatic infection to life threatening severe disease, characterized by respiratory failure, shock and multi-organ dysfunction requiring admission in the intensive care unit (ICU). Old age, male sex, presence of co-morbidities like hypertension, diabetes, immunosuppression, defective interferon (IFN) response and genetic predisposition, have been identified as risk factors for severe COVID-19 and associated with increased mortality (1–3).
Several studies searched for diagnostic biomarkers of severe COVID-19 and for prognostic biomarkers of ICU admission and risk of death. For example, abnormal levels of several clinical and laboratory parameters, such as renal dysfunction, elevated C reactive protein (CRP) and D-dimer levels, high serum levels of interleukin-6 (IL-6) and tumor necrosis factor-α (TNF-α) were identified as predictors of worsening outcome in COVID-19 (4, 5). Systems biological analysis identified increased plasma levels of inflammatory mediators and defects of type I IFN response as associated with severe COVID-19 (6), while single cell transcriptomics of immune cells in critically ill COVID-19 patients identified increased expression of genes involved in cell cycle regulation, cell-specific activation markers, and antibody processing within B-, T-, and NK-cell subsets in patients who survived (7).
Circulating microRNAs (miRNAs) have been proposed as candidate biomarkers for clinical conditions, such as malignancy, cardiovascular diseases, and infectious diseases (8–11), including COVID-19 (12). MiRNA are small non-coding RNA molecules of about 22 nucleotide in length, generated from the endogenous cellular mRNAs, long noncoding RNAs, and tRNAs (13). These small RNA molecules play a key role in the fine tuning of cell functions by suppression of protein synthesis from target mRNAs (14). Host miRNAs exert an important role in innate and adaptive immune cell development, especially during infections, (11) and have been involved in the cytokine storm driven by SARS-CoV-2 infection and proposed a candidate diagnostic and prognostic biomarkers in COVID-19 patients (15–24).
In this study, we analyzed by small RNA-sequencing a large cohort of COVID-19 patients at the time of hospital admission and healthy controls (HC) to identify signatures of circulating serum miRNAs associated with SARS-CoV-2 infection, disease severity and mortality. To search for possible sources of the differentially expressed (DE) serum miRNAs, we analyzed their expression in relevant human cell types in vitro upon SARS-CoV-2 infection and IFN type I treatment.
Materials and methods
Ethics statement
All subjects or their legal representatives provided written informed consent. Serum samples were collected at admission and stored in Tropica Biobank (BBMRI-eric ID: IT_1605519998080235) upon use. The study, which was conducted in accordance with the ethical principles of the Declaration of Helsinki, was approved by the local Ethics Committee (Comitato Etico per la Sperimentazione Clinica delle Province di Verona e Rovigo) on November 24, 2020 (study protocol n 63471).
Study subjects
The study population included 89 COVID-19 patients, who were admitted at the IRCCS Sacro Cuore Don Calabria hospital, Negrar, Verona, Italy, in the period between May 2020 and December 2020. Inclusion criteria for the study were age ≥18 years and diagnosis of SARS-CoV-2 infection confirmed by molecular testing on nasopharyngeal swabs. As exclusion criteria, pregnant women were not enrolled. Disease severity was scored into mild, moderate, and severe at the time of hospital admission according to World Health Organization COVID-19 disease severity classification criteria (25). In particular, individuals who tested positive for SARS-CoV-2 using a virologic test (i.e., a nucleic acid amplification test or an antigen test) but had no symptoms consistent with COVID-19 were classified as asymptomatic or with presymptomatic infection; individuals who had any of the various signs and symptoms of COVID-19 (e.g., fever, cough, sore throat, malaise, headache, muscle pain, nausea, vomiting, diarrhea, loss of taste and smell) but who did not have shortness of breath, dyspnea, or abnormal chest imaging were classified as mild COVID-19; individuals who showed evidence of lower respiratory disease during clinical assessment or imaging and who had an oxygen saturation (SpO2) ≥94% on room air at sea level were classified as moderate COVID-19; individuals who had SpO2 <94% on room air at sea level, a ratio of arterial partial pressure of oxygen to fraction of inspired oxygen (PaO2/FiO2) <300 mm Hg, a respiratory rate >30 breaths/min, or lung infiltrates >50% were classified ad severe COVID-19; individuals who had respiratory failure, septic shock, and/or multiple organ dysfunction were classified as cases of critical COVID-19. No cases of asymptomatic infection or critical COVID-19 at the time of hospital admission were enrolled in the study. Peripheral blood samples were collected at the time of hospital admission, and before starting medications. Sera were separated from whole blood by centrifugation for 15 min at 3,000 rpm at 4°C and stored at -80°C until processing. Serum samples from 45 healthy volunteers collected before September 2019 and stored at -80°C were used as negative control group (25 females, 20 males; median age 45, range 24-76).
Small RNA library preparation and quantification for next generation sequencing
Small RNA libraries from serum samples were obtained using QIAseq® miRNA Library kit (Qiagen, Hilden, Germany), according to the manufacturer protocol. NGS Library Quality Control (QC) analysis and quantification were performed before sequencing: a) High sensitivity DNA electrophoresis by LabChip GX Touch Nucleic Acid Analyzer (PerkinElmer, Massachusetts, USA) using HT DNA 5K/RNA LABCHIP kit (D-MARK Biosciences, Toronto, Canada) according to the manufacturer’s instructions. We obtained typical electropherograms from small RNA libraries that show a peak between 170-180 bp corresponding to miRNA-sized library; b) quantitative polymerase chain reaction (qPCR) according to the manufacturer’s protocol, using three different primers provided by QIAseq® miRNA Library kit (Qiagen): the first, called NGS 3C Primer, for assessing the performance of 3’ adapter ligation; the second, NGS 5C Primer, for assessing the performance of 5’ adapter ligation and the third, NGS RTC Primer, for the performance of reverse transcription reaction. We obtained a value of threshold cycle (CT) less than 28 indicating all these steps were performed correctly. NGS library concentration was determined by Qubit dsDNA HS assay (Thermo Fisher Scientific) by Qubit® 4.0 Fluorimeter, according to the manufacturer’s protocol.
Small RNA library sequencing
Equimolar amounts (1 nM) of pooled libraries normalized to 10 nM were generated to sequence in multiplexing. PhiX DNA 1.5 pM was added to pooled libraries prior to sequencing at a final concentration of 10% in order to increase the sequence diversity of the libraries. Pooled small RNA libraries (1.7 pM) were sequenced using NextSeq™ 550 System (Illumina, San Diego, California, USA) following manufacturer’s instructions. NextSeq 500/550 High Output Kit v2.5 (75 Cycles) was used for sequencing in single reads of 75 pb fragments for small RNA library. This flow cell allows generating around 400 million reads per run, therefore 45 libraries per run were loaded to guarantee around 9 million reads per sample. Calculation of qualitative scores of the NGS runs (cluster density, Passing Filter clusters, % PF, and Q-score) was done with the Real-Time Analysis software (Illumina) and checked by using the Illumina Sequencing Analysis Viewer (Illumina). In our experiments, we obtained 10,313.55 ± 142.6 Kreads/sample, with an optimal cluster density (242.67± 5.03 K/mm2), high % PF (80.38 ± 1.12) and Q30 (Q-Score) with an average value of 91.93% ± 0.58. Finally, the data were collected as FastQ files.
Bioinformatics analysis of mature miRNAs
Reads in fastq files were processed using CLC Genomics Workbench 21.0.3 (Qiagen), a bioinformatics software that provides specific pipelines for small RNAs analysis. Adapter sequences were trimmed and sequences <15 nucleotides or without adapter nor unique molecular index were discarded. A sequential alignment strategy was used to map sequences on the reference GRCh38 human genome, using miRBase v.22.1 as annotation model (26). All the sequences recognized in miRBase were retrieved as mature miRNAs. Before normalization and DE analysis, data were filtered to include small RNAs with a minimum number of reads count (mean read count) >2. DE analysis was performed using Generalized Linear Model (GLM) and Trimmed mean of M-values (TMM) normalized counts (CPM) as input data, considering significant Benjamini-Hochberg adjusted p-values ≤ 0.05.
Bioinformatics analysis of isomiRNAs
At first, reads in fastq files were processed by Cutadapt v2.5 (27) to trim the adapter and filter good quality reads (mean base Qphred > 30 and length range between 10 and 35 nucleotides). After quality control with FastQC (28), reads were mapped using IsoMiRmap v5 (29) both on the GRCh38 human genome assembly and the known hairpins sequences in miRBase v22. According to the IsoMiRmap method, isomiRs were identified, assigning universally unique identifiers, and quantified. Finally, the expression matrix with raw counts of exclusive-isomiRs was normalized for sequencing depth and RNA composition and DE isomiRs were assessed with DESeq2 v1.30.1 (30), considering significant Benjamini-Hochberg adjusted p-values ≤ 0.05.
Identification of miRNA putative gene targets and network analysis
Gene targets for candidate miRNAs were identified using bioinformatics tools with online target prediction algorithm, MIENTURNET and miRWalk 3.0 (31, 32). Significant target genes for these miRNAs were selected using gene set enrichment analysis (GSEA) and implemented with Search Tool for the Retrieval Interacting Genes (STRING) v11.5, through gene ontology (GO) functional analysis and annotation databases, i.e., KEGG pathways (33), WikiPathways (34), and Disease Ontology (35), FDR<0.05. Visualization summary networks were created by Cytoscape v3.9.0 (36).
Cells and culture conditions
Vero E6 cells (CRL-1586, American Type Culture Collection, ATCC, Manassas, VA) and Calu-3 cells (HTB-55, ATCC) were maintained in Dulbecco’s modified Eagle’s medium (DMEM, Thermo Fisher Scientific) supplemented with 20% v/v of filtered fetal bovine serum (FBS, Thermo Fisher Scientific), 1% v/v penicillin/streptomycin (Pen/Strep, Thermo Fisher Scientific) and 1% v/v of GlutaMAX supplement (Thermo Fisher Scientific). Human epithelial colorectal adenocarcinoma cell line Caco-2 (HTB-37, ATCC) was cultured in Minimum Essential Medium (Thermo Fisher Scientific) supplemented with 20% FBS, 1% Pen/Strep, and 1% GlutaMAX supplement. Primary human umbilical vein endothelial cells (HUVEC), pooled from multiple donors, were supplied by Invitrogen (Thermo Fisher Scientific) cryopreserved at the end of the primary culture stage. These cells were cultured in adhesion in Medium 200 (M200, Thermo Fisher Scientific), supplemented with 1% v/v Large Vessel Endothelial Supplement (LVES 50x, Thermo Fisher Scientific) and 1% v/v Pen/Strep. Peripheral blood mononuclear cells were purified by Ficoll-Paque PREMIUM (Merck) gradient from healthy blood donors and grown in RPMI 1640 Medium (Thermo Fisher Scientific) supplemented with 10% FBS, 1% Pen/Strep, 1% GlutaMAX and 1% Hepes. For the experiments, cells were seeded in 6-well or 12-well plates and maintained at 37°C in a humidified 5% CO2 incubator.
SARS-CoV-2 infection and IFN-α treatment experiments.
The SARS-COV-2 isolate (lineage B1) used in infection experiments was obtained from a nasopharyngeal swab collected for diagnostic purpose. The virus was propagated in Vero E6 cells, titrated by end-point dilution assay. A lysate from uninfected Vero-E6 cells was used as a mock infection control. Infection was done at the indicated MOI for 1.5 h at 37°C to allow the adsorption of the virus. Then, the viral inoculum was removed, the cells were washed two times with PBS, and fresh medium with FBS added. Viral load was measured in cell supernatant by 50% tissue culture infective dose (TCID50) assay, as previously described (37). Viral RNA load was quantified in cells and cell supernatant by qRT-PCR. Immunofluorescence staining of SARS-CoV-2 Nucleocapsid protein was done with a rabbit monoclonal primary antibody (40143-R019; Sino Biological Inc., Beijing, China) at the dilution of 1:1000 and anti-rabbit IgG Alexa Fluor-546 secondary antibody (goat, 1:2000, Thermo Fisher Scientific). Images were achieved by Nikon Eclipse Ti confocal microscope and acquired using Nis-Element software (Nikon, Tokyo, Japan). For type I IFN stimulation experiments, cells were treated for 24 h with human recombinant IFN-α2 (Merck & Co., White House Station, NJ, USA) using a final concentration of 1,000 U/mL.
Real-time RT-PCR analyses
Total RNA was isolated from the cells using miRNeasy Tissue/Cells advanced Mini Kit (Qiagen) and reverse transcribed to cDNA by using Murine Leukemia Virus (MuLV) reverse transcriptase (Thermo Fisher Scientific). Expression of IFIT1, IFIT2, IL6, IL1B, TLR7, TLR8, RIG-I, and MDA5 mRNA was determined by real-time RT-PCR, as previously described (37). For miRNA analysis, cDNA for miRNAs was generated using TaqMan Advanced miRNA cDNA Synthesis kit (Thermo Fisher Scientific) according to manufacturer’s instructions. Then, miRNA levels were determined by real-time RT-PCR using TaqMan Fast Advanced Master mix and TaqMan Advanced miRNA Assays (Thermo Fisher Scientific) as indicated by the manufacturer. RNU6B was used as internal control for normalization of miRNA expression. Expression changes relative to mock were determined by the 2-ΔΔCT method.
Statistical analysis
Power analysis for NGS data was computed as previously reported (38, 39). Sample size was estimated to be at least 20 subjects per group to reach the desired power of 90%, with a standard deviation (SD) estimated at 0.5, an average power with FDR of 0.05 and fold change of 2. Since our experimental design for NGS analysis provides 89 COVID-19 patients, divided into groups of more than 25 individuals, and 45 healthy controls, the sample size was considered large enough to reach the required power.
Comparisons among groups were done by Pearson’s χ2 test, one-way ANOVA, Student’s t test, non-parametric Wilcoxon-Mann-Whitney test, Kruskal–Wallis test, receiver operating characteristic (ROC) curve analysis, multiple logistic regression analysis, and Kaplan-Meyer survival curve analysis, as appropriate. Comparisons among multiple groups were corrected with Turkey or Bonferroni-Dunn methods. For analysis across multiple miRNAs, raw p-values were corrected for multiple testing by the Benjamini-Hochberg FDR method. Relationships between variables were assessed by Pearson correlation and Spearman’s correlation, as appropriate. Results were considered statistically significant with a P value ≤ 0.05.
Data visualization
All the graphs and statistical analysis were done using Prism GraphPad 9.2 (Graph-Pad Software, Inc. La Jolla, CA, USA). Data in graphs and tables are reported as median and IQR, number (n) and percentage (%), mean ± standard deviation (SD), geometric mean ± SD of geometric mean. Networks of miRNA gene targets were visualized by Cytoscape v3.9.0 (36).
Results
Patient demographics, clinical and laboratory findings, and disease course
Overall, 89 patients with laboratory-confirmed diagnosis of acute SARS-CoV-2 infection were enrolled in the study, including 26 with mild COVID-19, 29 with moderate disease, and 34 with severe disease. Demographic and clinical features of COVID-19 patients are summarized in Table 1. The severity of COVID-19 was significantly associated with male sex, longer hospitalization, intensive care unit (ICU) admission, and death or long-term sequelae (Table 1 and Supplementary Figure 1). The results of routine laboratory tests, which were performed at the time of hospital admission, when serum samples were also collected, are shown in Table 1 and Supplementary Figure 2. The absolute number of leukocytes, the levels of CRP and the levels of creatine phosphokinase (CPK) were significantly higher in patients with severe COVID-19 than in moderate and mild COVID-19 groups.
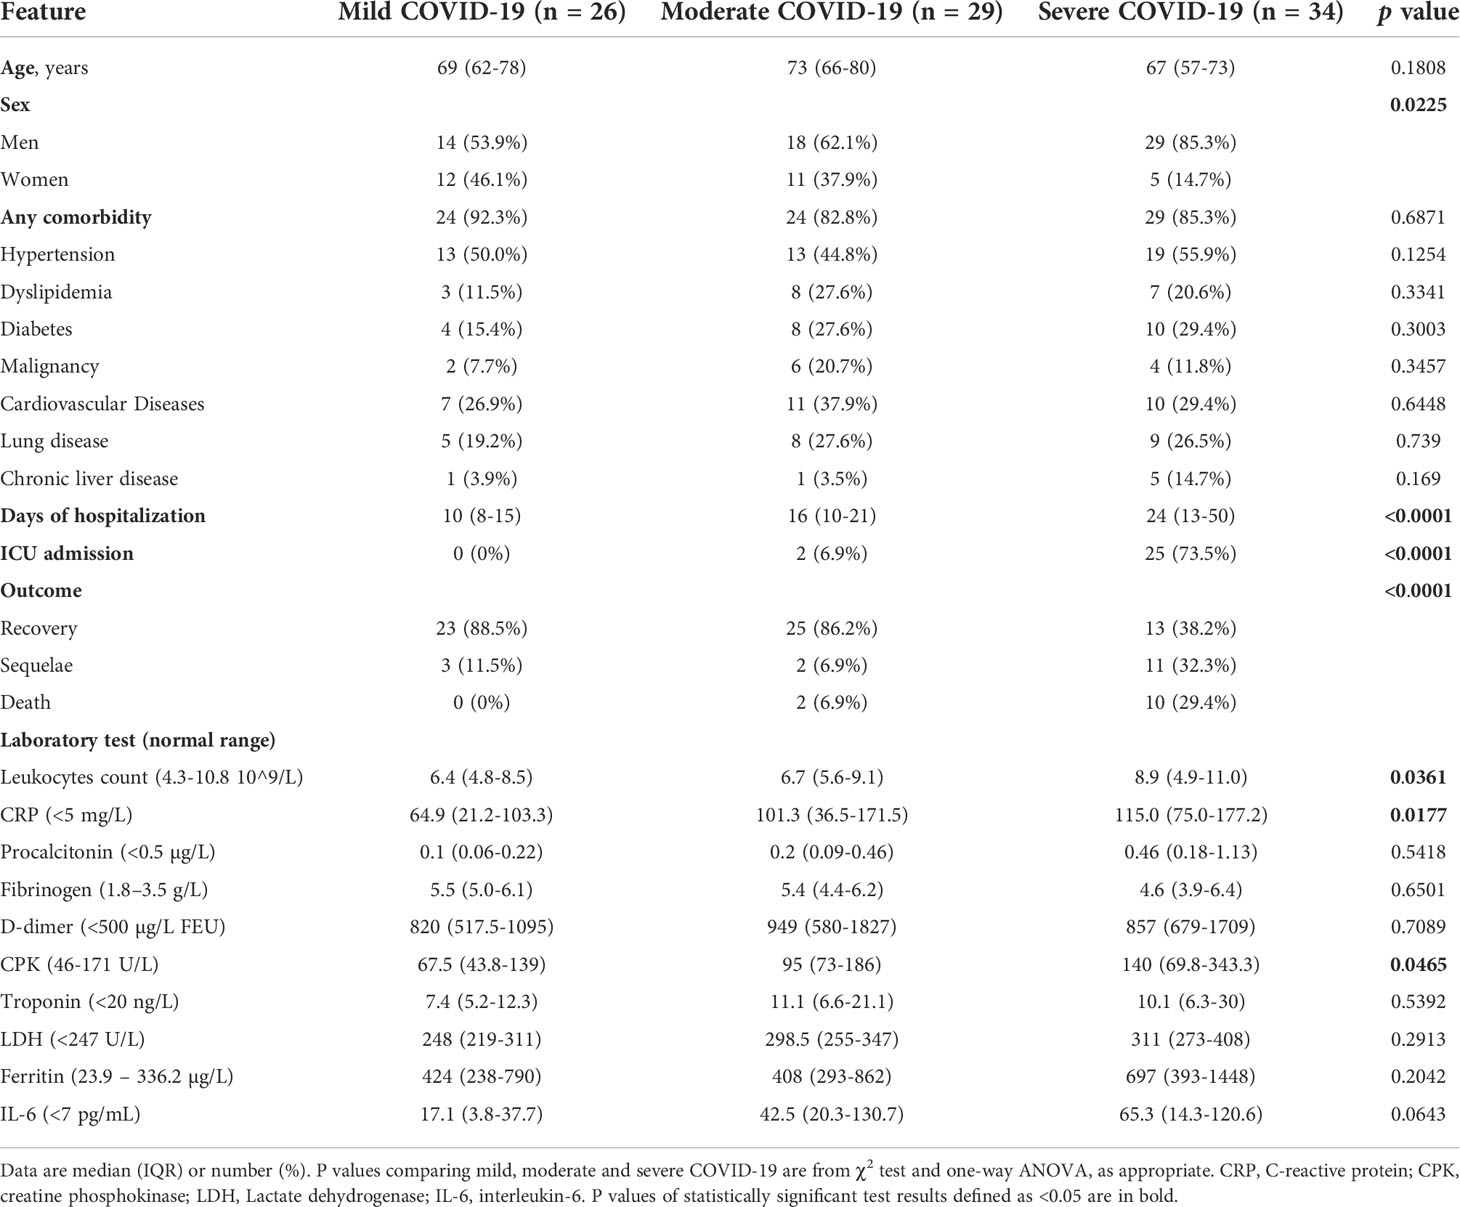
Table 1 Demographics data, clinical characteristics and laboratory findings in patients with SARS-CoV-2 infection at the time of hospital admission (n = 89).
Association of serum miRNAs with COVID-19 and disease severity
Analysis of small RNA sequencing data obtained from serum of COVID-19 patients and HC identified 161 miRNAs that were consistently expressed across groups. Principal component analysis (PCA) showed that their expression profile well discriminated between COVID-19 patients and HC (Figure 1A). DE analysis identified 23 upregulated miRNAs and 27 downregulated miRNAs in COVID-19 patients vs. HC (Figures 1B, C and Supplementary Table 1). ROC curve analysis of the DE miRNAs identified several miRNAs that could discriminate between COVID-19 patients, regardless of disease severity, and HC with high sensitivity and specificity. Among these miRNAs, high levels of miR-320 family members and miR-483-5p and low levels of miR-30d-5p, miR-25-3p, miR-93-5p, miR-16-5p showed >90% sensitivity and >90% specificity in discriminating between COVID-19 patients and HC (Table 2).
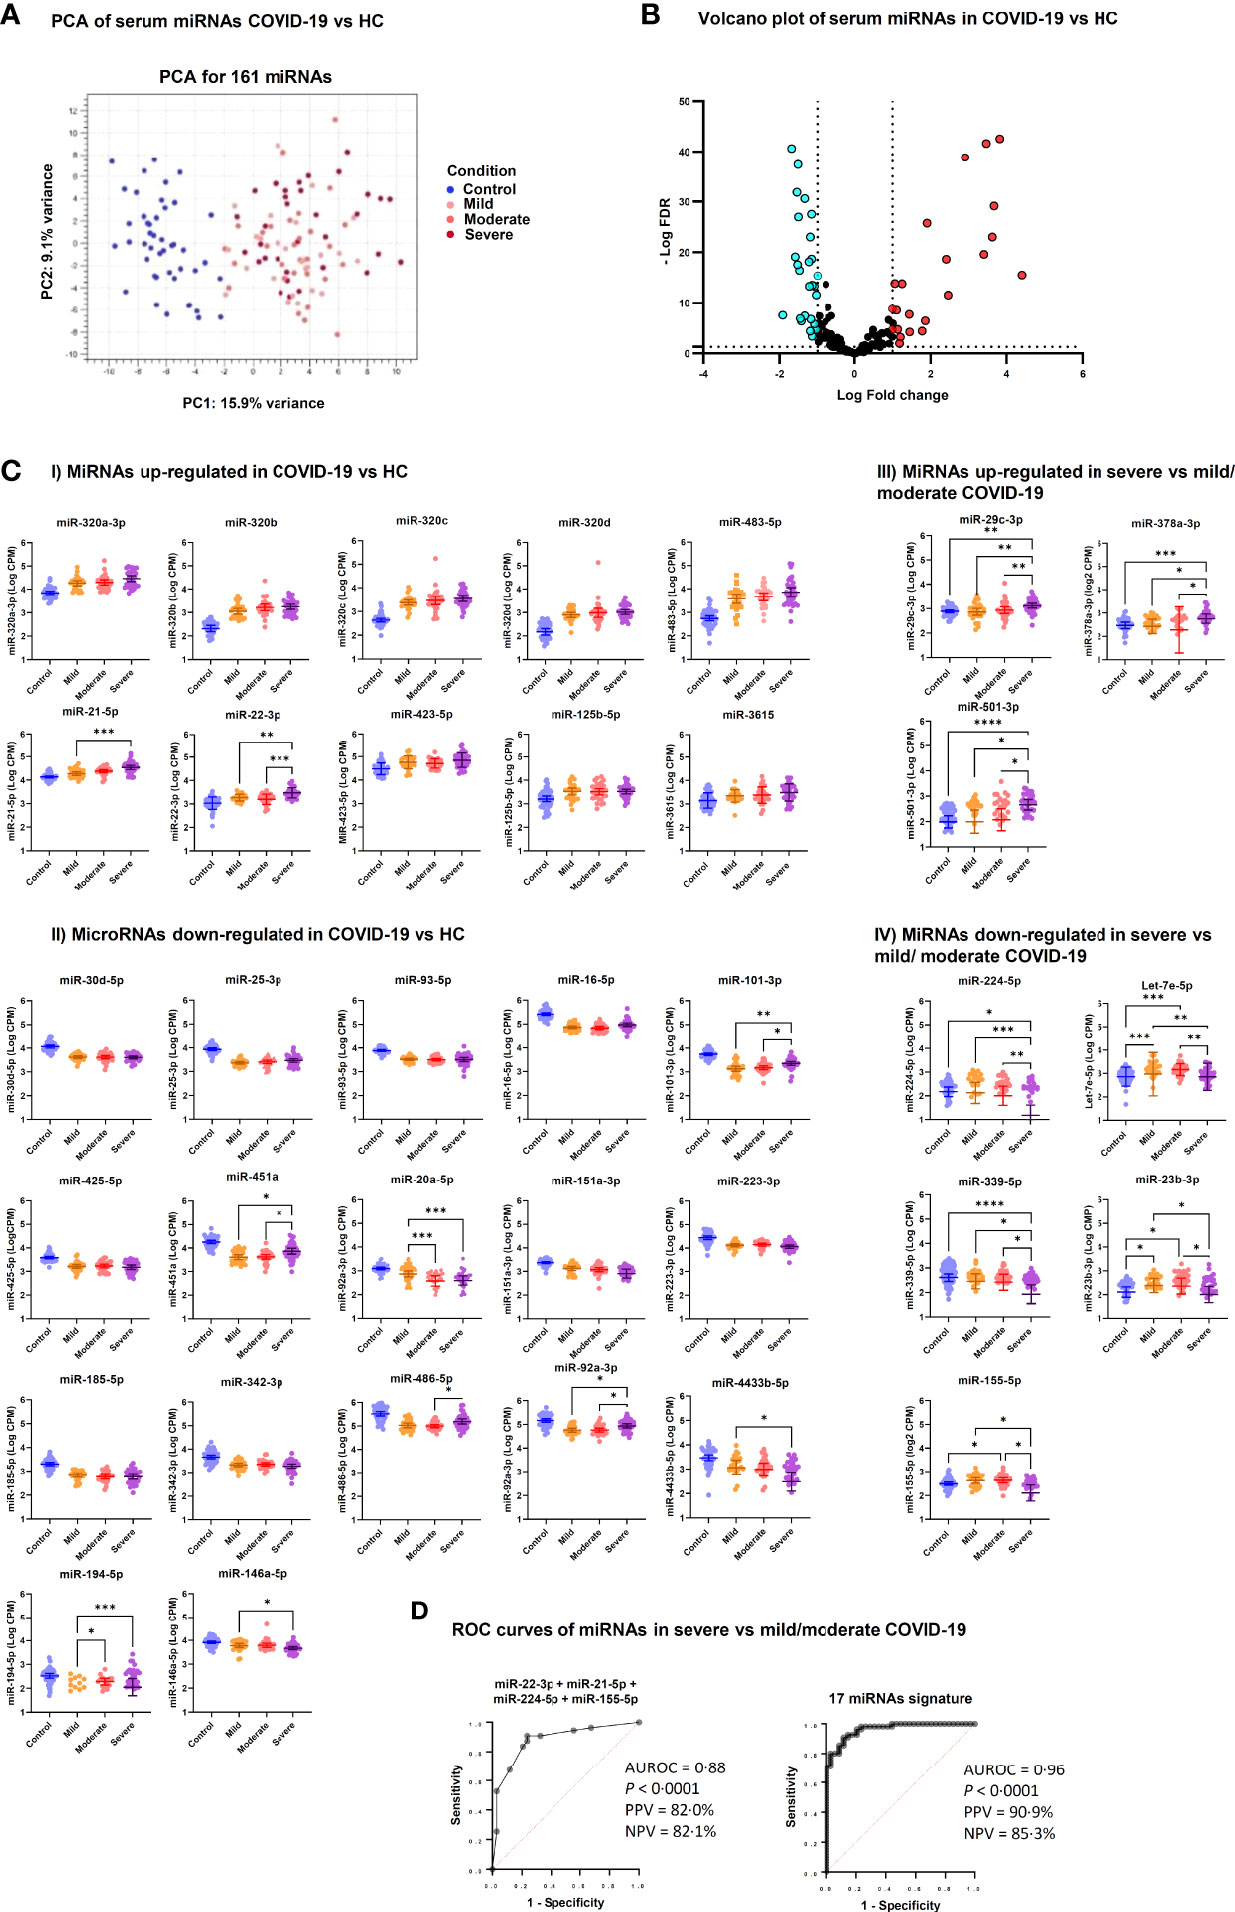
Figure 1 Differentially expressed serum miRNAs in COVID-19 patients. (A) Unsupervised principal component analysis of miRNA expression profiles in COVID-19 and HC samples (phenotype); condition is red for HC and blue, green, violet for COVID-19 severity. (B) Volcano plot of 161 miRNAs analyzed for differential expression (DE); vertical lines delineate > ± 2-fold change; horizontal line delineate adjusted p < 0.05. Adjusted p-values using Generalized Linear Model and trimmed mean of M-values normalized counts were used as input data and adjusted for multiple testing using the Benjamini–Hochberg false discovery rate (FDR) method; light blue dots indicate downregulated miRNA and red dots upregulated miRNAs. (C) Scatter dot plots of candidate DE serum miRNAs in COVID-19 patients. MicroRNA expression is reported as Log10 counts per million reads (Log CPM). Panels I and II show miRNAs that were up- and downregulated in severe, moderate and mild COVID-19 vs. HC, while Panels III and IV show DE miRNAs in severe COVID-19 vs. moderate and mild disease. Geometric mean values with 95% confidence interval (95% CI) are indicated by lines and error bars. Pairwise comparison between groups was done by Kruskal Wallis test for multiple comparisons, considering Benjamini-Hochberg adjusted p-values ≤ 0.05. Groups include healthy controls (Control, n = 45), mild COVID-19 (Mild, n = 26), moderate COVID-19 (Moderate, n = 29), and severe COVID-19 (Severe, n = 34). ****p<0.0001, ***p<0.001, **p<0.01, *p<0.05. Since Panels I and II include miRNAs that were DE in all COVID-19 groups (mild, moderate and severe) vs. HC, statistical significance is indicated only for comparisons among COVID-19 groups. (D) Candidate miRNA biomarkers to classify severe COVID-19 vs. mild/moderate COVID-19. P values and receiver operating characteristic (ROC) curves were calculated by multiple logistic regression analysis. AUROC, area under the ROC curve; PPV, positive predictive power; NPV, negative predictive power.
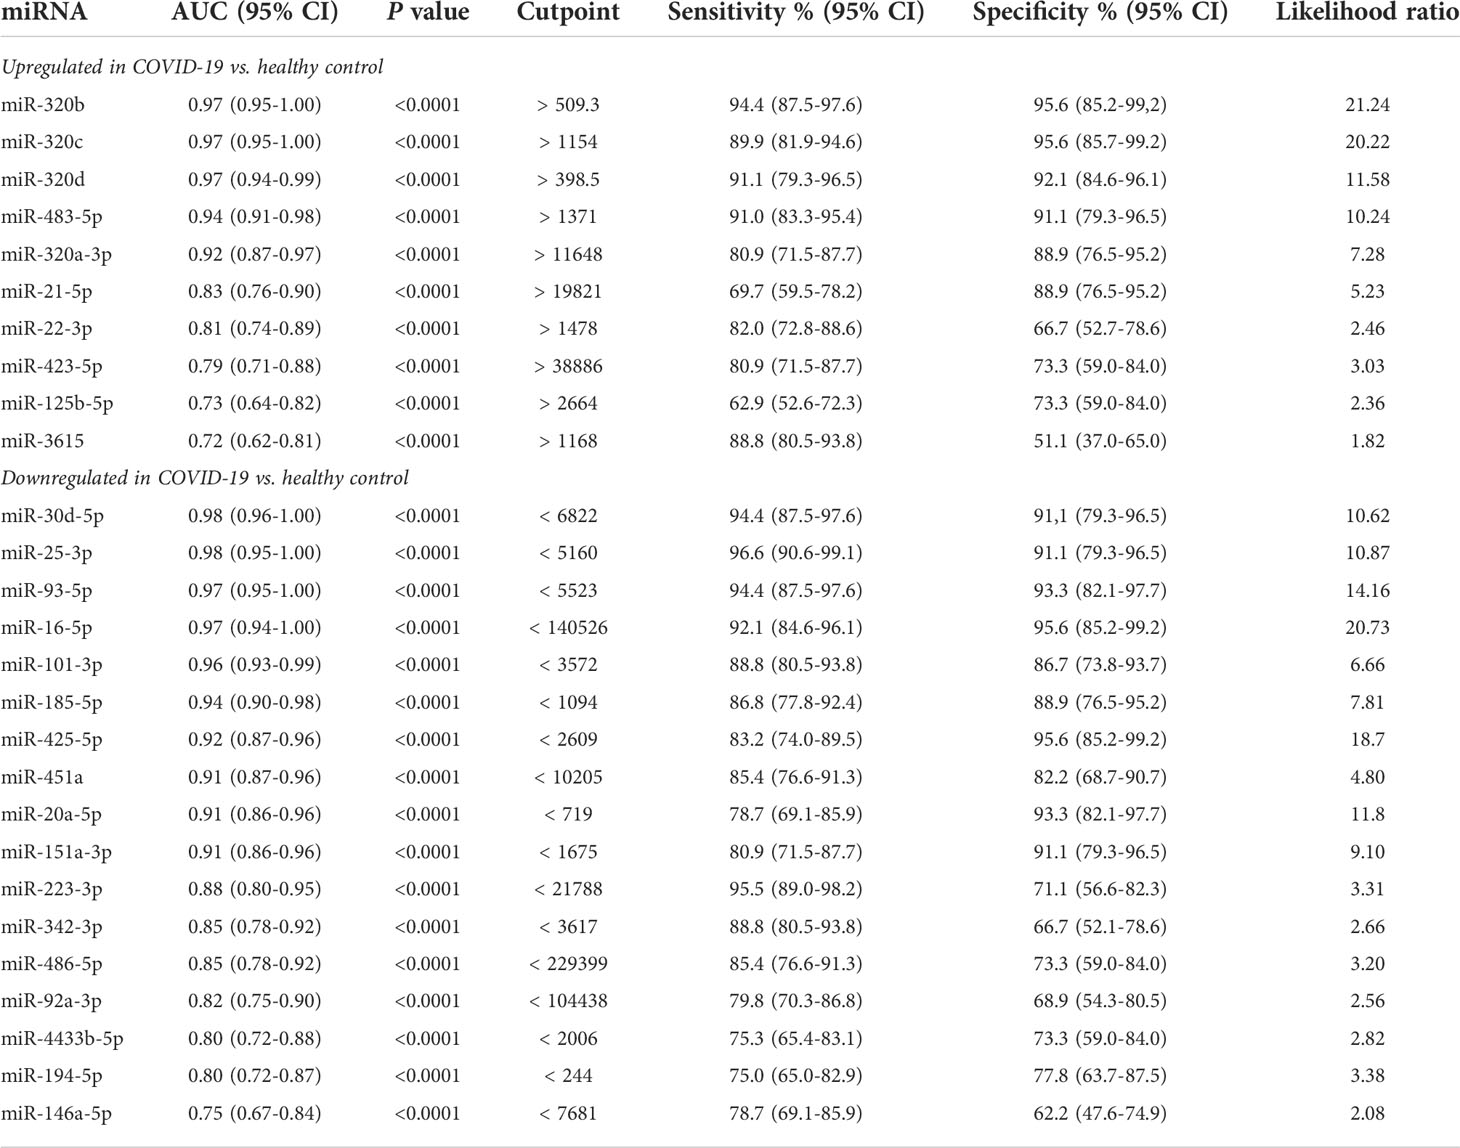
Table 2 ROC curve analysis of differentially expressed serum microRNAs in COVID-19 patients vs. healthy controls.
Furthermore, comparative analysis of serum miRNA levels among COVID-19 patients in accordance with disease severity (mild, moderate, and severe disease) identified as upregulated in patients with severe COVID-19 miR-21-5p, miR-22-3p, miR-29c-3p, miR-92a-3p, miR-101-3p, miR-194-5p, miR-378a-3p, miR-451a, miR-486-5p, miR-501-3p, and as downregulated let-7e-5p, miR-20a-5p, miR-23b-3p, miR-146a-5p, miR-155-5p, miR-224-5p, miR-339-5p and miR-4433b-5p (Figure 1C). Among these DE miRNAs, ROC curve analysis identified a group of miRNAs that could discriminate between severe COVID-19 and moderate/mild COVID-19 (Table 3). In particular, high levels of miR-22-3p and miR-21-5p showed about 90% sensitivity and >50% specificity, while low levels of miR-224-5p and miR-155-5p showed low sensitivity but >85% specificity in discriminating between severe COVID-19 and moderate/mild COVID-19. Multiple logistic regression analysis showed that a signature combining these four miRNAs improved the classification performance (area under the ROC curve, AUROC = 0.88, 95% CI 0.80-0.95, p<0.0001; negative predictive power 82.1% and positive predictive power 82.0%). Classification performance was further improved by a signature comprising the 17 DE miRNAs reported in Table 3 (AUROC = 0.96, 95% CI 0.93-0.99, p<0.0001; negative predictive power 85.3% and positive predictive power 90.9%) (Figure 1D).
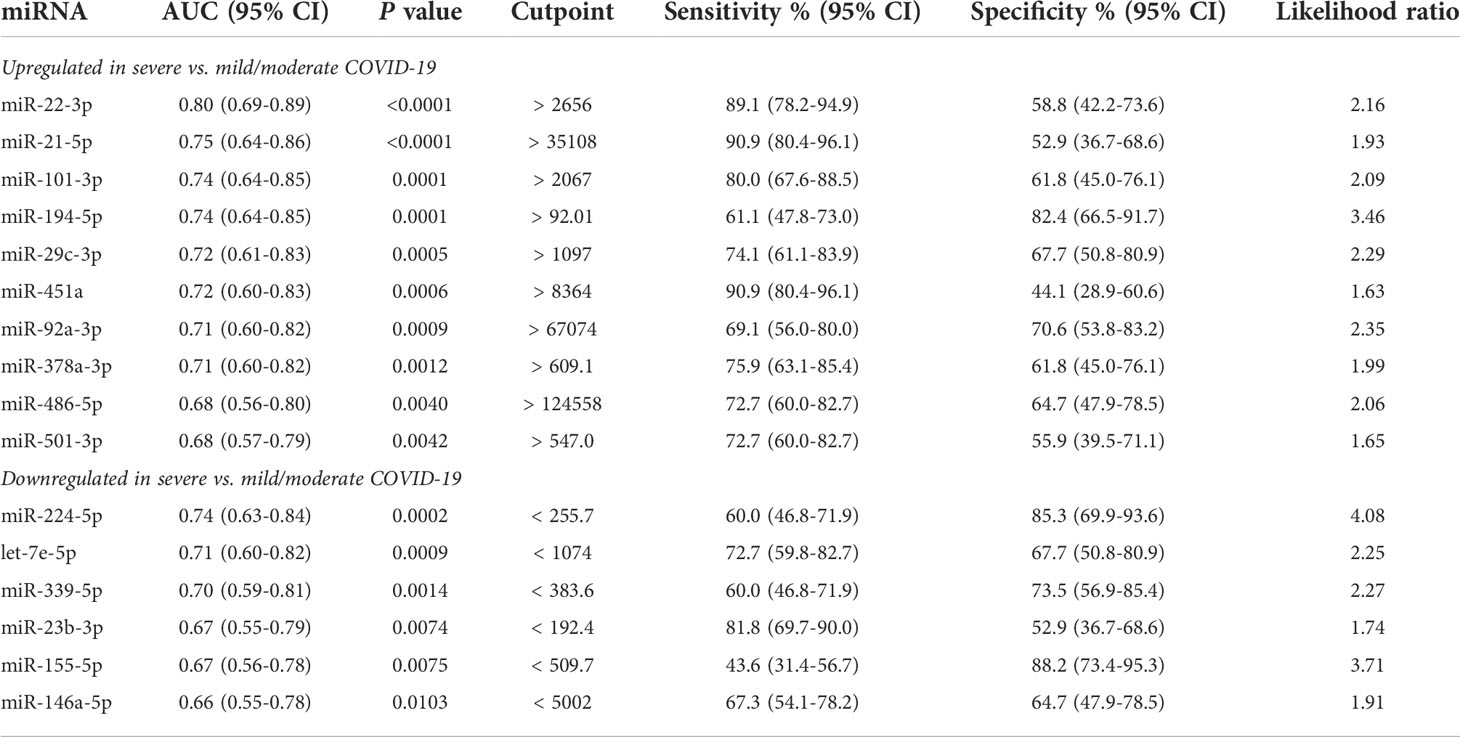
Table 3 ROC curve analysis of DE serum miRNAs in severe COVID-19 vs. mild and moderate COVID-19.
Circulating isomiR signatures in COVID-19 patients according to disease severity
-.2IsomiRs are miRNA isoforms produced during miRNA maturation that differ from their canonical counterpart in length at their 3’ or 5’ end and/or in their internal sequence. IsomiRs have variable expression in different organs and tissue types and may differ in their targeted mRNA spectrum (42). Since small RNA sequencing can identify isomiRs, we searched for DE isomiRs in our dataset. DE analysis and PCA showed that also serum isomiR levels clearly discriminated COVID-19 patients from HC, while differences among severe, moderate and mild COVID-19 conditions were less clear (Figures 2A, B). DE analysis between all COVID-19 patients and HC identified 122 DE serum isomiRs (58 upregulated and 64 downregulated). Among these DE isomiRs, 32 were highly expressed (above average values) and showed absolute log2 fold change >1 (Figure 2C and Supplementary Table 2). Among DE isomiRs, the top upregulated serum isomiRs in COVID-19 patients included isoforms of miR-320 family members and miR-483-5p, while the maximum downregulated serum isomiRs in COVID-19 patients included isoforms of miR-486-5p and miR-16-5p (Supplementary Table 2). Comparison between severe and mild COVID-19 identified 57 DE serum isomiRs, including 29 highly expressed isomiRs (above average values) with absolute log2 fold change >0.5, among which isoforms of miR-21-5p, miR-451a, and miR-22-3p as the most upregulated and isoforms of let-7 family members and miR-146a-5p among the most downregulated (Figure 2D and Supplementary Table 3).
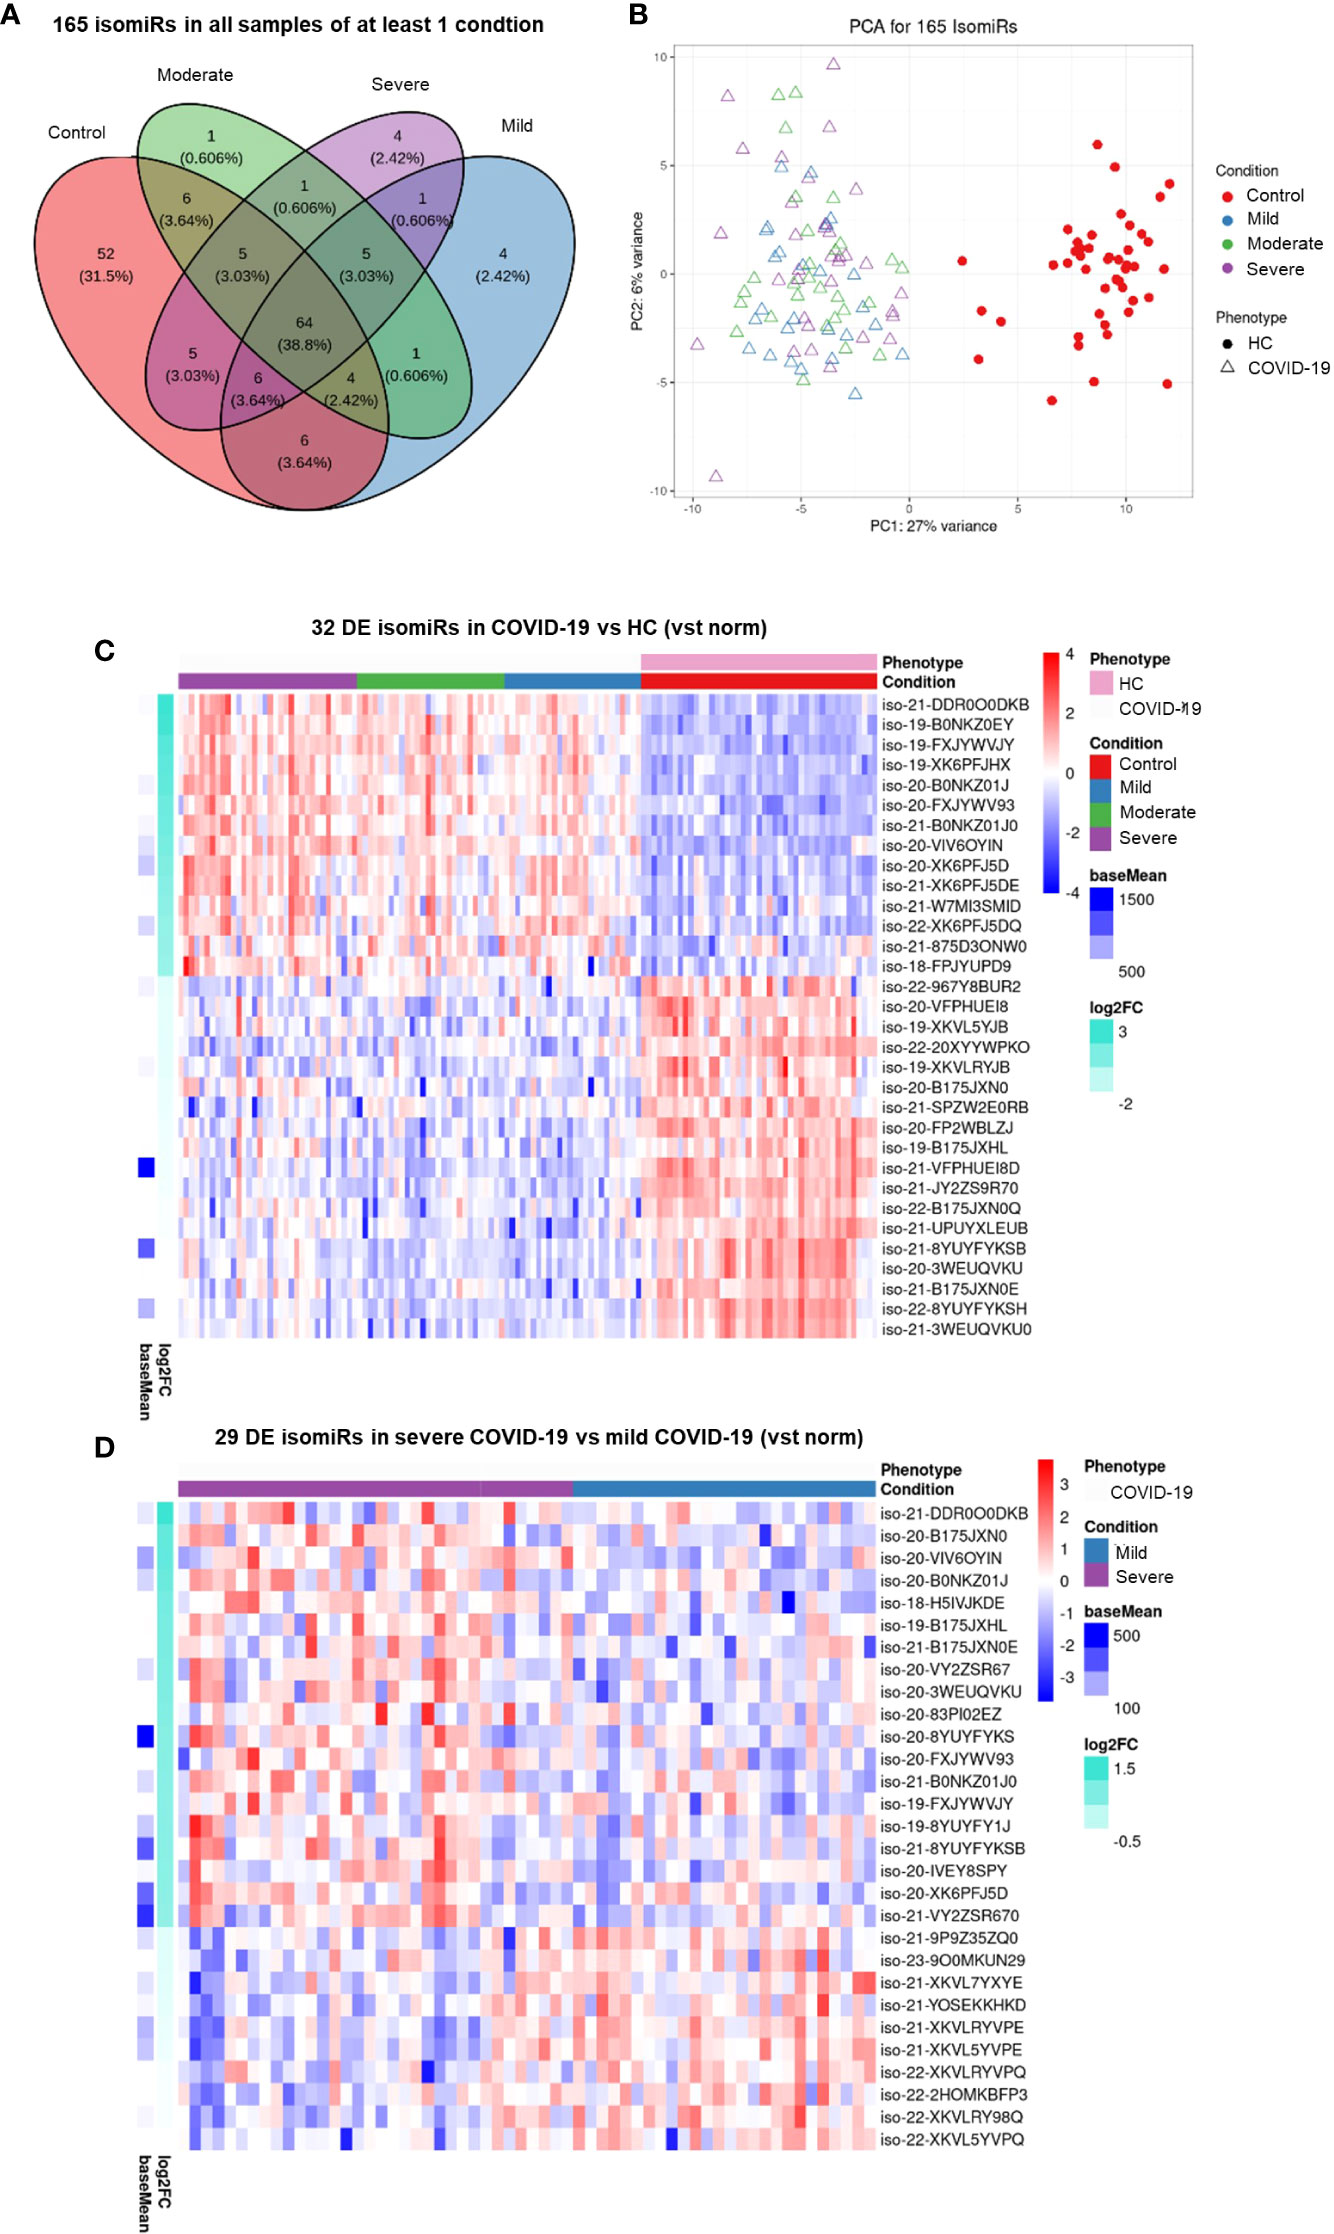
Figure 2 Serum isomiR analysis in COVID-19 patients. (A) Venn diagram showing the 165 isomiRs detected by small RNA-seq in serum samples of all individuals belonging to at least one condition. Conditions included healthy control (HC, n = 45), mild COVID-19 (n = 26), moderate COVID-19 (n = 29), and severe COVID-19 (n = 34). (B) Unsupervised principal component analysis of the isomiR expression profiles in COVID-19 and HC samples (phenotype); condition is red for HC and blue, green, violet for COVID-19 severity. Heatmaps (C) of the 32 differentially expressed (DE) serum isomiRs between COVID-19 and HC (p-value ≤ 0.01, absolute log2 Fold Change (Log2FC) ≥ 1) and (D) of the 29 DE serum isomiRs between severe and mild COVID-19 (p-value ≤ 0.05, absolute Log2FC ≥ 0.5); standardized expression; the baseMean column on the left indicate the mean expression for each isomiR in all samples.
Signaling networks of COVID-19-associated serum miRNAs
Network analysis of the genes targeted by DE miRNAs in COVID-19 vs. HC is represented in Figures 3A, B and in Supplementary Tables 4, 5. These networks included genes involved in cell response to oxidative stress, autophagy, mitophagy, apoptosis, cell senescence, and angiogenesis. In particular, the upregulated miR-320 family targets several genes involved in antiviral defense, such as genes encoding cytokines, chemokines and cytokine receptors (IFNL1, CCL5, IL2RB), C-reactive protein (CRP), ferritin light chain (FTL), cytochrome c (CYCS), matrix metalloproteinase 2 (MMP2), and proteins involved in intracellular trafficking (ARF1, DTCN5, SEC24A, SLC26A2). Additional targets of this miRNA family include the angiotensin II receptor AGTR1, genes involved stress response and angiogenesis (FKBP5, PDGFB, VHL), and in cell proliferation (CRK, E2F2, ERBB2, IGF2, MAX, RPS6KA11). Targets of the upregulated miR-483-5p involved in antiviral response and angiogenesis are shared with miR-320 family gene targets. MiR-21-5p and miR-22-3p, both upregulated in COVID-19 patients, target several genes involved in cell signaling, cell proliferation and angiogenesis (e.g., HIF1A, MYC, SP1, SMAD7, VHL). MiRNAs that were downregulated in serum of COVID-19 patients mainly target genes promoting angiogenesis (e.g., VEGFA, ANGPT2, COL4A1, FGF2, ZEB1), apoptosis, autophagy, stress response (e.g., ATG12, ATG14, ATG2B, SOD2, TXNIP), and inflammation (e.g., CXCL9, CXCL10, IL1R1, TNF). The SARS-CoV-2 receptor gene ACE2 was targeted by miR-93-5p and miR-185-5p, both downregulated in COVID-19 patients.
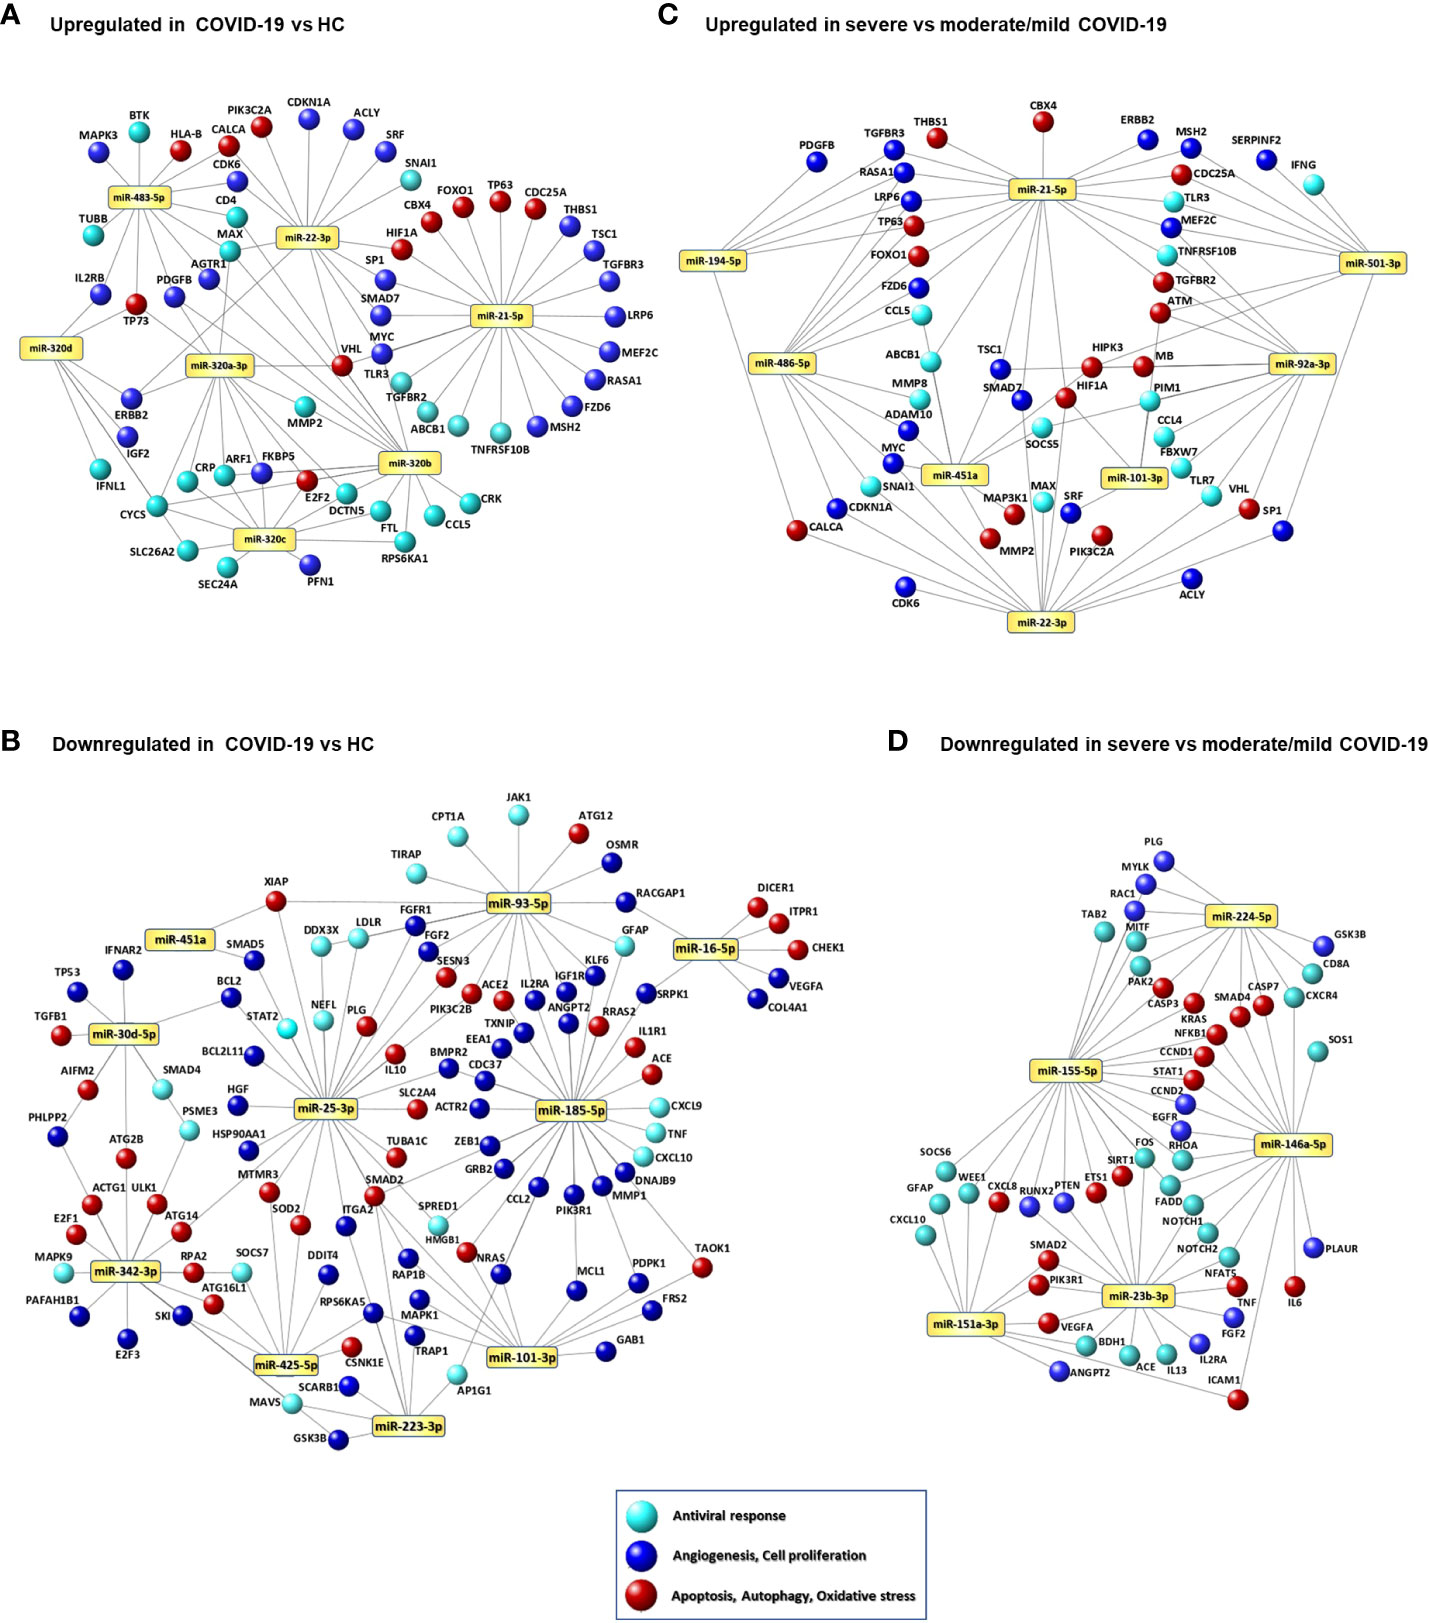
Figure 3 Signaling networks of COVID-19-associated serum miRNAs. Networks of putative target genes for circulating miRNAs that were significantly upregulated (A) and downregulated (B) in COVID-19 patients vs. healthy controls (HCs) and significantly upregulated (C) and downregulated (D) in patients with severe COVID-19 vs. patients with mild/moderate COVID-19. Methods for target gene identification and selection and network visualization are described in the Methods section.
Network analysis of the DE miRNAs in severe COVID-19 compared with mild and moderate COVID-19 are shown in Figures 3C, D and Supplementary Tables 6, 7. Upregulated miRNAs in severe COVID-19 target key antiviral response genes (CCL4, CCL5, IFNG, STAT1, TLR3, TLR7), genes involved in myocardial disease (MMP2, MMP9), lung disease (PTEN, HMGB1, SIRT1, HIF1A, BSG, AKT1, ERBB2), cell response to stress, autophagy, cell senescence, and angiogenesis (e.g., IGF1R, FOXO1, PTEN, PIK3R1, CDKN1A, SIRT1, AKT1) (Figure 3C), while downregulated miRNAs target genes encoding pro-inflammatory factors (IL6, TNF, CXCL8, CXCL10) and involved in respiratory failure, acute respiratory distress syndrome, pulmonary fibrosis, myocardial infarction, and peripheral vascular disease (CXCR4, CXCL8, NFKB1, STAT1, ICAM1, SMAD2, IL6, RHOA, CCND1, PLAUR) (Figure 3D).
Association of laboratory parameters and serum miRNAs with COVID-19 clinical course
To identify biomarkers that could predict the risk of a worsened disease progression, such as ICU admission, death or development of long-term sequelae, we analyzed the results of routine laboratory tests and the levels of circulating miRNAs according to these outcome parameters. This analysis showed that COVID-19 patients admitted at ICU had significantly higher levels of serum miR-22-3p, miR-101-3p, and miR-451a, and lower levels of miR-155-5p at the time of hospitalization than patients who did not require ICU care (Figure 4A). At variance, no routine laboratory parameters were significantly associated with the risk of ICU admission.
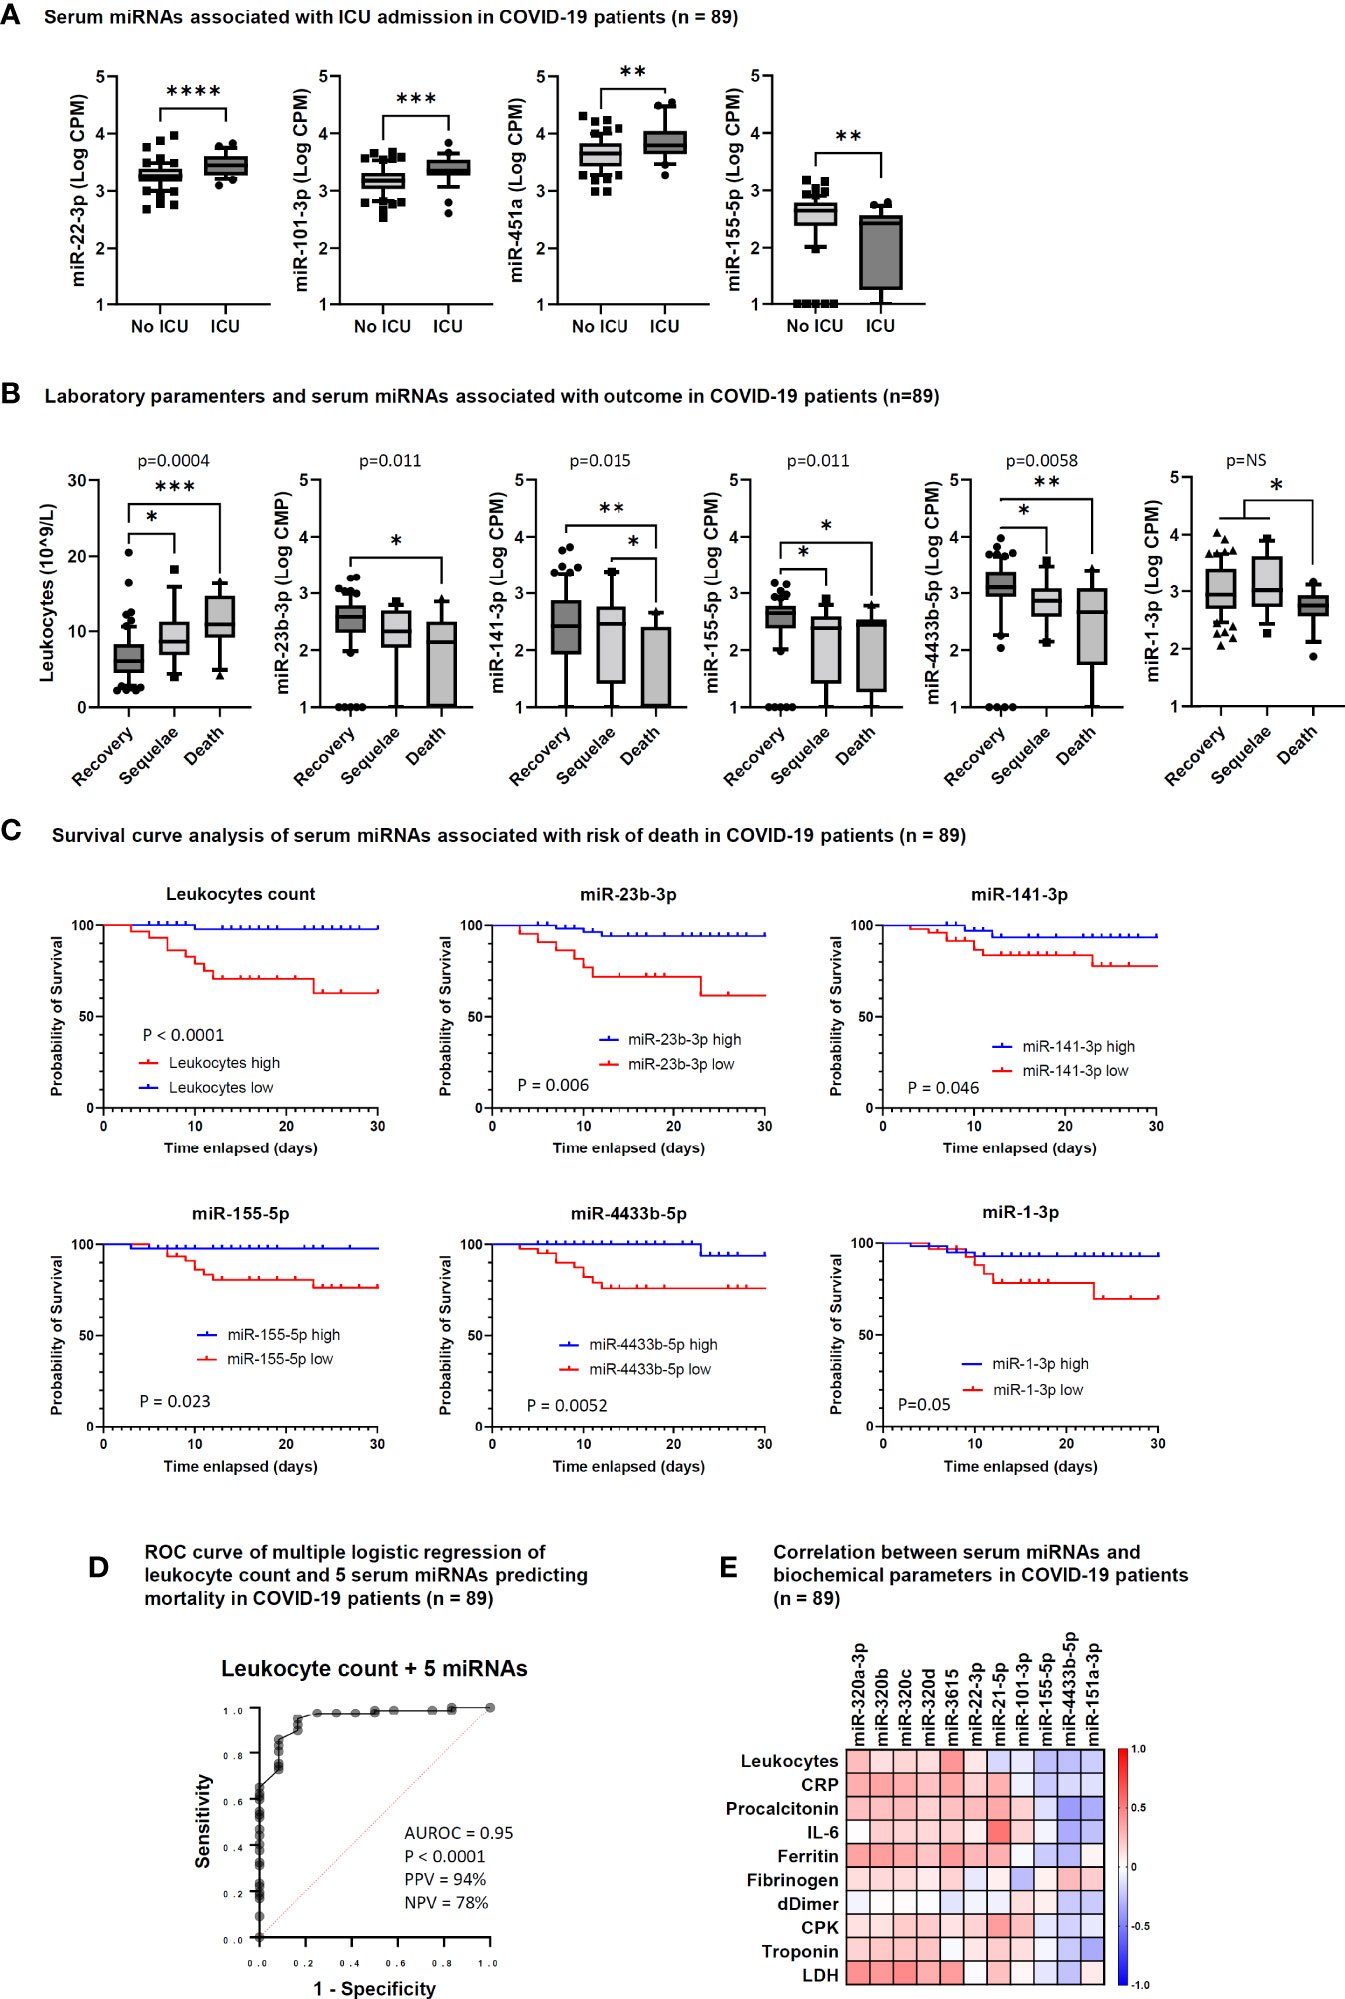
Figure 4 Serum microRNAs associated with intensive care unit (ICU) admission and outcome in COVID-19 patients. (A) Box and whiskers plot of differentially expressed (DE) miRNAs between COVID-19 patients hospitalized at ICU (ICU, n = 28) and not hospitalized at ICU (No ICU, n = 61). Wishers represent 10-90 percentile; p values indicated by * were determined by unpaired Mann Whitney test. (B) Box and whiskers plot of leukocyte counts and DE miRNAs among COVID-19 patients who recovered (Recovery, n = 61), showed COVID-19-related sequelae (Sequelae, n = 16) or had died (Death, n = 12) by day 90 after hospitalization. Wishers represent 10-90 percentile; p values indicated by * were determined by Kruskal Wallis test for multiple comparisons, considering two stage linear step-up procedure of Benjamini, Krieger and Yekutieli adjusted p-values ≤0.05. One-way ANOVA p value results of comparisons among the three groups are shown in the graphs. (C) Survival curve analysis of serum miRNAs significantly associated with the risk of death at 28 days after hospitalization. Comparisons between groups were made by Log-rank test or Gehan-Breslow-Wilcoxon test. P values are shown in the graphs and statistical significance was defined by p <0.05. Cut-off values for low and high miRNA levels in serum were determined by ROC curve analysis. (D) Candidate miRNA biomarkers to predict the risk of death in COVID-19 patients. P value and receiver operating characteristic (ROC) curve were calculated by multiple logistic regression analysis. AUROC, area under the ROC curve; PPV, positive predictive power; NPV, negative predictive power. The five serum miRNAs include miR-1-3p, miR-23b-3p, miR-141-3p, miR-155-5p, and miR-4433b-5p. (E) Correlation matrix between serum miRNAs and laboratory parameters in COVID-19 patients (n = 89). The heatmap represents Spearman r values of miRNAs showing one or more statistically significant correlation with any laboratory parameter. *p<0.05; **p<0.01; ***p<0.001; ****p<0.0001.
Regarding COVID-19 outcome, a significant association was found with the absolute leukocyte count, since patients with long-term sequelae and those who died had increased leukocyte count (Figure 4B). Among miRNAs, low levels of miR-1-3p, miR-23b-3p, miR-141-3p, miR-155-5p, and miR-4433b-5p were significantly associated with COVID-19-related sequelae and/or death (Figure 4B).
Survival curve analysis confirmed that high leukocyte count (>9 × 10^9/L) and low serum levels of miR-1-3p, miR-23b-3p, miR-141-3p, miR-155-5p, and miR-4433b-5p at the time of hospital admission were associated with increased mortality evaluated at 28 days after hospitalization (Figure 4C). Multiple logistic regression analysis showed that a signature combining high leukocyte count with low levels of these five miRNAs was a good predictor of mortality (AUROC 0.95, 95% CI 0.89-1.00, p<0.0001; negative predictive power 78% and positive predictive power 94%) (Figure 4D).
Correlation between circulating miRNAs and laboratory parameters in COVID-19 patients
To determine if the DE circulating miRNAs in COVID-19 patients were associated with inflammation, coagulation disorders, and myocardial damage, we performed correlation analysis between miRNAs and the laboratory parameters reported in Table 1. This analysis identified statistically significant positive correlations between the absolute leukocyte count and miR-3615 levels; between CRP, ferritin, LDH (inflammatory biomarkers) and the miR-320 family and miR-3615; between miR-21-5p and IL-6 and CPK (biomarkers of inflammation and myocardial damage, respectively). At variance, statistically significant negative correlations were found between miR-101-3p and fibrinogen and between miR-151a-3p and miR-4433b-3p and inflammation and myocardial damage biomarkers (procalcitonin, IL-6, and troponin) (Figure 4E).
Correlation analysis among the DE miRNAs in patients with severe COVID-19 displayed a strong positive association among members of the miR-320 family, miR-423-5p, and miR-3615 and between miR-16-5p and miR-451a, suggesting that these miRNAs might be co-regulated (Supplementary Figure 3).
MicroRNAs associated with sex and age of COVID-19 patients
Analysis of serum miRNAs according to sex of COVID-19 patients showed that the levels of several miRNAs resulting upregulated in COVID-19 vs. HC or in severe vs. mild/moderate COVID-19 (miR-21-5p, miR-22-3p, miR-92a-3p, miR-101-3p, miR-320a-3p, miR-423-5p, miR-451a, miR-486-5p, miR-501-3p, miR-3615) were significantly higher in males than in females. Moreover, serum levels of miR-223-3p, which was downregulated in COVID-19 patients vs. HC, were significantly lower in males than in females (Figure 5A). Analysis of serum miRNAs according to age found a statistically significant negative correlation between miR-92a-3p and COVID-19 patients’ age (Figure 5B).
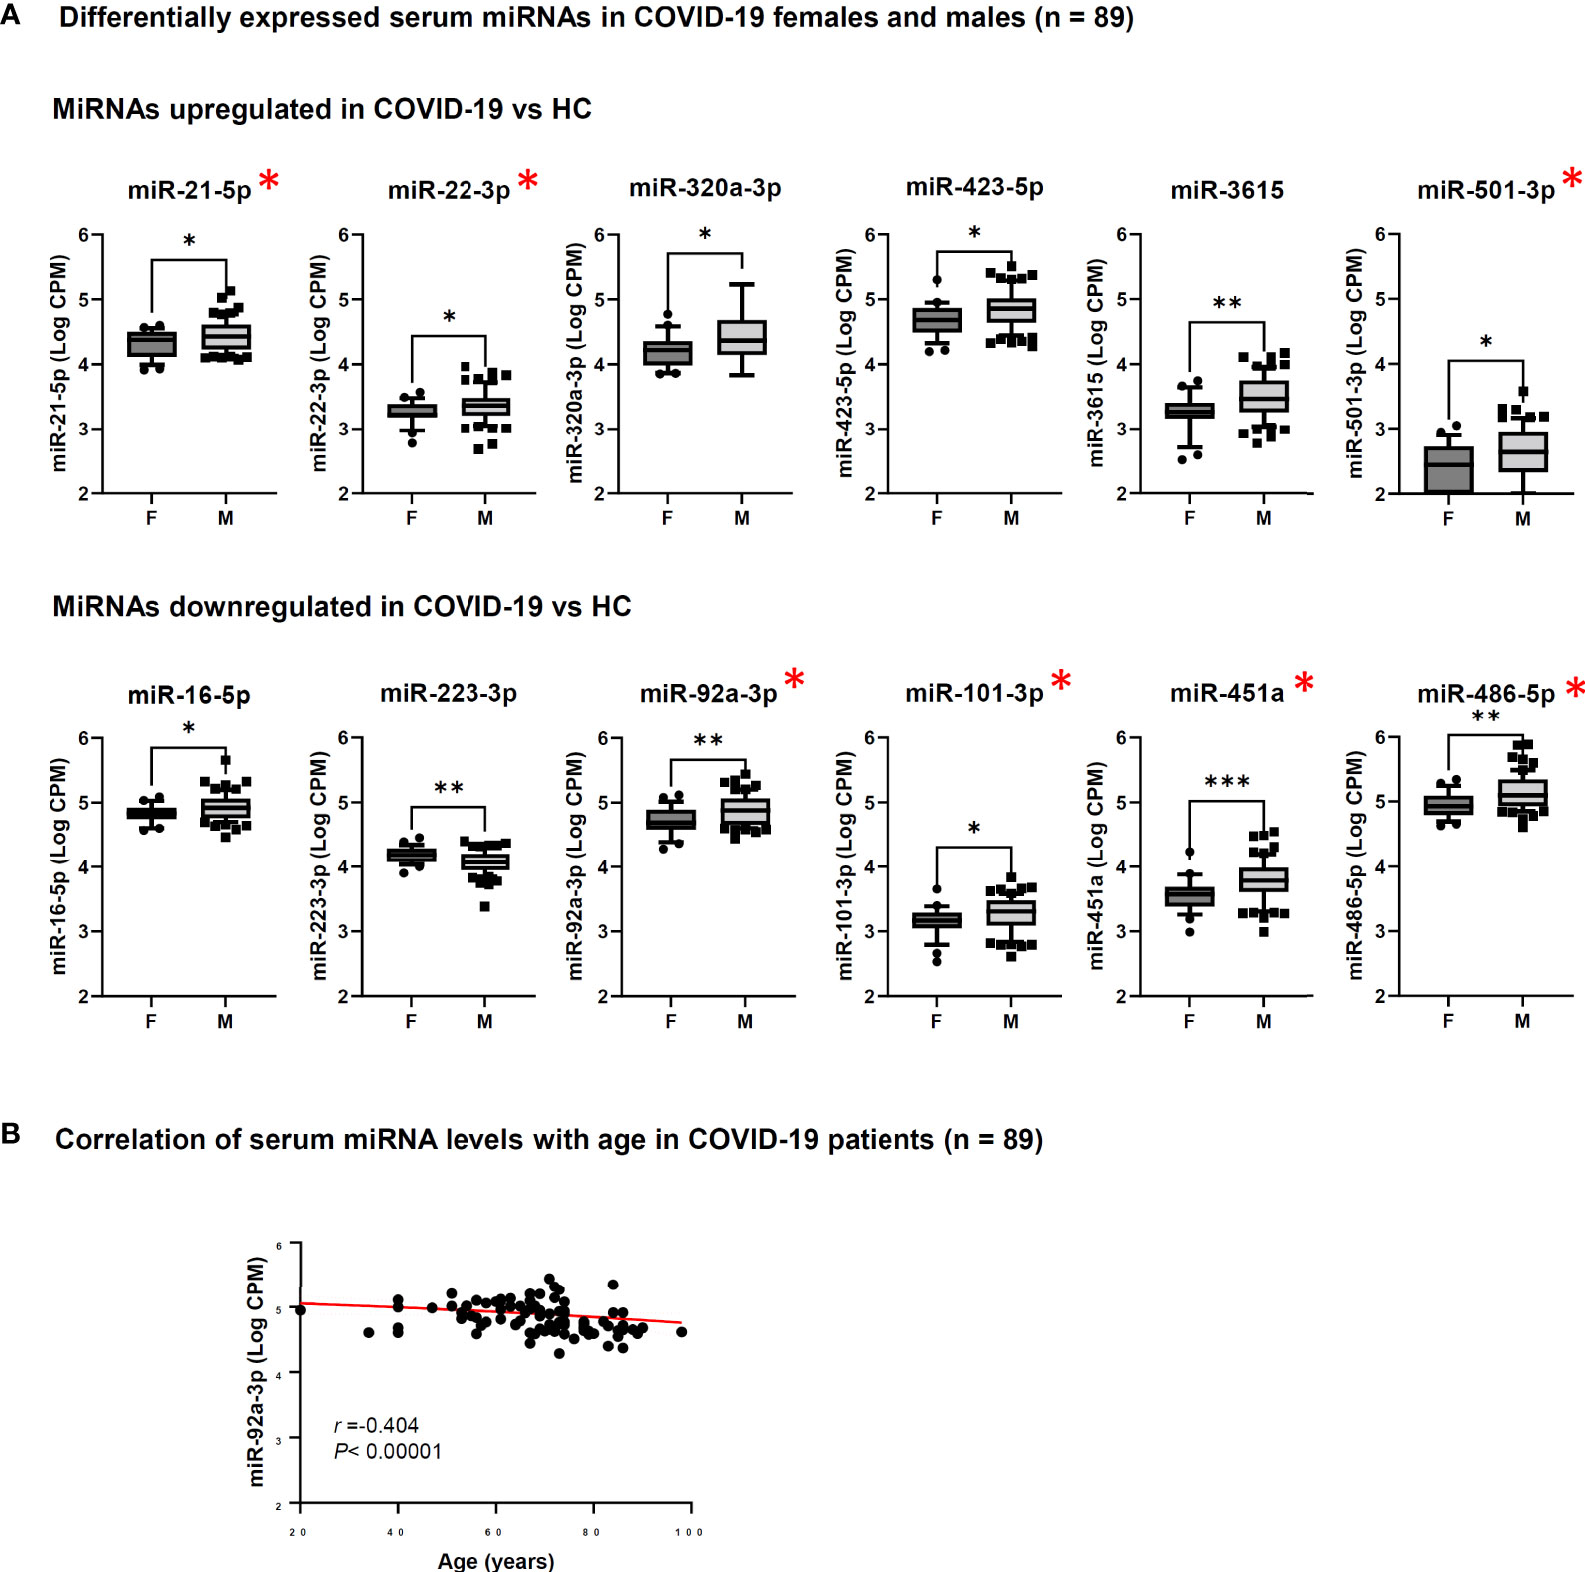
Figure 5 Analysis of serum miRNAs according to sex and age of COVID-19 patients. Serum miRNAs resulting significantly upregulated or downregulated in COVID-19 patients vs. healthy controls (HC) were included in the analyses. The red asterisk indicates miRNAs resulting significantly upregulated in patients with severe COVID-19 vs. mild/moderate COVID-19. (A) Comparison of serum miRNA levels between male (M, n = 62) and female (F, n = 27) COVID-19 patients was done by Mann-Whitney test. *p<0.05; **p<0.01; ***p<0.001. (B) Correlation between serum miRNA levels and age (years) of COVID-19 patients (n = 89) was done by Spearman rank correlation analysis. F, female; M, male. r: Spearman’s correlation coefficient. A statistically significantly correlation was found for miR-92a-3p.
Evaluation of the DE miRNAs in in vitro cell models
In COVID-19 patients, circulating miRNAs could derive from cells, tissues, and organs that are directly damaged by SARS-CoV-2 infection or indirectly affected by innate immune and inflammatory responses to viral infection. To investigate the possible origin of the DE serum miRNAs, we analyzed expression of these miRNAs in human lung epithelial cancer cell line (Calu-3), human epithelial colon carcinoma cell line (Caco-2), human umbilical vein endothelial cells (HUVEC), and human PBMCs after infection with SARS-CoV-2 or treatment with type I IFN. These cells were characterized by different permissiveness to SARS-CoV-2 infection and replication (SARS-CoV-2 could efficiently infect and replicate in Calu-3 cells and, less efficiently, in Caco-2 cells, Figures 6A, B), responsiveness to IFN type I (Calu-3 cells did not respond to treatment with IFN-α2b, Figure 6C), and induction of IFN and inflammatory responses upon SARS-CoV-2 infection (induction of the viral sensors RIG-I and MDA5, the IFN response markers IFIT1 and IFIT2, and the inflammatory markers IL-6 and IL-1β in Calu-3 and in PBMCs, but not in Caco-2 and HUVEC, Figure 6C) and IFN type I stimulation (Calu-3 cells did not respond to IFN-α2b, Figure 6C). Analysis by qPCR of a subset of the DE serum miRNAs identified in COVID-19 patients showed variable expression in baseline conditions among cell types, suggesting tissue-specific expression (e.g., high levels of miR-21-5p in Caco-2 and Calu-3, miR-25-3p and miR-30d-5p in Caco-2, miR-92a-3p and miR-125b-5p in HUVEC, and miR-146a-5p in PBMCs, Figure 7A). Changes of miRNAs induced by SARS-CoV-2 infection were more prominent in the highly permissive Calu-3 cells than in other cell lines, with up-regulation of miR-320a-3p, miR-320b, miR-423-5p, miR-483-5p, miR-185-5p, miR-146a-5p, and miR-155-5p, while other miRNAs (miR-22-3p, miR-125b-5p, and miR-101-3p) were downregulated at 24 hpi, when cells showed cytopathic effects (Figure 7B). Treatment with IFN-α2b for 24 h led to upregulation of miR-21-5p in Caco-2, miR-483-5p in HUVEC, and miR-29c-3p, miR-378a-3p, and miR-146a-5p in PBMCs. At variance, treatment led to downregulation of miR-423-5p and miR-29c-3p in Caco-2 and downregulation of miR-30d-5p, miR-93-5p, miR-101-3p, miR-185-5p in HUVEC and PBMCs (Figure 7C).
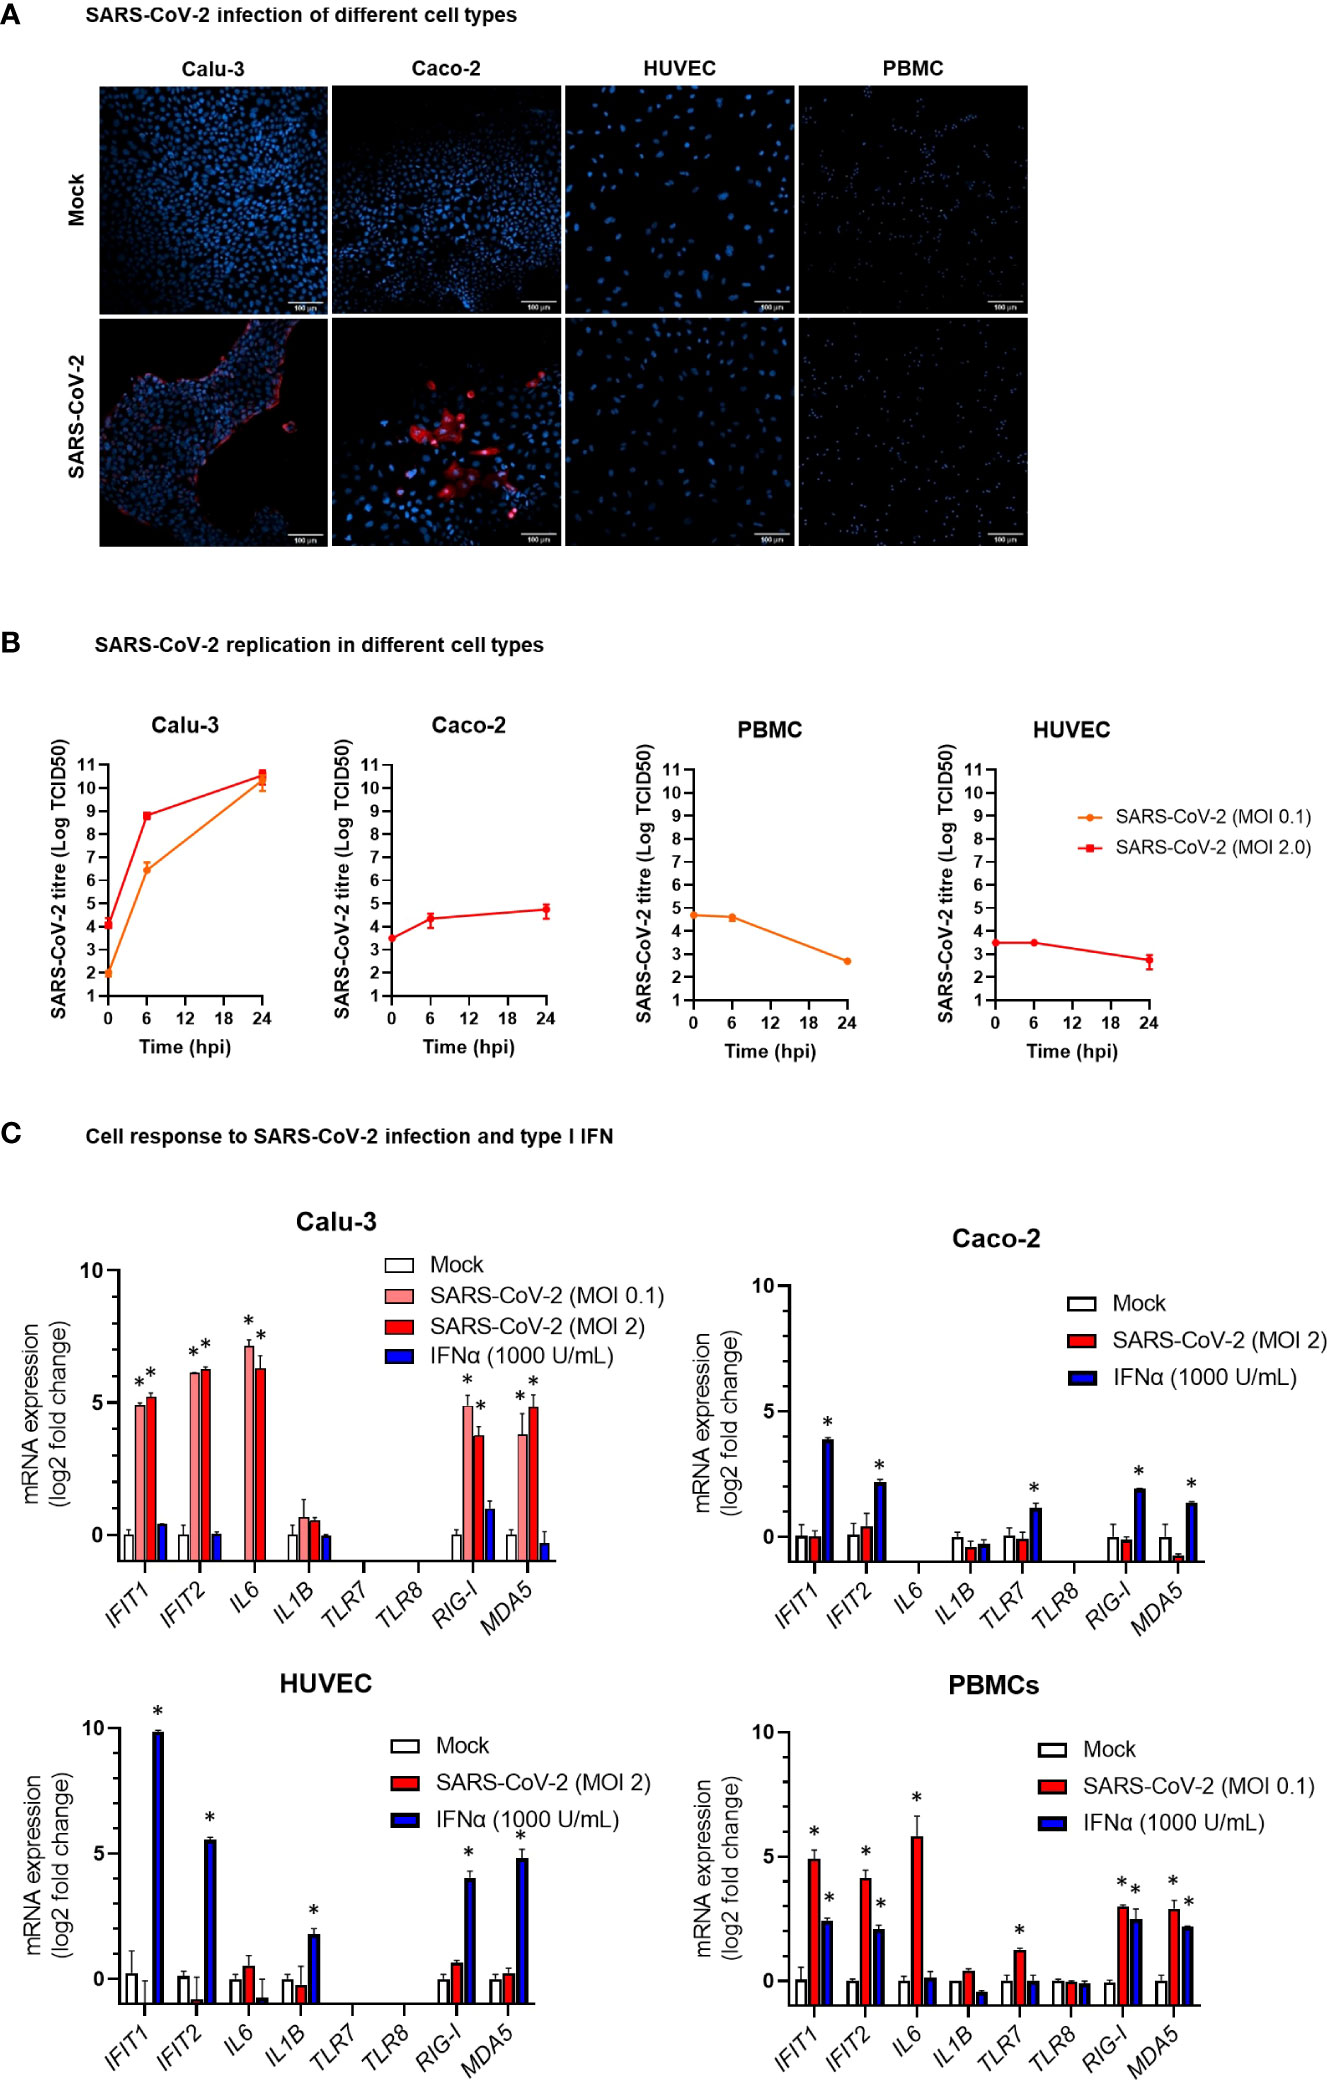
Figure 6 Modelling SARS-CoV-2 infection and IFNα stimulation in different human cell types. (A) Representative confocal microscopy images of lung carcinoma epithelial cells Calu-3, colon carcinoma epithelial cells Caco-2, human umbilical vein endothelial cells HUVEC, and peripheral blood mononuclear cells (PBMC) infected with SARS-CoV-2 or mock infected. Cells were stained with anti-SARS-CoV-2 nucleoprotein antibody (red) at 24 hours post infection. Nuclei were stained with draq5 (blue). 20× magnification. (B) Kinetics of SARS-CoV-2 replication in Calu-3, Caco-2, HUVEC, and PBMC. Viral load was measured by TCID50 assay in cell culture supernatant collected at different hours post infection (hpi) with SARS-CoV-2 at MOI 0.1 or 2. Viral titer is represented as mean ± SD of Log TCID50 values obtained from two experiments conducted in triplicate. (C) Expression of the IFN stimulated genes IFIT1 and IFIT2, the pro-inflammatory cytokine genes IL6 and IL1B, and the ssRNA sensor genes TLR7 and TLR8 in HUVEC, PBMC, Caco-2 and Calu-3 cells at 24 hpi with SARS-CoV-2 at MOI 01 or 2 or treatment with IFN-α2b 1000 U/mL. mRNA expression was measured by real-time RT-PCR and represented as mean ± SD of log2 fold change vs. mock (calculated with the 2-ΔΔCT method) obtained from two experiments conducted in triplicate. Comparison between groups (infected or treated cells vs. mock) was down by Mann-Whitney U test. *p<0.05.
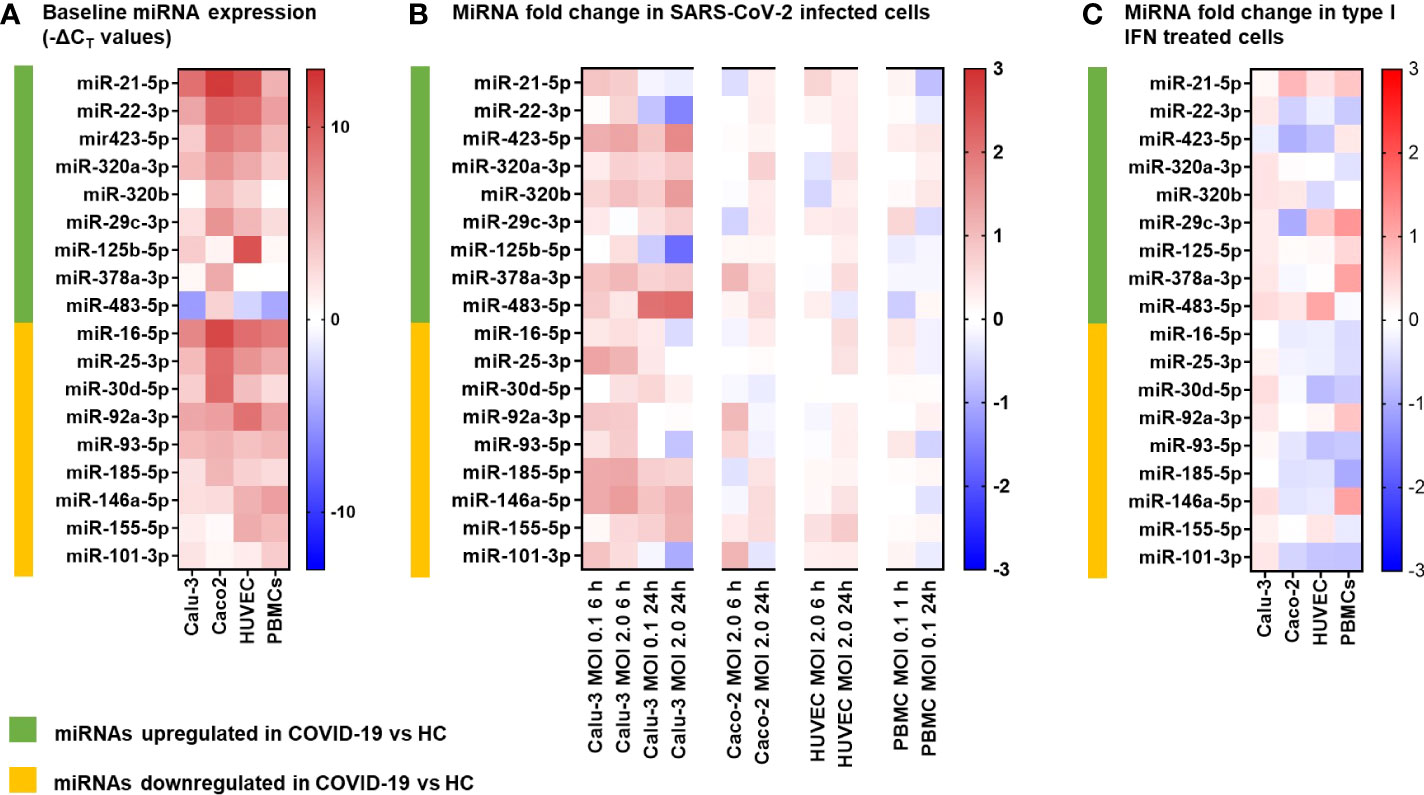
Figure 7 MicroRNA expression following SARS-CoV-2 infection and IFNα stimulation in different human cell types. The miRNAs investigated in vitro were selected among the differentially expressed (9 upregulated and 9 downregulated) serum miRNAs identified by the study in COVID-19 patients vs. healthy controls (HC). (A) Heatmap representing baseline miRNAs expression in lung carcinoma epithelial cells Calu-3, colon carcinoma epithelial cells Caco-2, human umbilical vein endothelial cells HUVEC, and peripheral blood mononuclear cells (PBMC). Data represent -ΔCT values of miRNA normalized to the endogenous control RNU6B in triplicate samples. The color scale bar represents -ΔCT values. (B) Heatmap representing miRNA fold change in cells infected with SARS-CoV-2 at MOI 0.1 or 2 vs. mock infected cells at 6 h and 24 h post infection. mRNA expression was measured by real-time RT-PCR and represented as mean log2 fold change vs. mock (calculated with the 2-ΔΔCT method) obtained from two experiments conducted in triplicate. The color scale bar represents mean log2 fold change vs. mock. (C) Heatmap representing miRNA fold change in cells treated for 24 h with IFNα 1000 U/mL vs. mock treated cells. mRNA expression was measured by real-time RT-PCR and represented as mean log2 fold change vs. mock (calculated with the 2-ΔΔCT method) obtained from two experiments conducted in triplicate. The color scale bar represents mean log2 fold change vs. mock.
Discussion
In this study, we investigated a cohort of COVID-19 patients at the time of hospital admission to discover signatures of DE circulating miRNAs associated with COVID-19 severity and disease outcome. The results of this study identified serum miRNA profiles, which could discriminate between COVID-19 and HC, between severe COVID-19 and moderate/mild disease, or predict the risk of ICU admission, COVID-19 related sequelae and death (Figure 8A). Expression analysis of DE miRNAs in relevant cell types in vitro upon SARS-CoV-2 exposure or type I IFN treatment provided hints to their possible sources (Figure 8B).
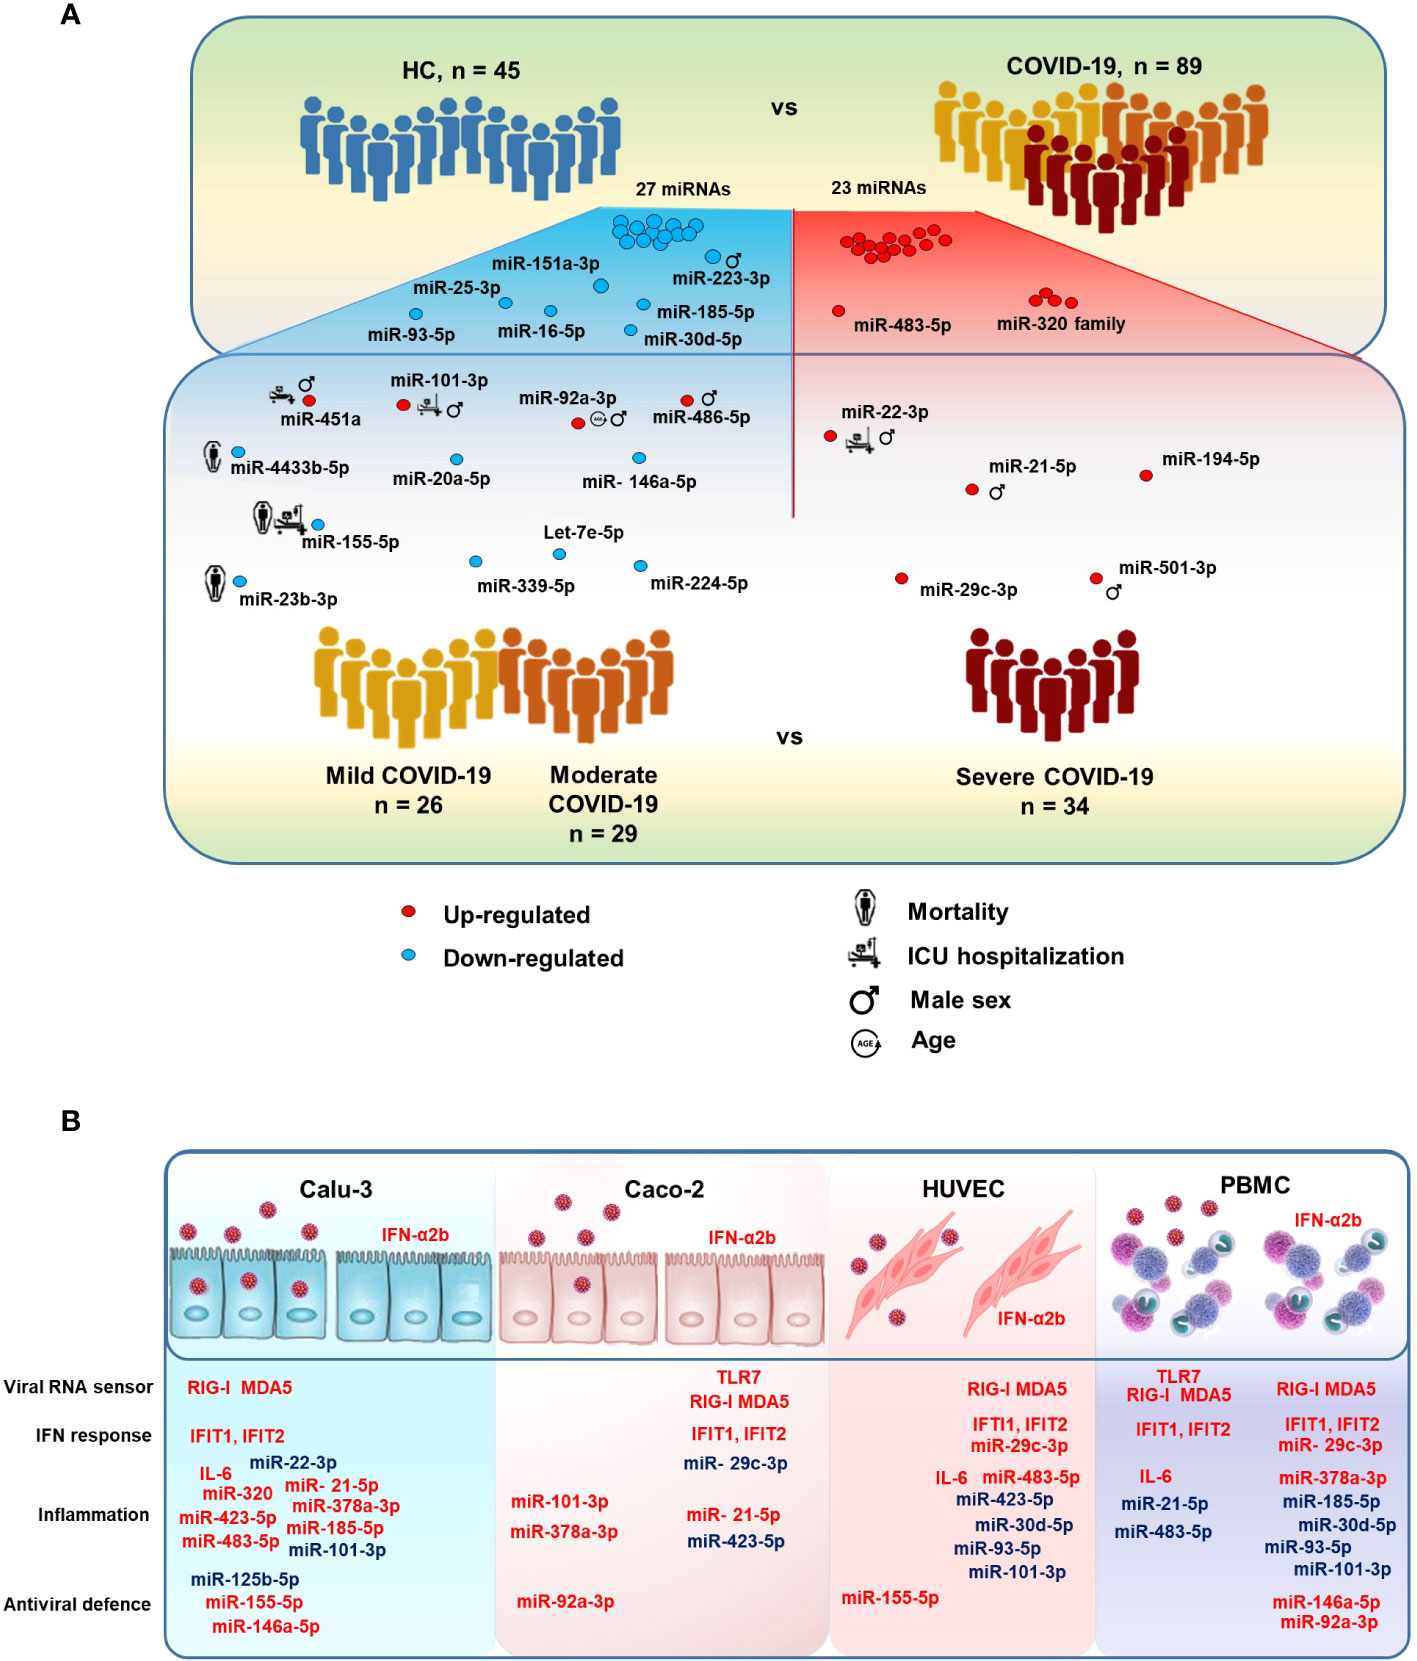
Figure 8 MicroRNAs modulated in COVID-19 patients. (A) Illustration of the study design and results, highlighting relevant serum miRNAs that were differentially expressed between COVID-19 patients vs. HC and between severe COVID-19 vs. mild and moderate COVID-19. The figure also shows serum miRNAs significantly associated with the risk of intensive care unit (ICU) hospitalization and death in COVID-19 patients, as well as male sex and age. (B) Illustration of the results of in vitro experiments, summarizing the effects of SARS-CoV-2 infection and IFN-α2b treatment on human lung (Calu-3), colon (Caco-2), endothelial (HUVEC), and peripheral blood mononuclear cells (PBMCs). Upregulated and downregulated miRNAs are represented in red and blue, respectively.
Through small RNA sequencing of serum miRNAs, we showed that miR-320 family members and miR-483-5p were the maximally upregulated serum miRNAs in COVID-19 patients in comparison with HC. In the literature, miR-320 family members were found as upregulated in plasma of patients with COVID-19 and especially in those with severe COVID-19 compared to those with moderate disease (17). High levels of miR-320b and miR-483-5p were also associated with increased risk of in-hospital mortality in COVID-19 patients (41) and upregulated in extracellular vesicles-enriched sera of atherosclerotic patients, indicating a possible role in vascular and endothelial injury (42). In our study, the levels of serum miR-320 family showed a positive correlation with inflammatory and tissue injury biomarkers, suggesting a role for these miRNAs in inflammatory response. Particularly strong was the positive correlation between miR-320 family and LDH, which is pathognomonic for pyroptosis and other forms of necrotic cell death and associated with severe COVID-19 (43). Interestingly, in vitro experiments showed that both miR-320 and miR-483-5p were significantly upregulated in lung Calu-3 cells upon SARS-CoV-2 infection.
The maximally downregulated miRNAs in serum of COVID-19 patients vs. HC included miR-30d-5p, miR-25-3p, miR-93-5p, miR-16-5p, miR-101-3p, miR-185-5p, miR-425-5p, miR-451a, miR-20a-5p, and miR-151-3p, which could discriminate between COVID-19 patients and HC with AUROC >0.90. These miRNAs target several pro-inflammatory cytokine and chemokine genes (e.g., TNF, CCL2, CXCL9, CXCL10, IL10, VEGFA) as well as cytokine and chemokine receptors and transduction factors (IL1R1, IL2RA, IFNAR2), reported as upregulated and associated with mortality in COVID-19 patients (44, 45). Genes involved in angiogenesis, immune cell proliferation and regulation, apoptosis, autophagy, and oxidative stress (e.g., ACE2, ANGPT2, BCL2, FGF2, HGF, TP53, and ZEB1) represented additional targets of the downregulated miRNAs in COVID-19. Since down-regulation of miRNAs leads to the up-regulation of their target genes, repression of these miRNAs in COVID-19 may contribute to the impaired innate and adaptive immune responses, the excessive systemic inflammation, the cytokine storm and cardiovascular injury that characterizes COVID-19 (46, 47).
While a miRNA signature could clearly discriminate between COVID-19 and HC, the differences in serum miRNA profile between severe COVID-19 cases and mild/moderate cases were subtle. Patients with severe COVID-19 had higher serum levels of a set of miRNAs, including miR-21-5p and miR-22-3p, which were also upregulated in COVID-19 patients vs HCs, in agreement with literature data (18). MiR-21-5p has been implicated in different regulatory pathways and high circulating levels were associated with lung disease and cardiac fibrosis (48, 49). Accordingly, in our COVID-19 cohort, miR-21-5p levels showed positive correlations with serum IL-6 and CPK, which are biomarkers of inflammation and myocardial damage, respectively. MiR-22-3p negatively regulates type I IFN and inflammatory cytokine production (50–52) and high circulating levels of miR-22-3p were found to predict COVID-19 mortality (17) and heart failure (53). In our study, network analysis showed that miR-21-5p and miR-22-3p share targets involved in cell signaling, cell proliferation and angiogenesis.
Additional upregulated miRNAs in severe COVID-19 compared to mild/moderate disease included miR-101-3p, miR-194-5p, miR-451a, miR-486-5p, miR-29c-3p, and miR-501-3p, while levels of circulating let-7e-5p, miR-20a-5p, miR-23b-3p, miR146a-5p, miR-155-5p, miR-224-5p, miR-339-5p, and miR-4433b-5p were significantly downregulated. Relevant targets of the up-regulated miRNAs include several genes involved in antiviral innate immune response (e.g., IFNG, TLR3, TLR7, CCL4, CCL5), while down-regulated miRNAs target pro-inflammatory cytokine and chemokine genes (e.g., IL6, TNF, NFKB1, CXCL8, CXCL10, VEGFA), which are upregulated in severe COVID-19 patients and associated with mortality (5, 45, 46). Thus, since miRNAs inhibit their target gene expression, the modulated miRNAs in severe COVID-19 would lead to the inhibition of antiviral response and to the induction of inflammation. Let-7 family is induced by IL-15 signaling in natural killer T cells, leading to IFN-γ production (54). Specifically, let-7e-5p targets RIPK1, CASP8, and TNF, which control signaling pathways leading to inflammation and apoptotic or necroptotic cell death. In our study, let-7e-5p levels were increased in serum of patients with mild and moderate COVID-19, but not in patients with severe disease. Likewise, other key miRNAs regulating innate antiviral response, i.e., miR-23b-3p, miR-92a-3p, miR-101-3p, miR-155-5p, miR-224-5p, miR-451a, and miR-486-5p, were modulated in patients with mild/moderate COVID-19 but not in those with severe disease. This finding is in agreement with the activation of effective antiviral responses in patients with mild and moderate COVID-19, but not in patients with severe disease, who typically have impaired innate immunity (55).
In this study, some of the circulating miRNAs that were associated with severe disease were also predictive of the clinical course and disease outcome. In particular, the levels of miR-22-3p, miR-101-3p and miR-451a were significantly higher and miR-155-5p significantly lower in patients hospitalized in ICU than in those not requiring ICU. In addition, a signature characterized by low levels of miR-1-3p, miR-23b-3p, miR-141-3p, miR-155-5p and miR-4433b-5p and high leukocyte count predicted an increased risk of COVID-19-related sequelae and/or death. Dysregulation of these miRNAs was observed is physiological and pathological processes such as immunity, inflammation, and cardiovascular diseases. In our study, circulating miR-101-3p levels showed a negative correlation with fibrinogen levels, which were low in severe COVID-19 patients and associated with poor prognosis (56). Increased serum levels of miR-101-3p were observed also in neonatal sepsis (57). MiR-451a, mostly expressed in blood cells and released in extracellular vesicles, attenuates type I IFN and IL-6 responses (58, 59) and was reported to progressively decrease with COVID-19 severity (19–21). MiR-155-5p plays a key role in the homeostasis and function of the immune system (60). It is highly expressed in activated B-cells and T-cells and in monocytes/macrophages and targets a variety of genes (61), resulting in enhancement of type I IFN signaling and subsequent innate and adaptive immune responses (62). In agreement with our data, significantly lower levels of serum miR-155-5p were found in patients with severe COVID-19 and in those who died (63). Regarding the other miRNAs associated with the risk of death and/or sequelae, miR-1-3p is muscle-specific and its expression is diminished in heart disease (64); miR-23b-3p promotes cell differentiation and inhibits cell proliferation and angiogenesis (65); miR-141-3p targets the chemokine gene CXCL12 (66), which plays a key role in immune cell recruitment and is upregulated in severe COVID-19 (67); miR-4433b-5p is significantly down-regulated in COVID-19 patients requiring supplementary oxygen therapy (68), but its functions remain unknown. Our study showed a statistically significant negative correlation between miR-4433b-3p and inflammation and myocardial damage biomarkers suggesting it might have a role in cardiac function. This miRNA, as well as the other miRNAs predictive of mortality, warrant further research as potential therapeutic targets, once their functions in health and disease are elucidated.
Analysis of the DE serum miRNAs according to sex of COVID-19 patients, regardless of disease severity, highlighted an association between male sex and the dysregulated miRNA signature observed especially in severe COVID-19. Male patients had higher levels of serum miRNAs implicated in pro-inflammatory responses (such as miR-miR-21-5p, miR-320a-3p, miR-101-3p) and lower levels of serum miR-223-3p, which was downregulated in COVID-19 patients and identified as a negative regulator of pro-inflammatory cytokine secretion and NLRP3 inflammasome activation in the lung of SARS-CoV-2 infected mice (15). In our study, serum levels of miR-92a-3p negatively correlated with patients’ age and were down-regulated in patients with mild/moderated COVID-19 but not in those with severe disease. Interestingly, this miRNA was found to be highly expressed in mesenchymal stem-cell-derived extracellular vesicles and to target both a conserved 3’-untranslated region of SARS-CoV-2 genome and inflammatory response genes (69).
Taken together, our results from the clinical study showed that COVID-19 patients had a circulating miRNA signature characterized by upregulation of miRNAs associated with lung disease, vascular damage and inflammation and downregulation of miRNAs that inhibit expression and activity of pro-inflammatory cytokines and chemokines, angiogenesis, and stress response. Compared to patients with mild/moderate COVID-19, patients with severe COVID-19 and hospitalized in ICU had a circulating miRNA signature indicating a profound impairment of innate and adaptive immune responses, inflammation, cytokine storm, lung fibrosis and heart failure. A subset of the DE miRNAs predicted mortality in COVID-19 patients.
Circulating miRNAs are released by various cell types, mostly macrophages, lymphocytes, endothelial cells, and platelets, but also by passive leakage from damaged cells as a consequence of tissue injury, inflammation, necrosis, or apoptosis (70).
To search for the possible source of the DE circulating miRNAs in COVID-19 patients, we analyzed the expression of these miRNAs in vitro in relevant cell types, i.e., lung carcinoma epithelial cells Calu-3, colon carcinoma epithelial cells Caco-2, endothelial cells HUVEC, and PBMCs, characterized by different tissue origin, permissiveness to SARS-CoV-2 infection and replication, capacity to sense RNA viruses and trigger antiviral response, and integrity of type I IFN response pathway. These cells are representative of the main tissues involved in COVID-19 pathogenesis, i.e., the pulmonary epithelium, which is the primary target of SARS-CoV-2 infection and injury, and the gut epithelium, which is also productively infected by SARS-CoV-2 in vivo (71). Endothelial cells express low levels of ACE2 and TMPRSS2 (72) and are poorly susceptible to SARS-CoV-2 infection (71). However, endothelial cells are involved in COVID-19 pathogenesis with endothelitis and thrombo-embolic manifestations and, in animal models, SARS-CoV-2 spike protein or its S1 subunit can cause endothelial damage (73, 74). Blood cells are not productively infected by SARS-CoV-2 but can sense the virus activating innate antiviral responses (55). Accordingly, our experiments showed that Calu-3 cells were permissive to SARS-CoV-2 replication, which induced CPE and triggered IFN and inflammatory responses. The virus replicated less efficiently in Caco-2 cells without CPE nor induction of IFN or inflammatory response. PBMC stimulation with SARS-CoV-2 induced the expression of IFN stimulated genes (ISGs), while HUVEC were not infected by SARS-CoV-2 nor responded to the virus.
The results of miRNA analysis in these in vitro models highlighted cell-specific differences of miRNA levels in baseline conditions. Upon SARS-CoV-2 infection, most changes in intracellular miRNA levels occurred in the highly permissive epithelial lung carcinoma cell line Calu-3. In these cells, SARS-CoV-2 infection upregulated miR-185-5p, miR-320, miR-423-5p, and miR-483-5p, which promote inflammation and inhibit antiviral responses, as well as miR-146a-5p and miR-155-5p, which act antagonistically to produce a robust inflammatory response (11). Upregulation of miR-155-5p following SARS-CoV-2 infection was previously described in Calu-3 cells and associated with induction of antiviral and pro-inflammatory responses triggered by sensors of RNA viruses (75). Conversely, SARS-CoV-2 infection of Calu-3 cells led to down-regulation of miR-22-3p and miR-125b-5p. These miRNAs play a key role in the regulation of cell self-renewal, differentiation, autophagy and their overexpression lead to uncontrolled cell proliferation and defective differentiation via TGFβ and Wnt signaling pathways and DNA methylation (11). This miRNA signature was in agreement with the robust activation of the ISGs IFIT1 and IFIT2 and the pro-inflammatory cytokine genes IL6 and IL1B and upon SARS-CoV-2 infection, which was conceivably sensed by RIG-I and MDA5. The colon carcinoma cell line Caco-2, which is permissive to SARS-CoV-2 but unable to activate innate antiviral and IFN responses, and the non-permissive HUVEC and PBMCs did not show relevant changes of miRNA expression upon SARS-CoV-2 infection. However, theses miRNA responses may not be totally representative of miRNA expression profiles in healthy primary lung cell or gut cells experiencing SARS-CoV-2, since the colorectal and lung cells used in this study were derived from cancer cell lines. Likewise, the umbilical endothelial cells might not be representative of the endothelial cells in the lung vasculature and PBMCs may not fully represent local immune-inflammatory cells in the alveoli.
Treatment with IFN-α modulated expression of some of the selected DE miRNAs in the IFN-responsive Caco-2, HUVEC and PBMCs, but not in Calu-3 cells, characterized by a poor response to type I IFN stimulation. In Caco-2, HUVEC, and PBMC, several miRNAs downregulated in COVID-19, such as miR-93-5p, miR-185-5p, and miR-101-3p, were consistently downregulated by IFNα stimulation. In PBMC, IFNα treatment upregulated miR-29c-3p (upregulated in serum of COVID-19 patients), which is known to target the IFN receptor IFNAR1 as negative feedback to limit type I IFN response (76), as well as miR-146a-5p and miR-378a-3p, which, respectively, inhibit TLR-mediated innate immune responses (11) and promote NET formation by granulocytes in sepsis (77). Another overexpressed miRNA in the serum of COVID-19 patients with severe disease, miR-483-5p, was markedly induced by IFN-α treatment of HUVEC endothelial cells and by SARS-CoV-2 infection in Calu-3 cells. Overexpression of this miRNA, which leads to suppression of cell proliferation and production of inflammatory cytokines (78) was observed in the lung tissues of mice with sepsis-induced acute lung injury (79).
In conclusion, this study discovered signatures of circulating miRNAs associated with COVID-19 severity and mortality, which warrant further investigation and validation as candidate prognostic biomarkers. The identified DE circulating miRNAs provided clues on COVID-19 pathogenesis, highlighting signatures of impaired IFN and antiviral responses, inflammation, organ damage and cardiovascular failure as associated with severe disease and death. In vitro experiments showed that some of these miRNAs were modulated directly by SARS-CoV-2 infection or indirectly by IFN.
Data availability statement
The datasets presented in this study can be found in online repositories. The names of the repository/repositories and accession number(s) can be found below: Gene Expression Omnibus under accession number GSE201790.
Ethics statement
The studies involving human participants were reviewed and approved by Comitato Etico per la Sperimentazione Clinica delle Province di Verona e Rovigo. The patients/participants provided their written informed consent to participate in this study.
Author contributions
AG, SR, AS, CP, RM, FG, GC, and LB contributed to the study design. CP, ER, and FG contributed to patient recruitment, data collection, and clinical analysis. AG, SR, AS, MA, and EM contributed to wet-lab data generation and in vitro analysis. AG, PB, GC, and LB contributed to small RNA sequencing analysis and statistical analysis. AG, GC, and LB wrote and revised the manuscript. All authors discussed and commented on the manuscript. RM, FG, GC, and LB provided funding to support this study. All authors contributed to the article and approved the submitted version.
Funding
This work was funded by the European Union’s Horizon 2020 Research and Innovation Program, under grant agreement no. 874735 (VEO), and by PRID grant from the University of Padova. The work at IRCCS Sacro Cuore Don Calabria Hospital was supported by the Italian Ministry of Health “Fondi Ricerca Corrente – L1P6” and by the Italian Ministry of Health - COVID-2020-12371675. Small RNA-sequencing was performed by a NextSeq 550 Instrument purchased by the DIMAR Excellence project funding (DImed and MAlattie Rare) of the Department of Medicine, University of Padua.
Acknowledgments
We wish to thank Andrea Benetti (Department of Medicine, University of Padova) for technical assistance.
Conflict of interest
The authors declare that the research was conducted in the absence of any commercial or financial relationships that could be construed as a potential conflict of interest.
Publisher’s note
All claims expressed in this article are solely those of the authors and do not necessarily represent those of their affiliated organizations, or those of the publisher, the editors and the reviewers. Any product that may be evaluated in this article, or claim that may be made by its manufacturer, is not guaranteed or endorsed by the publisher.
Supplementary material
The Supplementary Material for this article can be found online at: https://www.frontiersin.org/articles/10.3389/fimmu.2022.968991/full#supplementary-material
References
1. Gupta RK, Harrison EM, Ho A, Docherty AB, Knight SR, van Smeden M, et al. Development and validation of the ISARIC 4C deterioration model for adults hospitalised with COVID-19: A prospective cohort study. Lancet Respir Med (2021) 9:349–59. doi: 10.1016/S2213-2600(20)30559-2
2. Pathak GA, Singh K, Miller-Fleming TW, Wendt FR, Ehsan N, Hou K, et al. Integrative genomic analyses identify susceptibility genes underlying COVID-19 hospitalization. Nat Commun (2021) 12:4569. doi: 10.1038/s41467-021-24824-z
3. Wong LR, Perlman S. Immune dysregulation and immunopathology induced by SARS-CoV-2 and related coronaviruses - are we our own worst enemy? Nat Rev Immunol (2022) 22:47–56. doi: 10.1038/s41577-021-00656-2
4. Gorog DA, Storey RF, Gurbel PA, Tantry US, Berger JS, Chan MY, et al. Current and novel biomarkers of thrombotic risk in COVID-19: A consensus statement from the international COVID-19 thrombosis biomarkers colloquium. Nat Rev Cardiol (2022) 19:475–95. doi: 10.1038/s41569-021-00665-7
5. Del Valle DM, Kim-Schulze S, Huang HH, Beckmann ND, Nirenberg S, Wang B, et al. An inflammatory cytokine signature predicts COVID-19 severity and survival. Nat Med (2020) 26:1636–43. doi: 10.1038/s41591-020-1051-9
6. Arunachalam PS, Wimmers F, Mok CKP, Perera RAPM, Scott M, Hagan T, et al. Systems biological assessment of immunity to mild versus severe COVID-19 infection in humans. Science (2020) 369:1210–20. doi: 10.1126/science.abc6261
7. Amrute JM, Perry AM, Anand G, Cruchaga C, Hock KG, Farnsworth CW, et al. Cell specific peripheral immune responses predict survival in critical COVID-19 patients. Nat Commun (2022) 13:882. doi: 10.1038/s41467-022-28505-3
8. Pritchard CC, Cheng HH, Tewari M. MicroRNA profiling: Approaches and considerations. Nat Rev Genet (2012) 13:358–69. doi: 10.1038/nrg3198
9. Lu D, Thum T. RNA-Based diagnostic and therapeutic strategies for cardiovascular disease. Nat Rev Cardiol (2019) 16:661–74. doi: 10.1038/s41569-019-0218-x
10. Ceolotto G, Giannella A, Albiero M, Kuppusamy M, Radu C, Simioni P, et al. miR-30c-5p regulates macrophage-mediated inflammation and pro-atherosclerosis pathways. Cardiovasc Res (2017) 113:1627–38. doi: 10.1093/cvr/cvx157
11. Mehta A, Baltimore D. MicroRNAs as regulatory elements in immune system logic. Nat Rev Immunol (2016) 16:279–94. doi: 10.1038/nri.2016.40
12. Bautista-Becerril B, Pérez-Dimas G, Sommerhalder-Nava PC, Hanono A, Martínez-Cisneros JA, Zarate-Maldonado B, et al. MiRNAs, from evolutionary junk to possible prognostic markers and therapeutic targets in covid-19. Viruses (2021) 14:41. doi: 10.3390/v14010041
13. Treiber T, Treiber N, Meister G. Regulation of microRNA biogenesis and its crosstalk with other cellular pathways. Nat Rev Mol Cell Biol (2019) 20:5–20. doi: 10.1038/s41580-018-0059-1
14. Gebert LFR, MacRae IJ. Regulation of microRNA function in animals. Nat Rev Mol Cell Biol (2019) 20:21–37. doi: 10.1038/s41580-018-0045-7
15. Morales L, Oliveros JC, Enjuanes L, Sola I. Contribution of host miRNA-223-3p to SARS-CoV-induced lung inflammatory pathology. mBio (2022) 13:e0313521. doi: 10.1128/mbio.03135-21
16. Maranini B, Ciancio G, Ferracin M, Cultrera R, Negrini M, Sabbioni S, et al. microRNAs and inflammatory immune response in SARS-CoV-2 infection: A narrative review. Life (Basel) (2022) 12:288. doi: 10.3390/life12020288
17. Fernández-Pato A, Virseda-Berdices A, Resino S, Ryan P, Martínez-González O, Pérez-García F, et al. Plasma miRNA profile at COVID-19 onset predicts severity status and mortality. Emerg Microbes Infect (2022) 11:676–88. doi: 10.1080/22221751.2022.2038021
18. Gutmann C, Khamina K, Theofilatos K, Diendorfer AB, Burnap SA, Nabeebaccus A, et al. Association of cardiometabolic microRNAs with COVID-19 severity and mortality. Cardiovasc Res (2022) 118:461–74. doi: 10.1093/cvr/cvab338
19. de Gonzalo-Calvo D, Benítez ID, Pinilla L, Carratalá A, Moncusí-Moix A, Gort-Paniello C, et al. Circulating microRNA profiles predict the severity of COVID-19 in hospitalized patients. Clin Trial (2021) 236:147–59. doi: 10.1016/j.trsl.2021.05.004
20. Wilson JC, Kealy D, James SR, Plowman T, Newling K, Jagger C, et al. Integrated miRNA/cytokine/chemokine profiling reveals severity-associated step changes and principal correlates of fatality in COVID-19. iScience (2021) 25:103672. doi: 10.1016/j.isci.2021.103672
21. Yang P, Zhao Y, Li J, Liu C, Zhu L, Zhang J, et al. Downregulated miR-451a as a feature of the plasma cfRNA landscape reveals regulatory networks of IL-6/IL-6R-associated cytokine storms in COVID-19 patients. Cell Mol Immunol (2021) 18:1064–6. doi: 10.1038/s41423-021-00652-5
22. Gustafson D, Ngai M, Wu R, Hou H, Schoffel AC, Erice C, et al. Cardiovascular signatures of COVID-19 predict mortality and identify barrier stabilizing therapies. EBioMedicine (2022) 78:103982. doi: 10.1016/j.ebiom.2022.103982
23. Zeng Q, Qi X, Ma J, Hu F, Wang X, Qin H, et al. Distinct miRNAs associated with various clinical presentations of SARS-CoV-2 infection. iScience (2022) 25:104309. doi: 10.1016/j.isci.2022.104309
24. Garcia-Giralt N, Du J, Marin-Corral J, Bódalo-Torruella M, Blasco-Hernando F, Muñoz-Bermúdez R, et al. Circulating microRNA profiling is altered in the acute respiratory distress syndrome related to SARS−CoV−2 infection. Sci Rep (2022) 12:6929. doi: 10.1038/s41598-022-10738-3
25. World Health Organization. Clinical management of COVID-19: interim guidance (2020). Available at: https://apps.who.int/iris/handle/10665/332196.
26. Kozomara A, Birgaoanu M, Griffiths-Jones S. miRBase: from microRNA sequences to function. Nucleic Acids Res (2019) 47:D155–62. doi: 10.1093/nar/gky1141
27. Martin M. Cutadapt removes adapter sequences from high-throughput sequencing reads. EMBnet J (2011) 17:10–2. doi: 10.14806/ej.17.1.200
28. Wingett SW, Andrews S. FastQ screen: A tool for multi-genome mapping and quality control. F1000Res (2018) 7:1338. doi: 10.12688/f1000research.15931.2
29. Loher P, Karathanasis N, Londin E, Bray P, Pliatsika V, Telonis AG, et al. IsoMiRmap-fast, deterministic, and exhaustive mining of isomiRs from short RNA-seq datasets. Bioinformatics (2021) 37:1828–38. doi: 10.1093/bioinformatics/btab016
30. Love MI, Huber W, Anders S. Moderated estimation of fold change and dispersion for RNA-seq data with DESeq2. Genome Biol (2014) 15:550. doi: 10.1186/s13059-014-0550-8
31. Licursi V, Conte F, Fiscon G, Paci P. MIENTURNET: an interactive web tool for microRNA-target enrichment and network-based analysis. BMC Bioinf (2019) 20:545. doi: 10.1186/s12859-019-3105-x
32. Sticht C, de la Torre C, Parveen A, Gretz N. miRWalk: An online resource for prediction of microRNA binding sites. PloS One (2018) 13:e0206239. doi: 10.1371/journal.pone.0206239
33. Kanehisa M, Sato Y, Kawashima M, Furumichi M, Tanabe M. KEGG as a reference resource for gene and protein annotation. Nucleic Acids Res (2016) 44:D457–62. doi: 10.1093/nar/gkv1070
34. Slenter DN, Kutmon M, Hanspers K, Riutta A, Windsor J, Nunes N, et al. WikiPathways: A multifaceted pathway database bridging metabolomics to other omics research. Nucleic Acids Res (2018) 46:661–7. doi: 10.1093/nar/gkx1064
35. Kibbe WA, Arze C, Felix V, Mitraka E, Bolton E, Fu G, et al. Disease ontology 2015 update: An expanded and updated database of human diseases for linking biomedical knowledge through disease data. Nucleic Acids Res (2015) 43:1071–8. doi: 10.1093/nar/gku1011
36. Shannon P, Markiel A, Ozier O, Baliga NS, Wang JT, Ramage D, et al. Cytoscape: a software environment for integrated models of biomolecular interaction networks. Genome Res (2003) 13:2498–504. doi: 10.1101/gr.1239303
37. Riccetti S, Sinigaglia A, Desole G, Nowotny N, Trevisan M, Barzon L. Modelling West Nile virus and Usutu virus pathogenicity in human neural stem cells. Viruses (2020) 12:882. doi: 10.3390/v12080882
38. Kok MGM, de Ronde MWJ, Moerland PD, Ruijter JM, Creemers EE, Pinto-Sietsma SJ. Small sample sizes in high-throughput miRNA screens: A common pitfall for the identification of miRNA biomarkers. Biomol Detect Quantif (2017) 15:1–5. doi: 10.1016/j.bdq.2017.11.002
39. Hart SN, Therneau TM, Zhang Y, Poland GA, Kocher JP. Calculating sample size estimates for RNA sequencing data. J Comput Biol (2013) 20:970–8. doi: 10.1089/cmb.2012.0283
40. Cloonan N, Wani S, Xu Q, Gu J, Lea K, Heater S, et al. MicroRNAs and their isomiRs function cooperatively to target common biological pathways. Genome Biol (2011) 12:R126. doi: 10.1186/gb-2011-12-12-r126
41. Giuliani A, Matacchione G, Ramini D, Di Rosa M, Bonfigli AR, Sabbatinelli J, et al. Circulating miR-320b and miR-483-5p levels are associated with COVID-19 in-hospital mortality. Mech Ageing Dev (2022) 202:111636. doi: 10.1016/j.mad.2022.111636
42. Hildebrandt A, Kirchner B, Meidert AS, Brandes F, Lindemann A, Doose G, et al. Detection of atherosclerosis by small RNA-sequencing analysis of extracellular vesicle enriched serum samples. Front Cell Dev Biol (2021) 9:729061. doi: 10.3389/fcell.2021.729061
43. Junqueira C, Crespo Â, Ranjbar S, de Lacerda LB, Lewandrowski M, Ingber J, et al. FcγR-mediated SARS-CoV-2 infection of monocytes activates inflammation. Nature (2022) 606:576–84. doi: 10.1038/s41586-022-04702-4
44. Abers MS, Delmonte OM, Ricotta EE, Fintzi J, Fink DL, de Jesus AAA, et al. An immune-based biomarker signature is associated with mortality in COVID-19 patients. JCI Insight (2021) 6:e144455. doi: 10.1172/jci.insight.144455
45. Youngs J, Provine NM, Lim N, Sharpe HR, Amini A, Chen YL, et al. Identification of immune correlates of fatal outcomes in critically ill COVID-19 patients. PloS Pathog (2021) 17:e1009804. doi: 10.1371/journal.ppat.1009804
46. Nishiga M, Wang DW, Han Y, Lewis DB, Wu JC. COVID-19 and cardiovascular disease: from basic mechanisms to clinical perspectives. Nat Rev Cardiol (2020) 17:543–58. doi: 10.1038/s41569-020-0413-9
47. Fajgenbaum DC, June CH. Cytokine storm. N Engl J Med (2020) 383:2255–73. doi: 10.1056/NEJMra2026131
48. Kim RY, Sunkara KP, Bracke KR, Jarnicki AG, Donovan C, Hsu AC, et al. A microRNA-21-mediated SATB1/S100A9/NF-κB axis promotes chronic obstructive pulmonary disease pathogenesis. Sci Transl Med (2021) 13:eaav7223. doi: 10.1126/scitranslmed.aav7223
49. Ramanujam D, Schön AP, Beck C, Vaccarello P, Felician G, Dueck A, et al. MicroRNA-21-dependent macrophage-to-fibroblast signaling determines the cardiac response to pressure overload. Circulation (2021) 143:1513–25. doi: 10.1161/CIRCULATIONAHA.120.050682
50. Polioudakis D, Bhinge AA, Killion PJ, Lee BK, Abell NS, Iyer VR. A myc-microRNA network promotes exit from quiescence by suppressing the interferon response and cell-cycle arrest genes. Nucleic Acids Res (2013) 41:2239–54. doi: 10.1093/nar/gks1452
51. Wan S, Ashraf U, Ye J, Duan X, Zohaib A, Wang W, et al. MicroRNA-22 negatively regulates poly(I:C)-triggered type I interferon and inflammatory cytokine production via targeting mitochondrial antiviral signaling protein (MAVS). Oncotarget (2016) 7:76667–83. doi: 10.18632/oncotarget.12395
52. Sun J, Mao S, Ji W. LncRNA H19 activates cell pyroptosis via the miR-22-3p/NLRP3 axis in pneumonia. Am J Transl Res (2021) 13:11384–98.
53. Galluzzo A, Gallo S, Pardini B, Birolo G, Fariselli P, Boretto P, et al. Identification of novel circulating microRNAs in advanced heart failure by next-generation sequencing. ESC Heart Fail (2021) 8:2907–19. doi: 10.1002/ehf2.13371
54. Pobezinsky LA, Etzensperger R, Jeurling S, Alag A, Kadakia T, McCaughtry TM, et al. Let-7 microRNAs target the lineage-specific transcription factor PLZF to regulate terminal NKT cell differentiation and effector function. Blood (2015) 16:517–25. doi: 10.1038/ni.3146
55. Severa M, Diotti RA, Etna MP, Rizzo F, Fiore S, Ricci D, et al. Differential plasmacytoid dendritic cell phenotype and type I interferon response in asymptomatic and severe COVID-19 infection. PloS Pathog (2021) 17:e1009878. doi: 10.1371/journal.ppat.1009878
56. Tang N, Li D, Wang X, Sun Z. Abnormal coagulation parameters are associated with poor prognosis in patients with novel coronavirus pneumonia. J Thromb Haemost (2020) 18:844–7. doi: 10.1111/jth.14768
57. Zhang J, Xu X, Wang M. Clinical significance of serum miR-101-3p expression in patients with neonatal sepsis. Per Med (2021) 18:541–50. doi: 10.2217/pme-2020-0182
58. Francuzik W, Pažur K, Dalke M, Dölle-Bierke S, Babina M, Worm M. Serological profiling reveals hsa-miR-451a as a possible biomarker of anaphylaxis. JCI Insight (2022) 7:e156669. doi: 10.1172/jci.insight.156669
59. Okamoto M, Fukushima Y, Kouwaki T, Daito T, Kohara M, Kida H, et al. MicroRNA-451a in extracellular, blood-resident vesicles attenuates macrophage and dendritic cell responses to influenza whole-virus vaccine. J Biol Chem (2018) 293:18585–600. doi: 10.1074/jbc.RA118.003862
60. Rodriguez A, Vigorito E, Clare S, Warren MV, Couttet P, Soond DR, et al. Requirement of bic/microRNA-155 for normal immune function. Science (2007) 316:608–11. doi: 10.1126/science.1139253
61. Elton TS, Selemon H, Elton SM, Parinandi NL. Regulation of the MIR155 host gene in physiological and pathological processes. Gene (2013) 532:1–12. doi: 10.1016/j.gene.2012.12.009
62. Wang P, Hou J, Lin L, Wang C, Liu X, Li D, et al. Inducible microRNA-155 feedback promotes type I IFN signaling in antiviral innate immunity by targeting suppressor of cytokine signaling 1. J Immunol (2010) 185:6226–33. doi: 10.4049/jimmunol.1000491
63. Kassif-Lerner R, Zloto K, Rubin N, Asraf K, Doolman R, Paret G, et al. MiR-155: A potential biomarker for predicting mortality in COVID-19 patients. J Pers Med (2022) 12:324. doi: 10.3390/jpm12020324
64. Ikeda S, Kong SW, Lu J, Bisping E, Zhang H, Allen PD, et al. Altered microRNA expression in human heart disease. Physiol Genomics (2007) 31:367–3731. doi: 10.1152/physiolgenomics.00144.2007
65. Grossi I, Salvi A, Baiocchi G, Portolani N, De Petro G. Functional role of microRNA-23b-3p in cancer biology. MicroRNA (2018) 7:156–66. doi: 10.2174/2211536607666180629155025
66. Chen DL, Sheng H, Zhang DS, Jin Y, Zhao BT, Chen N, et al. The circular RNA circDLG1 promotes gastric cancer progression and anti-PD-1 resistance through the regulation of CXCL12 by sponging miR-141-3p. Mol Cancer (2021) 20:166. doi: 10.1186/s12943-021-01475-8
67. Martínez-Fleta P, Vera-Tomé P, Jiménez-Fernández M, Requena S, Roy-Vallejo E, Sanz-García A, et al. A differential signature of circulating miRNAs and cytokines between COVID-19 and community-acquired pneumonia uncovers novel physiopathological mechanisms of COVID-19. Front Immunol (2022) 12:815651. doi: 10.3389/fimmu.2021.815651
68. Farr RJ, Rootes CL, Rowntree LC, Nguyen THO, Hensen L, Kedzierski L, et al. Altered microRNA expression in COVID-19 patients enables identification of SARS-CoV-2 infection. PloS Pathog (2021) 17:e1009759. doi: 10.1371/journal.ppat.1009759
69. Park JH, Choi Y, Lim CW, Park JM, Yu SH, Kim Y, et al. Potential therapeutic effect of microRNAs in extracellular vesicles from mesenchymal stem cells against SARS-CoV-2. Cells (2021) 10:2393. doi: 10.3390/cells10092393
70. Zhao C, Sun X, Li L. Biogenesis and function of extracellular miRNAs. ExRNA (2019) 1:1–9. doi: 10.1186/S41544-019-0039-4
71. Trevisan M, Riccetti S, Sinigaglia A, Barzon L. SARS-CoV-2 infection and disease modelling using stem cell technology and organoids. Int J Mol Sci (2021) 22(5):2356. doi: 10.3390/ijms22052356
72. Benedetti F, Silvestri G, Mavian C, Weichseldorfer M, Munawwar A, Cash MN, et al. Comparison of SARS-CoV-2 receptors expression in primary endothelial cells and retinoic acid-differentiated human neuronal cells. Viruses (2021) 13:2193. doi: 10.3390/v13112193
73. Lei Y, Zhang J, Schiavon CR, He M, Chen L, Shen H, et al. SARS-CoV-2 spike protein impairs endothelial function via downregulation of ACE 2. Circ Res (2021) 128:1323–6. doi: 10.1161/CIRCRESAHA.121.318902
74. Nuovo GJ, Magro C, Shaffer T, Awad H, Suster D, Mikhail S, et al. Endothelial cell damage is the central part of COVID-19 and a mouse model induced by injection of the S1 subunit of the spike protein. Ann Diagn Pathol (2021) 51:151682. doi: 10.1016/j.anndiagpath.2020.151682
75. Wyler E, Mösbauer K, Franke V, Diag A, Gottula LT, Arsiè R, et al. Transcriptomic profiling of SARS-CoV-2 infected human cell lines identifies HSP90 as target for COVID-19 therapy. iScience (2021) 24:102151. doi: 10.1016/j.isci.2021.102151
76. Forster SC, Tate MD, Hertzog PJ. MicroRNA as type I interferon-regulated transcripts and modulators of the innate immune response. Front Immunol (2015) 6:334. doi: 10.3389/fimmu.2015.00334
77. Jiao Y, Li W, Wang W, Tong X, Xia R, Fan J, et al. Platelet-derived exosomes promote neutrophil extracellular trap formation during septic shock. Crit Care (2020) 24:380. doi: 10.1186/s13054-020-03082-3
78. Zhou J, Lin J, Zhao Y, Sun X. Deregulated expression of miR-483-3p serves as diagnostic biomarker in severe pneumonia children with respiratory failure and its predictive value for the clinical outcome of patients. Mol Biotechnol (2022) 64:311–9. doi: 10.1007/s12033-021-00415-7
Keywords: COVID-19, microRNA, biomarkers, innate immunity, inflammation, interferon, SARS-CoV-2, RNA-sequencing
Citation: Giannella A, Riccetti S, Sinigaglia A, Piubelli C, Razzaboni E, Di Battista P, Agostini M, Dal Molin E, Manganelli R, Gobbi F, Ceolotto G and Barzon L (2022) Circulating microRNA signatures associated with disease severity and outcome in COVID-19 patients. Front. Immunol. 13:968991. doi: 10.3389/fimmu.2022.968991
Received: 14 June 2022; Accepted: 20 July 2022;
Published: 11 August 2022.
Edited by:
Nitin Saksena, Victoria University, AustraliaReviewed by:
Vitale Miceli, Mediterranean Institute for Transplantation and Highly Specialized Therapies (ISMETT), ItalySamuel Brennan, Genieus Genomics, Australia
Copyright © 2022 Giannella, Riccetti, Sinigaglia, Piubelli, Razzaboni, Di Battista, Agostini, Dal Molin, Manganelli, Gobbi, Ceolotto and Barzon. This is an open-access article distributed under the terms of the Creative Commons Attribution License (CC BY). The use, distribution or reproduction in other forums is permitted, provided the original author(s) and the copyright owner(s) are credited and that the original publication in this journal is cited, in accordance with accepted academic practice. No use, distribution or reproduction is permitted which does not comply with these terms.
*Correspondence: Luisa Barzon, bHVpc2EuYmFyem9uQHVuaXBkLml0
†These authors have contributed equally to this work and share first authorship
‡These authors share last authorship