 Caiyun Guo1
 Youling Fan2,3
 Jiurong Cheng1Yingdong Deng1Xiangsheng Zhang1
 Yanna Chen1Huan Jing1Wenjun Li1
 Pei Liu1Jiaqi Xie1Wenjun Ning1
 Hongtao Chen4
 Jun Zhou1*
- 1Department of Anesthesiology, The Third Affiliated Hospital, Southern Medical University, Guangzhou, China
- 2Department of Anesthesiology, The First People's Hospital of Kashgar, Xinjiang, China
- 3Department of Anesthesiology, The Second People’s Hospital of Panyu, Guangzhou, China
- 4Department of Anesthesiology, Guangzhou Eighth People’s Hospital, Guangzhou Medical University, Guangzhou, Guangdong, China
Background: Sepsis is organ dysfunction due to the host’s deleterious response to infection, and the kidneys are one of the organs damaged in common sepsis. Sepsis-associated acute kidney injury (SA-AKI) increases the mortality in patients with sepsis. Although a substantial volume of research has improved the prevention and treatment of the disease, SA-SKI is still a significant clinical concern.
Purpose: Aimed to use weighted gene co-expression network analysis (WGCNA) and immunoinfiltration analysis to study SA-AKI-related diagnostic markers and potential therapeutic targets.
Methods: Immunoinfiltration analysis was performed on SA-AKI expression datasets from the Gene Expression Synthesis (GEO) database. A weighted gene co-expression network analysis (WGCNA) analysis was performed on immune invasion scores as trait data, and modules associated with immune cells of interest were identified as hub modules. Screening hub geneset in the hub module using protein-protein interaction (PPI) network analysis. The hub gene was identified as a target by intersecting with significantly different genes screened by differential expression analysis and validated using two external datasets. Finally, the correlation between the target gene, SA-AKI, and immune cells was verified experimentally.
Results: Green modules associated with monocytes were identified using WGCNA and immune infiltration analysis. Differential expression analysis and PPI network analysis identified two hub genes (AFM and GSTA1). Further validation using additional AKI datasets GSE30718 and GSE44925 showed that AFM was significantly downregulated in AKI samples and correlated with the development of AKI. The correlation analysis of hub genes and immune cells showed that AFM was significantly associated with monocyte infiltration and hence, selected as a critical gene. In addition, Gene single-enrichment analysis (GSEA) and PPI analyses results showed that AFM was significantly related to the occurrence and development of SA-AKI.
Conclusions: AFM is inversely correlated with the recruitment of monocytes and the release of various inflammatory factors in the kidneys of AKI. AFM can be a potential biomarker and therapeutic target for monocyte infiltration in sepsis-related AKI.
Introduction
Sepsis is an organ dysfunction caused by a dysregulated infection response in a patient (1). The kidney is one of the organs most commonly affected by sepsis, and kidney damage can lead to multiple organ dysfunction through long-term effects (2). In intensive care patients, SA-AKI is a common complication that increases the risk of chronic kidney disease and mortality is extremely high (3). Therefore, understanding the occurrence and development mechanism of SA-AKI is significant for the treatment of sepsis patients and for preventing long-term complications.
It has been suggested that SA-AKI develops and occurs because of a variety of complex mechanisms, inflammatory immune dysregulation plays a crucial role in the occurrence and development of SA-AKI, among other factors (4). AKI often presents a hyperinflammatory state accompanied by elevated systemic cytokine levels, such as IL-6 and TNF-α (5). The damaged kidney in SA-AKI, is a major source of inflammatory chemokines, cytokines, and reactive oxygen species, closely related to the damage of various organs in the system during the progression of sepsis (6). In the early stages of AKI, high levels of these inflammatory factors lead to pro-inflammatory, neutrophil activation, and endothelial dysfunction (7). Previous studies have shown that among immune cells involved in kidney inflammation, neutrophils (recruited during the acute phase), Ly-6C+ (inflammation) monocytes, and resident macrophage populations initiate inflammatory processes that affect acute inflammation or profibrotic changes (8). However, a persistently high inflammatory state inhibits immune system function and clearance of infection, and studies suggest that AKI may attenuate the pro-inflammatory effects of neutrophils and lead to impaired monocyte function (9). In contrast, neutrophil function suppression is more intense in patients with SA-AKI. Therefore, the inflammatory immune response is a crucial entry point for treating SA-AKI. A recent study using single-cell sequencing technology identified inflammatory macrophage subsets as therapeutic targets for alleviating AKI (10). The relationship between SA-AKI and the inflammatory immune response is complex, so we aimed to screen for therapeutic targets by studying the infiltration of immune cells in the SA-AKI-induced kidney damage and provide novel ideas for diagnosing and treating the disease.
Materials and methods
RNA expression data
The research strategy of the study is illustrated in Figure 1.
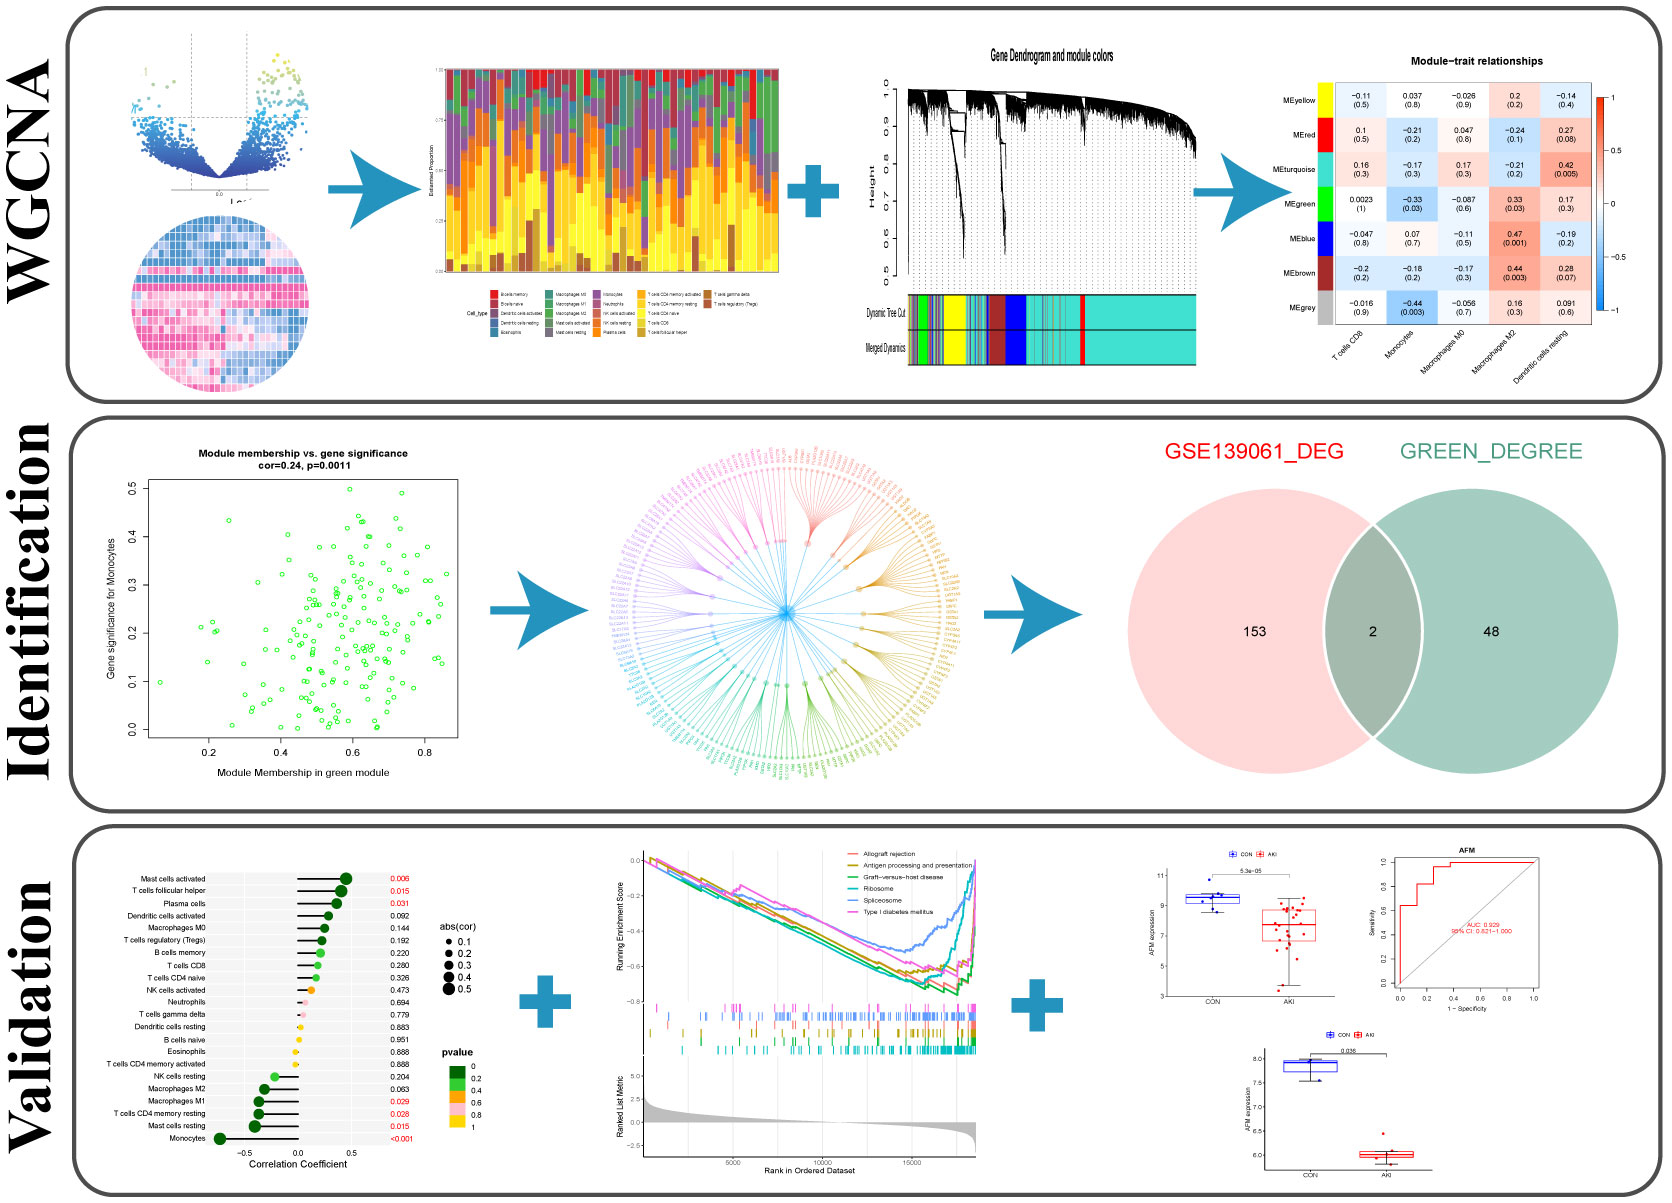
Figure 1 The workflow of the study.
Three gene expression datasets (GSE139061, GSE30718, and GSE44925) were downloaded from Gene Expression Omnibus (GEO; https://www.ncbi.nlm.nih.gov/geo/).
The GSE139061 dataset includes 39 AKI kidney biopsy samples and 9 nephrectomy samples. The AKI kidney biopsy samples were obtained from patients with confirmed sepsis and pathological diagnosis consistent with AKI. Samples from nephrectomy surgeries were obtained from the University of Michigan’s Renal Precision Medicine Program, and Illumina HiSeq 4000 was used for sequencing (11). GSE308718 dataset includes 28 renal biopsy samples from 26 post-transplant AKI patients with an average estimated glomerular filtration rate (eGFR) of 26 mL/min at biopsy and 11 original protocol biopsy samples from stable transplants without histological abnormalities (12). The mean estimated glomerular filtration rate (eGFR) at biopsy was 51.2 mL/min. This dataset was generated using the GPL570 [HG-U133_Plus_2] Affymetrix Human Genome U133 Plus 2.0 Array (Affymetrix, Santa Clara, CA, USA). The GSE44925 dataset was derived from Affymetrix’s Mouse Gene 1.0 ST Array [transcript (gene) version] platform based on GPL6246. Finally, five AKI samples (GSM1093979, GSM1093980, GSM1093981, GSM1093982, and GSM1093983) and three normal samples (GSM1093973, GSM1093974, and GSM1093975) were selected from GSE44925 (13).
Gene co-expression network analysis of AKI
The R package of weighted gene co-expression network analysis (WGCNA) was used to construct the weighted co-expression network (14). As a result of these calculations, we were able to cluster the samples and eliminate the outliers based on the average linkage and Pearson’s correlation coefficients. Next, an adjacency matrix was built, and a soft threshold β was selected to construct a scale-free network. In addition, a topological overlap matrix (TOM) was derived from the adjacency matrix. Finally, a hierarchical clustering tree was constructed using the dynamic clipping tree algorithm and the network modules were identified.
Evaluation of immune cell infiltration
CIBERSORT is an analytical algorithm that uses gene expression data to estimate the abundance of each cell type in mixed cell populations (15). The infiltration fraction of the leukocyte signature matrix (LM22) was calculated using the R package “CIBERSORT” in this study, and the result was shown as a heatmap. In addition, the results between groups (CON-AKI) were compared, immune cell types with significant differences between groups were screened (P<0.05), and the fraction of immune cells in each sample was used as the trait data for WGCNA.
Identification of hub modules and genes
Among the six modules obtained by WGCNA, those with a high correlation with the immune cells of interest were screened as hub modules by correlation coefficient and significance P value. Then, the protein-protein interactions (PPIs) of hub module genes were analyzed using STRING database (STRING; https://string-db.org/) (16). The PPI network determined the number of protein nodes applied to the central node. Subsequently, these results were combined using Cytoscape (Cytoscape_v3.9.0; https://cytoscape.org/) (17). Differential expression analysis was performed on dataset GSE139061, screened for Adjusted P value (P.adj) <0.05 and |log(Fold Change)| (|logFC|)>1. The 30 genes with the most significant differential multiples in the up-regulated and down-regulated genes among the differential genes were selected to display on the heat map. The differentially expressed genes were intersected with the central node genes to obtain the hub genes.
Validation of hub genes
Datasets GSE30718 and GSE44925 were downloaded from the GEO database to determine the differential expression of hub genes in AKI kidney and healthy kidney tissue from human and mouse species. Reliability of receiver operating characteristic (ROC) curve test for diagnosing AKI central genes using the R package “pROC” (18).
Identification of immune characterization
Using the R package “ggstatsplot” (19), the correlation of hub genes with relevant immune cells was analyzed by scatter plots of hub gene expression and immune cell infiltration levels. P<0.05 indicated statistical significance.
Gene single-enrichment analysis of target genes
GSEA is a computational method to determine whether a fundamentally defined set of genes is statistically significantly different between two biological states (20). According to the median of the target gene expression, the samples were divided into two groups, and the results of GSEA were statistically significant when P.adj<0.05 and q<0.05. Finally, the enrichment pathways were visualized using the R packages “ggplot2” (21) and “clusterProfiler” (22).
Cell culture
Human monocytic leukemia cell line (THP-1) was purchased from the Procell Life Science&Technology Co.,Ltd (Wuhan, China) and cultured in THP-1 special medium [CM-0233, Procell Life Science&Technology Co.,Ltd (Wuhan, China)] at 37°C in a 5% CO2 incubator. In all experiments, the cells were cultured in 6-well plates, treated with 1 μg/mL LPS [lipopolysaccharide, Sigma-Aldrich (Shanghai) Trading Co.,Ltd. (Shanghai, China)] for 24 h, and harvested; then, total RNA was extracted.
Animals and treatments
Male wild-type C57BL/6J mice (8–10-weeks-old) were purchased from SiPeiFu Biotechnology Co., Ltd (Beijing, China), housed under standard conditions (12 h light/dark cycle) at constant temperature (22 ± 2°C) and humidity (60%), with given free access to food and water.
After 2 weeks, 12 mice were divided into two groups randomly (n=6): control and LPS. Mice in the LPS group were injected LPS (10 mg/kg) intraperitoneally, while in the control group, mice received an equal volume of saline. The blood and kidney tissues of mice were collected 12 h after LPS treatment.
In the unilateral ischemia-reperfusion (UIRI) model, after a midline abdominal incision, the left renal pedicle was dissected and clamped using microvascular clamps for 45 min at 37 °C. After ischemia, the clamps were released for reperfusion. On day 2 post-UIRI, mice were killed, and the blood and kidneys were collected. The untreated right kidney served as a control group. In addition, the blood of healthy wild-type mice was taken as a control for detecting serum creatinine urea nitrogen in UIRI-induced AKI mice.
The animal experiments were approved by the Animal Protection Committee of the Third Affiliated Hospital of Southern Medical University and conformed to the ethical standards of the Animal Ethics Committee of the Third Affiliated Hospital of Southern Medical University (Guangdong, China).
Assessment of renal function
Mouse whole blood was coagulated at room temperature for 2 h, and serum was collected from the supernatant obtained by centrifugation at 2000 g for 20 min. Blood urea nitrogen (BUN) and serum creatinine (SCr) were determined using a urea detection kit and a Cr detection kit (C013-2-1 and C011-2-1, Nanjing Jiancheng Bioengineering Institute, Nanjing, China).
Kidney injury assessment
Kidney coronal sections were subjected to imaging analysis. The specimens were fixed in 4% paraformaldehyde for at least 24 h before paraffin embedding. Then, hematoxylin-eosin (HE) staining was then performed on the paraffin block in 4-μm sections (23). There were five signs of tubular injury: dilated tubules, atrophy of tubules, formation of tubular casts, shedding of tubular epithelial cells, disappearance of brush borders, and the thickening of the tubular basement membrane. The tubular injury score was calculated semiquantitatively as follows: score 0: no tubular injury; score 1: <10% tubular injury; score 2: 10–24% tubular injury; score 3: 25–49% tubular injury; score 4: 50–74% tubular damage; score 5: damaged tubules ≥75%. Each specimen was randomly examined under 200× magnification in ten fields (24).
RNA extraction and quantitative real time polymerase chain reaction
Total RNA was extracted from whole kidney tissue and monocytes using TRIzol (R0016; Beyotime, Shanghai, China). On a NanoVue (GE Healthcare, USA), absorbance at 260 nm (A260) and 280 nm (A280) were calculated to determine concentration and quality of the extracted RNA. Using a HiScript II Q RT SuperMix for qPCR kit (R222-01, Vazyme Biotech Co., Ltd. China), RNAs whose A260/A280 ratios are 1.8 to 2.0 are suitable for subsequent complementary DNA (cDNA) synthesis. The PCR amplification was performed using the ChamQ Universal SYBR qPCR Master Mix kit (Q711-02, Vazyme Biotech). Each gene was amplified for 40 cycles. We tested all samples three times, and analyzed their melting curves. The target gene mRNA expressions were normalized to that of GAPDH using the 2-ΔΔCt method. The PCR primers were synthesized by Tsingke Biotechnology Co., Ltd, and the sequences are listed in Table 1.
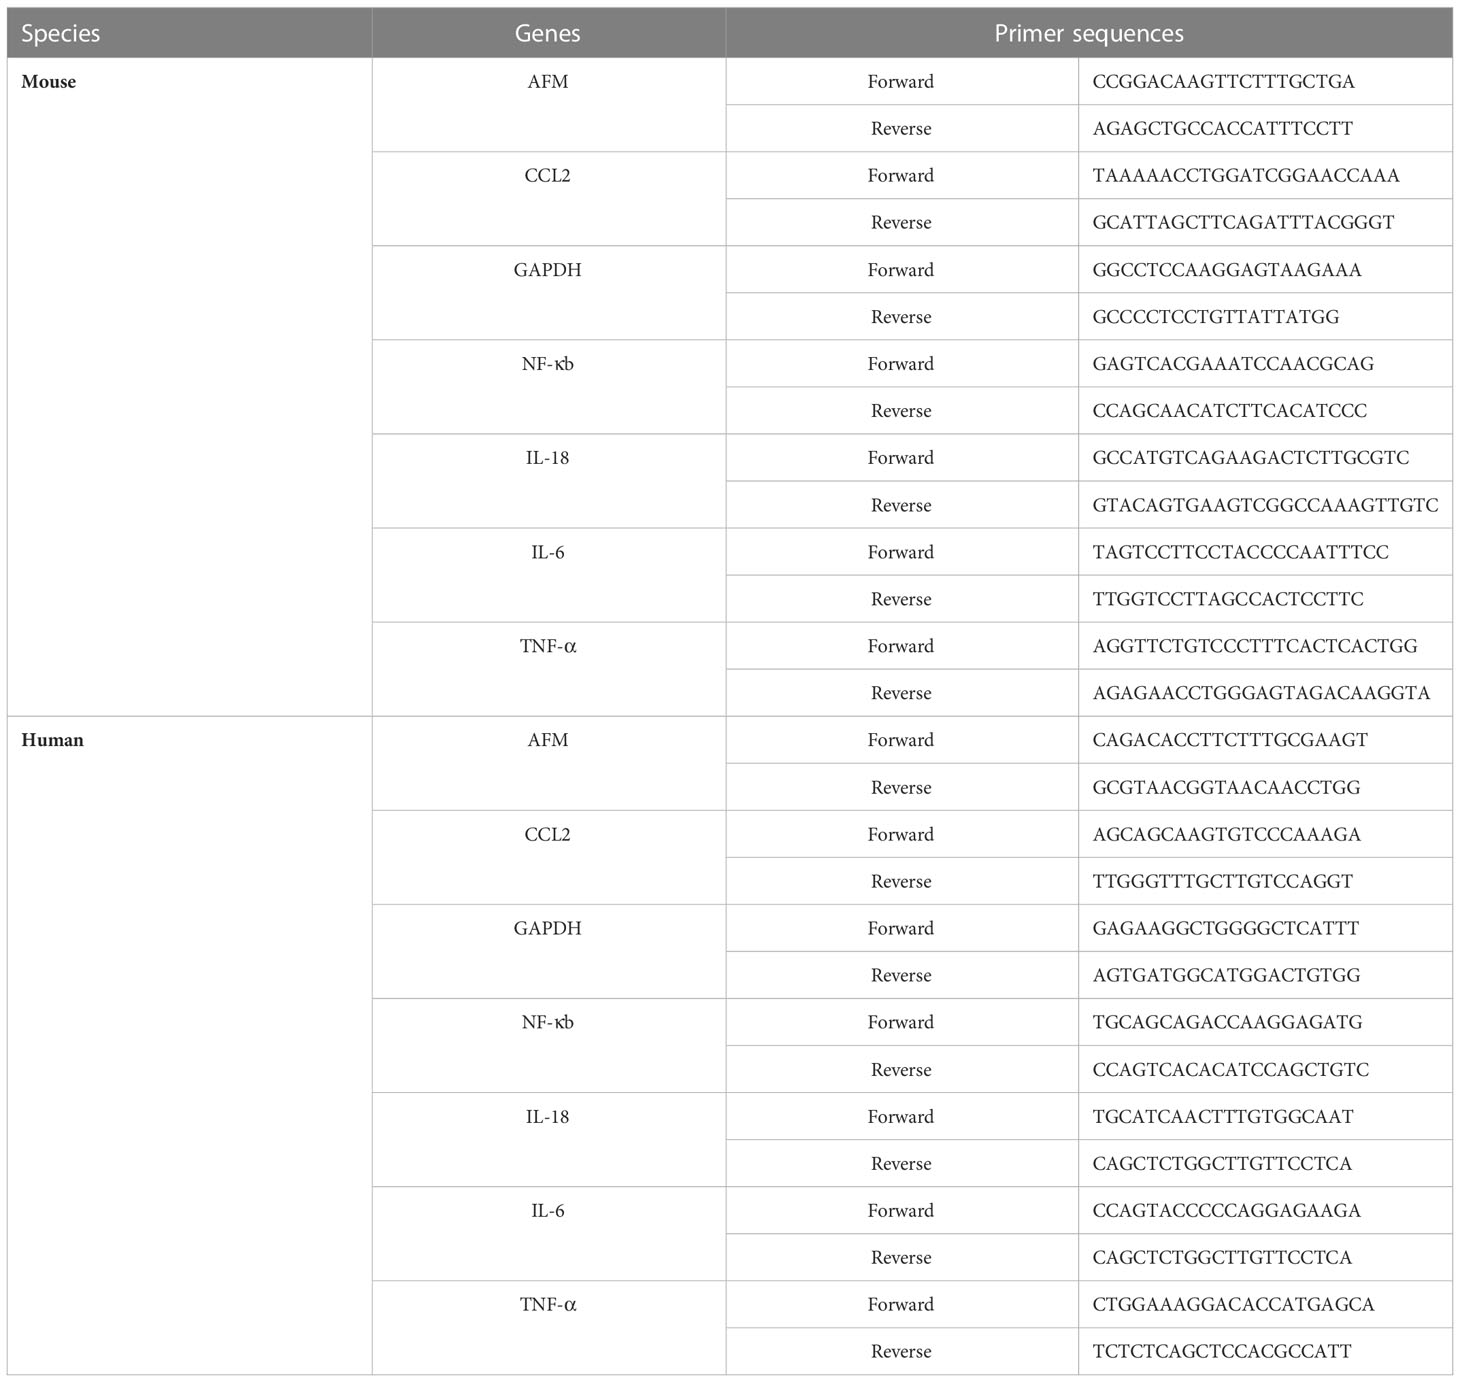
Table 1 Primers for real time-quantitative PCR.
Western blot analysis
Mouse kidney tissues and monocyte were dissected and homogenized in radio immune precipitation (RIPA Lysis buffer) lysis buffer (P0013B, Beyotime Biotechnology, China) containing protease inhibitors (FD1001, FUDE Biological Co., Ltd., Hangzhou, China). After centrifugation at 4°C at 12000 rpm for 15 min, the supernatant was collected, and the protein concentration was determined using the BCA Protein Detection Kit (23225, Thermo-Scientific). Bovine serum albumin is the standard. An equal amount of protein lysate is loaded directly on 10 SDS-PAGE and transferred to a polyvinylidene fluoride (PVDF) membrane for western blotting (0.2 μm) (ISEQ00010, MilliporeSigma). Plug the membrane with 5% skim dry milk in Tris-buffered saline and 0.1% Tween-20 (TBS-T) for 1 h at room temperature, followed by overnight incubation with the designated primary antibody at 4°C. After rinsing three times every 5 min with TBS-T, dilute with goat anti-rabbit IgG (1:5000; Signalway Antibody LLC) incubate for 1 h.
Western blotting was visualized using FDbio-Dura Ecl luminescent solution (FD8020, FUDE Biological Co., Ltd., Hangzhou, China) and was visualized under the Tanon-5200 Chemiluminescent Imaging System (Tanon Science and Technology, Beijing, China). Density analysis using ImageJ6.0 software (National Institutes of Health, Bethesda, MD, USA).
Enzyme-linked immunosorbent assay
IL-6, IL-18, and TNF-α levels in kidney tissues were measured using the IL-6 mouse ELISA kit (MM-1011M2, Jiangsu, China), IL-18 mouse ELISA kit (MM-0906M2, Jiangsu, China), and TNF-α mouse ELISA kit (MM-0132M2, Jiangsu, China), respectively.
Statistical analysis
Statistical analysis was performed using GraphPad Prism (GraphPad Prism 9; GraphPad Software, Inc.). The data conformed to a normal distribution. Unpaired Student’s t-test was used to analyze the differences between the two groups. P<0.05 indicated a statistically significant difference.
Results
Construction of gene co-expression network
A co-expression network of 5000 gene expression values for 46 samples was constructed using the R software package “WGCNA” (14). Consequent to clustering, two outlier samples were removed (Supplementary Figure 1). In this study, we selected the soft threshold β=6 (scale-free R2 = 0.85) to construct a scale-free network and used the dynamic clipping tree algorithm for clustering to construct a hierarchical clustering tree (Figures 2A, B). Each leaf of the tree represents a gene. Then, the genes of the expression data were combined to form the branches of the tree, representing a gene module; a total of six modules were identified for subsequent analysis (Figure 2C).
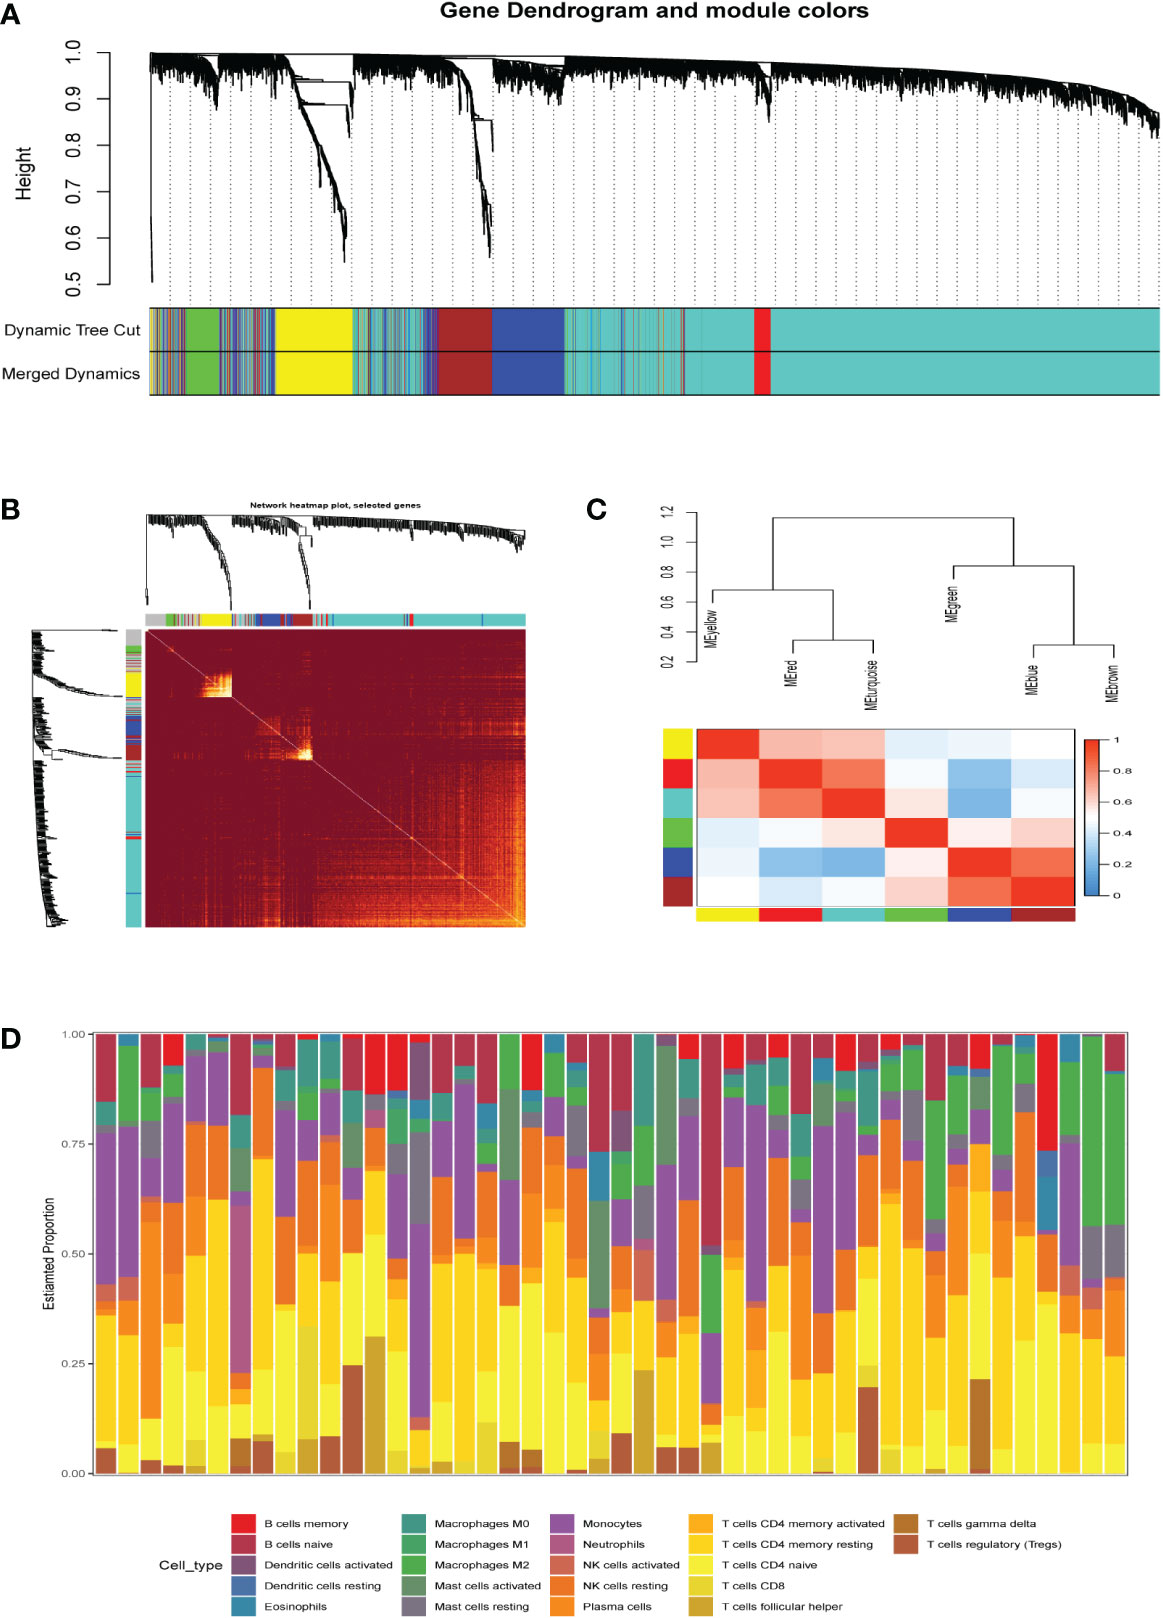
Figure 2 (A) Clustering dendrogram of genes, with dissimilarity based on topological overlap, together with assigned merged module colors and the originalmodule colors. (B) The heat map depicts the topological overlap matrix (TOM) of all genes in the analysis. Gene dendrograms and module assignmentsare also shown on the left and top. (C) Genes are classified into different modules by hierarchical clustering, different colors below the hierarchicalclustering tree represent different modules. (D) Correlation heatmap of infiltration of immune cells in normal and AKI renal tissues.
Identification of hub modules and genes
The R package “CIBERSORT” was used to calculate the infiltration scores of various immune cells in the gene expression matrix (25). The immune cell infiltration was visualized with a heatmap (Figure 2D). The differences in immune cell infiltration scores between the AKI and normal kidney groups were compared. T cells CD8, monocytes, macrophages M0 and M2, and dendritic cells resting were selected according to P<0.05 (Figure 3A). The five types kinds of immune cells and their infiltration scores in each sample were used as trait data for weighted correlation network analysis. The correlation between the module signature genes and the infiltration of five types of immune cells was displayed on a heat map (Figure 3B). The green modules correlated with both monocytes (R2=-0.33, P=0.03) and M2 macrophages (R2 = 0.33, P=0.03), while the blue (R2 = 0.47, P=0.001) and brown modules (R2 = 0.41, P=0.003) were associated with M2 macrophages. The turquoise-colored module was associated with dendritic cells resting (R2 = 0.42, P=0.005). Herein, we selected the green module as the hub. A scatter plot of the distribution of genes in the hub module is shown in Figure 3C. The hub module genes were analyzed using the STRING database for PPI analysis and were sorted according to the number of nodes. The top 50 genes with the number of nodes were screened as the central node (Figure 3D). These 50 genes intersected with the differential genes of the dataset, and two hub genes, AFM and GSTA1 were obtained.
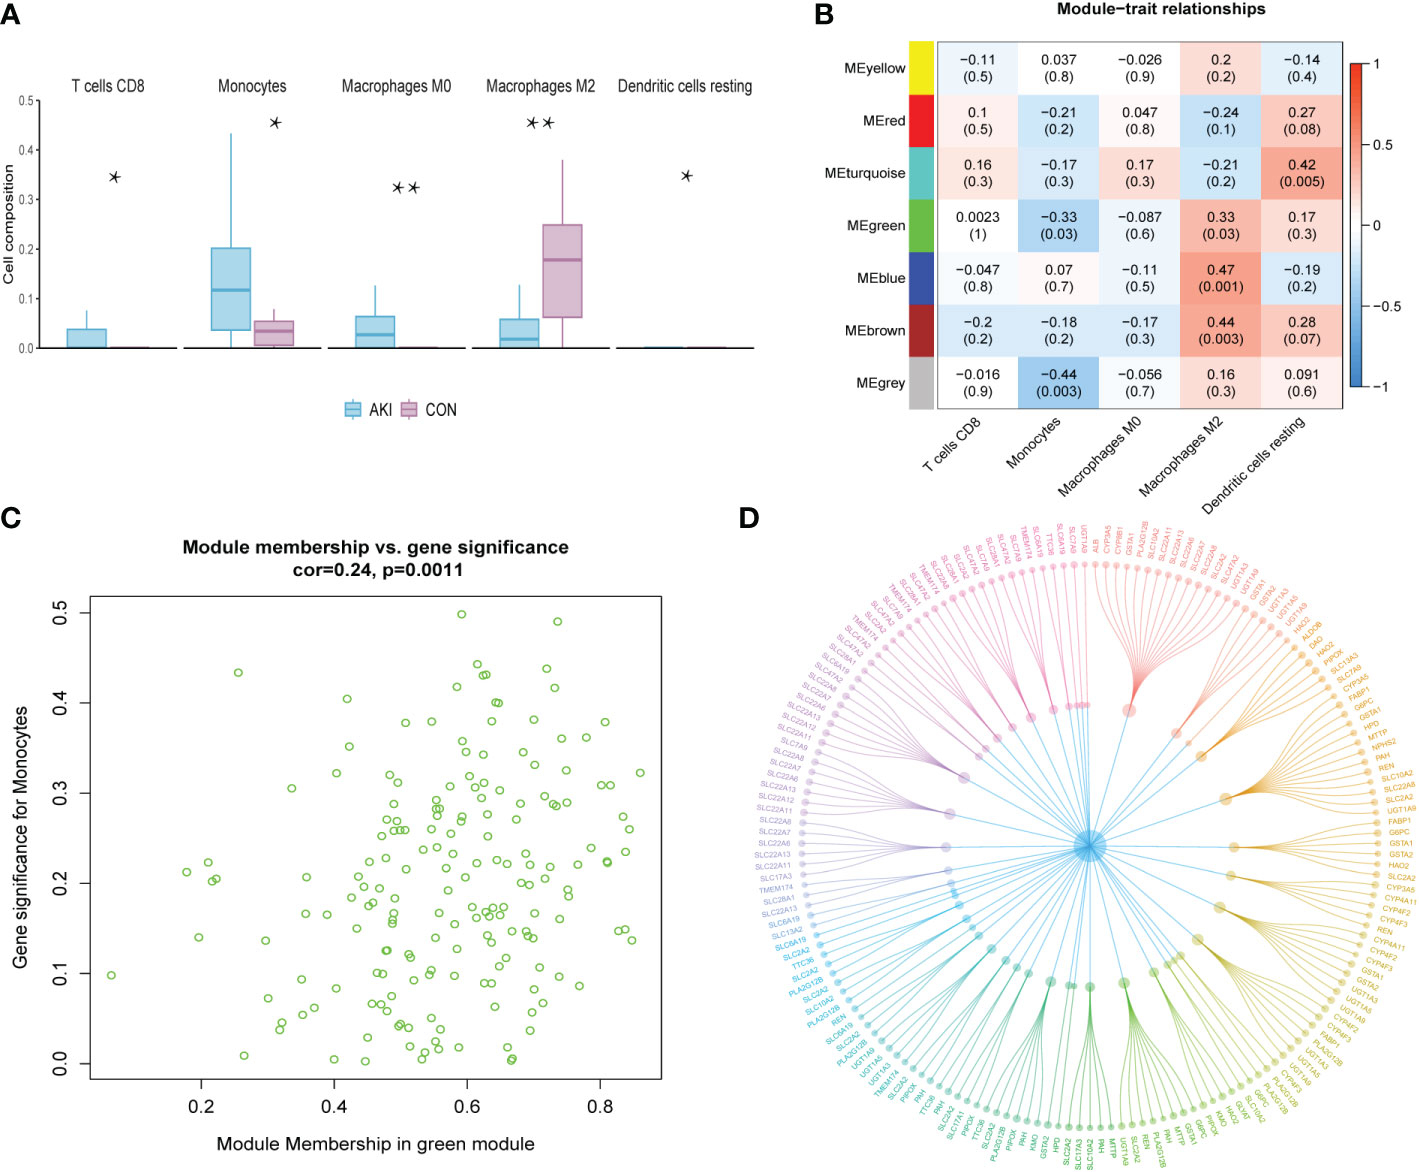
Figure 3 (A) The grouped box plot shows immune cells with significantly different immune infiltration scores between the control and experimental groups.(B) Heatmap shows the correlation between module eigengenes and immune cells. (C) Scatter plot of green module eigengenes. (D) PPI network ofgreen module genes. *p < 0.05, **p < 0.01.
Screening of differentially expressed genes
The R package “limma” was used to screen the DEGs of AKI and normal kidney samples in GSE139061 (26). According to P.adj<0.05, |logFC|>1, a total of 155 DEGs were screened, of which 142 were upregulated and 13 were downregulated. The volcano plots were visualized in Figure 4A. The 50 most significant DEGs among the upregulated and downregulated genes were displayed on a heat map (Figure 4C).
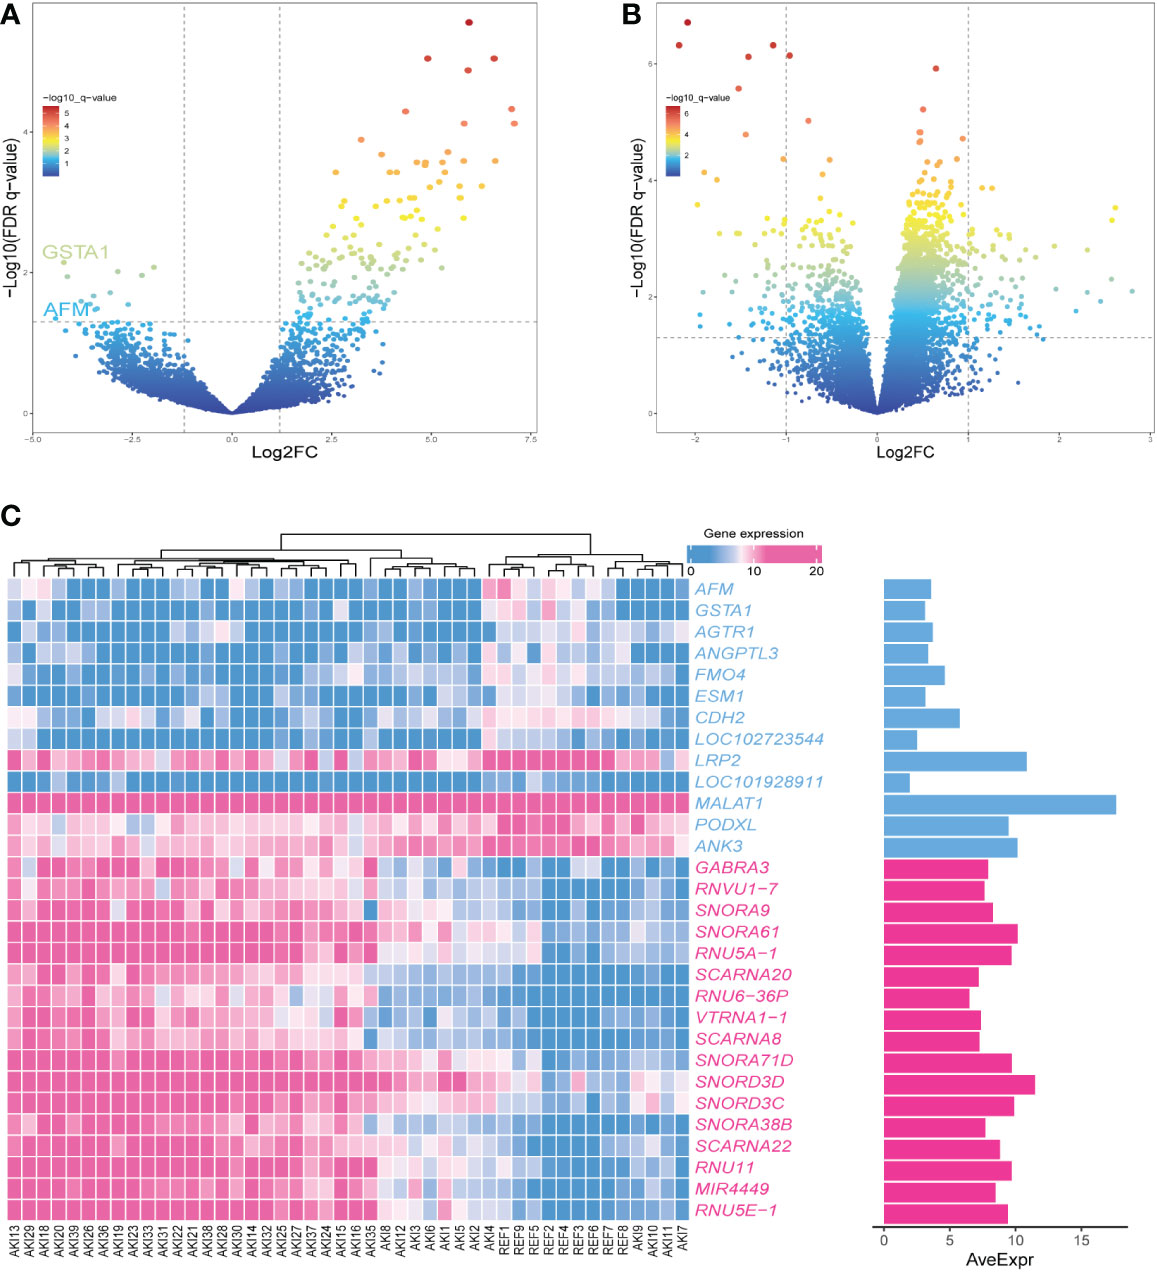
Figure 4 (A) The volcano plot showing the differential gene expression (fold change ≥ 1; FDR < 0.05) between control and AKI group in GSEGSE139061 dataset.(B) The volcano plot showing the differential gene expression (fold change ≥ 1; FDR < 0.05) between control and AKI group in GSE30718 dataset.(C) Heatmap shows the most significant 30 genes in up- and down-regulation.
Validation of hub genes
The datasets GSE30718 and GSE44925 were downloaded from the GEO database. The volcano plot shows the differential expression of datasets GSE30718 and GSE44925 (Figures 4B, 5C). The expression of two hub genes was downregulated in the AKI group of the dataset GSE30718 (AFM: P=5.3e-0.5, GSTA1: P=0.0007) (Figure 5A). The ROC curve analysis of the diagnostic value of the two genes for AKI found that the area under the curve (AUC) of the two genes was as follows: AFM: 0.929; GSTA1: 0.875. The AUC of AFM was larger than that of GSTA1, suggesting that it had a better diagnostic value (Figure 5B). Moreover, AFM was significantly underexpressed in the AKI group in dataset GSE44925 (Figure 5D). Next, we searched the diseases associated with AFM and GSTA1 in The Comparative Toxicogenomics Database (CTD) and found that both genes were associated with AKI (AFM: 67.18; GSTA1: 264.77). We present this result in Table 2. In conclusion, we selected AFM as the target gene for our study.
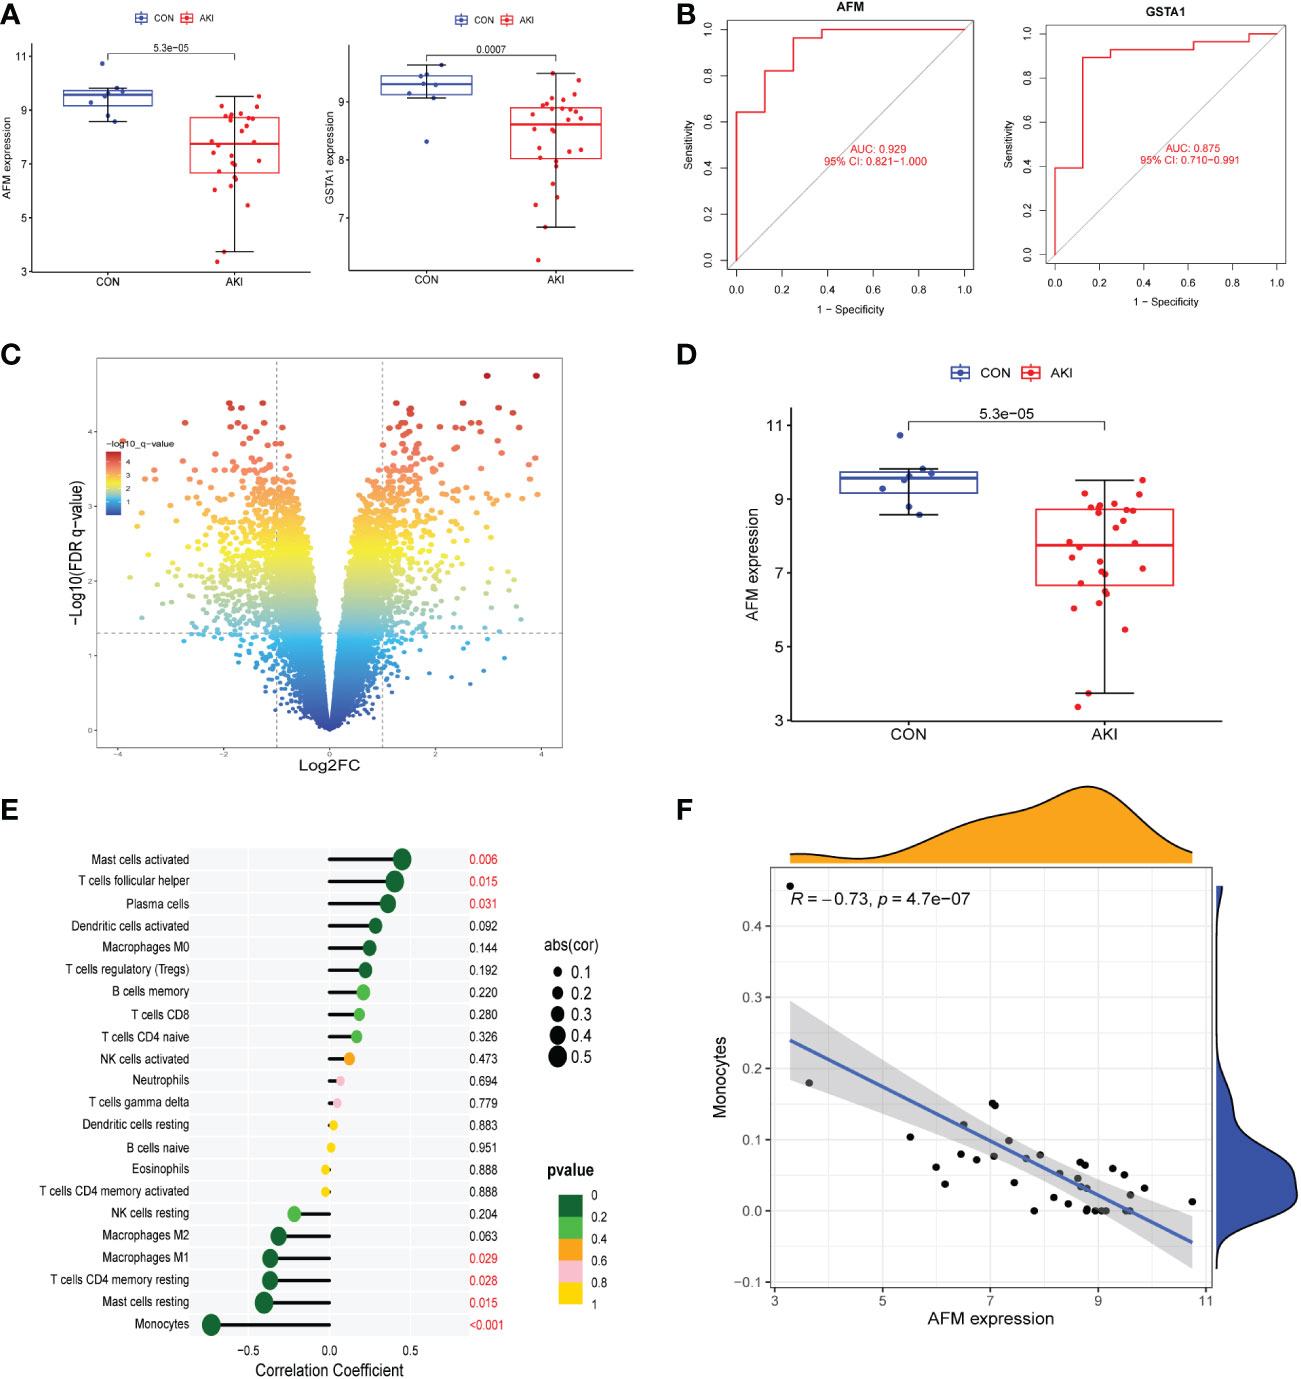
Figure 5 (A) The expression of AFM and GSTA1 were high in the AKI group in the GSE30718 dataset. (B) ROC curves for AFM, GSTA1. (95% confidence interval (CI), AFM: 0.817-1.000; GSTA1: 0.714-0.996.) (C) The volcano plot showing the differential gene expression (fold change ≥ 1; FDR < 0.05) between control and AKI group in GSE44925 dataset. (D) The expression of AFM and GSTA1 were high in the AKI group in the GSE44925 dataset. (E) The relationship between AFM expression and immune cell infiltration level; P < 0.05 was considered statistically significant. (F) Scatter plot of AFM expression versus level of monocyte infiltration.
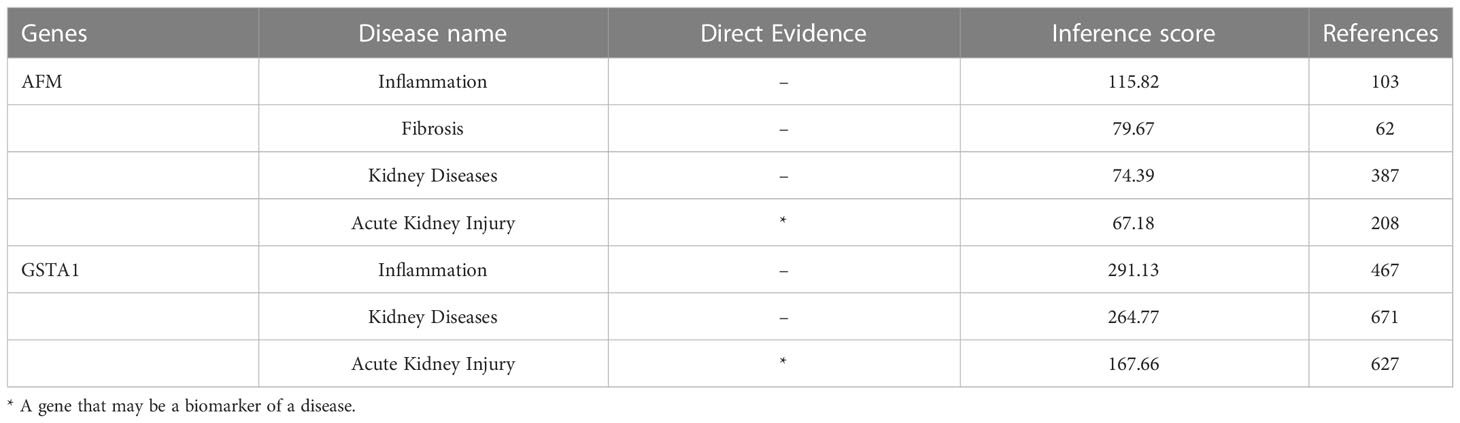
Table 2 Relationship to inflammation and kidney disease to key genes based on the CTD database.
GSEA of the target gene
The samples in the dataset GSE139061 were divided into the high- group and low-expression groups according to the median expression of AFM. The pathway enrichment analysis identified 118 significantly enriched pathways (P.adj<0.05, q<0.05). The six enriched pathways with the highest NES in the low-expression group included the immune-related pathways (graft-versus-host disease, allograft rejection, type I diabetes, and antigen processing and presentation), while the high-expression group was not enriched for the immune-related pathways (Figure 6A). The specific information of the six enrichment pathways with the highest NES in the high and low expression groups is shown in Table 3. The enrichment pathways were visualized using the R packages “ggplot2” and “clusterProfiler.”
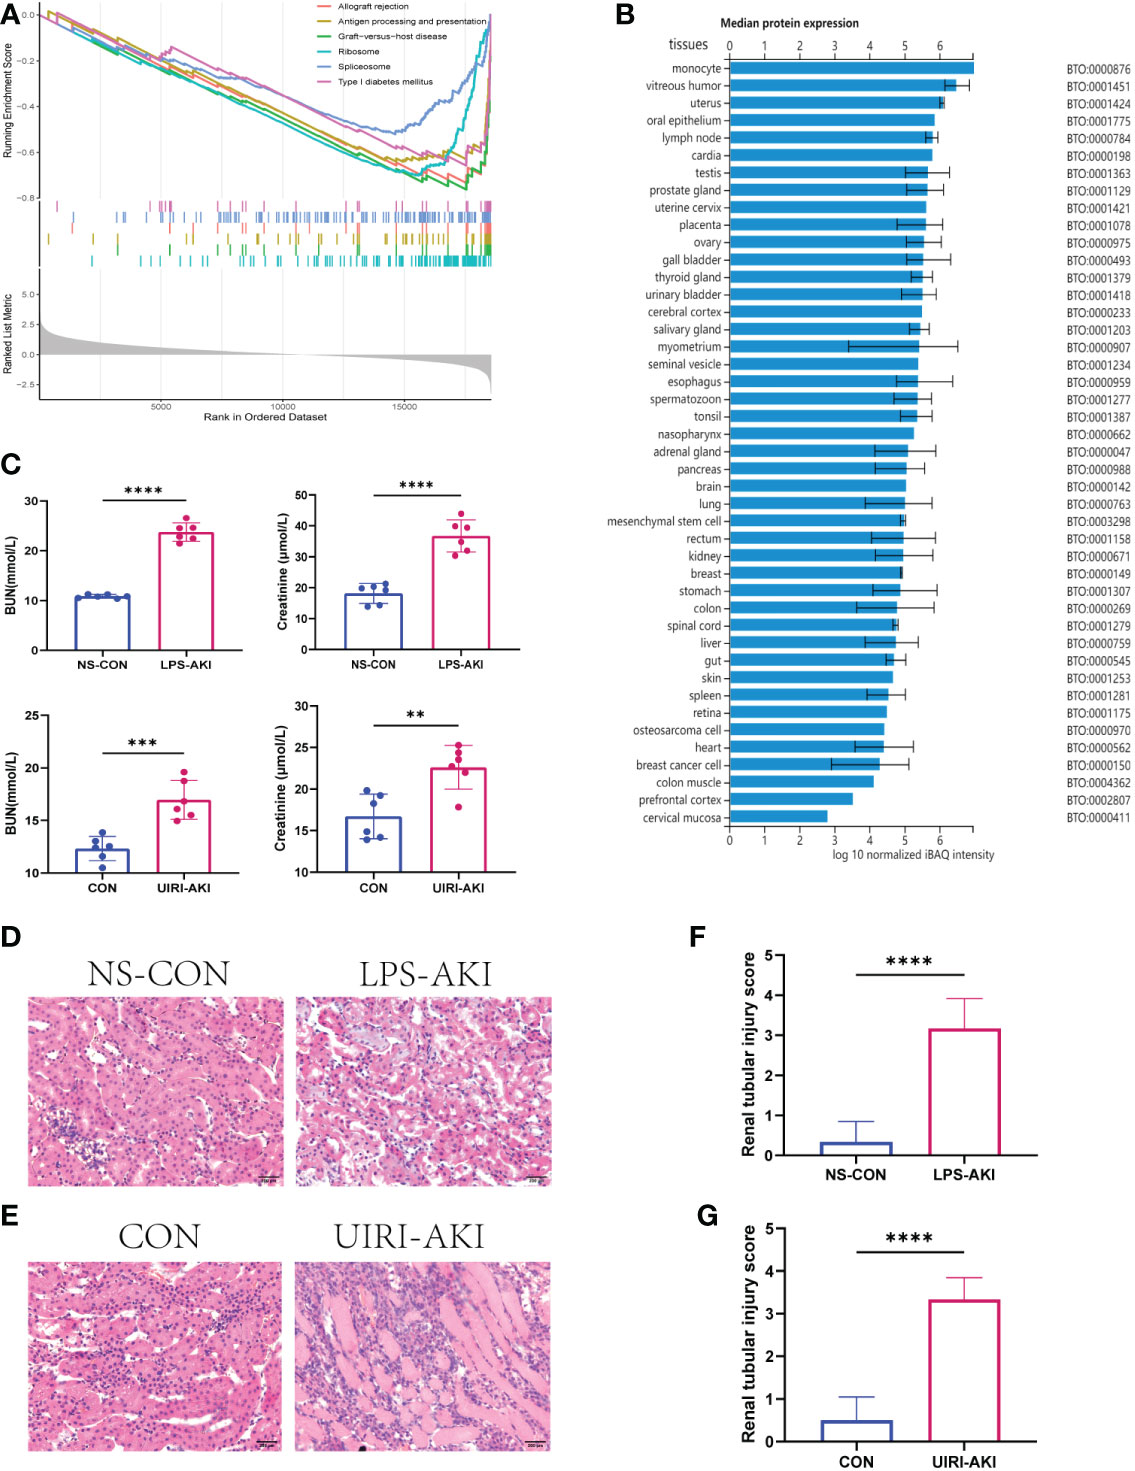
Figure 6 (A) GSEA of AFM. The first part shows the enrichment fraction broken line of six pathways, the line in the middle part corresponds to the genes of each diagram, and the third part shows the rank value distribution map of all genes. (B) The median protein expression of tissues or cells in the ProteomicsDB. (C) BUN and SCr values in two AKI mouse models (LPS-AKI; UIRI-AKI). (D, E) HE staining showed deterioration of the histological features of the renal cortex in two AKI models (LPS-AKI; UIRI-AKI). (F, G) The renal tubular injury score of two AKI moudules. **p < 0.01, ***p < 0.001, ****p < 0.0001.
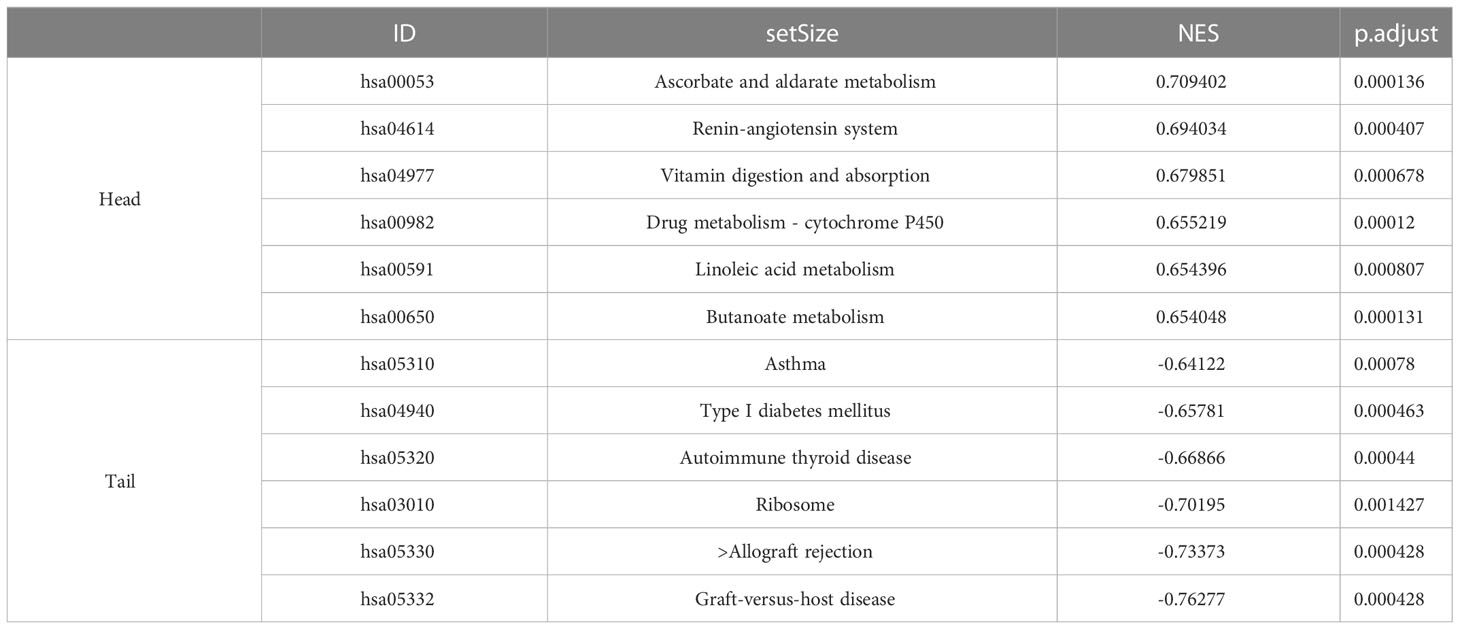
Table 3 Single-gene GSEA of AFM.
Significant negative correlation between AFM and monocyte infiltration
To investigate the correlation between AFM gene and immune cells, we analyzed the expression data of AFM genes in the GSE30718 dataset. The results showed that the expression value of this AFM was negatively correlated with the infiltration levels of monocytes, mast cells resting, T cells CD4 memory resting, and macrophages M1; the highest correlation was with monocytes (R=-0.73) (Figure 5E). The scatter plots of AFM expression and monocyte infiltration levels are shown in Figure 5F. Also, the expression of AFM in various tissues or cells was queried in the ProteomicsDB database (ProteomicsDB; https://www.proteomicsdb.org/), and it was found to be highly expressed in monocytes (Figure 6B).
AFM is downregulated in mice with AKI
In this study, we constructed two AKI mice models: the LPS-induced SA-AKI and the unilateral ischemia-reperfusion (UIRI) induced AKI.
The serum BUN and creatinine levels were substantial increased in these two AKI models compared to the control group and renal function was significantly decreased (Figure 6C). In addition, HE staining showed deterioration of the histological features of the renal cortex in two AKI models (Figures 6D–G). qRT-PCR and enzyme-linked immunosorbent assay (ELISA) detected the expression of inflammatory factors (IL-6, IL-18, TNF-α) in samples (Figures 7, 8). qRT-PCR detected the expression of AFM. In the AKI renal tissue, AFM expression was significantly downregulated, and the CCL2 and inflammatory indicators (NF-κB, IL-6, TNF-α, and IL-18) were significantly upregulated (Figures 7, 8).
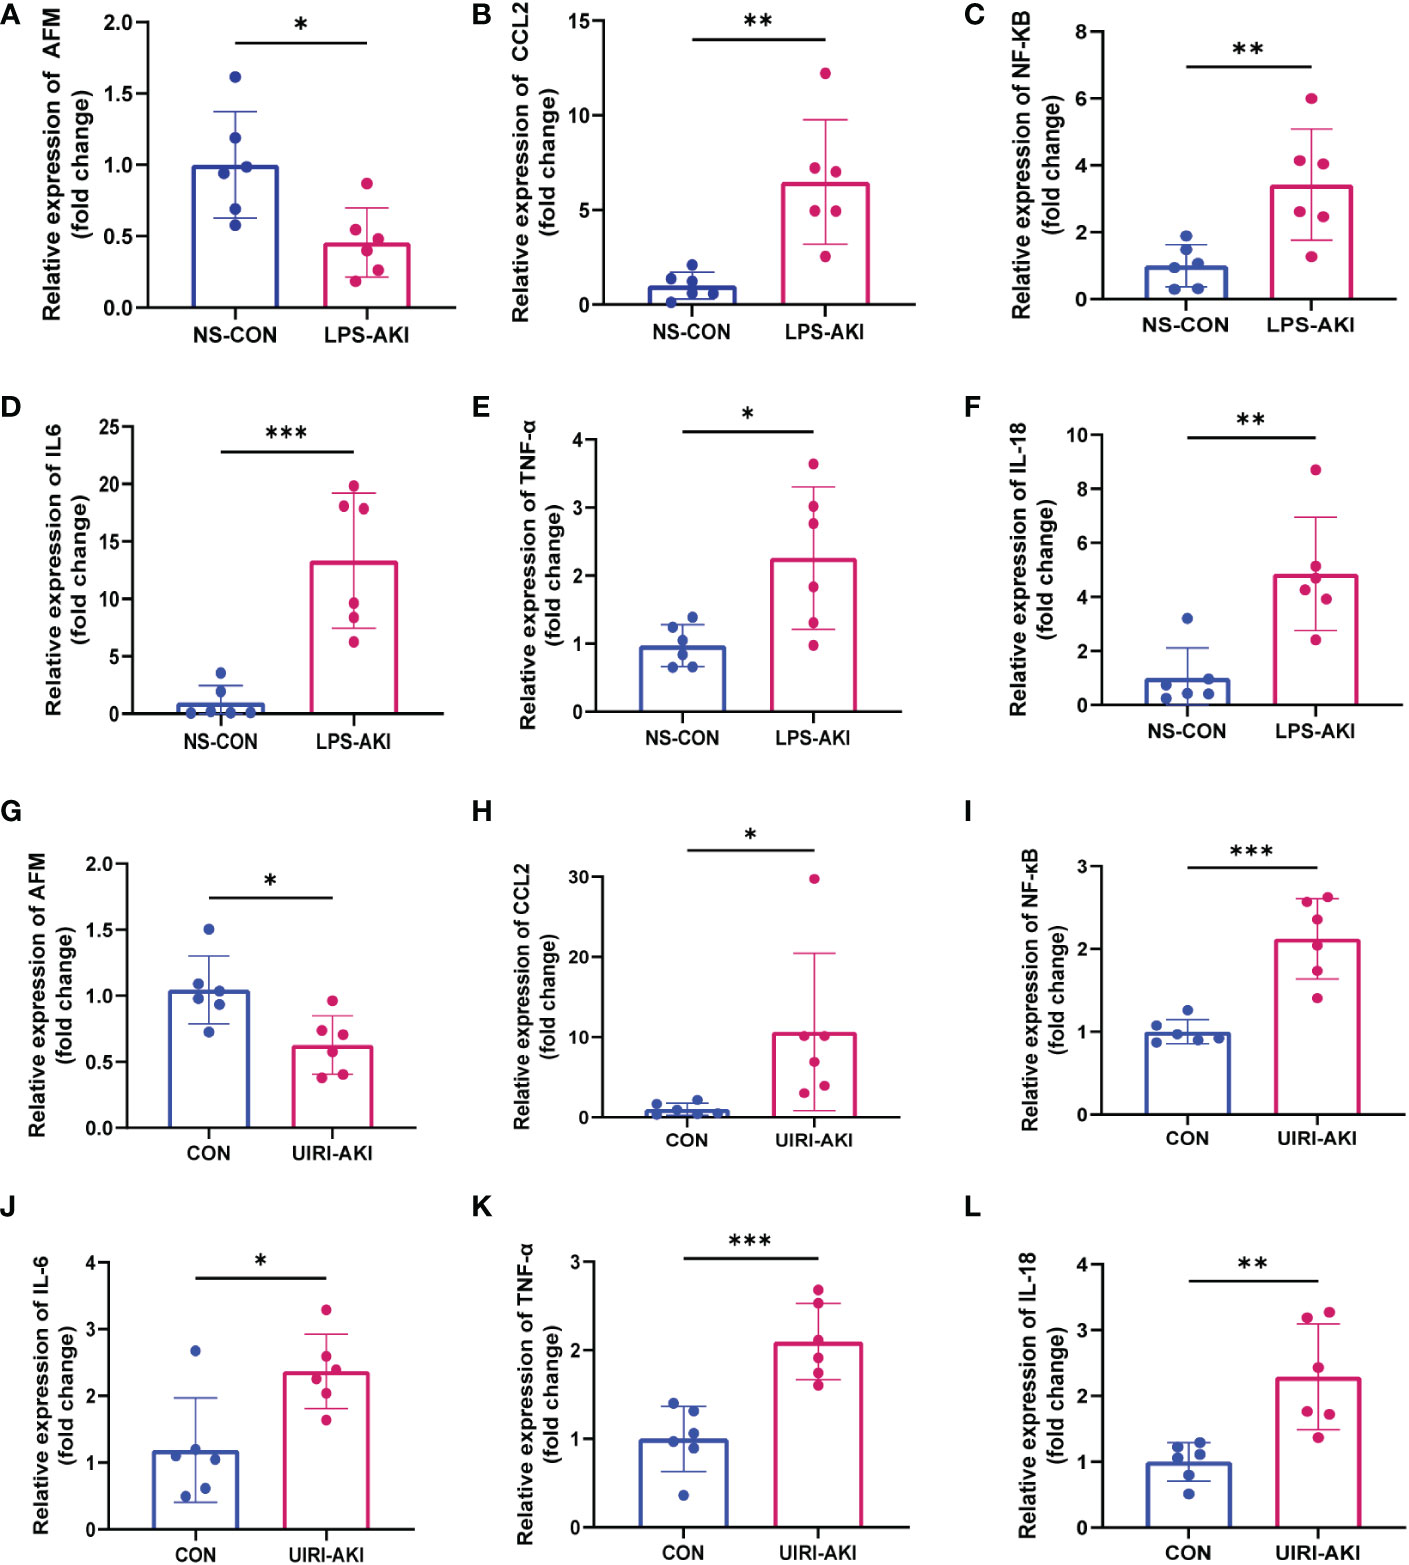
Figure 7 (A–F) Relative expression level of AFM, CCL2 and inflammatory indicators mRNA in LPS-AKI mice model. (G–L) Relative expression level of AFM, CCL2 and inflammatory indicators mRNA in UIRI-AKI mice model. *p < 0.05, **p < 0.01, ***p < 0.001.
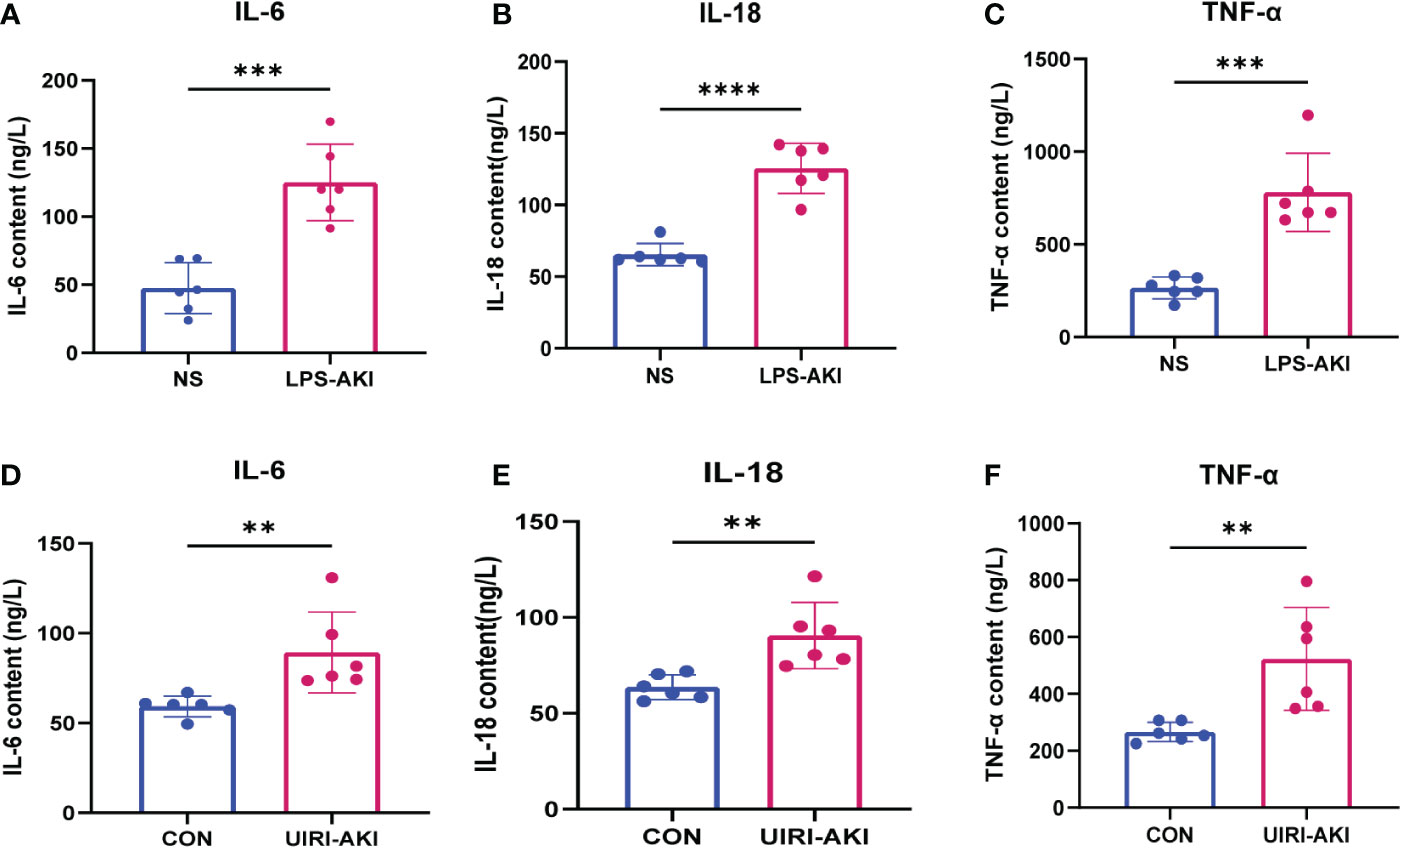
Figure 8 (A–F) ELISA analysis of IL-6, IL-18, TNF-α levels in UIRI-AKI and LPS-induced AKI models. Analyze the data using Student’s t-test. **p < 0.01, ***p < 0.001, ****p < 0.0001.
LPS inhibits the expression of AFM in THP-1 cells
To test whether LPS affects the expression of AFM in monocytes, we measured the mRNA and protein expression of AFM in LPS-treated THP-1 cells and found that the expression of AFM was significantly decreased (Figures 9G, H). CCL2 is a monocyte chemokine, and the expression level of CCL2 mRNA increased after LPS stimulation in THP-1 cells. In addition, the LPS treatment increased the mRNA levels of the inflammatory marker, NF-κB, IL-6, TNF-α, and IL-18 (Figure 9). Based on these findings, we proposed the hypothesis that the decrease expression of AFM in monocytes after LPS stimulation may be associated with elevated CCL2 expression, thereby increasing monocyte infiltration and promoting inflammation.
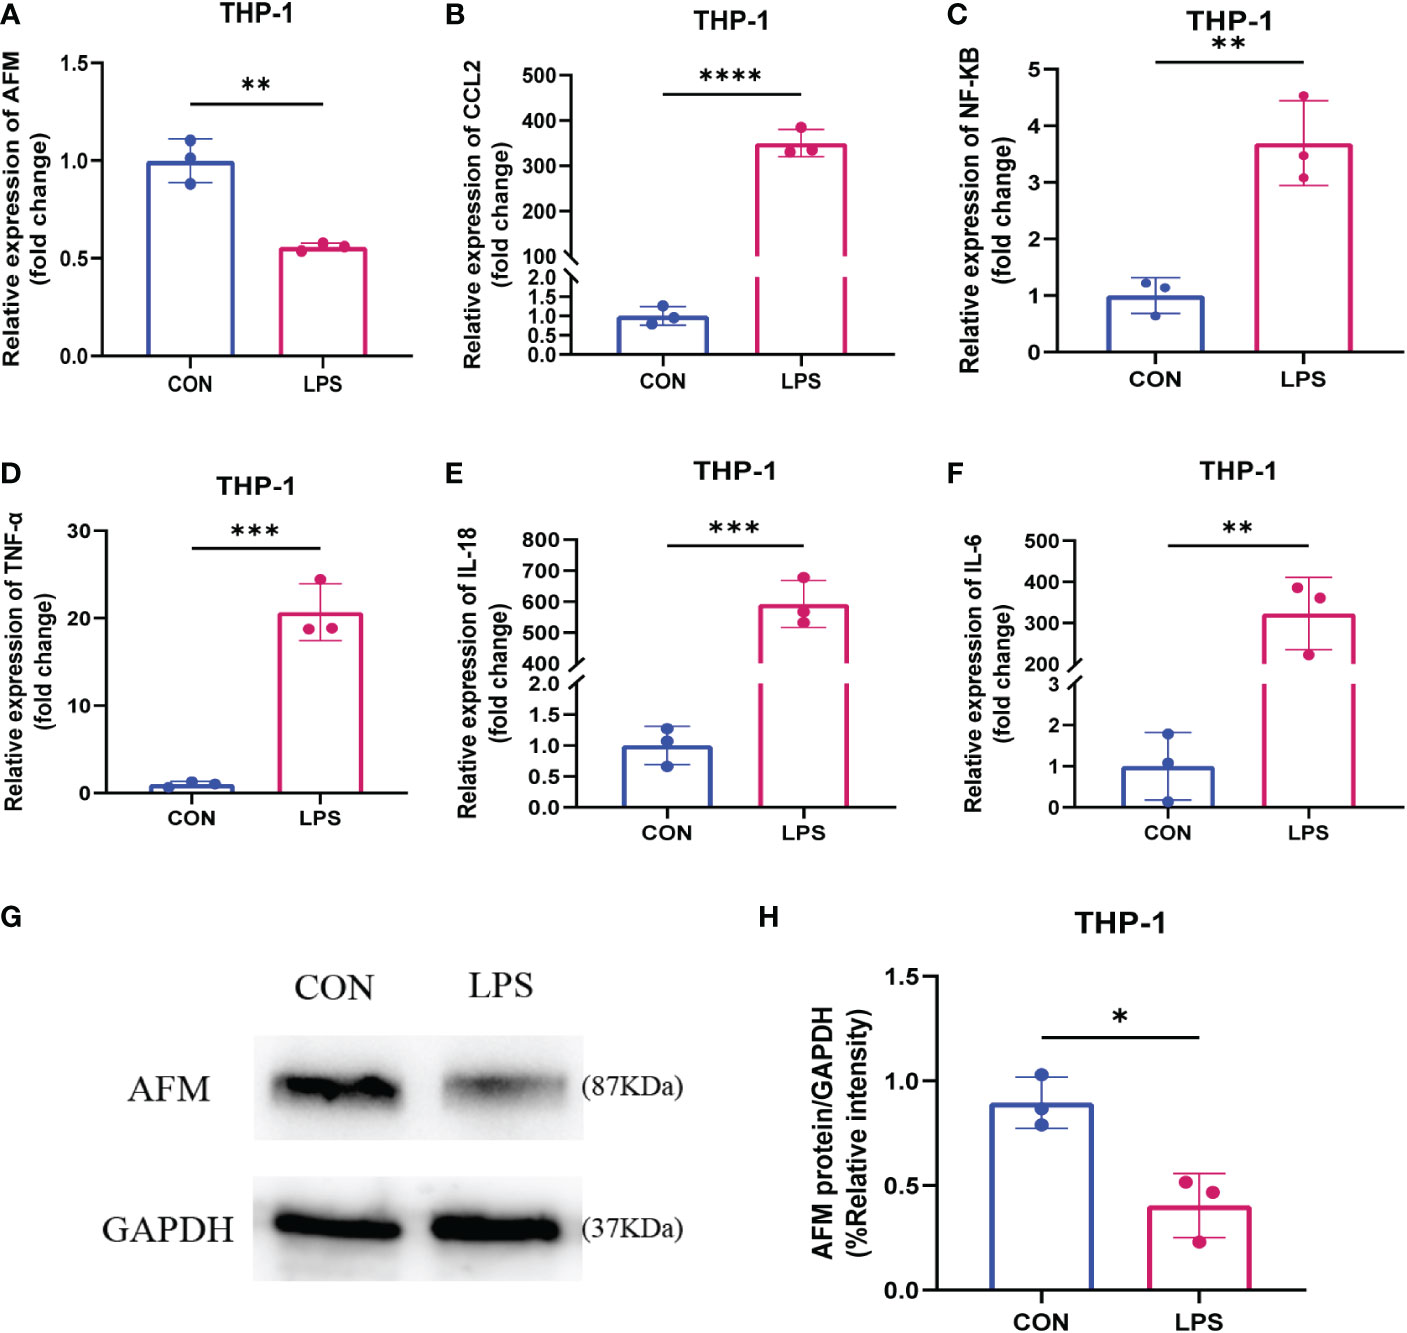
Figure 9 (A–F) Relative expression levels of AFM, CCL2 and inflammatory index mRNA in LPS-stimulated monocytes (THP-1). (G, H) The immunoblotting (G) and quantification grayscale value of AFM in THP-1 cell 24 h post-LPS stimulation (H). *p < 0.05, **p < 0.01, ***p < 0.001, ****p < 0.0001.
Discussion
AKI is a clinical disease wherein the glomerular filtration rate decreases suddenly due to various reasons in a short time, resulting in the rapid development of water, electrolyte, acid-base balance, and systemic complications (27, 28). Clinically, the primary causes of AKI include sepsis, renal ischemia-reperfusion, and exposure to nephrotoxin, with sepsis accounting for about half of all AKI cases (29, 30). Sepsis is defined as end-organ dysfunction due to the host’s inflammatory response to infection, in which the damaged kidney, a major source of inflammatory chemokines, may have local and remote deleterious effects on the body and increase the risk of mortality in patients with sepsis (3). Several studies have shown that the occurrence and development of SA-AKI are closely related to the infiltration of various immune cells (31). AKI is characterized by inflammatory infiltration within the kidney that induces apoptosis and promotes tubular epithelial cell loss (32). In addition, recent studies have found that the circulation of inflammatory cytokines, such as IL-6 and TNF-α, is associated with an increased risk of death in patients with AKI (33). Three basic mechanisms in the development of SA-AKI include microvascular dysfunction, inflammation, and metabolic reprogramming, in which the recruitment of immune cells and the overproduction of pro-inflammatory cytokines play a critical role in developing LPS-induced SA-AKI (3, 34). Although significant efforts have been made to resolve the issues related to treatment, the early diagnosis and treatment of SA-AKI is a significant clinical problem. Therefore, the present study focused on the mechanism of immune infiltration in the development of SA-AKI and the search for new diagnostic markers and therapeutic targets through bioinformatics analysis.
In order to further explore the mechanism of immune cells in sepsis-related AKI and find novel ideas for the diagnosis and treatment, we downloaded the mouse sepsis-related AKI dataset from the GEO database and constructed a network of gene co-expression matrix and immune infiltration analysis. Five types of immune cells with significant differences in immune infiltration scores were screened between the AKI and control groups. Weighted correlation network analysis was performed using the immune infiltration score of each sample as trait data, combining the results of immune infiltration and WGCNA. Based on the analysis, we screened out AFM and GSTA1 as hub genes. We downloaded the human AKI dataset and the mouse rhabdomyolysis-associated AKI dataset as external data to validate these two genes and found that AFM was significantly downregulated in the AKI group in both datasets. Next, the AFM gene was selected as a potential diagnostic and therapeutic target for SA-AKI based on the results.
AFM, also known as Afamin, is the fourth member of the albumin gene family and is mainly produced by the liver and expressed in the kidney (35). Some studies revealed that AFM has multiple binding sites for α- and γ-tocopherol and is a specific binding protein for vitamin E (36, 37). Growing evidence suggests that AFM, as a specific binding protein for vitamin E, may play a role in protecting cells from oxidative damage (38). A clinical trial assessed the strong inverse association between plasma AFM and inflammatory disease and biomarkers and hinted it as a potentially harmful acute-phase protein (39). On the other hand, studies on metabolic-related diseases demonstrated that plasma AFM significantly correlated with liver lipids, fatty liver index, and liver injury markers (40). Another study in metabolic syndrome and obesity demonstrated that AFM may influence the development of obesity-related oxidative stress through via insulin resistance (41). In addition, plasma AFM levels constitute an independent risk factor for gestational diabetes (42–44). The studies on kidney disease exhibited that urinary AFM is closely related to kidney damage and may be a potential marker of kidney damage, which is useful for the early prediction of patients with a high risk of kidney disease in patients with type 2 diabetes (45, 46). Moreover, multiple proteomic analyses have found that urinary AFM is a potential biomarker for various diseases, including membranous nephropathy, lupus nephritis, and osteoarthritis (47–49). To sum up, although several studies have revealed the molecular function of AFM and its correlation with various inflammatory diseases, there is still a lack of research on the role of AFM in the development of SA-AKI from the perspective of molecular mechanisms.
Monocyte chemokines regulate monocyte transport, namely CCL2, CCL7, CX3CL1, and various chemokine receptors. CCL2 is a well-known CC chemokine, which is not only one of the critical chemokines in regulating monocytes/macrophage migration and infiltration, but also plays a role in cancer, autoimmune diseases, bacterial and viral infections, and many kidney diseases. In some studies, CCL2 has been recognized as a novel AKI biomarker that plays a vital role in many types of AKI (50). In addition, high CCL2 levels are thought to be positively correlated with renal interstitial fibrosis and tubular atrophy (51, 52). Based on the importance of CCL2 in acute kidney injury, we selected CCL2 as the monocyte chemokine to be detected.
In this study, we used SA-AKI and UIRI models for validation. qPCR detection showed that AFM in kidney tissue of SA-AKI mice induced by LPS was significantly decreased, and CCL2 and inflammatory indexes increased considerably. Furthermore, bioinformatics analysis showed that AFM was negatively correlated with the level of monocyte infiltration. It has been previously reported that AFM can act as a chemokine for pro-osteoblasts and may stimulate osteoclastogenesis and bone resorption through Gi-coupled receptors and the Ca2+/calmodulin-dependent protein kinase (CaMK) pathway (53, 54). It suggests that AFM may be closely related to the monocyte-macrophage system’s differentiation and in vivo migration. Our experiments indicated that LPS-treated THP-1 decreased AFM expression and significantly increased CCL2 and inflammatory markers compared with controls. Based on the above results, we propose that AFM is a potential biomarker of SA-AKI, and its downregulation may be associated with the recruitment of monocytes to the damaged kidney. Therefore, we hypothesize that AFM is downregulated in monocytes in sepsis-related acute kidney injury, which further increases monocyte recruitment and the release of various inflammatory factors in the injured kidney, thereby aggravating the inflammatory response, thereby promoting the progression of the disease. The hypothesis diagram is shown in Figure 10. In addition, we found that the expression of AFM was also significantly downregulated in UIRI-induced AKI, and the changes in CCL2 and various inflammatory factors were similar to SA-AKI. Therefore, we propose that AFM negatively regulates monocyte infiltration in two models of AKI, mediating an inflammatory response that promotes disease progression. However, this study did not perform AFM gene knockout or overexpression to test this conjecture. Therefore, we will further verify this conjecture in subsequent studies. AFM may be a potential diagnostic marker for SA-AKI, and based on this, we hope that the expression of AFM in the hematuria of patients with SA-AKI can be detected in later studies as further to clarify the significance of AFM as a diagnostic marker.

Figure 10 Hypothesis map was drawn by Figdraw.
In summary, AFM was significantly reduced in SA-AKI and UIRI-induced AKI and negatively correlated with monocyte infiltration. This finding suggested that AFM may affect the onset of inflammatory responses by negative regulation of monocyte infiltration, thereby regulating SA-AKI progression. These phenomena may provide novel ideas for diagnosing and treating sepsis-related AKI.
Data availability statement
The datasets presented in this study can be found in online repositories. The names of the repository/repositories and accession number(s) can be found in the article/Supplementary Material.
Ethics statement
The animal study was reviewed and approved by The Animal Protection Committee of the Third Affiliated Hospital of Southern Medical University. Written informed consent was obtained from the owners for the participation of their animals in this study.
Author contributions
CG: Conceptualization, Methodology, Validation, Formal Analysis, Writing - Original Draft. JC: Data Curation, Writing - Original Draft. YD: Visualization. XZ: Resources. YC: Validation. HJ: Writing - Review & Editing. WL: Formal Analysis. PL: Visualization. JX: Writing - Review & Editing. WN: Validation. HC: Resources, Supervision. YF: Validation, Writing - Review & Editing, Project Administration, CG and YF contributed equally. JZ: Conceptualization, Funding Acquisition, Resources, Supervision, Writing - Review & Editing. All authors contributed to the article and approved the submitted version.
Funding
This work was supported by the following funds, National Natural Science Foundation of China [Grant No. 82060130, 81860130]; Natural Science Foundation of Guangdong Province [Grant No. 2019A1515011087, 2021A1515012453]; Guangzhou Science and Technology Innovation Committee [Grant No. 202002030038].
Conflict of interest
The authors declare that the research was conducted in the absence of any commercial or financial relationships that could be construed as a potential conflict of interest.
Publisher’s note
All claims expressed in this article are solely those of the authors and do not necessarily represent those of their affiliated organizations, or those of the publisher, the editors and the reviewers. Any product that may be evaluated in this article, or claim that may be made by its manufacturer, is not guaranteed or endorsed by the publisher.
Supplementary material
The Supplementary Material for this article can be found online at: https://www.frontiersin.org/articles/10.3389/fimmu.2023.1049536/full#supplementary-material.
References
1. Cecconi M, Evans L, Levy M, Rhodes A. Sepsis and septic shock. Lancet (2018) 392(10141):75–87. doi: 10.1016/S0140-6736(18)30696-2
2. Poston JT, Koyner JL. Sepsis associated acute kidney injury. Bmj (2019) 364:k4891. doi: 10.1136/bmj.k4891
3. Peerapornratana S, Manrique-Caballero CL, Gómez H, Kellum JA. Acute kidney injury from sepsis: current concepts, epidemiology, pathophysiology, prevention and treatment. Kidney Int (2019) 96(5):1083–99. doi: 10.1016/j.kint.2019.05.026
4. Gómez H, Kellum JA, Ronco C. Metabolic reprogramming and tolerance during sepsis-induced AKI. Nat Rev Nephrol (2017) 13(3):143–51. doi: 10.1038/nrneph.2016.186
5. Faubel S, Edelstein CL. Mechanisms and mediators of lung injury after acute kidney injury. Nat Rev Nephrol (2016) 12(1):48–60. doi: 10.1038/nrneph.2015.158
6. Lee SA, Cozzi M, Bush EL, Rabb H. Distant organ dysfunction in acute kidney injury: A review. Am J Kidney Dis (2018) 72(6):846–56. doi: 10.1053/j.ajkd.2018.03.028
7. Horiguchi H, Loftus TJ, Hawkins RB, Raymond SL, Stortz JA, Hollen MK, et al. Innate immunity in the persistent inflammation, immunosuppression, and catabolism syndrome and its implications for therapy. Front Immunol (2018) 9:595. doi: 10.3389/fimmu.2018.00595
8. Lech M, Gröbmayr R, Ryu M, Lorenz G, Hartter I, Mulay SR, et al. Macrophage phenotype controls long-term AKI outcomes–kidney regeneration versus atrophy. J Am Soc Nephrol (2014) 25(2):292–304. doi: 10.1681/ASN.2013020152
9. Chang YM, Chou YT, Kan WC, Shiao CC. Sepsis and acute kidney injury: A review focusing on the bidirectional interplay. Int J Mol Sci (2022) 23(16):9159. doi: 10.3390/ijms23169159
10. Yao W, Chen Y, Li Z, Ji J, You A, Jin S, et al. Single cell RNA sequencing identifies a unique inflammatory macrophage subset as a druggable target for alleviating acute kidney injury. Adv Sci (Weinh) (2022) 9(12):e2103675. doi: 10.1002/advs.202103675
11. Janosevic D, Myslinski J, McCarthy TW, Zollman A, Syed F, Xuei X, et al. The orchestrated cellular and molecular responses of the kidney to endotoxin define a precise sepsis timeline. Elife (2021) 10:e62270. doi: 10.7554/eLife.62270
12. Mengel M, Chang J, Kayser D, Gwinner W, Schwarz A, Einecke G, et al. The molecular phenotype of 6-week protocol biopsies from human renal allografts: reflections of prior injury but not future course. Am J Transplant (2011) 11(4):708–18. doi: 10.1111/j.1600-6143.2010.03339.x
13. Mathia S, Rudigier LJ, Kasim M, Kirschner KM, Persson PB, Eckardt KU, et al. A dual role of miR-22 in rhabdomyolysis-induced acute kidney injury. Acta Physiol (Oxf) (2018) 224(3):e13102. doi: 10.1111/apha.13102
14. Langfelder P, Horvath S. WGCNA: an r package for weighted correlation network analysis. BMC Bioinf (2008) 9:559. doi: 10.1186/1471-2105-9-559
15. Newman AM, Liu CL, Green MR, Gentles AJ, Feng W, Xu Y, et al. Robust enumeration of cell subsets from tissue expression profiles. Nat Methods (2015) 12(5):453–7. doi: 10.1038/nmeth.3337.
16. Szklarczyk D, Gable AL, Lyon D, Junge A, Wyder S, Huerta-Cepas J, et al. STRING v11: protein-protein association networks with increased coverage, supporting functional discovery in genome-wide experimental datasets. Nucleic Acids Res (2019) 47(D1):D607–d13. doi: 10.1093/nar/gky1131
17. Shannon P, Markiel A, Ozier O, Baliga NS, Wang JT, Ramage D, et al. Cytoscape: A software environment for integrated models of biomolecular interaction networks. Genome Res (2003) 13(11):2498–504. doi: 10.1101/gr.1239303
18. Robin X, Turck N, Hainard A, Tiberti N, Lisacek F, Sanchez JC, et al. pROC: an open-source package for r and s+ to analyze and compare ROC curves. BMC Bioinf (2011) 12:77. doi: 10.1186/1471-2105-12-77
19. Patil I. Visualizations with statistical details: The’ggstatsplot’approach. J Open Source Software (2021) 6(61):3167. doi: 10.21105/joss.03167
20. Subramanian A, Tamayo P, Mootha VK, Mukherjee S, Ebert BL, Gillette MA, et al. Gene set enrichment analysis: a knowledge-based approach for interpreting genome-wide expression profiles. Proc Natl Acad Sci USA (2005) 102(43):15545–50. doi: 10.1073/pnas.0506580102
21. Villanueva RAM, Chen ZJ. ggplot2: Elegant Graphics for Data Analysis (2nd ed.). Measurement: Interdisciplinary Research and Perspectives. (2019) 17(3):160:167. doi: 10.1080/15366367.2019.1565254
22. Wu T, Hu E, Xu S, Chen M, Guo P, Dai Z, et al. clusterProfiler 4.0: A universal enrichment tool for interpreting omics data. Innovation (Camb) (2021) 2(3):100141. doi: 10.1016/j.xinn.2021.100141
23. Leemans JC, Stokman G, Claessen N, Rouschop KM, Teske GJ, Kirschning CJ, et al. Renal-associated TLR2 mediates ischemia/reperfusion injury in the kidney. J Clin Invest (2005) 115(10):2894–903. doi: 10.1172/JCI22832
24. Yang B, Lan S, Dieudé M, Sabo-Vatasescu JP, Karakeussian-Rimbaud A, Turgeon J, et al. Caspase-3 is a pivotal regulator of microvascular rarefaction and renal fibrosis after ischemia-reperfusion injury. J Am Soc Nephrol (2018) 29(7):1900–16. doi: 10.1681/ASN.2017050581
25. Ritchie ME, Phipson B, Wu D, Hu Y, Law CW, Shi W, et al. Limma powers differential expression analyses for RNA-sequencing and microarray studies. Nucleic Acids Res (2015) 43(7):e47. doi: 10.1093/nar/gkv007
26. Sui S, An X, Xu C, Li Z, Hua Y, Huang G, et al. An immune cell infiltration-based immune score model predicts prognosis and chemotherapy effects in breast cancer. Theranostics (2020) 10(26):11938–49. doi: 10.7150/thno.49451
27. Lameire N, Kellum JA. Contrast-induced acute kidney injury and renal support for acute kidney injury: a KDIGO summary (Part 2). Crit Care (2013) 17(1):205. doi: 10.1186/cc11455
28. Levey AS, James MT. Acute kidney injury. Ann Intern Med (2017) 167(9):Itc66–itc80. doi: 10.7326/AITC201711070
29. Gómez H, Kellum JA. Sepsis-induced acute kidney injury. Curr Opin Crit Care (2016) 22(6):546–53. doi: 10.1097/MCC.0000000000000356
30. Liu Z, Yang D, Gao J, Xiang X, Hu X, Li S, et al. Discovery and validation of miR-452 as an effective biomarker for acute kidney injury in sepsis. Theranostics (2020) 10(26):11963–75. doi: 10.7150/thno.50093
31. Zhang M, Wu L, Deng Y, Peng F, Wang T, Zhao Y, et al. Single cell dissection of epithelial-immune cellular interplay in acute kidney injury microenvironment. Front Immunol (2022) 13:857025. doi: 10.3389/fimmu.2022.857025
32. Singbartl K, Formeck CL, Kellum JA. Kidney-immune system crosstalk in AKI. Semin Nephrol (2019) 39(1):96–106. doi: 10.1016/j.semnephrol.2018.10.007
33. Ren Q, Guo F, Tao S, Huang R, Ma L, Fu P. Flavonoid fisetin alleviates kidney inflammation and apoptosis via inhibiting src-mediated NF-κB p65 and MAPK signaling pathways in septic AKI mice. BioMed Pharmacother (2020) 122:109772. doi: 10.1016/j.biopha.2019.109772
34. Verma SK, Molitoris BA. Renal endothelial injury and microvascular dysfunction in acute kidney injury. Semin Nephrol (2015) 35(1):96–107. doi: 10.1016/j.semnephrol.2015.01.010
35. Dieplinger H, Dieplinger B. Afamin–a pleiotropic glycoprotein involved in various disease states. Clin Chim Acta (2015) 446:105–10. doi: 10.1016/j.cca.2015.04.010
36. Voegele AF, Jerković L, Wellenzohn B, Eller P, Kronenberg F, Liedl KR, et al. Characterization of the vitamin e-binding properties of human plasma afamin. Biochemistry (2002) 41(49):14532–8. doi: 10.1021/bi026513v
37. Jerkovic L, Voegele AF, Chwatal S, Kronenberg F, Radcliffe CM, Wormald MR, et al. Afamin is a novel human vitamin e-binding glycoprotein characterization and in vitro expression. J Proteome Res (2005) 4(3):889–99. doi: 10.1021/pr0500105
38. Erol SA, Tanacan A, Anuk AT, Tokalioglu EO, Biriken D, Keskin HL, et al. Evaluation of maternal serum afamin and vitamin e levels in pregnant women with COVID-19 and its association with composite adverse perinatal outcomes. J Med Virol (2021) 93(4):2350–8. doi: 10.1002/jmv.26725
39. Dieplinger B, Egger M, Gabriel C, Poelz W, Morandell E, Seeber B, et al. Analytical characterization and clinical evaluation of an enzyme-linked immunosorbent assay for measurement of afamin in human plasma. Clin Chim Acta (2013) 425:236–41. doi: 10.1016/j.cca.2013.08.016
40. Kurdiova T, Balaz M, Kovanicova Z, Zemkova E, Kuzma M, Belan V, et al. Serum afamin a novel marker of increased hepatic lipid content. Front Endocrinol (Lausanne) (2021) 12:670425. doi: 10.3389/fendo.2021.670425
41. Juhász I, Ujfalusi S, Seres I, Lőrincz H, Varga VE, Paragh G Jr., et al. Afamin levels and their correlation with oxidative and lipid parameters in non-diabetic, obese patients. Biomolecules (2022) 12(1):116. doi: 10.3390/biom12010116
42. Wang X, Zheng X, Yan J, Xu R, Xu M, Zheng L, et al. The clinical values of afamin, triglyceride and PLR in predicting risk of gestational diabetes during early pregnancy. Front Endocrinol (Lausanne) (2021) 12:723650. doi: 10.3389/fendo.2021.723650
43. Köninger A, Iannaccone A, Hajder E, Frank M, Schmidt B, Schleussner E, et al. Afamin predicts gestational diabetes in polycystic ovary syndrome patients preconceptionally. Endocr Connect (2019) 8(5):616–24. doi: 10.1530/EC-19-0064
44. Eroğlu H, Örgül G, Tonyalı NV, Biriken D, Polat N, Yücel A, et al. The role of afamin and other trace elements in the prediction of GDM: a tertiary center experience. Biol Trace Elem Res (2021) 199(12):4418–22. doi: 10.1007/s12011-020-02559-0
45. Kaburagi Y, Takahashi E, Kajio H, Yamashita S, Yamamoto-Honda R, Shiga T, et al. Urinary afamin levels are associated with the progression of diabetic nephropathy. Diabetes Res Clin Pract (2019) 147:37–46. doi: 10.1016/j.diabres.2018.02.034
46. Kollerits B, Lamina C, Huth C, Marques-Vidal P, Kiechl S, Seppälä I, et al. Plasma concentrations of afamin are associated with prevalent and incident type 2 diabetes: A pooled analysis in more than 20,000 individuals. Diabetes Care (2017) 40(10):1386–93. doi: 10.2337/dc17-0201
47. Pang L, Li Q, Li Y, Liu Y, Duan N, Li H. Urine proteomics of primary membranous nephropathy using nanoscale liquid chromatography tandem mass spectrometry analysis. Clin Proteomics (2018) 15:5. doi: 10.1186/s12014-018-9183-3
48. Anania VG, Yu K, Pingitore F, Li Q, Rose CM, Liu P, et al. Discovery and qualification of candidate urinary biomarkers of disease activity in lupus nephritis. J Proteome Res (2019) 18(3):1264–77. doi: 10.1021/acs.jproteome.8b00874
49. Balakrishnan L, Nirujogi RS, Ahmad S, Bhattacharjee M, Manda SS, Renuse S, et al. Proteomic analysis of human osteoarthritis synovial fluid. Clin Proteomics (2014) 11(1):6. doi: 10.1186/1559-0275-11-6
50. Nisansala T, Weerasekera M, Ranasinghe N, Marasinghe C, Gamage C, Fernando N, et al. Importance of KIM-1 and MCP-1 in determining the leptospirosis-associated AKI: A Sri Lankan study. BioMed Res Int (2021) 2021:1752904. doi: 10.1155/2021/1752904
51. Worawichawong S, Worawichawong S, Radinahamed P, Muntham D, Sathirapongsasuti N, Nongnuch A, et al. Urine epidermal growth factor, monocyte chemoattractant protein-1 or their ratio as biomarkers for interstitial fibrosis and tubular atrophy in primary glomerulonephritis. Kidney Blood Press Res (2016) 41(6):997–1007. doi: 10.1159/000452595
52. Menez S, Ju W, Menon R, Moledina DG, Thiessen Philbrook H, McArthur E, et al. Urinary EGF and MCP-1 and risk of CKD after cardiac surgery. JCI Insight (2021) 6(11):e147464. doi: 10.1172/jci.insight.147464
53. Kim BJ, Lee YS, Lee SY, Park SY, Dieplinger H, Ryu SH, et al. Afamin secreted from nonresorbing osteoclasts acts as a chemokine for preosteoblasts via the akt-signaling pathway. Bone (2012) 51(3):431–40. doi: 10.1016/j.bone.2012.06.015
Keywords: SA-AKI, AFM, monocyte, WGCNA, immunity
Citation: Guo C, Fan Y, Cheng J, Deng Y, Zhang X, Chen Y, Jing H, Li W, Liu P, Xie J, Ning W, Chen H and Zhou J (2023) AFM negatively regulates the infiltration of monocytes to mediate sepsis-associated acute kidney injury. Front. Immunol. 14:1049536. doi: 10.3389/fimmu.2023.1049536
Received: 20 September 2022; Accepted: 13 January 2023;
Published: 30 January 2023.
Edited by:
Alessandra Stasi, University of Bari Aldo Moro, ItalyReviewed by:
Gianvito Caggiano, University of Bari Aldo Moro, ItalyRi Wen, Sheng Jing Hospital Affiliated to China Medical University, China
Copyright © 2023 Guo, Fan, Cheng, Deng, Zhang, Chen, Jing, Li, Liu, Xie, Ning, Chen and Zhou. This is an open-access article distributed under the terms of the Creative Commons Attribution License (CC BY). The use, distribution or reproduction in other forums is permitted, provided the original author(s) and the copyright owner(s) are credited and that the original publication in this journal is cited, in accordance with accepted academic practice. No use, distribution or reproduction is permitted which does not comply with these terms.
*Correspondence: Jun Zhou, emhvdWp1bjc4NDNAMTI2LmNvbQ==