 Esther Strating1
 Mathijs P. Verhagen2
 Emerens Wensink3
 Ester Dünnebach4,5Liza Wijler1Itziar Aranguren1
 Alberto Sanchez De la Cruz1Niek A. Peters1
 Joris H. Hageman6Mirjam M. C. van der Net6
 Susanne van Schelven1Jamila Laoukili1Riccardo Fodde2Jeanine Roodhart3
 Stefan Nierkens4,5
 Hugo Snippert6
 Martijn Gloerich6
 Inne Borel Rinkes1Sjoerd G. Elias7
 Onno Kranenburg1,8*†
- 1Laboratory Translational Oncology, Division of Imaging and Cancer, University Medical Center Utrecht, Utrecht, Netherlands
- 2Department of Pathology, Erasmus Medical Center, Rotterdam, Netherlands
- 3Department of Medical Oncology, Division of Imaging and Cancer, University Medical Center Utrecht, Utrecht, Netherlands
- 4Center for Translational Immunology, University Medical Center Utrecht, Utrecht University, Utrecht, Netherlands
- 5Princess Máxima Center for Pediatric Oncology, Utrecht, Netherlands
- 6Center for Molecular Medicine, Division LAB, University Medical Center Utrecht, Utrecht, Netherlands
- 7Department of Epidemiology, Julius Center for Health Sciences and Primary Care, University Medical Center Utrecht, Utrecht, Netherlands
- 8Utrecht Platform for Organoid Technology, Utrecht University, Utrecht, Netherlands
Background: Poor prognosis in colon cancer is associated with a high content of cancer-associated fibroblasts (CAFs) and an immunosuppressive tumor microenvironment. The relationship between these two features is incompletely understood. Here, we aimed to generate a model system for studying the interaction between cancer cells and CAFs and their effect on immune-related cytokines and T cell proliferation.
Methods: CAFs were isolated from colon cancer liver metastases and were immortalized to prolong lifespan and improve robustness and reproducibility. Established medium and matrix compositions that support the growth of patient-derived organoids were adapted to also support CAF growth. Changes in growth pattern and cellular re-organization were assessed by confocal microscopy, live cell imaging, and immunofluorescence. Single cell RNA sequencing was used to study CAF/organoid co-culture-induced phenotypic changes in both cell types. Conditioned media were used to quantify the production of immunosuppressive factors and to assess their effect on T cell proliferation.
Results: We developed a co-culture system in which colon cancer organoids and CAFs spontaneously organize into superstructures with a high capacity to contract and stiffen the extracellular matrix (ECM). CAF-produced collagen IV provided a basement membrane supporting cancer cell organization into glandular structures, reminiscent of human cancer histology. Single cell RNA sequencing analysis showed that CAFs induced a partial epithelial-to-mesenchymal-transition in a subpopulation of cancer cells, similar to what is observed in the mesenchymal-like consensus molecular subtype 4 (CMS4) colon cancer. CAFs in co-culture were characterized by high expression of ECM components, ECM-remodeling enzymes, glycolysis, hypoxia, and genes involved in immunosuppression. An expression signature derived from CAFs in co-culture identified a subpopulation of glycolytic myofibroblasts specifically residing in CMS1 and CMS4 colon cancer. Medium conditioned by co-cultures contained high levels of the immunosuppressive factors TGFβ1, VEGFA and lactate, and potently inhibited T cell proliferation.
Conclusion: Co-cultures of organoids and immortalized CAFs recapitulate the histological, biophysical, and immunosuppressive features of aggressive mesenchymal-like human CRC. The model can be used to study the mechanisms of immunosuppression and to test therapeutic strategies targeting the cross-talk between CAFs and cancer cells. It can be further modified to represent distinct colon cancer subtypes and (organ-specific) microenvironments.
Introduction
Colon cancer is one of the leading causes of cancer-related mortality in adults (1). Histopathological, genetic, immunological and molecular analysis of colon cancer has yielded insight into the heterogeneous nature of the disease (2–7). Characteristics like microsatellite instability (MSI), the presence of activating mutations in KRAS or BRAF, and/or infiltration by T cells, show correlations with prognosis and/or treatment response. Some of this information has been used to devise more personalized strategies of (targeted) anti-cancer treatment (8, 9). Despite these advances, the 5-year survival for patients with metastatic colon cancer remains very poor (~15%) and has only marginally improved over the past decade (10). A notable exception are patients with metastatic tumors with high levels of MSI (MSI-H), representing ~3-5% of all cases of metastatic colon cancer. Treatment of MSI-H metastases with anti-Programmed Death-1 (PD-1) yields significantly better and more durable anti-tumor responses, better progression-free survival, with lower toxicity, when compared to standard chemotherapy (11, 12). Nevertheless, even after anti-PD-1 treatment, more than half of the patients experience disease progression within 5 years (12). In addition, only patients with MSI-H tumors benefit from immune checkpoint blockade, while MSI-low (MSI-L) tumors generally fail to respond (13, 14). Thus, insight into the mechanisms underlying immunotherapy failure may form the basis for designing rational combination treatment strategies (15).
The success of immunotherapy depends on the infiltration of tumors by immune cells and on signals from the tumor microenvironment (TME) that impact immune cell differentiation and function (16). The TME consists of extra-cellular matrix (ECM) components, endothelial cells, immune cells and cancer-associated fibroblasts (CAFs), and plays a major role in determining immune cell function in cancer (17). CAFs in particular promote colon cancer initiation (18, 19), progression (20), metastasis formation (21) and therapy resistance (22, 23). When activated by cancer cells, CAFs may in turn promote aggressive cancer cell behavior (24). In addition, CAFs contribute to the generation of an immunosuppressive TME (25–28). Functionally, the continuous deposition of extracellular matrix (ECM) components is a critical CAF-mediated feature impacting multiple aspects of aggressive tumor cell behavior and immunosuppression (29).
In colon cancer, the ‘mesenchymal-like’ consensus molecular subtype 4 (CMS4) is characterized by a high CAF content (2) and by a gene expression program reflecting angiogenesis, inflammation and immunosuppression (30). Despite the immunosuppressive nature of CMS4 MSI-L colon cancer, cancer-specific neo-antigen-reactive T cells have been isolated from such tumors (31). Therefore, boosting the activity of tumor-reactive T cells in CMS4 colon cancer may be a promising therapeutic strategy (31). Indeed, in a pre-clinical mouse model of stroma-rich MSI-L colon cancer, inhibition of immunosuppressive TGFβ signaling was sufficient to evoke a response to anti-PD1 therapy (32).
The design and testing of novel therapeutic strategies requires model systems for studying CMS4 (CAF-rich) colon cancer. Organoid technology has emerged as a superior culturing platform for modelling human colon cancer (33). Organoid culturing media are optimized for epithelial (tumor cell) growth. As a result, cells and matrix components from the TME are rapidly lost from such cultures, precluding the analysis of reciprocal tumor-cell/TME interactions. This is highly relevant for CMS4 colon cancer, in which the immunosuppressive TME is dominated by CAFs. Indeed, transcriptomic analyses of colon cancer organoid biobanks show that CMS4 is not well represented (34, 35). This is because the mesenchymal gene expression that defines CMS4 is largely derived from CAFs (36, 37), which are rapidly lost from organoid cultures. The precise roles that CAFs play in mediating aggressive CMS4 behavior therefore remain incompletely understood. To start unravelling how the interplay between tumor cells and CAFs determines tumor behavior, organoid-based model systems are required in which both cell types are co-cultured in a reproducible and robust manner.
Here, we present a long-term co-culture model of colon cancer organoids and CAFs in a highly standardized serum-free medium and an optimized ECM. Under these conditions, cancer cells and CAFs spontaneously organized into superstructures while stiffening and contracting the ECM. Epithelial glandular structures were in direct contact with CAF tracks, closely resembling the histology of colon tumors in patients. Single cell transcriptomic analyses further demonstrated the co-culture-induced generation of clinically relevant cancer cell and CAF phenotypes. Both cell types were required to generate an immunosuppressive milieu in which T cell proliferation was inhibited.
Methods
Human tissue
Patient’s tissue samples were obtained within the biobanking protocol METC 09-145. The protocol was approved by the Medical Ethical Committee of the Utrecht Medical Center (UMCU) in the Netherlands. Written informed consent was obtained from all patients.
CAFs
For CAF isolation, colorectal liver metastasis were cut in to small pieces and digested using Liberase TH (Roche, 5401135001) for 30 min at 37 °C. The cell suspension was incubated in plastic dishes for 30 min. After 30 min the non-adhered cells were washed away and the adherent cells were incubated with CAF medium (Table S1). When the cells reached ~90% confluency they were detached from the plate using Trypsin and replated in a cell culture flask with a thin collagen coat (Corning, 354249) with CAF medium. Low-passage primary CAF cultures (typically P1-P3) were immortalized with lentiviral constructs encoding hTERT and BMI1. For this we used pLOX-CWBmi1 (Addgene #12240) and pLV-hTERT-IRES-hygro (Addgene #85140). Lentiviral production of these constructs was performed using a calcium phosphate transfection protocol in human embryonic kidney 293T (HEK293T) cells using the coding plasmid (15 µg), vsv-G (#12259, 7.5 µg) and psPAX2 (#12260, 7.5 µg). After 24 hours the medium was replaced by CAF medium. The next day the virus containing CAF medium, supplemented with Polybrene (Sigma-Aldrich, 8 µg/ml), was added to the CAFs for 24 hours at 37 °C. After 24 hours the virus containing medium was replaced with fresh CAF medium. Immortalized CAFs were passaged once a week using Trypsin. For the experiments passage numbers 10 through 20 were used. In this manuscript we made use of two CAF lines; LCAF5 and CR16. Both lines were generated from colorectal liver metastases. The primary tumors from LCAF5 and CR16 were located in the sigmoid colon and the ascending colon respectively. Their respective TNM classifications were pT3N0 and pT4N2.
Cell titer glo
To check for differences in cell viability between the medium conditions we performed a CellTiter-Glo 3D (Promega, #G9681) assay according to the manufacturer’s instructions. In short, CAFs were grown at 80-90% confluency in 96-well plates. Culture plates were equilibrated to room temperature (RT) for 30 min after which 100µl of Cell-Titer-Glo reagent was added directly to the medium in the wells. The reagent lysed the cells and generated a luminescent signal proportional to the amount of ATP present. Luminescence was measured with the SpectraMax plate reader (Molecular Devices).
Fibroblast activation protein flow cytometry
To check the mesenchymal nature of the immortalized CAFs we measured Fibroblast Activation Protein (FAP) expression using Flow Cytometry. CAFs were trypsinized, washed two times with FACS buffer (PBS/1% BSA/2.5 mM EDTA) and counted. CAFs were stained with either an anti-FAP antibody (PE-conjugated, R&D Systems, FAB-3715P, 10µl/106 cells) or isotype control (Thermo Fisher, 12-4714-82, 5µl/106 cells). After 30 min incubation on ice, cells were washed two times and fluorescence was measured with the LSRFortessa from Becton Dickinson (BD) and analyzed using FlowJo software version 10.8.1.
Organoids
We made use of 3 organoid lines; CR16, CR39 and P19bT. The organoid lines CR16 and CR39 were generated from resection material of metachronous colorectal liver metastasis. Their corresponding primary tumors were located in the ascending colon. The TNM classifications were pT4N2M0 and pT3N0M0 respectively. P19bt was previously described (35), and originates from a primary tumor. The organoid CR16 and CAF line CR16CAF are paired, they originate from the same colorectal liver metastasis. The other organoids and CAFs are from different patients. Organoids were cultured by embedding in Matrigel (Corning, NY, USA) and were passaged once a week through dissociation with TrypLE Express (Gibco, 12604021) for 5-10 min at 37°C. All organoids were cultured in full organoid medium (Table S1).
To generate green fluorescent organoids we performed two consecutive lentiviral transductions. The plasmids pBOB-Lck-GFP (Addgene #118738) and H2BmNeon were used for plasma membrane GFP and nuclear mNeon respectively. Lentiviral production of these constructs was performed using the same calcium phosphate transfection protocol as described above. 24 hours after the transfection, the medium of the HEK293T cells was replaced by basal organoid medium (Table S1). The next day organoids were dissociated into single cells and the virus containing medium (supplemented with Polybrene (Sigma-Aldrich, 8 µg/ml), N-acetylcysteine (Sigma-Aldrich, 1.25 mM) and ROCK-inhibitor Y-27632 (Sigma-Aldrich, 10 μM) was added to the cells for 24 hours at 37 °C. After 24 hours the cells were washed 2 times in PBS and plated in Matrigel. After the first passage organoids were grown in the presence of bleomycin (Lck-GFP) and puromycin (H2BmNeon), after two weeks organoids were sorted based on their green fluorescence using FACS.
Co-culture
To create the co-cultures, 4 day old organoids were harvested from their Matrigel droplets using dispase (1mg/ml). Organoids were washed, counted and resuspended in co-culture matrix. This co-culture matrix consisted of 1,25mg/ml Collagen-I (Corning, 354249) neutralized with neutralization buffer in a 4:1 vol/vol ratio (5X neutralization buffer = dH20|alpha MEM50mg/ml|2%NaHCO|0.1M HEPES|Ph7.5) and Matrigel (Corning). A total of 600, small organoids were plated in 20ul droplets in a 48 well plate. CAFs were trypsinized and stained with Cellbrite red (Biotium, 30023, 5ul dye/10^6 cells). After washing and counting, 28.000 stained CAFs were resuspended in 200ul co-culture medium (Table S1). For the organoid mono-culture control condition we plated 600 small organoids in co-culture matrix with ‘empty’ co-culture medium and for the CAF mono-culture condition we plated an empty co-culture matrix droplet and added 28.000 CAFs in co-culture medium. After 5 days 100ul fresh co-culture medium was added to the wells. After 8 days the co-cultures were formed and medium and/or cells were harvested for further experiments.
Live cell imaging
For live cell imaging a co-culture droplet was imaged every hour using the Leica SP8 microscope during the course of 16 hours, going from day 2 to day 3. Fiji was used for image processing. Maximal projection was used for Z-positions 4 till 7.
Single cell RNA sequencing
Generating single cell suspensions
In order to sort single cells from the co- and mono-culture conditions, single cell suspensions were made. In brief, on day 8 of the experiment droplets were scooped out of the well and resuspended in Liberase to dissolve the co-culture matrix. Cell clusters and organoids were digested into single cells through incubation and resuspension with TrypLE. To create a single cell suspension for the adherent (2D) CAFs, wells, from which the CAF matrix droplet had been removed, were incubated with Trypsin and cells were harvested from the well plate. Sytox blue (Thermo Fisher, S34857, 1:1000) was added to all single cell suspensions as a live/dead cell marker. Viable single cells were sorted in 384-well cell capture plates using the BD FACSAria II.
Plate processing
The cell capture plates were ordered from Single Cell Discoveries, a single-cell sequencing service provider based in the Netherlands. Each well of a cell capture plate contains a small 50 µl droplet of barcoded primers and 10 μl of mineral oil (Sigma M8410). After sorting, plates were immediately spun and placed on dry ice. Plates were stored at -80° C. Plates were shipped on dry ice to Single Cell Discoveries, where single-cell RNA sequencing was performed according to an adapted version of the SORT-seq protocol (38) with primers described in van den Brink et al., 2017 (39). Cells were heat-lysed at 65° C followed by cDNA synthesis. After second-strand cDNA synthesis, all the barcoded material from one plate was pooled into one library and amplified using in vitro transcription (IVT). Following amplification, library preparation was done following the CEL-Seq2 protocol (40) to prepare a cDNA library for sequencing using TruSeq small RNA primers (Illumina). The DNA library was paired-end sequenced on an Illumina Nextseq™ 500, high output, with a 1x75 bp Illumina kit (read 1: 26 cycles, index read: 6 cycles, read 2: 60 cycles).
Data analysis
During sequencing, Read 1 was assigned 26 base pairs and was used to identify the Illumina library barcode, cell barcode, and UMI. Read 2 was assigned 60 base pairs and used to map to the reference transcriptome Homo sapiens (hg38) with BWA-MEM (41). Data was demultiplexed as described in Grün et al., 2014 (42). Briefly, Mapping and generation of count tables were automated using the MapAndGo script (https://github.com/anna-alemany/transcriptomics/tree/master/mapandgo). Downstream analysis was performed with Seurat v4.1.1 (43). Dimension reduction was performed with UMAP based on the first 30 principal components. Gene Ontology analysis was done using the package clusterProfiler on differential expression analysis (logFC > 0.5, min.pct = 0.25) of the Seurat clusters. To obtain DEGs that distinguished the organoid clusters, comparisons were made only between the organoid clusters. The same was done for the CAF clusters. Signatures were evaluated with the AddModuleScore function and retrieved from the Hallmark dataset of the molecular signature database (44) (9). New signatures were generated by performing differential expression analysis on the Seurat clusters (logFC > 0.75, min.pct = 0.5, min.diff.pct = 0.1).
Analysis of publicly available single cell RNA seq data
Count matrices from Lee et al. (5) were extracted from the gene expression omnibus with identifiers GSE144735 and GSE132465. Data was processed with the Seurat single cell transform workflow (45). Next, stromal cells were extracted with a subset and the generated signatures, as well as the hallmark pathways, were evaluated with AddModuleScore function. The metadata, encompassing the CMS classification from the bulk RNA seq profiling, was extracted from Lee et al. and added to group stromal cells per cell subtype and CMS group.
Immunofluorescence
Matrix droplets of all conditions (organoid mono-culture, CAF mono-culture and co-culture) were scooped out of the 48 wells and embedded in OCT. Matrix droplets were sectioned on a cryostat (7µm) and fixated with 4% paraformaldehyde (Sigma-Aldrich 158127) for 15 min at room RT. Sections were blocked for one hour with 5% normal goat serum and 0.3% Triton X-100 in PBS at RT. Primary antibodies rabbit anti-collagen IV (1:200, Abcam, ab19808), rabbit anti-LDHA (1:200, Cell Signaling, cs3582), rabbit anti-GAPDH (1:100, Cell Signaling, cs5174) were used overnight at 4C and detected using a secondary Goat anti Rabbit AlexaFluor 568 (1:600, Thermo Fisher, A11036) for one hour at RT. Nuclei were stained with DAPI. Sections were mounted with Prolong Gold antifade reagent and images were taken on the Zeiss LSM880 Confocal Laser Microscope. Immunofluorescence images were analyzed using QuPath v.0.3.0 (46). First the number of cells was quantified with the cell detection tool based on DAPI expression. Next the mean intensity of immunostaining per cell was quantified using the compute intensity function. Expression values were normalized to the mono-culture condition.
Cell culture medium assays
Vascular endothelial growth factor alpha
The VEGF Quantikine ELISA kit (R&D Systems, DVE00) was used to detect VEGF-A levels in conditioned media from organoid mono-cultures, CAF mono-cultures and co-cultures. After 8 days, culture media from all three conditions was harvested and frozen at -80C until the assay. Samples were diluted 1:50 to 1:100 with fresh co-culture medium. Standards and samples were added to microplates pre-coated with a VEGF-A capture antibody. Samples were incubated for 2 hours at RT after which unbound substances were washed away. A substrate solution was added and color developed in proportion to the amount of VEGF-A present. Color development was stopped with a stop solution and the optical density of each well was determined with a microplate reader at 450nm. Standards and samples were assayed in duplicate.
Transforming growth factor bèta 1
To detect TGF-B1 levels in conditioned media from all co-culture conditions we used a Human TGF-B1 ELISA kit (Abcam, ab100647). Latent TGF-B1 was activated to the immunoreactive form by adding 1 N HCL into the cell culture supernatant and, after 10 minutes incubation, neutralizing the samples with 1.2 N NaOH/0.5 M HEPES. After activation, samples were diluted 1:5 with Assay Diluent from the kit. Standards and activated samples were added to microplates pre-coated with a TGF-B1 capture antibody. Bound TGF-B1 was detected using a biotinylated anti-TGF-B1 antibody, HRP-conjugated streptavidin and finally a substrate solution for color development proportional to the amount of TGF-B1. The intensity of the color was measured with a microplate reader at 450 nm. Standards and samples were assayed in duplicate.
Lactate
For the detection of lactate in conditioned media we used an enzymatic assay (Sigma-Aldrich, MAK064) according to the manufacturer’s instructions. Conditioned media were diluted 1:4 with fresh co-culture medium, 1ul of the medium was used for the assay. Standards and samples were added to a clear 96-well plate. The assay buffer, enzyme mix and probe were added to the wells and incubated for 30 min at RT. The absorbance was measured at 570nm with a microplate reader. Standards and samples were assayed in duplicate.
T cell proliferation assay
To test the immunosuppressive effect of the conditioned media from the mono-culture and co-culture conditions we used a T cell proliferation assay. Cord blood T cells were harvested through Ficoll-paque separation of Cord Blood Mononuclear Cells (CBMCs) and subsequent CD3 MACS isolation. T cells were stained with CellTraceTM Violet (CTV) (Thermo Fisher, C3457) for 7 minutes at 37C. Cells were washed, counted and 100.000 T cells were plated per 96 well. To stimulate the T cells CD3/CD28 Dynabeads (Thermo Fisher, 40203D) were added in a ratio of 1 bead to 3 T cells, to the medium of all conditions except for the negative control. As a positive control, T cells received T cell medium (Table S1). The negative control condition contained T cell medium without Dynabeads and the medium control condition contained fresh co-culture medium to control for a possible effect of the co-culture medium on the T cells. The organoid, CAF and co-culture condition contained conditioned medium from the P19bt organoid mono-culture, the LCAF5 CAF mono-culture and the P19bt + LCAF5 co-culture condition respectively. All medium conditions were supplemented with 5% human serum (Table S1). After 4 days the T cells were harvested and CTV was measured using the Fortessa flowcytometer from Becton Dickinson (BD). Data analysis was performed using Flowjo software version 10.8.1.
Statistical analysis
All statistical analyses were conducted in R version 4.0.5 for Windows. Significant differences between more than 2 cell clusters were calculated using the Kruskal-Wallis test. One-way ANOVA was used to compare differences in cytokine concentrations between the mono- and co-culture conditions, Šidák correction was used for multiple comparisons.
Results
Establishment of immortalized colorectal cancer-associated fibroblasts
When freshly isolated from tumors, CAFs display a highly variable lifespan. Consequently, they cannot be used for the reproducible generation of long-term co-cultures. Therefore, we immortalized freshly isolated CAFs from colon cancer liver metastases by lentiviral expression of BMI and hTERT. This yielded 2 independent immortalized CAF cultures, LCAF5 and CR16CAF (Figure 1A), expressing high levels of the myofibroblast marker Fibroblast Activation Protein (FAP) (Figure 1B).
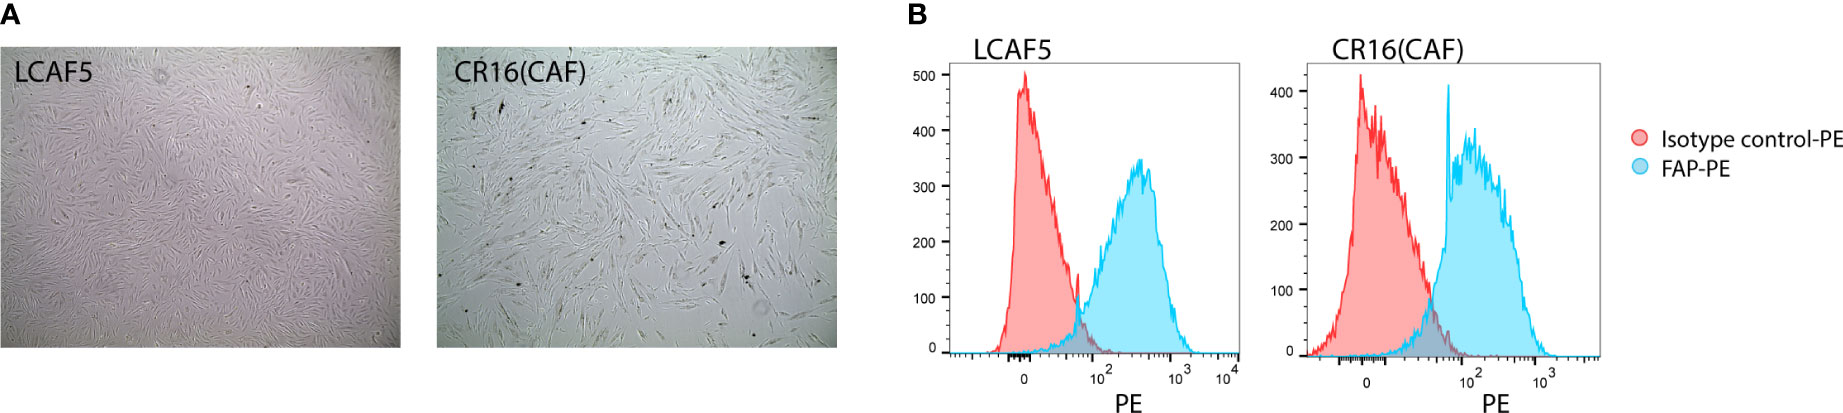
Figure 1 Establishment of immortalized colorectal cancer-associated fibroblasts. (A) Bright field images of two immortalized CAF cell lines, LCAF5 and CR16CAF, taken with the EVOS light microscope. (B) Histograms of FAP expression of both CAF cell lines measured using Flow Cytometry.
Serum-free 3D culture conditions supporting long-term growth of patient-derived organoids and CAFs
Immortalized CAF cultures were established on cell culture plastics in medium containing 10% fetal calf serum (FCS). By contrast, organoids are cultured in a 3D basement membrane-like extracellular matrix (ECM) in medium with a defined growth factor composition that mimics the tissue of interest. Organoid growth media therefore lack undefined components like FCS. Vice versa, niche factors in organoid medium can inhibit fibroblast growth (Figure S1). To establish conditions that would support the long-term 3D culture of both cell types, we started with basal organoid medium (DMEM F12, HEPES, glutamax, penstrep) and added various components that are known to sustain organoid and fibroblast growth. In medium containing B27, fibroblast growth factor (FGF), insulin and platelet-derived growth factors A and B (PDGFA, PDGFB) the CAFs maintained similar proliferative capacity as in FCS-containing medium in which they were established (Figure S1). In addition, the stromal matrix protein collagen-I was added to the Matrigel basement membrane mix to improve CAF adhesion. These adjusted culturing conditions allowed long-term 3D growth of PDOs and CAFs together.
Spontaneous reorganization of cancer cells and CAFs into macroscopic mini-tumors
In order to distinguish cancer cells from CAFs in co-culture, cancer cells were transduced with a lentiviral vector encoding green fluorescent protein (GFP), while CAFs were ‘loaded’ with the dye Cellbrite Red. In the co-culture model, 600 small organoids were first plated in a co-culture matrix that contained Matrigel and collagen-I. 28.000 CAFs were then added to the co-culture medium in suspension (Figure 2A). The CAFs organized into a continuous circle surrounding the organoid-containing matrix droplets (Figure 2B), from where they entered the droplet in the first 2-3 days (Figure 2C, Supplemental Movie 1). Within the droplet, the CAFs organized into stromal tracks, much like what is observed in tumor histology. Simultaneously, the organoids reorganized along those CAF tracks. Ultimately, all individual organoids fused into a single entity surrounding the CAF tracks (Figure 2D, Figure S2), forming macroscopically visible ‘mini tumors’ (Figure 2E). To better characterize the organization of organoids and CAFs, co-culture matrix droplets were embedded in freezing medium (OCT) to create cryosections for immunocytochemistry using anti-FAP (Figure 2F). This revealed the presence of clusters of tumor cells residing in fields of FAP-positive CAFs, similar to normal colon tumor histology. We noted that, during cellular reorganization in the co-cultures, the matrix droplets displayed a significant contraction, yielding highly rigid matrix droplets, indicative of ECM reorganization and stiffening, as is commonly observed in solid cancers (47). Matrix stiffening and contraction were not observed in organoid monocultures, and less so in CAF monocultures, indicating that both cell types were required to induce this cancer-specific biophysical change (Figure 2G). These data show that co-culturing CAFs with tumor cells under optimized conditions results in spontaneous ECM reorganization and assembly of superstructures resembling tumor tissue. It is unclear what is causing the cellular reorganization. Since contraction of the matrix is only observed in conditions with CAFs present, it is difficult to separate the effects caused by the presence of CAFs and the effects caused by the contracting matrix.
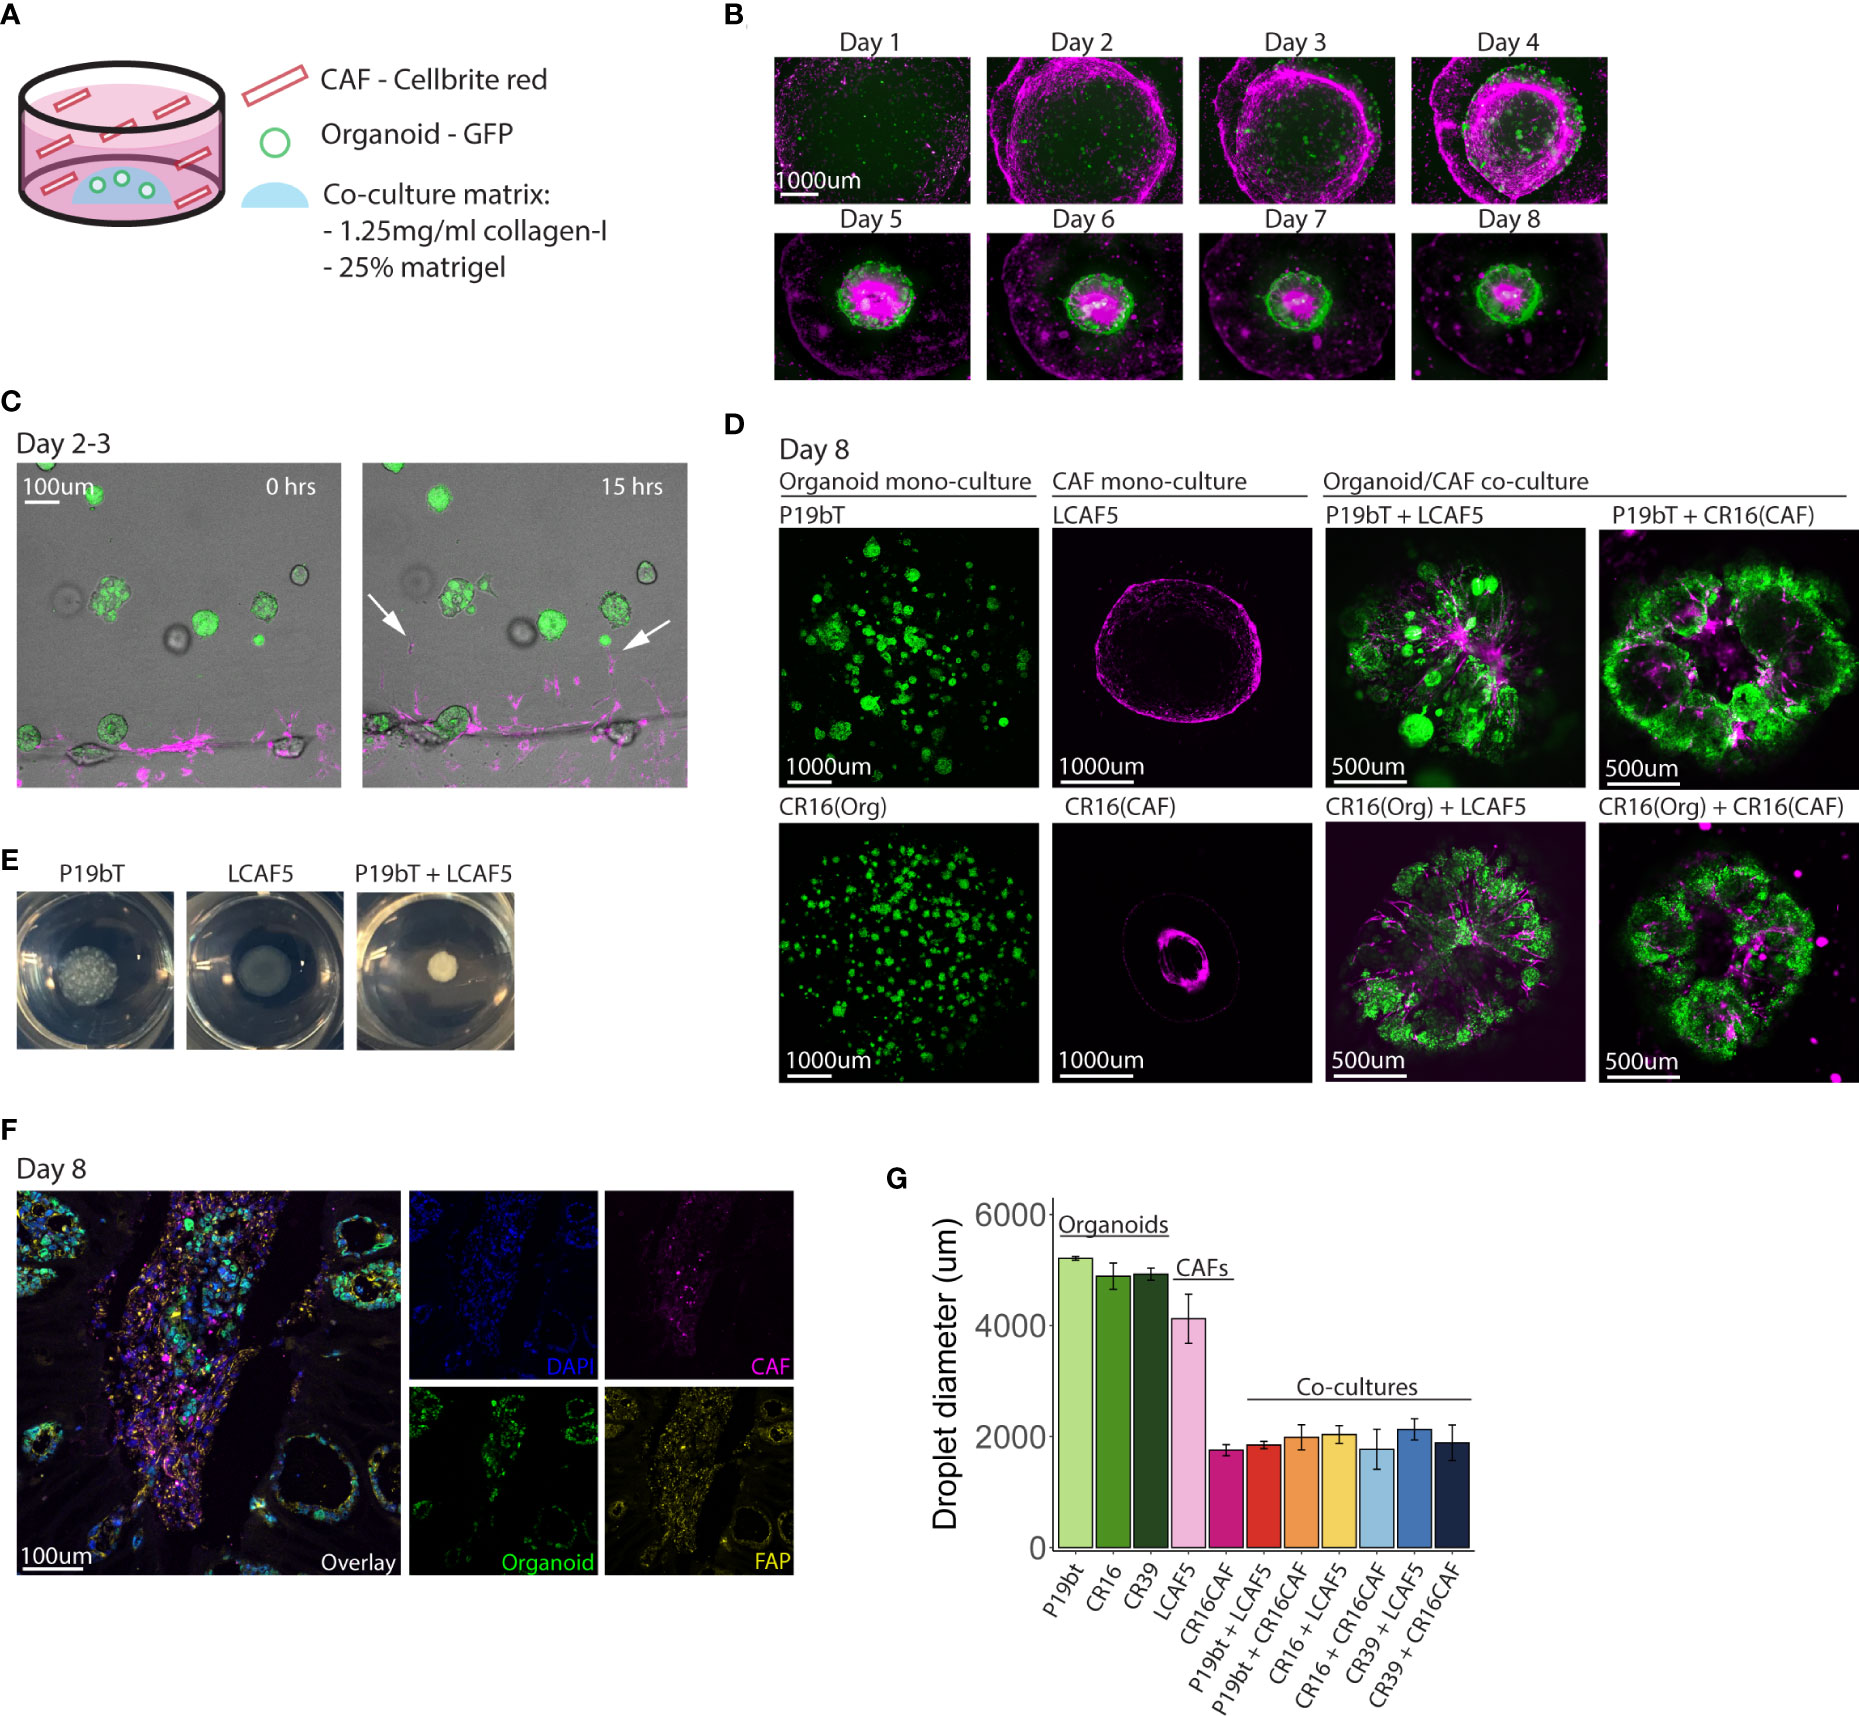
Figure 2 Spontaneous reorganization of cancer cells and CAFs into macroscopic mini-tumors. (A) Schematic overview of the co-culture model. Small GFP expressing organoids (n=600) are plated in a co-culture matrix containing Matrigel and collagen-I, CAFs stained with Cellbrite red dye (n=28,000) are plated in suspension in the well. (B) Fluorescence pictures taken with the EVOS M5000 microscope showing the time line of co-culture formation during the course of 8 days. The organoid P19bT is in green, LCAF5 is in magenta. (C) Two stills from a live cell imaging experiment conducted on the night of day 2 going on day 3 (full movie in Supplemental Data). The organoid is P19bT and the CAF line is LCAF5. During the course of 15 hours CAFs migrate into the matrix droplet, indicated by the white arrows. (D) Confocal images of organoid mono-cultures, CAF mono-cultures and Organoid/CAF co-cultures after 8 days. Organoids are in green, CAFs are in magenta (E) Pictures taken from the P19bT organoid mono-culture droplet, LCAF5 mono-culture droplet and P19bT/LCAF5 co-culture droplet on day 8. The co-culture droplet strongly contracted forming a macroscopically visible ‘mini tumor’. (F) Immunofluorescence image of FAP expression in a co-culture cryosection of P19bT organoid with LCAF5. (G) Diameter quantification of the matrix droplets after 8 days in culture. Bars represent the mean diameter of 5 droplets, error bars represent SD.
Co-culturing increases the fraction of cancer cells with reduced proliferation and partial EMT
Next, we aimed to gain mechanistic insight into how CAFs and tumor cells would influence each other’s phenotype to induce ECM remodeling and cellular reorganization. To this end, we performed single cell RNA sequencing of both cell types isolated from mono-cultures (CAF-2D, CAF-3D, organoids) and co-cultures (CAF/organoids) by FACS sorting (Figure 3A, Figure S3). In total, we analyzed 949 cells. Dimensionality reduction and graph-based clustering analysis identified 3 cancer cell clusters (clusters 1-3) and 3 CAF clusters (clusters 4-6), marked by expression of EPCAM and Vimentin respectively (Figures 3B, C). Co-culturing of cancer cells with CAFs resulted in a decrease of cluster-2 cells while cluster-3 cells strongly expanded (Figure 3D). To gain insight into the phenotypic differences between the distinct clusters of cancer cells and CAFs we performed differential gene expression analysis. We classified the differentially expressed genes (DEG) into functional biological groups using gene ontology (GO) analysis (Figure S4, Table S2). Cluster-1 cancer cells were characterized by the expression of genes associated with hypoxia and glycolysis (Figure 3E). Cluster-2, consisting of 95% mono-culture cancer cells, displayed the highest expression of proliferation–associated genes (Figure 3F). Cluster-3 cancer cells, predominantly composed of cancer cells in co-culture, showed lower expression of epithelial genes (KRT19, EPCAM, CDH1) and higher expression of mesenchymal genes (SPARC, TIMP1, VIM, MMP2) and gene sets (Hallmark EMT) reflecting a (partial) epithelial-to-mesenchymal transition (EMT) (Figures 3G, H). Furthermore, the CMS4-identifying gene set (CMS4 RF), derived from the original random forest classifier (2) (which consists of genes mostly expressed by CAFs) was expressed at significantly higher levels in cancer cells from cluster 3 (p <10×-16) (Figure 3I).
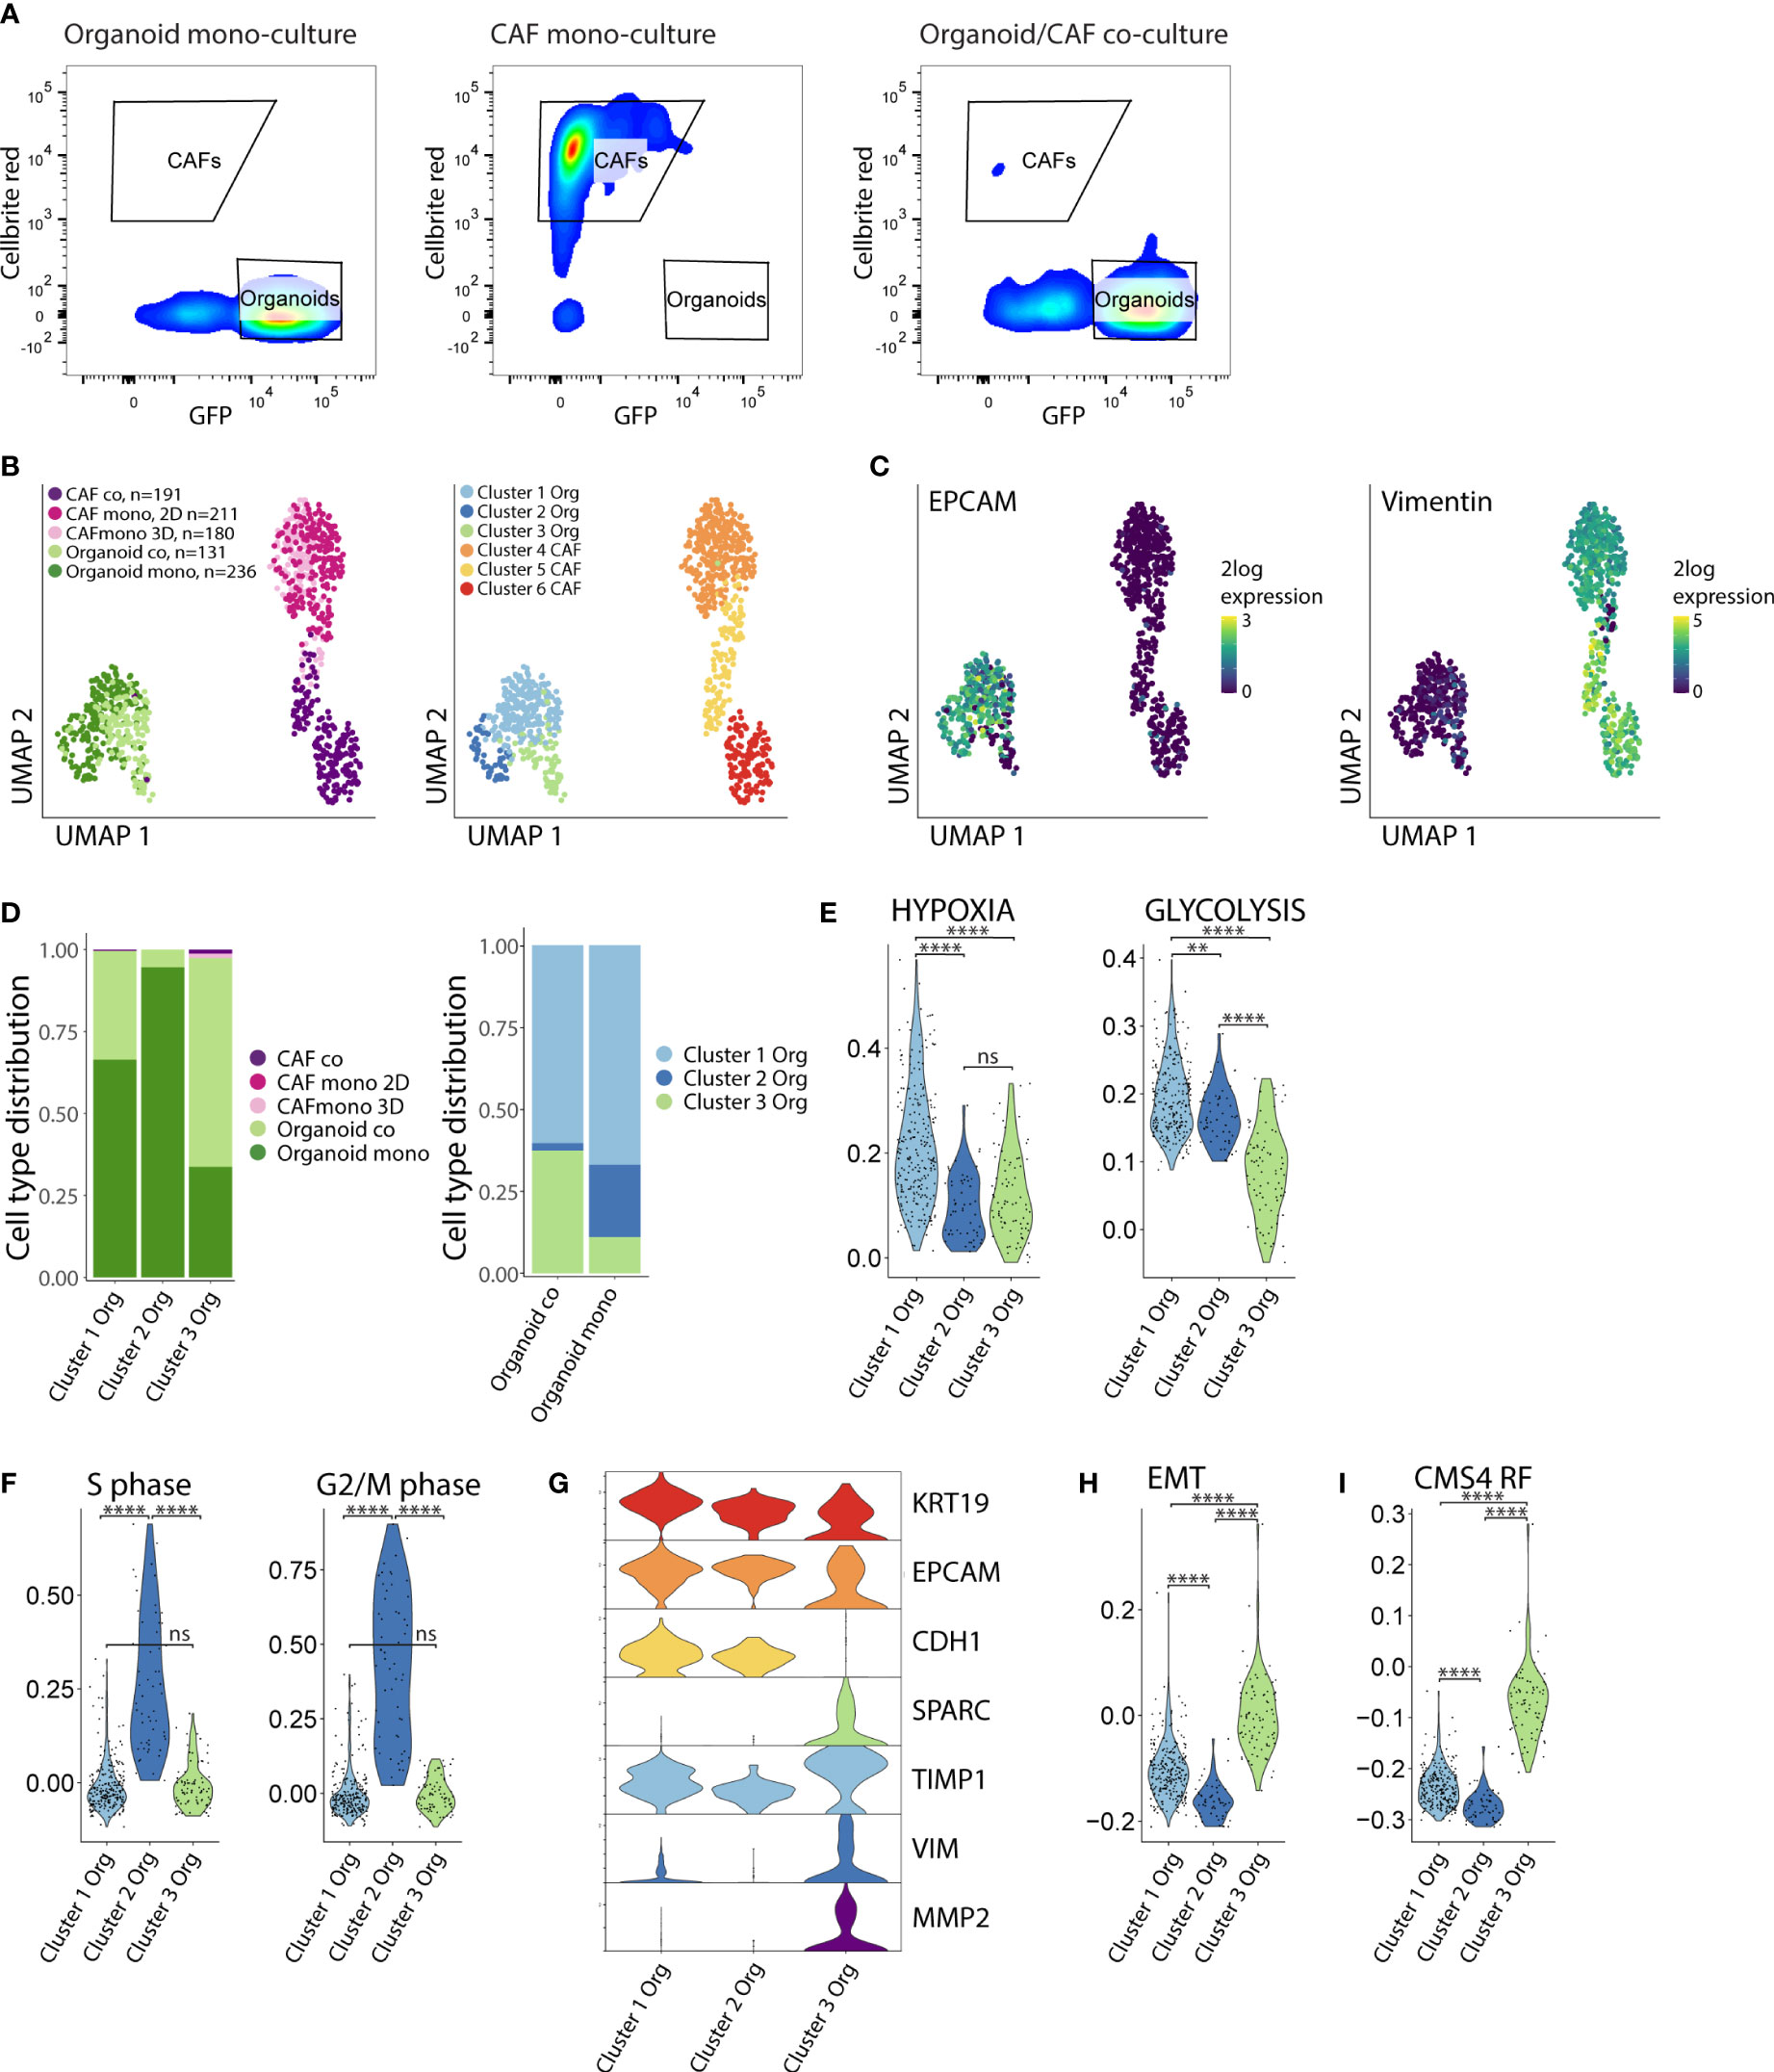
Figure 3 Co-culturing increases the fraction of cancer cells with reduced proliferation and partial EMT. (A) FACS sorting of organoids and CAFs from the mono- and co-culture conditions. Organoids were selected based on their GFP expression, CAFs were selected based on their Cellbrite red expression. Organoid = P19bT, CAF = LCAF5. (B) UMAP plots of single cell RNA seq data from organoids and CAFs from the mono- and co-culture conditions. CAF co = LCAF5 originating from the co-culture droplet, CAF mono 2D = LCAF 5 grown on the plastic of the CAF mono-culture condition, CAF 3D = LCAF5 grown on the matrix droplet of the CAF mono-culture condition, Organoid co = P19bT originating from the co-culture droplet, Organoid mono = P19bT originating from the mono-culture droplet. Graph based clustering analysis defined 3 organoid clusters and 3 CAF clusters. (C) Feature plot showing EPCAM and Vimentin expression. (D) Bar charts with cell type distribution of the 3 organoid clusters across the experimental conditions. (E) Violin plots showing the expression of Hypoxia and Glycolysis hallmark gene signatures across the 3 organoid clusters. (F) Violin plots showing the expression scores of S-phase marker genes (N=43) and G2/M-phase marker genes (N=54) across the 3 organoid clusters. Cluster 2 shows the highest expression of cell cycle genes. (G) Violin plots showing the expression of epithelial and mesenchymal genes across the 3 organoid clusters. Cluster 3 shows a lower expression of epithelial genes and a higher expression of mesenchymal genes compared to cluster 1 and 2. (H) Violin plot showing the expression of the Epithelial to Mesenchymal (EMT) Hallmark gene signature across the 3 organoid clusters. Cluster 3 cancer cells show the highest EMT gene signature scores. (I) Violin plot showing the module score of the CMS4 Random Forest (CMS4 RF) classifier genes (N=143). Cluster 3 shows the highest CMS4 RF signature score. ns, non-significant, Ns = p > 0.05, ** = p < 0.01,**** = p < 0.0001.
Collectively, these analyses show that the interaction between cancer cells and CAFs in co-culture induces a phenotypic shift in the cancer cells, from an epithelial to a hybrid epithelial-mesenchymal state, as is observed in CMS4 colon cancer.
CAFs in co-culture acquire a hypoxic, glycolytic and matrix-remodeling phenotype
We next analyzed the phenotypic differences between CAFs grown in mono-culture and in co-culture. Cluster 4 consisted entirely of CAFs isolated from mono-cultures (2D and 3D), while cluster 6 consisted entirely of CAFs isolated from co-cultures. Cluster 5 consisted of CAFs from both mono- and co-cultures (Figure 4A). All clusters expressed genes associated with ECM organization (Figure S4). Differential gene expression analysis showed major changes in the expression of various extracellular matrix genes, including downregulation of COL1A1 (encoding stromal collagen-1) and upregulation of COL4A1 and COL4A2 (encoding basement membrane collagen-4) in the co-culture cluster 6 (Figure 4B). In addition, CAFs in co-culture expressed very high levels of the collagen-crosslinking enzyme LOX (lysyl oxidase) and the collagen-cleaving enzyme MMP1 (matrix metalloproteinase-1). We used immunofluorescence analysis to visualize the matrix and assess its organization in co-cultures. This showed that CAF-produced collagen-4 formed a basement membrane-like meshwork interacting with cancer cells. (Figure 4C, Figure S5). Organization of the cancer cells along the collagen-4 basement membrane is accompanied by a partial restoration of apico-basal polarity, with the nuclei positioned close to the basal side. In addition, gene sets reflecting hypoxia (Hallmark) and hypoxia-inducible factor 1-alpha (HIF1A) targets (48) were significantly higher in CAFs in co-culture, when compared to those in mono-culture (p <10×-16) (Figure 4D). Further analysis revealed that co-culturing with cancer cells induced a major shift in CAF metabolism with increased expression of genes involved in glycolysis (SLC2A, GAPDH, LDHA, SLC16A3, ENO2, CA12), and the Hallmark gene set glycolysis (Figure 4E). We further examined the difference in CAF metabolism through immunofluorescence analysis. This showed a significantly higher expression of LDHA (Figure 4F) and GAPDH (Figure 4G) in co-cultured CAFs (p <0.0001).
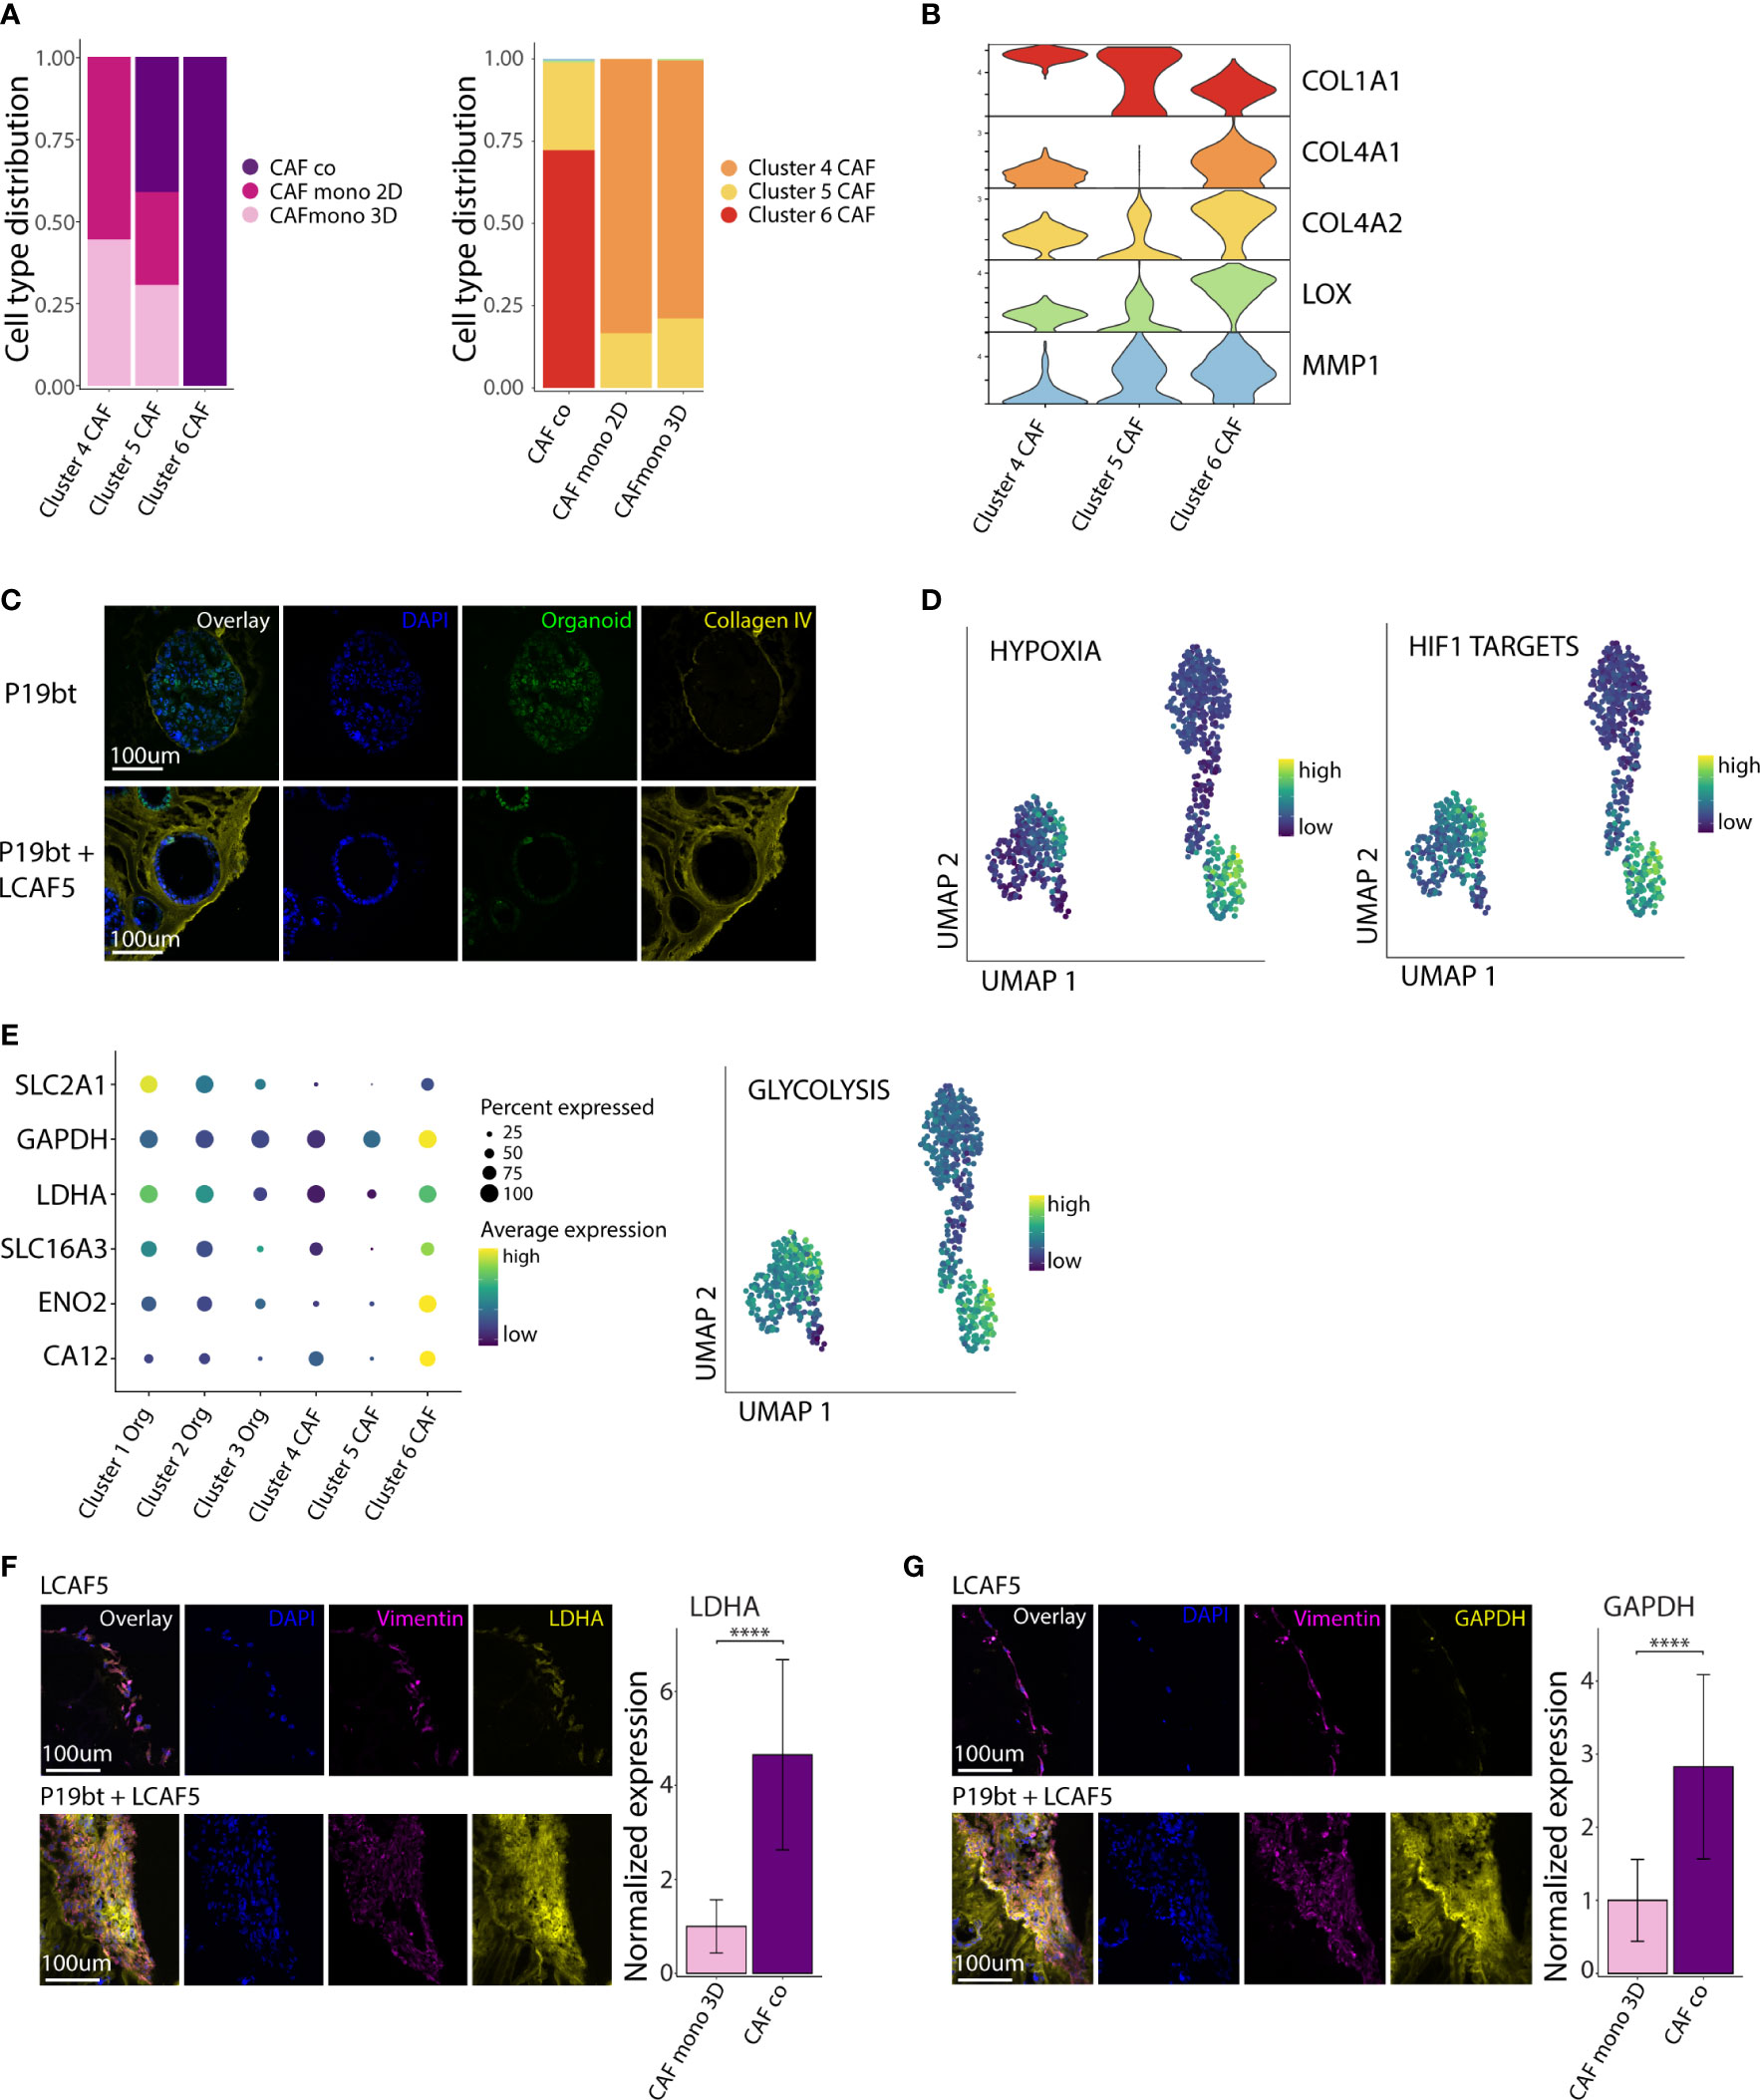
Figure 4 CAFs in co-culture acquire a hypoxic, glycolytic and matrix-remodeling phenotype. (A) Bar charts with cell type distribution of the 3 CAF clusters across the experimental conditions. (B) Stacked violin plot of genes related to Extra Cellular Matrix (ECM) remodeling across the 3 CAF clusters. (C) Immunofluorescence images of Collagen IV staining of the P19bT mono-culture and the P19bT + LCAF5 co-culture. (D) UMAP plots showing the expression of the Hypoxia hallmark gene signature and the HIF1 targets gene signature across all cells. (E) Gene expression dot plot showing the expression of several glycolysis associated genes and UMAP plot of the Glycolysis hallmark gene signature. (F) Immunofluorescence images of LDHA staining of the LCAF5 mono-culture and the P19bT + LCAF5 co-culture. Bar chart showing expression of LDHA in mono-cultured CAFs and co-cultured CAFs. Bars represent the mean normalized LDHA expression, error bars represent SD. **** = p <0.0001. (G) Immunofluorescence images of GAPDH staining of the LCAF5 mono-culture and the P19bT + LCAF5 co-culture. Bar chart showing expression of GAPDH in mono-cultured CAFs and co-cultured CAFs. Bars represent the mean normalized GAPDH expression, error bars represent SD. **** = p <0.0001.
CAFs in co-culture resemble a subpopulation of CAFs enriched in CMS1 and CMS4 tumors
To study whether the CAF phenotypes in mono-culture and co-culture would resemble CAF phenotypes found in human colon cancer, we made use of a publicly available large single cell RNA seq dataset of primary colon tumors from 29 patients (5). First, we generated gene expression signatures for CAFs in mono-culture and CAFs in co-culture (Figure 5A, Table S3). The signature derived from the CAFs in mono-culture was highly expressed in various stromal cell types in human colon cancer, including myofibroblasts, pericytes, and stromal cell types 1-3 (Figure 5B). The signature derived from CAFs in co-culture was expressed in a more restricted fashion, mainly in myofibroblasts. There is some association between the CAF mono-culture and co-culture signatures and the endothelial cell subpopulations. This can be explained by the presence of many genes in both signatures that are associated with cell processes more than cell identity. To be completely certain that there is no endothelial cell contamination we checked the expression of PECAM1 (data not shown) which was absent from the CAFs as well as the organoids. Next, we analyzed the phenotypic differences of myofibroblasts isolated from human colon cancer specimens expressing either high or low levels of the in vitro-derived CAF co-culture signature. A subpopulation of human colon cancer myofibroblasts characterized by high expression of the co-culture signature, expressed significantly higher levels of the Hallmark glycolysis and hypoxia signatures than myofibroblasts with low expression of the CAF co-culture signature (p <10×-16) (Figure 5C). Next, we studied whether the subpopulation of hypoxic glycolytic CAFs in human colon cancer would be enriched in (a) particular molecular subtype of colon cancer. We found that fibroblasts expressing high levels of the CAF co-culture signature were mainly derived from CMS1 and CMS4 tumors (Figure 5D). In line with this result, CMS1 and CMS4-derived myofibroblasts expressed the highest levels of hypoxia and glycolysis signatures (Figure 5E). Together, the data indicate that the CAFs in co-culture resemble a subpopulation of CAFs with a hypoxic glycolytic phenotype that are enriched in human CMS1 and CMS4 colon cancer.
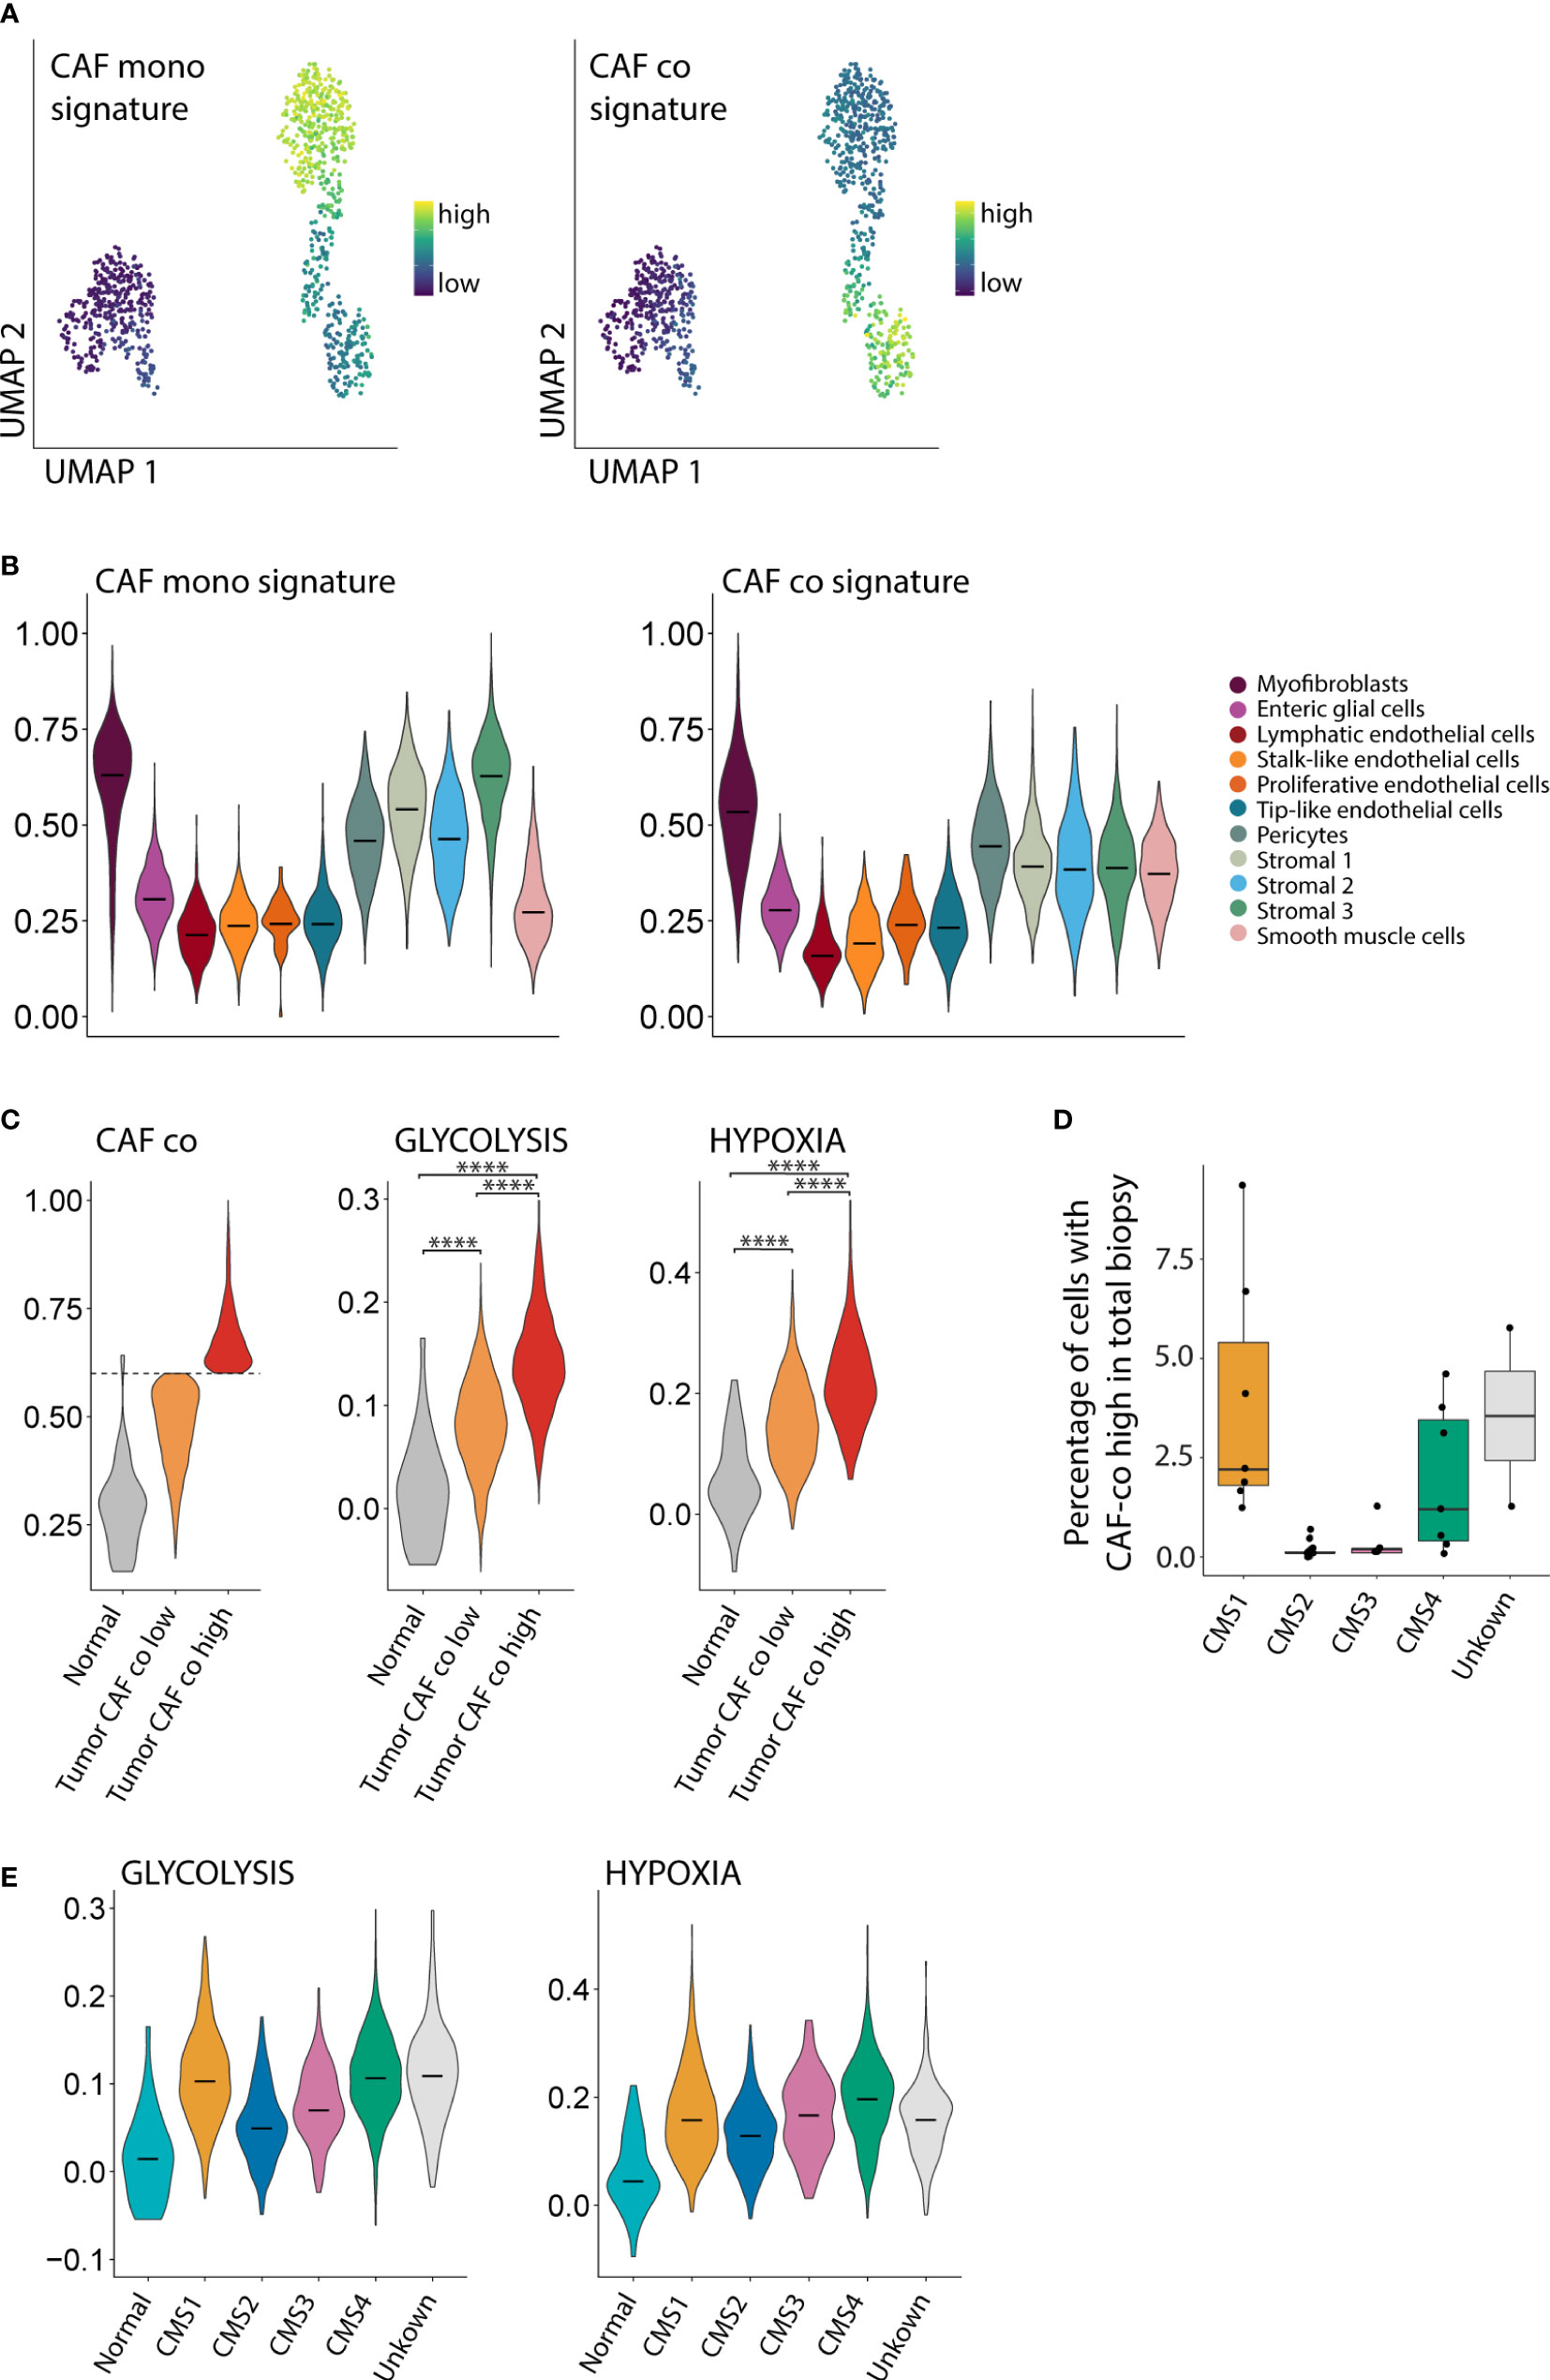
Figure 5 CAFs in co-culture resemble a subpopulation of CAFs enriched in CMS1 and CMS4 tumors. (A) UMAP plot showing the expression of mono- and co-culture CAF signatures. (B) Violin plot showing the expression of the mono- and co-culture CAF signature in stromal cells from a large single cell RNA seq dataset of primary colorectal cancer (N=29 patients, N = 13,583 cells). (C) Violin plot showing the expression of the CAF co-culture signature in myofibroblasts from normal tissue and in tumor myofibroblasts classified as CAF co low and CAF co high. (D) Boxplot showing the fraction of stromal cells classified as CAF co high within the total biopsy (epithelial, immune and stromal cells combined). (E) Violin plots showing the association between the Glycolysis and Hypoxia hallmark with the CMS1 and CMS4 molecular subtypes. **** = p <0.0001.
Generation of an immunosuppressive microenvironment in co-cultures
Several features of the co-cultures described above have previously been associated with immunosuppression in cancer, including a stiffening of the ECM (49, 50), hypoxia (51), and glycolytic metabolism (52, 53). Gene expression analysis showed that especially CAFs in co-culture (cluster-6) express very high levels of genes involved in immunosuppression, including CXCL8 (interleukin-8 (IL8)), PTGS2 (cyclooxygenase-2), TGFB1 and VEGFA (Figure 6A). Analysis of the media conditioned by mono- or co-cultures showed that co-cultures generally secrete higher levels of TGFβ1 (Figure 6B), VEGFA (Figure 6C), and lactate (Figure 6D, E) than mono-cultures, indicating the generation of a potentially immunosuppressive milieu. We see differences in the amount of secreted factors between the co-cultures with different CAF lines e.g. CR16CAF secretes higher levels of TGFB1 compared to LCAF5, reflecting the heterogeneity of CAFs. To test the immunosuppressive potential directly we analyzed the effect of the conditioned media on the activation of T cells isolated from four distinct donors. Media isolated from CAF or cancer cell mono-cultures had no effect or a moderate inhibitory effect on T cell proliferation respectively. By contrast, media isolated from CAF/cancer cell co-cultures potently inhibited T cell proliferation in all four cases (Figures 6F, G, S6, S7, Table S4). These data show that part of the phenotype changes caused by co-culturing CAFs and cancer cells, lead to the generation of an immunosuppressive microenvironment.
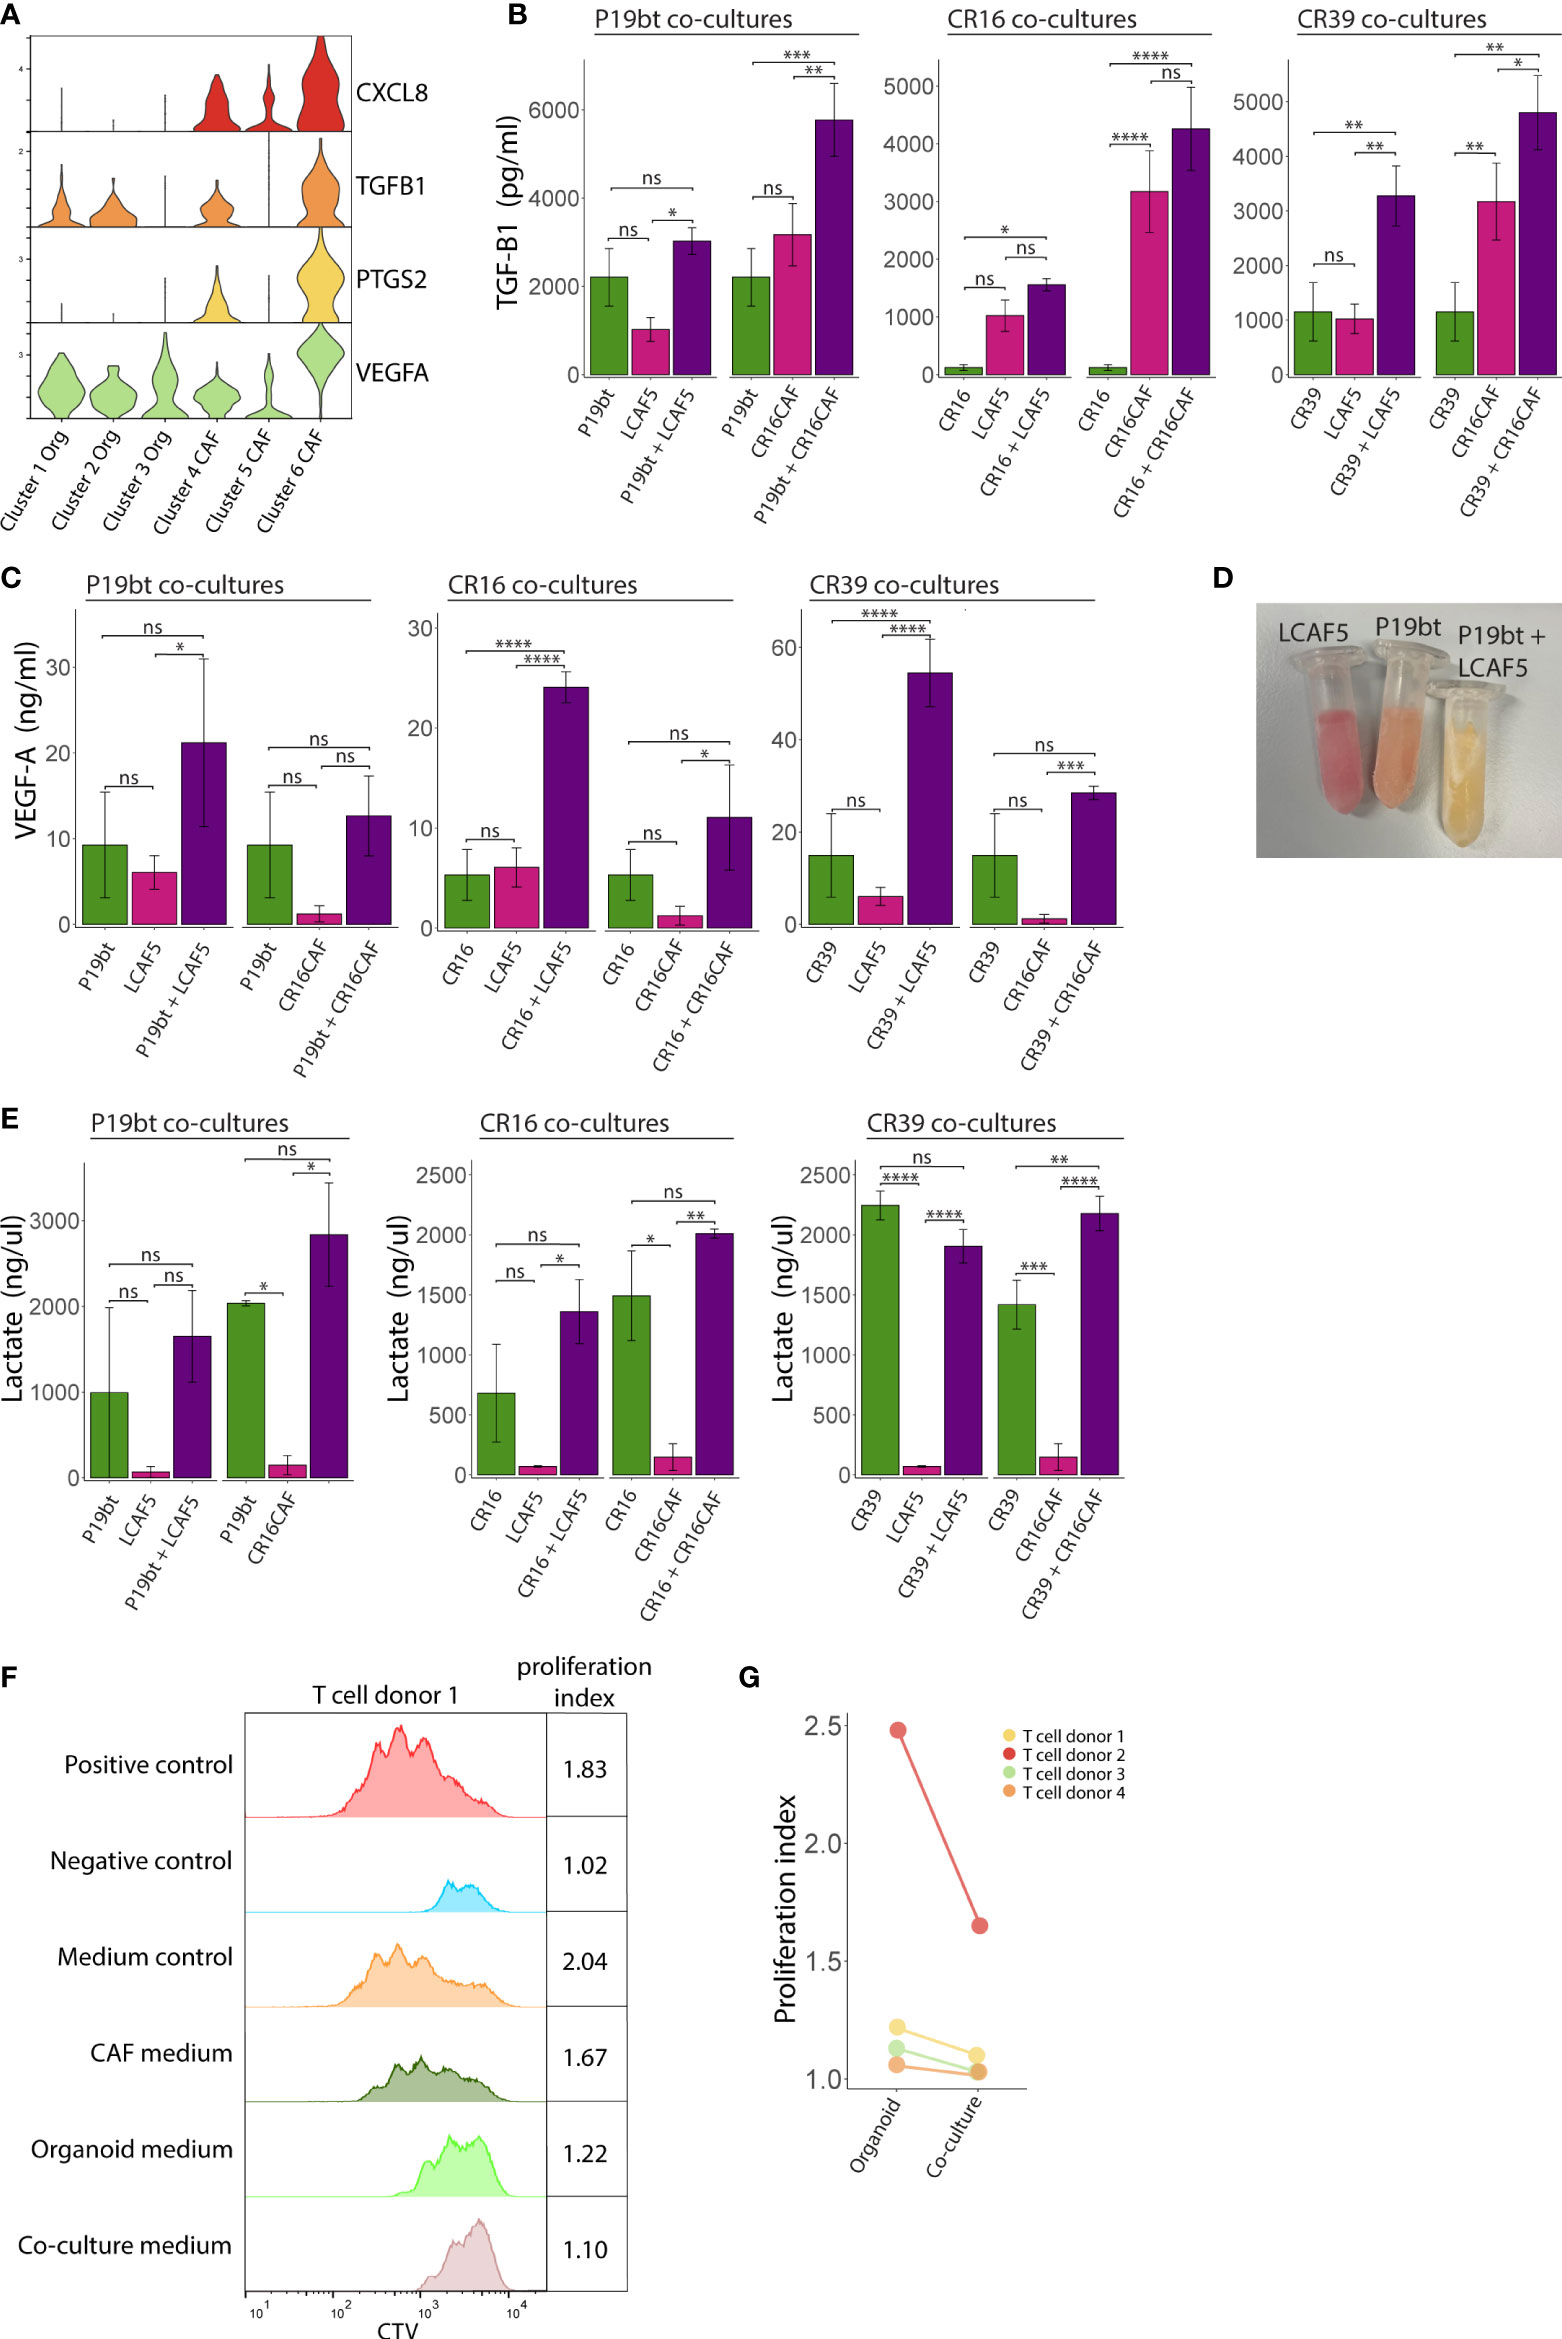
Figure 6 Generation of an immunosuppressive microenvironment in co-cultures. (A) Stacked Violin plots of immunosuppressive genes showing an increased expression by the co-cultured CAFs (Cluster 6). (B) Bar charts showing the TGF-B1 concentration in the medium from the mono- and co-culture conditions. Bars represent the mean concentration of 3 experiments, error bars represent SD. (C) Bar charts showing the VEGFA concentration in the medium from the mono- and co-culture conditions. Bars represent the mean concentration of 3 experiments, error bars represent SD. (D) Picture of Eppendorf tubes containing the conditioned medium of the CAF mono-culture condition LCAF5, the organoid mono-culture condition P19bT and the co-culture condition P19bT/LCAF5. The pH indicator in the medium clearly shows a decreased pH in the co-culture condition compared to the mono-culture conditions. (E) Bar charts showing the lactate concentration in the medium from the mono- and co-culture conditions, error bars represent SD. (F) Histogram showing the Cell Trace Violet (CTV) expression of one representative T cell proliferation experiment. The organoid conditioned medium peaks show a moderate inhibitory effect on T cell proliferation whereas the co-culture conditioned medium shows the strongest inhibition that somewhat resembles the peak of the negative control. (G) Dot plot showing T cell proliferation indices of the experimental conditions with organoid and co-culture conditioned medium, from four independent experiments. ns, non-significant, Ns = p > 0.05, * = p < 0.05, ** = p < 0.01, *** = p < 0.001, **** = p < 0.0001.
Discussion
Organoid technology has revolutionized cancer research in the past decade (54). However, organoid cultures are typically optimized for growth and expansion of epithelial (cancer) cells. Cells from the tumor microenvironment (including fibroblasts) are generally rapidly lost from organoid cultures. Therefore, the generation of advanced co-culture models in which non-epithelial cell types are represented and maintained is a major challenge in the organoid research field (55). In the current report we present a robust long-term co-culture model involving CRC organoids and stromal CAFs and show that multiple aspects of the immunosuppressive nature of stroma-rich cancers are recapitulated.
In previous reports CAFs were co-cultured with traditional colon cancer cell lines in collagen gels (56) or with colon cancer organoids in a transwell system, which prevents physical interactions between the cell types (57). Interestingly, in the former report (56), bulk gene expression profiling of 3-day old co-cultures showed that gene-sets reflecting hypoxia, ECM deposition, angiogenesis, and EMT were highly expressed in the co-cultures, very similar to what we find in the co-cultures described here. Additional reports confirm the induction of an EMT phenotype by CAF secreted factors in vitro (58). In our model we observed a phenotypic shift of cancer cells towards a partial EMT state upon co-culturing with CAFs. At the same time we observed a restoration of organoid polarity in the co-culture droplets. Intuitively these two phenomena seem to be in conflict with each other. However collective cell migration, or cluster migration, in which cell-cell junctions and polarity are retained in combination with the increase of mesenchymal markers to facilitate migration, shows a strong metastatic potential and is associated with partial EMT (59, 60). Robustness of the co-culture model is ensured by the immortalization of tumor-derived CAF cultures, allowing the generation of long-term and reproducible co-cultures. In addition, the composition of both the serum-free medium and the ECM is completely defined. Moreover, the system is highly versatile as it allows the use of existing living PDO biobanks to generate models for specific colon cancer subtypes, in co-culture with specific types of immortalized CAFs.
The induction of a tumor-suppressive microenvironment in the co-cultures was paralleled by a partial EMT in the tumor cells, implying that immunosuppression and aggressive cancer cell behavior are closely intertwined processes. Moreover, the reciprocal influence of cancer cells and CAFs is apparently sufficient to drive both hallmarks of aggressive CRC in the absence of other stromal and immune cell types. Much research has focused on CAF heterogeneity and the presence of multiple CAF subtypes in the tumor microenvironment. Two major CAF subtypes, first mentioned in the context of pancreatic ductal adenocarcinoma (PDAC), are the myofibroblastic CAF (myCAF) with a matrix remodelling and contractile phenotype and the immunomodulating CAF (iCAF) with an immunosuppressive phenotype (61). The CAFs in our co-culture model express matrix remodeling genes associated with the myCAF phenotype and besides show a very strong contractile phenotype. However, the co-cultured CAFs also start expressing more inflammatory cytokines such as IL-8 and TGF-B. From this we conclude that our co-cultured CAFs show features of both myCAF and iCAF, perhaps best resembling the myofibroblast subpopulation expressing genes enriched for inflammatory cytokines (MF2) as described in the paper by Lee et al. (5). The results also show that the co-culture CAFs represent a specific subpopulation of glycolytic myofibroblasts that is present in human CRC, and enriched in CMS1 and CMS4. Interestingly, ‘aerobic glycolysis’ by CAFs can contribute to lactate production, which inhibits T cell function within the TME (53), but can also be taken up by tumor cells as an energy fuel in a process called ‘the reverse Warburg effect’ (62, 63). It is unclear what exactly causes this shift in CAF metabolism in our model. One possible explanation would be the stiffening of the ECM caused by the strong contraction of the co-culture droplets. Stiffening of the ECM is known to induce changes in metabolism such as increased glycolysis and hypoxia (64–67). We believe that the contraction and matrix stiffening is a valuable part of the model since mesenchymal tumors are characterized by a stiff and desmoplastic phenotype in vivo that we can now recapitulate in vitro. Additional work is needed to assess how cancer cells and CAFs change their energy metabolism upon co-culture, how these changes are coupled, and how they influence T cell infiltration and function. Proteogenomic analysis of colon cancer has revealed that glycolytic activity is negatively correlated with CD8 T cell infiltration, specifically in MSI-H cancers (4), making up the vast majority of CMS1 (2). This suggests that future studies on immunosuppression using colon cancer co-culture models should take the molecular subtypes into account as a relevant variable. The large ‘living biobanks’ of colon cancer-derived organoids (34, 35) provide ideal resources for starting to address this.
Although the co-culture system presented here faithfully recapitulates multiple aspects of the immunosuppressive TME in stroma-rich colon cancer, it does not capture the full complexity of the TME in growing tumors and metastases. For instance, tumor-associated macrophages, myeloid-derived suppressor cells and tumor-associated neutrophils may all contribute to immunosuppression within the TME (68), but are not represented in the current co-culture system. Furthermore, much of what we know about the immune contexture in cancer comes from the analysis of primary tumors, while systemic (immuno-) therapies target metastases growing at distant sites. The specific organ context is likely to have major impact on the immune microenvironment of growing distant metastases. For instance, bone metastases in preclinical models of prostate cancer are refractory to immune checkpoint blockade due to high levels of TGFβ in the bone microenvironment blocking TH1 differentiation (69). In addition, regulatory T cells play an important role in establishing immune tolerance in metastases growing in the liver, and this (local) phenomenon also suppresses systemic anti-tumor immunity (70). Likewise, the presence of peritoneal metastases and the formation of ascites is associated with a poor response to immune checkpoint blockade in CRC (71, 72).
In general, the influence of specific organ microenvironments on shaping the immune contexture of distant metastases and their response to immune checkpoint blockade is an important theme in immuno-oncology research (73, 74). The co-culture model system that we have developed in the current report forms a starting point for addressing this issue empirically. By rationally adding specific cell types, and/or cytokines and/or extracellular matrix components, organ-specific microenvironments can now start to be modelled to assess their effect on T cell behavior. Advanced co-culture systems combined with advanced technologies for analyzing tumor cell killing by T cells (75) will be instrumental in defining the mechanisms causing immunosuppression in a cancer subtype- and organ site-specific manner. Ultimately, this will guide the development of novel informed combination treatment strategies involving immunotherapies.
Data availability statement
Data is deposited in GEO under the accession GSE214569.
Ethics statement
The studies involving human participants were reviewed and approved by Medical Ethical Committee of the Utrecht Medical Center. The patients/participants provided their written informed consent to participate in this study.
Author contributions
EW, LW, SV and JL generated the immortalized CAF lines. ES, EW, ED, LW, IA, AS, NP, JH, MMCV and SV performed the experiments. ES, MV, AS, SE and OK analyzed and interpreted the data. ES, MV and OK drafted the manuscript. RF, JR, SN, HS, MG, IB, SE and OK supervised the study and revised the manuscript. All authors contributed to the article and approved the submitted version.
Funding
This research was, in part, funded by Health Holland, project number LSHM18010.
Conflict of interest
The authors declare that the research was conducted in the absence of any commercial or financial relationships that could be construed as a potential conflict of interest.
Publisher’s note
All claims expressed in this article are solely those of the authors and do not necessarily represent those of their affiliated organizations, or those of the publisher, the editors and the reviewers. Any product that may be evaluated in this article, or claim that may be made by its manufacturer, is not guaranteed or endorsed by the publisher.
Supplementary material
The Supplementary Material for this article can be found online at: https://www.frontiersin.org/articles/10.3389/fimmu.2023.1053920/full#supplementary-material
References
1. Sung H, Ferlay J, Siegel RL, Laversanne M, Soerjomataram I, Jemal A, et al. Global cancer statistics 2020: GLOBOCAN estimates of incidence and mortality worldwide for 36 cancers in 185 countries. CA Cancer J Clin (2021) 71(3):209–49. doi: 10.3322/caac.21660
2. Guinney J, Dienstmann R, Wang X, de Reynies A, Schlicker A, Soneson C, et al. The consensus molecular subtypes of colorectal cancer. Nat Med (2015) 21(11):1350–6. doi: 10.1038/nm.3967
3. Zhang B, Wang J, Wang X, Zhu J, Liu Q, Shi Z, et al. Proteogenomic characterization of human colon and rectal cancer. Nature (2014) 513(7518):382–7. doi: 10.1038/nature13438
4. Vasaikar S, Huang C, Wang X, Petyuk VA, Savage SR, Wen B, et al. Proteogenomic analysis of human colon cancer reveals new therapeutic opportunities. Cell (2019) 177(4):1035–49.e19. doi: 10.1016/j.cell.2019.03.030
5. Lee HO, Hong Y, Etlioglu HE, Cho YB, Pomella V, Van den Bosch B, et al. Lineage-dependent gene expression programs influence the immune landscape of colorectal cancer. Nat Genet (2020) 52(6):594–603. doi: 10.1038/s41588-020-0636-z
6. Joanito I, Wirapati P, Zhao N, Nawaz Z, Yeo G, Lee F, et al. Single-cell and bulk transcriptome sequencing identifies two epithelial tumor cell states and refines the consensus molecular classification of colorectal cancer. Nat Genet (2022) 54(7):963–75. doi: 10.1038/s41588-022-01100-4
7. Pages F, Mlecnik B, Marliot F, Bindea G, Ou FS, Bifulco C, et al. International validation of the consensus immunoscore for the classification of colon cancer: a prognostic and accuracy study. Lancet (2018) 391(10135):2128–39. doi: 10.1016/S0140-6736(18)30789-X
8. Punt CJ, Koopman M, Vermeulen L. From tumour heterogeneity to advances in precision treatment of colorectal cancer. Nat Rev Clin Oncol (2017) 14(4):235–46. doi: 10.1038/nrclinonc.2016.171
9. Biller LH, Schrag D. Diagnosis and treatment of metastatic colorectal cancer: a review. JAMA (2021) 325(7):669–85. doi: 10.1001/jama.2021.0106
10. Gallicchio L, Devasia TP, Tonorezos E, Mollica MA, Mariotto A. Estimation of the numbers of individuals living with metastatic cancer in the united states. J Natl Cancer Instit (2022) 114:1476–83. doi: 10.1093/jnci/djac158
11. Andre T, Shiu KK, Kim TW, Jensen BV, Jensen LH, Punt C, et al. Pembrolizumab in microsatellite-Instability-High advanced colorectal cancer. N Engl J Med (2020) 383(23):2207–18. doi: 10.1056/NEJMoa2017699
12. Diaz LA Jr., Shiu KK, Kim TW, Jensen BV, Jensen LH, Punt C, et al. Pembrolizumab versus chemotherapy for microsatellite instability-high or mismatch repair-deficient metastatic colorectal cancer (KEYNOTE-177): final analysis of a randomised, open-label, phase 3 study. Lancet Oncol (2022) 23(5):659–70. doi: 10.1016/S1470-2045(22)00197-8
13. Le DT, Uram JN, Wang H, Bartlett BR, Kemberling H, Eyring AD, et al. PD-1 blockade in tumors with mismatch-repair deficiency. N Engl J Med (2015) 372(26):2509–20. doi: 10.1056/NEJMoa1500596
14. Overman MJ, Lonardi S, Wong KYM, Lenz HJ, Gelsomino F, Aglietta M, et al. Durable clinical benefit with nivolumab plus ipilimumab in DNA mismatch repair-Deficient/Microsatellite instability-high metastatic colorectal cancer. J Clin Oncol (2018) 36(8):773–9. doi: 10.1200/JCO.2017.76.9901
15. Ganesh K, Stadler ZK, Cercek A, Mendelsohn RB, Shia J, Segal NH, et al. Immunotherapy in colorectal cancer: rationale, challenges and potential. Nat Rev Gastroenterol Hepatol (2019) 16(6):361–75. doi: 10.1038/s41575-019-0126-x
16. Chen DS, Mellman I. Elements of cancer immunity and the cancer-immune set point. Nature (2017) 541(7637):321–30. doi: 10.1038/nature21349
17. Janssen E, Subtil B, de la Jara Ortiz F, Verheul HMW, Tauriello DVF. Combinatorial immunotherapies for metastatic colorectal cancer. Cancers (Basel) (2020) 12(7). doi: 10.3390/cancers12071875
18. Roulis M, Kaklamanos A, Schernthanner M, Bielecki P, Zhao J, Kaffe E, et al. Paracrine orchestration of intestinal tumorigenesis by a mesenchymal niche. Nature (2020) 580(7804):524–9. doi: 10.1038/s41586-020-2166-3
19. Becker WR, Nevins SA, Chen DC, Chiu R, Horning AM, Guha TK, et al. Single-cell analyses define a continuum of cell state and composition changes in the malignant transformation of polyps to colorectal cancer. Nat Genet (2022) 54(7):985–95. doi: 10.1038/s41588-022-01088-x
20. Pape J, Magdeldin T, Stamati K, Nyga A, Loizidou M, Emberton M, et al. Cancer-associated fibroblasts mediate cancer progression and remodel the tumouroid stroma. Br J cancer (2020) 123(7):1178–90. doi: 10.1038/s41416-020-0973-9
21. Hurtado P, Martinez-Pena I, Pineiro R. Dangerous liaisons: circulating tumor cells (CTCs) and cancer-associated fibroblasts (CAFs). Cancers (Basel) (2020) 12(10). doi: 10.3390/cancers12102861
22. Su S, Chen J, Yao H, Liu J, Yu S, Lao L, et al. CD10(+)GPR77(+) cancer-associated fibroblasts promote cancer formation and chemoresistance by sustaining cancer stemness. Cell (2018) 172(4):841–56.e16. doi: 10.1016/j.cell.2018.01.009
23. Garvey CM, Lau R, Sanchez A, Sun RX, Fong EJ, Doche ME, et al. Anti-EGFR therapy induces EGF secretion by cancer-associated fibroblasts to confer colorectal cancer chemoresistance. Cancers (Basel) (2020) 12(6). doi: 10.3390/cancers12061393
24. Calon A, Espinet E, Palomo-Ponce S, Tauriello DV, Iglesias M, Cespedes MV, et al. Dependency of colorectal cancer on a TGF-beta-driven program in stromal cells for metastasis initiation. Cancer Cell (2012) 22(5):571–84. doi: 10.1016/j.ccr.2012.08.013
25. Barrett R, Pure E. Cancer-associated fibroblasts: key determinants of tumor immunity and immunotherapy. Curr Opin Immunol (2020) 64:80–7. doi: 10.1016/j.coi.2020.03.004
26. Monteran L, Erez N. The dark side of fibroblasts: cancer-associated fibroblasts as mediators of immunosuppression in the tumor microenvironment. Front Immunol (2019) 10:1835. doi: 10.3389/fimmu.2019.01835
27. Kieffer Y, Hocine HR, Gentric G, Pelon F, Bernard C, Bourachot B, et al. Single-cell analysis reveals fibroblast clusters linked to immunotherapy resistance in cancer. Cancer discovery (2020) 10(9):1330–51. doi: 10.1158/2159-8290.CD-19-1384
28. Huang H, Wang Z, Zhang Y, Pradhan RN, Ganguly D, Chandra R, et al. Mesothelial cell-derived antigen-presenting cancer-associated fibroblasts induce expansion of regulatory T cells in pancreatic cancer. Cancer Cell (2022) 40(6):656–73.e7. doi: 10.1016/j.ccell.2022.04.011
29. Biffi G, Tuveson DA. Diversity and biology of cancer-associated fibroblasts. Physiol Rev (2021) 101(1):147–76. doi: 10.1152/physrev.00048.2019
30. Becht E, de Reynies A, Giraldo NA, Pilati C, Buttard B, Lacroix L, et al. Immune and stromal classification of colorectal cancer is associated with molecular subtypes and relevant for precision immunotherapy. Clin Cancer Res (2016) 22(16):4057–66. doi: 10.1158/1078-0432.CCR-15-2879
31. van den Bulk J, Verdegaal EME, Ruano D, Ijsselsteijn ME, Visser M, van der Breggen R, et al. Neoantigen-specific immunity in low mutation burden colorectal cancers of the consensus molecular subtype 4. Genome Med (2019) 11(1):87. doi: 10.1186/s13073-019-0697-8
32. Tauriello DVF, Palomo-Ponce S, Stork D, Berenguer-Llergo A, Badia-Ramentol J, Iglesias M, et al. TGFbeta drives immune evasion in genetically reconstituted colon cancer metastasis. Nature (2018) 545:538–43. doi: 10.1136/esmoopen-2018-EACR25.8
33. Lau HCH, Kranenburg O, Xiao H, Yu J. Organoid models of gastrointestinal cancers in basic and translational research. Nat Rev Gastroenterol Hepatol (2020) 17(4):203–22. doi: 10.1038/s41575-019-0255-2
34. Fujii M, Shimokawa M, Date S, Takano A, Matano M, Nanki K, et al. A colorectal tumor organoid library demonstrates progressive loss of niche factor requirements during tumorigenesis. Cell Stem Cell (2016) 18(6):827–38. doi: 10.1016/j.stem.2016.04.003
35. van de Wetering M, Francies HE, Francis JM, Bounova G, Iorio F, Pronk A, et al. Prospective derivation of a living organoid biobank of colorectal cancer patients. Cell (2015) 161(4):933–45. doi: 10.1016/j.cell.2015.03.053
36. Calon A, Lonardo E, Berenguer-Llergo A, Espinet E, Hernando-Momblona X, Iglesias M, et al. Stromal gene expression defines poor-prognosis subtypes in colorectal cancer. Nat Genet (2015) 47(4):320–9. doi: 10.1038/ng.3225
37. Isella C, Terrasi A, Bellomo SE, Petti C, Galatola G, Muratore A, et al. Stromal contribution to the colorectal cancer transcriptome. Nat Genet (2015) 47(4):312–9. doi: 10.1038/ng.3224
38. Muraro MJ, Dharmadhikari G, Grun D, Groen N, Dielen T, Jansen E, et al. A single-cell transcriptome atlas of the human pancreas. Cell Syst (2016) 3(4):385–94 e3. doi: 10.1016/j.cels.2016.09.002
39. van den Brink SC, Sage F, Vertesy A, Spanjaard B, Peterson-Maduro J, Baron CS, et al. Single-cell sequencing reveals dissociation-induced gene expression in tissue subpopulations. Nat Methods (2017) 14(10):935–6. doi: 10.1038/nmeth.4437
40. Hashimshony T, Senderovich N, Avital G, Klochendler A, de Leeuw Y, Anavy L, et al. CEL-Seq2: sensitive highly-multiplexed single-cell RNA-seq. Genome Biol (2016) 17:77. doi: 10.1186/s13059-016-0938-8
41. Anders S, Huber W. Differential expression analysis for sequence count data. Genome Biol (2010) 11(10):R106. doi: 10.1186/gb-2010-11-10-r106
42. Grun D, Kester L, van Oudenaarden A. Validation of noise models for single-cell transcriptomics. Nat Methods (2014) 11(6):637–40. doi: 10.1038/nmeth.2930
43. Butler A, Hoffman P, Smibert P, Papalexi E, Satija R. Integrating single-cell transcriptomic data across different conditions, technologies, and species. Nat Biotechnol (2018) 36(5):411–20. doi: 10.1038/nbt.4096
44. Subramanian A, Tamayo P, Mootha VK, Mukherjee S, Ebert BL, Gillette MA, et al. Gene set enrichment analysis: a knowledge-based approach for interpreting genome-wide expression profiles. Proc Natl Acad Sci United States America (2005) 102(43):15545–50. doi: 10.1073/pnas.0506580102
45. Hafemeister C, Satija R. Normalization and variance stabilization of single-cell RNA-seq data using regularized negative binomial regression. Genome Biol (2019) 20(1):296. doi: 10.1186/s13059-019-1874-1
46. Bankhead P, Loughrey MB, Fernandez JA, Dombrowski Y, McArt DG, Dunne PD, et al. QuPath: open source software for digital pathology image analysis. Sci Rep (2017) 7(1):16878. doi: 10.1038/s41598-017-17204-5
47. van Helvert S, Storm C, Friedl P. Mechanoreciprocity in cell migration. Nat Cell Biol (2018) 20(1):8–20. doi: 10.1038/s41556-017-0012-0
48. Mole DR, Blancher C, Copley RR, Pollard PJ, Gleadle JM, Ragoussis J, et al. Genome-wide association of hypoxia-inducible factor (HIF)-1alpha and HIF-2alpha DNA binding with expression profiling of hypoxia-inducible transcripts. J Biol Chem (2009) 284(25):16767–75. doi: 10.1074/jbc.M901790200
49. Kuczek DE, Larsen AMH, Thorseth ML, Carretta M, Kalvisa A, Siersbaek MS, et al. Collagen density regulates the activity of tumor-infiltrating T cells. J Immunother Cancer (2019) 7(1):68. doi: 10.1186/s40425-019-0556-6
50. O'Connor RS, Hao X, Shen K, Bashour K, Akimova T, Hancock WW, et al. Substrate rigidity regulates human T cell activation and proliferation. J Immunol (2012) 189(3):1330–9. doi: 10.4049/jimmunol.1102757
51. Abou Khouzam R, Zaarour RF, Brodaczewska K, Azakir B, Venkatesh GH, Thiery J, et al. The effect of hypoxia and hypoxia-associated pathways in the regulation of antitumor response: friends or foes? Front Immunol (2022) 13:828875. doi: 10.3389/fimmu.2022.828875
52. Siska PJ, Singer K, Evert K, Renner K, Kreutz M. The immunological warburg effect: can a metabolic-tumor-stroma score (MeTS) guide cancer immunotherapy? Immunol Rev (2020) 295(1):187–202. doi: 10.1111/imr.12846
53. Brand A, Singer K, Koehl GE, Kolitzus M, Schoenhammer G, Thiel A, et al. LDHA-associated lactic acid production blunts tumor immunosurveillance by T and NK cells. Cell Metab (2016) 24(5):657–71. doi: 10.1016/j.cmet.2016.08.011
54. Drost J, Clevers H. Organoids in cancer research. Nat Rev Cancer (2018) 18(7):407–18. doi: 10.1038/s41568-018-0007-6
55. Tuveson D, Clevers H. Cancer modeling meets human organoid technology. Science (2019) 364(6444):952–5. doi: 10.1126/science.aaw6985
56. Dolznig H, Rupp C, Puri C, Haslinger C, Schweifer N, Wieser E, et al. Modeling colon adenocarcinomas in vitro a 3D co-culture system induces cancer-relevant pathways upon tumor cell and stromal fibroblast interaction. Am J pathol (2011) 179(1):487–501. doi: 10.1016/j.ajpath.2011.03.015
57. Naruse M, Ochiai M, Sekine S, Taniguchi H, Yoshida T, Ichikawa H, et al. Re-expression of REG family and DUOXs genes in CRC organoids by co-culturing with CAFs. Sci Rep (2021) 11(1):2077. doi: 10.1038/s41598-021-81475-2
58. Zhong B, Cheng B, Huang X, Xiao Q, Niu Z, Chen YF, et al. Colorectal cancer-associated fibroblasts promote metastasis by up-regulating LRG1 through stromal IL-6/STAT3 signaling. Cell Death dis (2021) 13(1):16. doi: 10.1038/s41419-021-04461-6
59. Allen TA, Asad D, Amu E, Hensley MT, Cores J, Vandergriff A, et al. Circulating tumor cells exit circulation while maintaining multicellularity, augmenting metastatic potential. J Cell Sci (2019) 132(17). doi: 10.1242/jcs.231563
60. Teeuwssen M, Fodde R. Cell heterogeneity and phenotypic plasticity in metastasis formation: the case of colon cancer. Cancers (Basel) (2019) 11(9). doi: 10.3390/cancers11091368
61. Ohlund D, Handly-Santana A, Biffi G, Elyada E, Almeida AS, Ponz-Sarvise M, et al. Distinct populations of inflammatory fibroblasts and myofibroblasts in pancreatic cancer. J Exp Med (2017) 214(3):579–96. doi: 10.1084/jem.20162024
62. Pavlides S, Whitaker-Menezes D, Castello-Cros R, Flomenberg N, Witkiewicz AK, Frank PG, et al. The reverse warburg effect: aerobic glycolysis in cancer associated fibroblasts and the tumor stroma. Cell Cycle (2009) 8(23):3984–4001. doi: 10.4161/cc.8.23.10238
63. Wilde L, Roche M, Domingo-Vidal M, Tanson K, Philp N, Curry J, et al. Metabolic coupling and the reverse warburg effect in cancer: implications for novel biomarker and anticancer agent development. Semin Oncol (2017) 44(3):198–203. doi: 10.1053/j.seminoncol.2017.10.004
64. Ge H, Tian M, Pei Q, Tan F, Pei H. Extracellular matrix stiffness: new areas affecting cell metabolism. Front Oncol (2021) 11:631991. doi: 10.3389/fonc.2021.631991
65. Willson J. Stress fibres fuel glycolysis. Nat Rev Mol Cell Biol (2020) 21(4):180. doi: 10.1038/s41580-020-0224-1
66. Kim BG, Sung JS, Jang Y, Cha YJ, Kang S, Han HH, et al. Compression-induced expression of glycolysis genes in CAFs correlates with EMT and angiogenesis gene expression in breast cancer. Commun Biol (2019) 2:313. doi: 10.1038/s42003-019-0553-9
67. Najafi M, Farhood B, Mortezaee K. Extracellular matrix (ECM) stiffness and degradation as cancer drivers. J Cell Biochem (2019) 120(3):2782–90. doi: 10.1002/jcb.27681
68. Bruni D, Angell HK, Galon J. The immune contexture and immunoscore in cancer prognosis and therapeutic efficacy. Nat Rev Cancer (2020) 20(11):662–80. doi: 10.1038/s41568-020-0285-7
69. Jiao S, Subudhi SK, Aparicio A, Ge Z, Guan B, Miura Y, et al. Differences in tumor microenvironment dictate T helper lineage polarization and response to immune checkpoint therapy. Cell (2019) 179(5):1177–90 e13. doi: 10.1016/j.cell.2019.10.029
70. Lee JC, Mehdizadeh S, Smith J, Young A, Mufazalov IA, Mowery CT, et al. Regulatory T cell control of systemic immunity and immunotherapy response in liver metastasis. Sci Immunol (2020) 5(52). doi: 10.1126/sciimmunol.aba0759
71. Chow A, Schad S, Green MD, Hellmann MD, Allaj V, Ceglia N, et al. Tim-4(+) cavity-resident macrophages impair anti-tumor CD8(+) T cell immunity. Cancer Cell (2021) 39(7):973–88 e9. doi: 10.1016/j.ccell.2021.05.006
72. Fuca G, Cohen R, Lonardi S, Shitara K, Elez ME, Fakih M, et al. Ascites and resistance to immune checkpoint inhibition in dMMR/MSI-h metastatic colorectal and gastric cancers. J Immunother Cancer (2022) 10(2). doi: 10.1136/jitc-2021-004001
73. Sharma P, Siddiqui BA, Anandhan S, Yadav SS, Subudhi SK, Gao J, et al. The next decade of immune checkpoint therapy. Cancer discovery (2021) 11(4):838–57. doi: 10.1158/2159-8290.CD-20-1680
74. Sharma P, Allison JP. Dissecting the mechanisms of immune checkpoint therapy. Nat Rev Immunol (2020) 20(2):75–6. doi: 10.1038/s41577-020-0275-8
Keywords: colorectal cancer, CMS4, immunosuppressive, microenvironment, cancer-associated fibroblast (CAF)
Citation: Strating E, Verhagen MP, Wensink E, Dünnebach E, Wijler L, Aranguren I, De la Cruz AS, Peters NA, Hageman JH, van der Net MMC, van Schelven S, Laoukili J, Fodde R, Roodhart J, Nierkens S, Snippert H, Gloerich M, Rinkes IB, Elias SG and Kranenburg O (2023) Co-cultures of colon cancer cells and cancer-associated fibroblasts recapitulate the aggressive features of mesenchymal-like colon cancer. Front. Immunol. 14:1053920. doi: 10.3389/fimmu.2023.1053920
Received: 26 September 2022; Accepted: 03 May 2023;
Published: 16 May 2023.
Edited by:
Zoltan Janos Vereb, University of Szeged, HungaryReviewed by:
Eliza L. S. Fong, National University of Singapore, SingaporeTibor Pankotai, University of Szeged, Hungary
Copyright © 2023 Strating, Verhagen, Wensink, Dünnebach, Wijler, Aranguren, De la Cruz, Peters, Hageman, van der Net, van Schelven, Laoukili, Fodde, Roodhart, Nierkens, Snippert, Gloerich, Rinkes, Elias and Kranenburg. This is an open-access article distributed under the terms of the Creative Commons Attribution License (CC BY). The use, distribution or reproduction in other forums is permitted, provided the original author(s) and the copyright owner(s) are credited and that the original publication in this journal is cited, in accordance with accepted academic practice. No use, distribution or reproduction is permitted which does not comply with these terms.
*Correspondence: Onno Kranenburg, by5rcmFuZW5idXJnQHVtY3V0cmVjaHQubmw=
†ORCID: Onno Kranenburg, orcid.org/0000-0002-2112-4390