 Saúl Arteaga-Cruz1
 Arimelek Cortés-Hernández1,2
 Evelyn Katy Alvarez-Salazar1,2
 Katya Rosas-Cortina1Christian Aguilera-Sandoval3Luis E. Morales-Buenrostro4
 Josefina M. Alberú-Gómez5
 Gloria Soldevila1,2*
- 1Department of Immunology, Biomedical Research Institute, Mexico City, Mexico
- 2The National Laboratory of Flow Cytometry, Biomedical Research Institute, National Autonomous University of Mexico, Mexico City, Mexico
- 3Scientific affairs, Accellix, San Jose, CA, United States
- 4Department of Nephrology and Mineral Metabolism, National Institute of Medical Sciences and Nutrition Salvador Zubirán, Mexico City, Mexico
- 5School of Medicine and Health Sciences, Tecnológico de Monterrey., Mexico City, Mexico
The development of new strategies based on the use of Tr1 cells has taken relevance to induce long-term tolerance, especially in the context of allogeneic stem cell transplantation. Although Tr1 cells are currently identified by the co-expression of CD49b and LAG-3 and high production of interleukin 10 (IL-10), recent studies have shown the need for a more exhaustive characterization, including co-inhibitory and chemokines receptors expression, to ensure bona fide Tr1 cells to be used as cell therapy in solid organ transplantation. Moreover, the proinflammatory environment induced by the allograft could affect the suppressive function of Treg cells, therefore stability of Tr1 cells needs to be further investigated. Here, we establish a new protocol that allows long-term in vitro expansion of highly purified expanded allospecific Tr1 (Exp-allo Tr1). Our expanded Tr1 cell population becomes highly enriched in IL-10 producers (> 90%) and maintains high expression of CD49b and LAG-3, as well as the co-inhibitory receptors PD-1, CTLA-4, TIM-3, TIGIT and CD39. Most importantly, high dimensional analysis of Exp-allo Tr1 demonstrated a specific expression profile that distinguishes them from activated conventional T cells (T conv), showing overexpression of IL-10, CD39, CTLA-4 and LAG-3. On the other hand, Exp-allo Tr1 expressed a chemokine receptor profile relevant for allograft homing and tolerance induction including CCR2, CCR4, CCR5 and CXCR3, but lower levels of CCR7. Interestingly, Exp-allo Tr1 efficiently suppressed allospecific but not third-party T cell responses even after being expanded in the presence of proinflammatory cytokines for two extra weeks, supporting their functional stability. In summary, we demonstrate for the first time that highly purified allospecific Tr1 (Allo Tr1) cells can be efficiently expanded maintaining a stable phenotype and suppressive function with homing potential to the allograft, so they may be considered as promising therapeutic tools for solid organ transplantation.
1 Introduction
T regulatory Type one (Tr1) cells are a subset of CD4+ T cells initially described in patients with mixed chimerism who did not develop Graft vs Host Disease (GvHD), after hematopoietic stem cell transplantation (HSCT) (1, 2). Several reports have shown that Tr1 cells can be abundantly found in specific anatomical regions with IL-10-rich microenvironments such as the intestinal mucosa (3), promoting the tolerance induction towards microbiota and diet-derived antigens (4). Nonetheless, the presence of Tr1 cells can be identified in peripheral blood and spleen, indicating that they can exert their functions both locally and systemically (5).
Tr1 cells are characterized by the co-expression of the specific surface markers: CD49b and LAG-3 (lymphocyte activation gene-3) which has facilitated their identification and purification (6). Another relevant aspect of these cells is their capacity to produce high and intermediate amounts of IL-10 and TGF-β respectively, variable levels of IFN-γ and IL-2 and low or null production of IL-4 (reviewed in (7)). Although the production of anti-inflammatory cytokines has been described as one of their main suppressive mechanisms, the ability to exert cell-cell contact suppression (PD1 and CTLA-4), metabolic disruption (CD39 and CD73), as well as cytotoxicity (Granzyme B and perforin release) are other important features which regulate effector immune responses (reviewed in (8)). Importantly, Brockmann and co-workers have recently described a subpopulation within the CD49b+LAG-3+CD4+ Tr1 cells which co-expresses the co-inhibitory receptors (CIR) TIGIT, TIM-3 and PD1, and produce higher levels of IL-10. Moreover, CCR5+ CIR+ Tr1 cells appear to have greater immunoregulatory capacity (9).
Tr1 cells had previously been used as therapy tools in different preclinical models of intestinal inflammation (10) and autoimmune diseases, where they contribute to resolve effector T cell responses and reduce the clinical score disease (11–13). However, most of their therapeutic potential has been described within the allograft context, where in vitro differentiated Tr1 cells were able to efficiently induce tolerance towards allogeneic pancreatic islets and prevented GvHD development in HSCT patients (reviewed in (14)). In this context, IL-10-anergized donor T cells (IL-10-DLI) were able to promote cellular reconstitution in HSCT transplanted patients while reducing the risk of GvHD (15). Other protocols based on T10-cells, a clinical grade population obtained after stimulation of CD4+ T cells with irradiated IL-10 derived allogeneic dendritic cells (DC10), have been safely used in patients with kidney transplant. Importantly, circulating T10-cells showed a stable tolerogenic gene signature thirty-six weeks post-transplantation (16). Recently, a new protocol focused on HSC transplant patients with hematological malignancies used a population obtained from CD4+ T cells cultured with allogeneic DC10 in presence of IL-10 (T-allo10) as cell therapy, showing the maintenance of a stable population after patient’s infusion (17).
One of the important aspects to consider for the use of cellular therapy in transplanted patients is to ensure the stability of infused regulatory T (Tregs) cells in the transplanted patient. In this context, it has been reported that activation of thymic and induced Tregs cells expressing FOXP3 in the presence of proinflammatory cytokines, can promote a downregulation of FOXP3, leading to a loss of their suppressive capacity, while acquiring characteristics from inflammatory T cell populations ( (18) and reviewed in (19)). On the other hand, there is growing evidence that chemokine receptor expression in infiltrated allograft cells is closely related to either the rejection or maintenance of organ transplants, as previously reported for FOXP3+ Tregs cells (20). However, to date, scarce information is available about the effect of inflammatory cytokines and chemokine receptor expression on Tr1 stability and homing, respectively. In addition, it has been demonstrated that specific chemokine receptors (CR) expressed on Tregs cells, play a key role in transplantation tolerance, by favoring their homing Tregs cells towards the allograft (CCR2, CXCR3 and CCR4) or draining lymph nodes (CCR7) (20, 21). Initial studies reported the expression of CR related to both Type 1 helper (Th1) (CXCR3 and CCR5) and (Th2) subsets (CCR3, CCR4 and CCR8), while CCR5 has been proposed as a phenotypic marker for Tr1 cells (9). However, a more detailed characterization is still needed to evaluate their functional relevance in allograft tolerance.
Although current protocols to differentiate alloantigen-specific Tr1 cells in vitro have shown satisfactory results (15–17), none of these protocols have successfully obtained pure allospecific Tr1 cells and, furthermore, new methodologies are needed aiming at large-scale Tr1 cell production. In the present work, we describe for the first time the feasibility of large scale allospecific Tr1 (Allo Tr1) cells expansion, with high purity and stable function as potential tools for solid organ transplantation.
2 Materials and methods
2.1 Healthy donor samples
Buffy coats products from healthy donors whole blood were collected in the Blood Bank of “Instituto Nacional de Enfermedades Respiratorias (INER) Ismael Cosío Villegas”, Mexico City, after written informed consent, in accordance with the local human ethics committee procedures. This protocol was approved by the Committees Medical Ethics at the Instituto de Investigaciones Biomédicas (UNAM) and the Instituto Nacional de Ciencias Médicas y Nutrición Salvador Zubirán (Reference #1831) and performed in accordance with the revised Declaration of Helsinki, the Declaration of Istanbul and Good Clinical Practice Guidelines.
2.2 Reagents and antibodies
For flow cytometry analysis, APC-Cy7 anti-CD4, PE-Cy7 anti-CD8, APC anti-CD11c and FITC anti-CD14 (San Diego, CA, USA), PE Cy7 anti-LAG-3, PE-Cy5.5 anti-CD3 and PerCP-eFluor 710 anti-ILT4 were purchased from Invitrogen (Waltham, MA, USA). Alexa Fluor 488 anti-PD1, Alexa Fluor 488 anti-CCR5, PerCP Cy5.5 anti-CCR7, PerCP-Cy5.5 anti-TIM3, PE anti-CD25, PE Dazzle 594 anti-TIGIT, PE-Cy7 anti-HLA-G, APC anti-CD49b, APC Fire 750 anti-CD45RA, Brilliant Violet (BV) 711 anti-CD39, BV421 anti-CTLA-4, BV421 anti-CCR4, BV711 anti-CXCR3, Zombie NIR and Zombie Aqua™, were purchased from Biolegend (San Diego, CA, USA) (Supplementary Table 1).
For in vitro experiments, Ficoll® Paque Plus (Ficoll) and dimethyl sulfoxide (DMSO) were obtained from Sigma-Aldrich (San Luis, MO USA). Recombinant human (rh) GM-CSF, IFN-γ, IL-1β, IL-2, IL-4, IL-6, IL-10 and TNF-α cytokines were obtained from PeproTech (New Jersey, NY, USA). Carboxy Fluorescein Succinimidyl Ester (CFSE), CellTrace™ Violet (CTV), Dynabeads Human T-activator CD3/CD28 (anti-CD3/CD28-coated beads), DynaMag-5™ Magnet (DynaMag), CTS™ OpTmizer™ T Cell Expansion SFM medium (Expansion culture medium), RPMI 1640 medium, antibiotic-antimycotic 100X, L-glutamine (GlutaMAX™), sodium pyruvate (100 mM), MEM Non-Essential amino acids 100X and Fetal Bovine Serum (FBS) were purchased from Thermo Fisher Scientific (Waltham, MA, USA). Pooled human AB serum (AB-HS) was obtained from Gemini Bio Products (Sacramento, CA, USA). All culture mediums were supplemented with L-glutamine, sodium pyruvate, MEM-NEAA and antibiotic-antimycotic. T cell cultures were performed in round bottom 96-well culture plates (Corning, Avon, France).
2.3 Peripheral blood mononuclear cells isolation
Peripheral blood mononuclear cells (PBMCs) were isolated from buffy coat preparations of adult normal healthy donors by density-gradient centrifugation over Ficoll according to the manufacturer’s instructions. Isolated cells were resuspended in a solution containing 90% Fetal Bovine Serum (FBS) and 10% Dimethyl Sulfoxide (DMSO), were stored at -70°C for 24 hours and then cryopreserved to -195°C in liquid nitrogen. For functional assays, cryopreserved cells were thawed in a 37°C water bath and washed three times with culture medium supplemented with 10% FBS.
2.4 Monocytes-derived dendritic cells and IL-10-producing dendritic cells in vitro differentiation
CD14+ monocytes cells were isolated from PBMCs using the Human CD14 MicroBeads kit (Miltenyi Biotec, Bergisch Gladbach, Germany) according to the manufacturer’s instructions. CD14+ monocytes were resuspended in RPMI 1640 culture medium supplemented with 10% AB-HS, stimulated with rhIL-4 (50 ng/mL) and rhGM-CSF (50 ng/mL) in the presence (DC10) or absence (moDC) of rhIL-10 (10 ng/mL) and they were cultured (37°C/5% of CO2) for 8 days; on days 3 and 5, culture medium and cytokines (25 ng/mL rhIL-4, 25 ng/mL rhGM-CSF and 10 ng/mL rhIL-10) were refreshed. The moDC and DC10 phenotypes were evaluated by flow cytometry staining with Zombie Aqua (viability) and anti-CD11c, anti-CD14, anti-HLA-G and anti-ILT4 monoclonal antibodies (mAbs). Samples were acquired on a Attune NxT Cytometer (Thermo Fisher Scientific) and data were analyzed with FlowJo v10.8 software (BD Biosciences, CA, USA).
2.5 In vitro differentiation and purification of allospecific Tr1 cells
CD4+CD25-CD45RA+ naïve T (nT) cells were purified from PBMCs using a FACS Area I sorter (BD Biosciences, CA, USA). Sorted nT cells were labeled with CTV according to the manufacturer’s instructions and co-cultured for 14 days with moDCs (conventional T cell condition) or DC10 (Tr1 cell condition) at a ratio of 10:1 (nT: DC10 or moDC) in presence or absence of rhIL-10 (10 ng/mL), respectively; on 7 day of co-culture, a restimulation with rhIL-10 (10 ng/mL) and rhIL-2 (50 U/mL) was performed. Tr1 cell phenotype (CD4+CD49b+LAG-3+ and IL-10 production) was evaluated on the 14th day of co-culture by flow cytometry. IL-10 production of T cells was determined using IL-10 secretion assay and CytoStim™ kits (Miltenyi Biotec), according to the manufacturer’s instructions, with some modifications.
After 14 days of co-culture, CD4+CD49b+LAG-3+ Allo Tr1 cells from nT:DC10 co-culture and CD4+ allospecific conventional T (T conv) cells from nT:moDC co-culture were purified from proliferating cells (CTV-) using a MoFlo XDP cell sorter (Beckman Coulter, Brea, CA, USA). Sorted Allo Tr1 cells and T conv were cultured for 2 days in Expansion culture medium (50x103/well) supplemented with 10% AB-HS and IL-2 (50 U/mL) previous to the polyclonal expansion protocol.
2.6 Polyclonal expansion and antibody staining of Tr1 and conventional T cells
FACS-sorter Allogenic Tr1 (Allo Tr1) cells (20x103/well) were cultured for 4 days (37°C/5% of CO2) in Expansion culture medium supplemented with 10% AB-HS and stimulated with anti-CD3/CD28-coated beads at a 1:5 ratio (Beads : Tr1) plus rhIL-10 (10 ng/mL) and rhIL-2 (250 U/mL) (expansion period). After 4 days of stimulation, the anti-CD3/CD28-coated beads were removed using the DynaMag and Allo Tr1 cells (50x103) were rested for 3 days in Expansion culture medium supplemented with 10% AB-HS and rhIL-2 (50 U/mL) (resting period). Three consecutive rounds of stimulation/resting (4 days of expansion and 3 days of resting each) were performed. A schematic representation of protocol is shown in Figure 1.
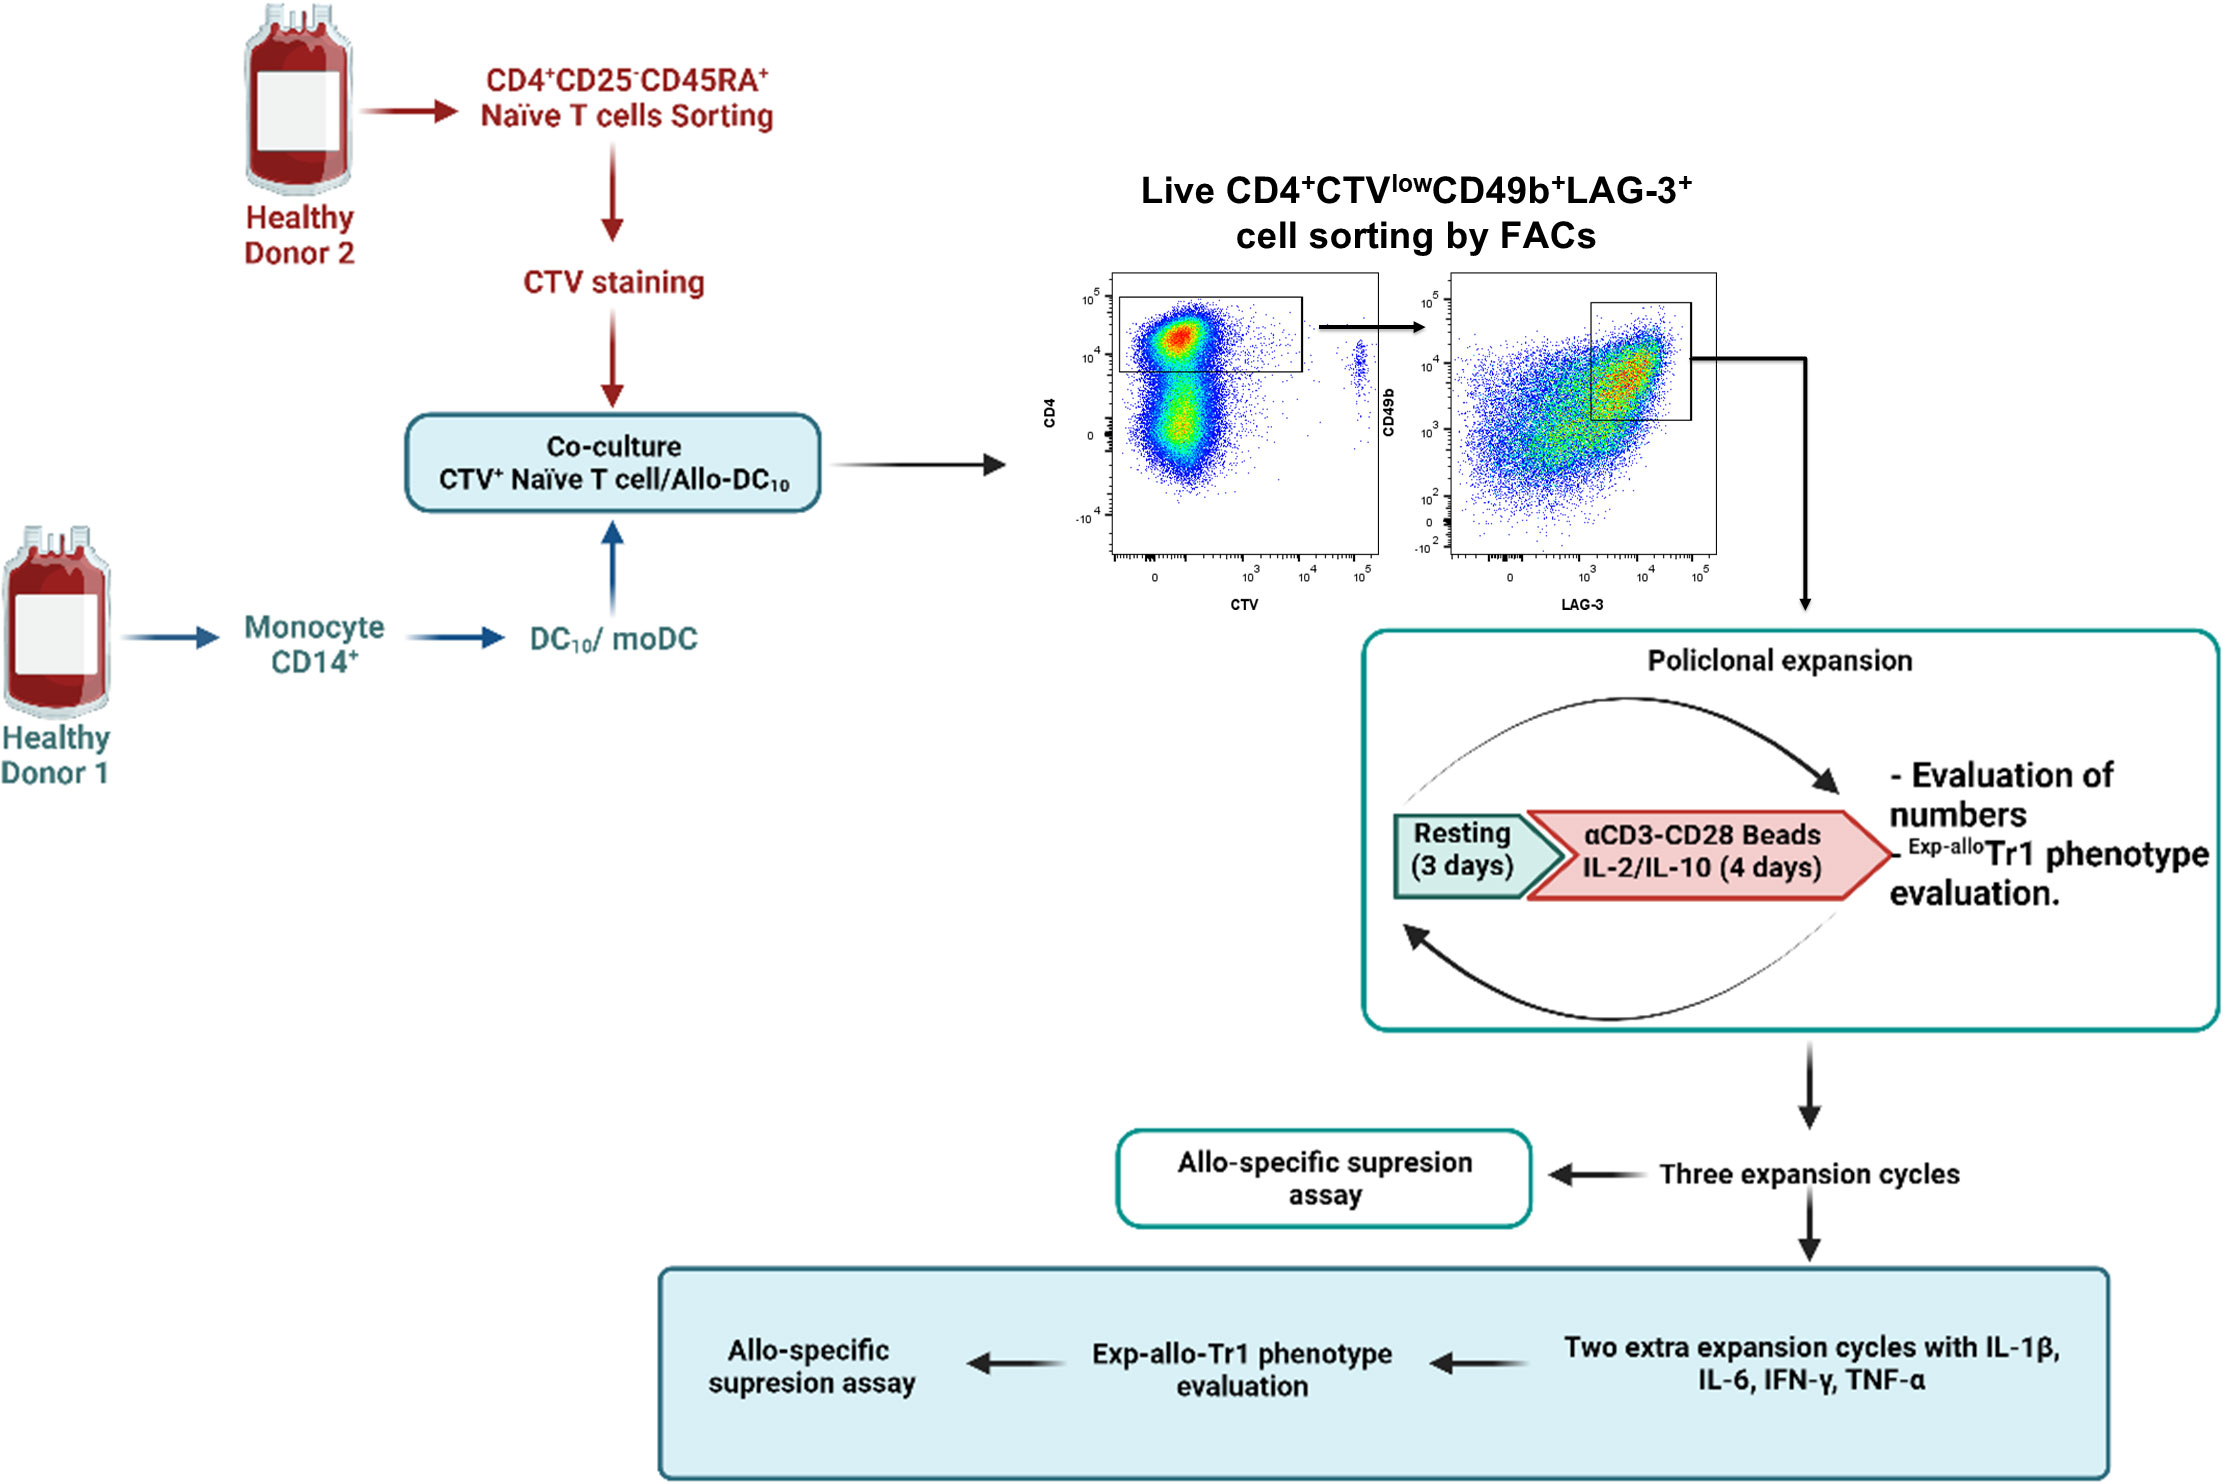
Figure 1 General methodological scheme used for the expansion of Allo Tr1 regulatory type 1 cells. FACS-sorted CD4+CD25-CD45RA+ nT cells (labeled with CTV) were stimulated with allogeneic DC10 in the presence of exogenous IL-2 and IL-10 for 14 days. Proliferating Allo Tr1 cells (CD49b+LAG-3+CTV-) were purified by FACs from co-cultures (CD4+ nT cells:DC10) and polyclonally-expanded for three cycles of stimulation (4 days of culture with anti-CD3/anti-CD28, rhIL-2 and rhIL-10)/resting (3 days of culture with only rhIL-2) of 7 days each. Exp-allo Tr1 cell phenotype was evaluated at each cycle of stimulation. In vitro functional assays were performed after three rounds of polyclonal expansion. Finally, long-term Exp-allo Tr1 cells were re-stimulated for two additional cycles in the presence of proinflammatory cytokines for Tr1 stability assays. Created by BioRender.com.
As a control group, allospecific CD4+ T conv cells (20x103/well) were polyclonally-expanded in parallel cultures with anti-CD3/anti-CD28 coated beads at 1:5 ratio (Beads:T conv) and rhIL-2 (100 U/mL) with the same rounds of stimulation/resting used for Allo Tr1 cells.
Throughout the ex vivo expansion protocol, IL-10 production of T cells was evaluated using IL-10 secretion assay and CytoStim™ kits (Miltenyi Biotec); next, the cells were stained with anti-CD4, anti-CD49b, anti-LAG-3, anti-TIM-3, anti-TIGIT, anti-PD1, anti-CTLA-4, anti-CD39 and Zombie Aqua™ for 30 min at 37°C in the dark and washed once with FACS buffer. The chemokine profile was evaluated with anti-CD4, anti-CD49b, anti-LAG-3, anti-CCR2, anti-CCR5, anti-CCR4, anti-CCR7, anti-CXCR3, and Zombie NIR™ and the samples were stained for 20 min at room temperature in the dark and washed once with FACS buffer. Sample acquisitions were performed in an Attune NxT cytometer (Thermo Scientific) and data were analyzed with FlowJo v10.8 software (BD Biosciences, CA, USA).
2.7 High dimensional analysis of flow cytometry data
To capture the non-linear structure of our single cell data, we performed dimensionality reduction using a FlowJo implementation opt-tSNE (22). To identify clusters within the opt-tSNE map, X-Shift was performed as previously described (23). The X-Shift identified clusters were then phenotyped using FlowJo v10.8’s plug-in ClusterExplorer and ViolinBox (San Diego, BD).
2.8 In vitro allo-specific suppression assay
Autologous CD3+ responder T cells (R.T.C.) were isolated from PBMCs using the Pan T Cell Isolation Kit (Miltenyi Biotec) and labeled with CFSE, following the manufacturer’s instructions. Expanded allospecific Tr1 (Exp-allo Tr1) cells expanded for three weeks were labeled with CTV, co-cultured with CFSE-labeled R.T.C. at different ratios CD3+ Exp-allo Tr1 (1:1, 1:3, 1:9 and 1:27) and stimulated with specific-allogeneic or third-party moDC in a ratio 1:2 (CD3+:moDC) in expansion culture medium with 10% AB-HS. For some assays, co-cultures were stimulated in the presence or absence of 5 ng/mL of IFN-γ, IL-1β, IL-6 and/or TNF-α. After 4 days of co-culture, cells were recovered and stained with mAbs anti-CD3, anti-CD4 and anti-CD8, cells were acquired in an Attune NxT Cytometer and data were analyzed with FlowJo v10.8. software. The R.T.C. proliferation was determined by CFSE dilution on gated CD4+ or CD8+ T cells, and CTV-labeled Exp-allo Tr1 cells were excluded from the analysis. Results are presented as relative increments (RI) of the suppression obtained in control cultures without Exp-allo Tr1 cells. The relative increment was calculated using the following formula:
2.9 Tr1 cells stability assays
After 3 weeks of expansion, Allo Tr1 cells were stimulated with 2 additional cycles of polyclonal expansion/resting in the presence or absence of rhIL-6 (5 ng/mL), rhTNF-α (5 ng/mL), rhIFN-γ (5 ng/mL) and/or IL-1β (5 ng/mL). Tr1 cell stability was evaluated by analyzing the expression of CD49b, LAG-3, IL-10, TIM-3, TIGIT, PD1, CTLA-4, CD39, as well as their alloantigen-specific suppressive function by flow cytometry.
2.10 Cytokine production assay
For cytokine production analysis, CD4+ T cells (Exp-allo Tr1 and T conv) (2x10⁴ cells/well) were stimulated with anti-CD3/anti-CD28 beads (beads:T cells at a ratio of 1:5) during 4 days. The concentrations of cytokines in the culture supernatants were measured using the LEGENDplex™ kit, Custom Human Panel (Biolegend), according to the manufacturer’s guidelines. The samples were acquired on the flow cytometer CytoFLEX S (Beckman Coulter) and data were analyzed using FlowJo (BD) and GraphPad Prism v8 softwares. Cytokine concentrations were determined using the standard curve generated in the same assay.
2.11 Statistical analysis
Statistical analysis was performed using GraphPad Prism v8 software. The Shapiro–Wilk test was used to evaluate the distribution of the data. Differences between two groups were calculated using paired and unpaired t tests for normally distributed data; Wilcoxon’s rank sum test or Mann-Whitney test were used for non-normally distributed data. Graphs are expressed as Mean ± Standard Error of the Mean (SEM). Values with p<0.05 were considered as statistically significant.
3 Results
3.1 In vitro-generated allogeneic DC10 efficiently induce Allo Tr1 cells
With the overall aim of increasing the yield and purity of the cellular products obtained with current Tr1-based methodologies, we designed a new experimental protocol that allows efficient long-term expansion of highly purified Allo Tr1 cells (Figure 1). Based on previous reports (24), we used in vitro differentiated DC10 as an efficient methodology to the differentiation of Allo Tr1 cells.
We first evaluated the phenotype of DC10, which presented a tolerogenic dendritic cell phenotype characterized by a significant increase of HLA-G+ILT4+ and CD14+ percentages compared to moDC (Figure S1). Next, CD4+CD25-CD45RA+ naïve T cells were sorted by FACS, CTV-labeled and co-cultured with allogeneic DC10 in the presence of rhIL-10 and rhIL-2 for 14 days and then analyzed the expression of specific Tr1 surface markers CD49b and LAG-3. As a negative control for Tr1 differentiation, nT cells were stimulated with moDC and only IL-2. We obtained a higher percentage of CD49b+LAG-3+ Allo Tr1 cells in co-cultures stimulated with allogeneic DC10 compared to allogeneic moDC (46.5% ± 19.1 vs 14% ± 11) (Figures 2A, B). Moreover, Allo Tr1 cells differentiated with DC10 showed a significant increase in IL-10 production (28.7% ± 15 vs 6% ± 5) (Figures 2C, D). Using our culture conditions, we were able to differentiate a high percentage of Allo Tr1 cell population with Tr1 cell phenotype.
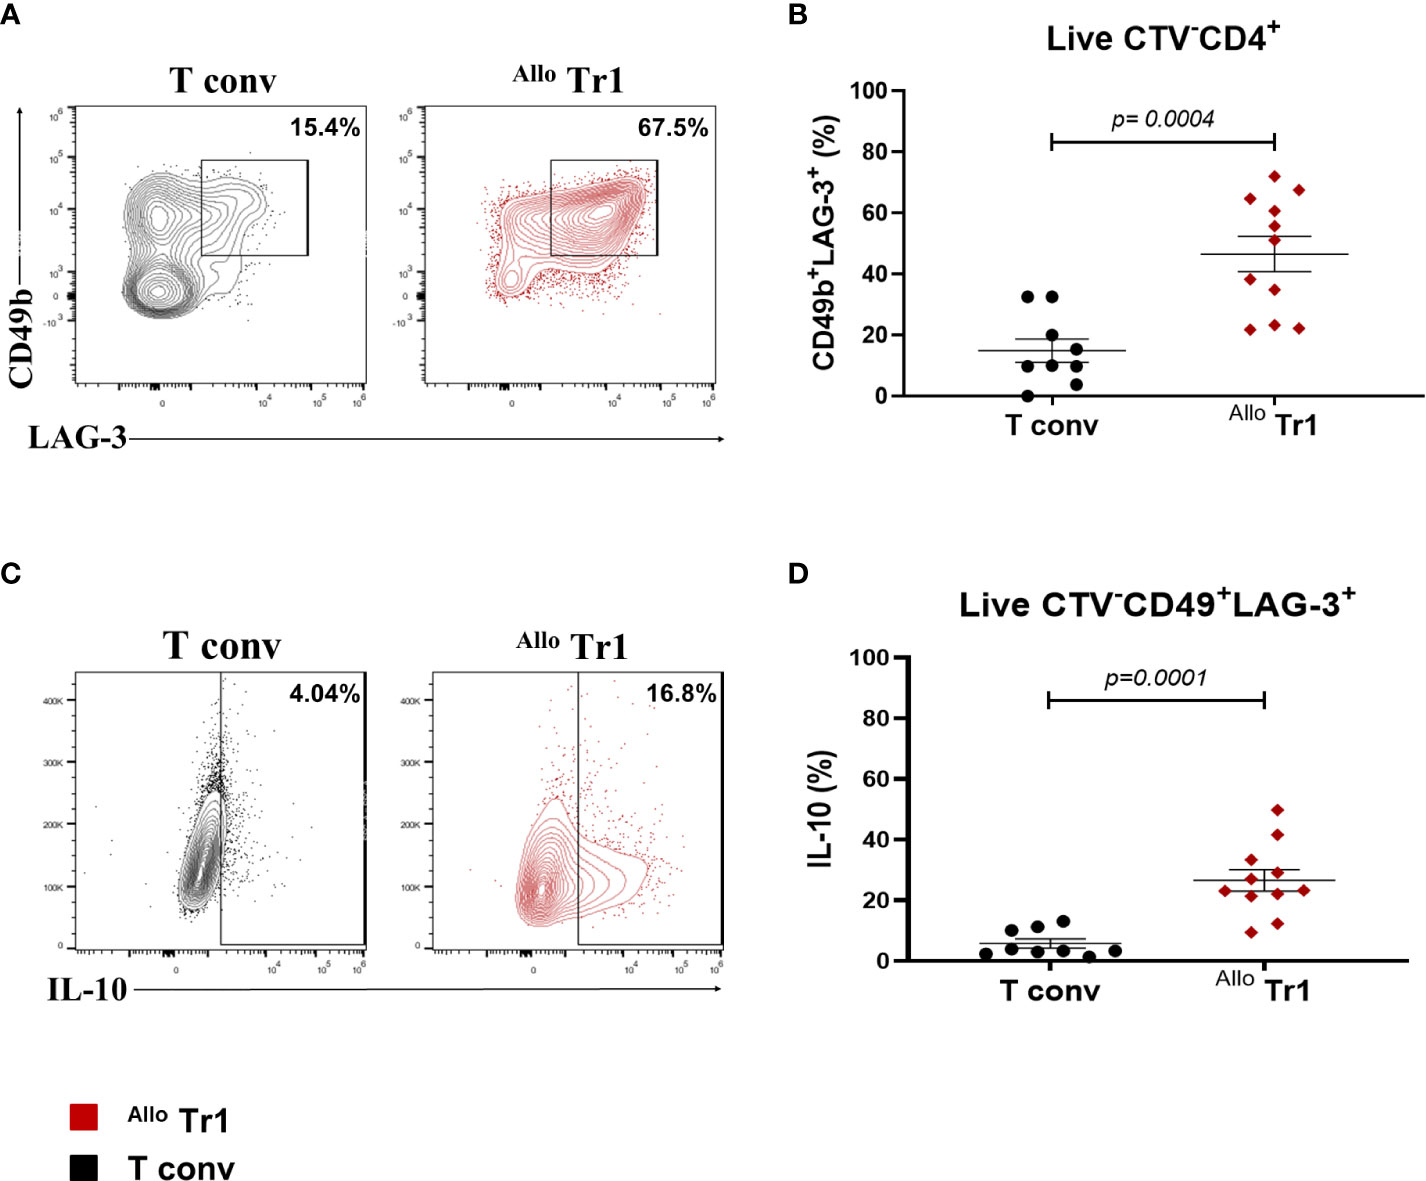
Figure 2 DC10 induces the differentiation of a high percentage of CD49b+LAG-3+ Allo Tr1 cells. nT (CD4+CD25-CD45RA+) cells were co-cultured with allogeneic moDC (Allo T conv) or DC10 (Allo Tr1 cells) for 14 days. (A) Representative contour-plot of CD49b and LAG-3 co-expression in proliferating cells from T conv (black) or Allo Tr1 cells (red). (B) Proportion of CD49b+LAG-3+ in Allo Tr1 (red, n= 11) condition culture compared to T conv (black, n= 9) condition. (C) Representative contour-plot of IL-10 production from CD49b+LAG-3+ population in T conv (black) and Allo Tr1 cells (red). (D) CD49b+LAG-3+ Allo Tr1 cells (red, n= 11) showed a significantly higher IL-10 production compared with CD49b+LAG-3+ T conv (black, n= 9). All experiments were performed in duplicates. Data are representative of six independent experiments. The results are shown as mean ± SEM. The statistical analysis was performed using the unpaired-t test or the Mann–Whitney U test.
3.2 Long-term polyclonally-expanded Alo-Tr1 cells maintain an enriched suppressor phenotype and high IL-10 production
To increase the purity and Allo Tr1 cell numbers, we isolated CD49b+LAG-3+ Allo Tr1 cells from co-cultures with DC10 by FACS and then we developed an efficient expansion protocol including cycles of polyclonal activation (4 days) followed by resting (3 days with only IL-2) for 21 days. As previously reported, Tregs cells express surface markers that are also present in highly activated T conv, therefore, we performed parallel cultures after purification of allogeneic T conv cells followed by polyclonal expansion under the similar stimulation conditions as Allo Tr1. As shown the Figure 3, the numbers of purified Allo Tr1 cells were significantly augmented, reaching an average fold increase of 840 times (Figure 3A). Moreover, after evaluating the phenotype of Exp-allo Tr1 cells at each polyclonal expansion cycle (days 7, 14 and 21), we observed a higher proportion of CD49b+LAG-3+ cells, compared with expanded T conv cells, (cycle I: 80.7% ± 12.9 vs 38.1 ± 12.4; cycle II: 76.2% ± 11.16 vs 50.5% 15.3; cycle III: 82.1% ± 8.4 vs 58.22% ± 18.4) (Figures 3B, C). Importantly, Exp-allo Tr1 cells maintained significantly increased levels of IL-10 compared with T conv cells at each cycle of expansion (Figures 3D, E). Interestingly, the Median Fluorescence Intensity (MeFI) of LAG-3 was significantly higher in Exp-allo Tr1 compared to expanded T conv in each expansion cycle, while we did not observe differences in the expression levels of CD49b between both populations throughout the expansion protocol (Figures S2A, B).
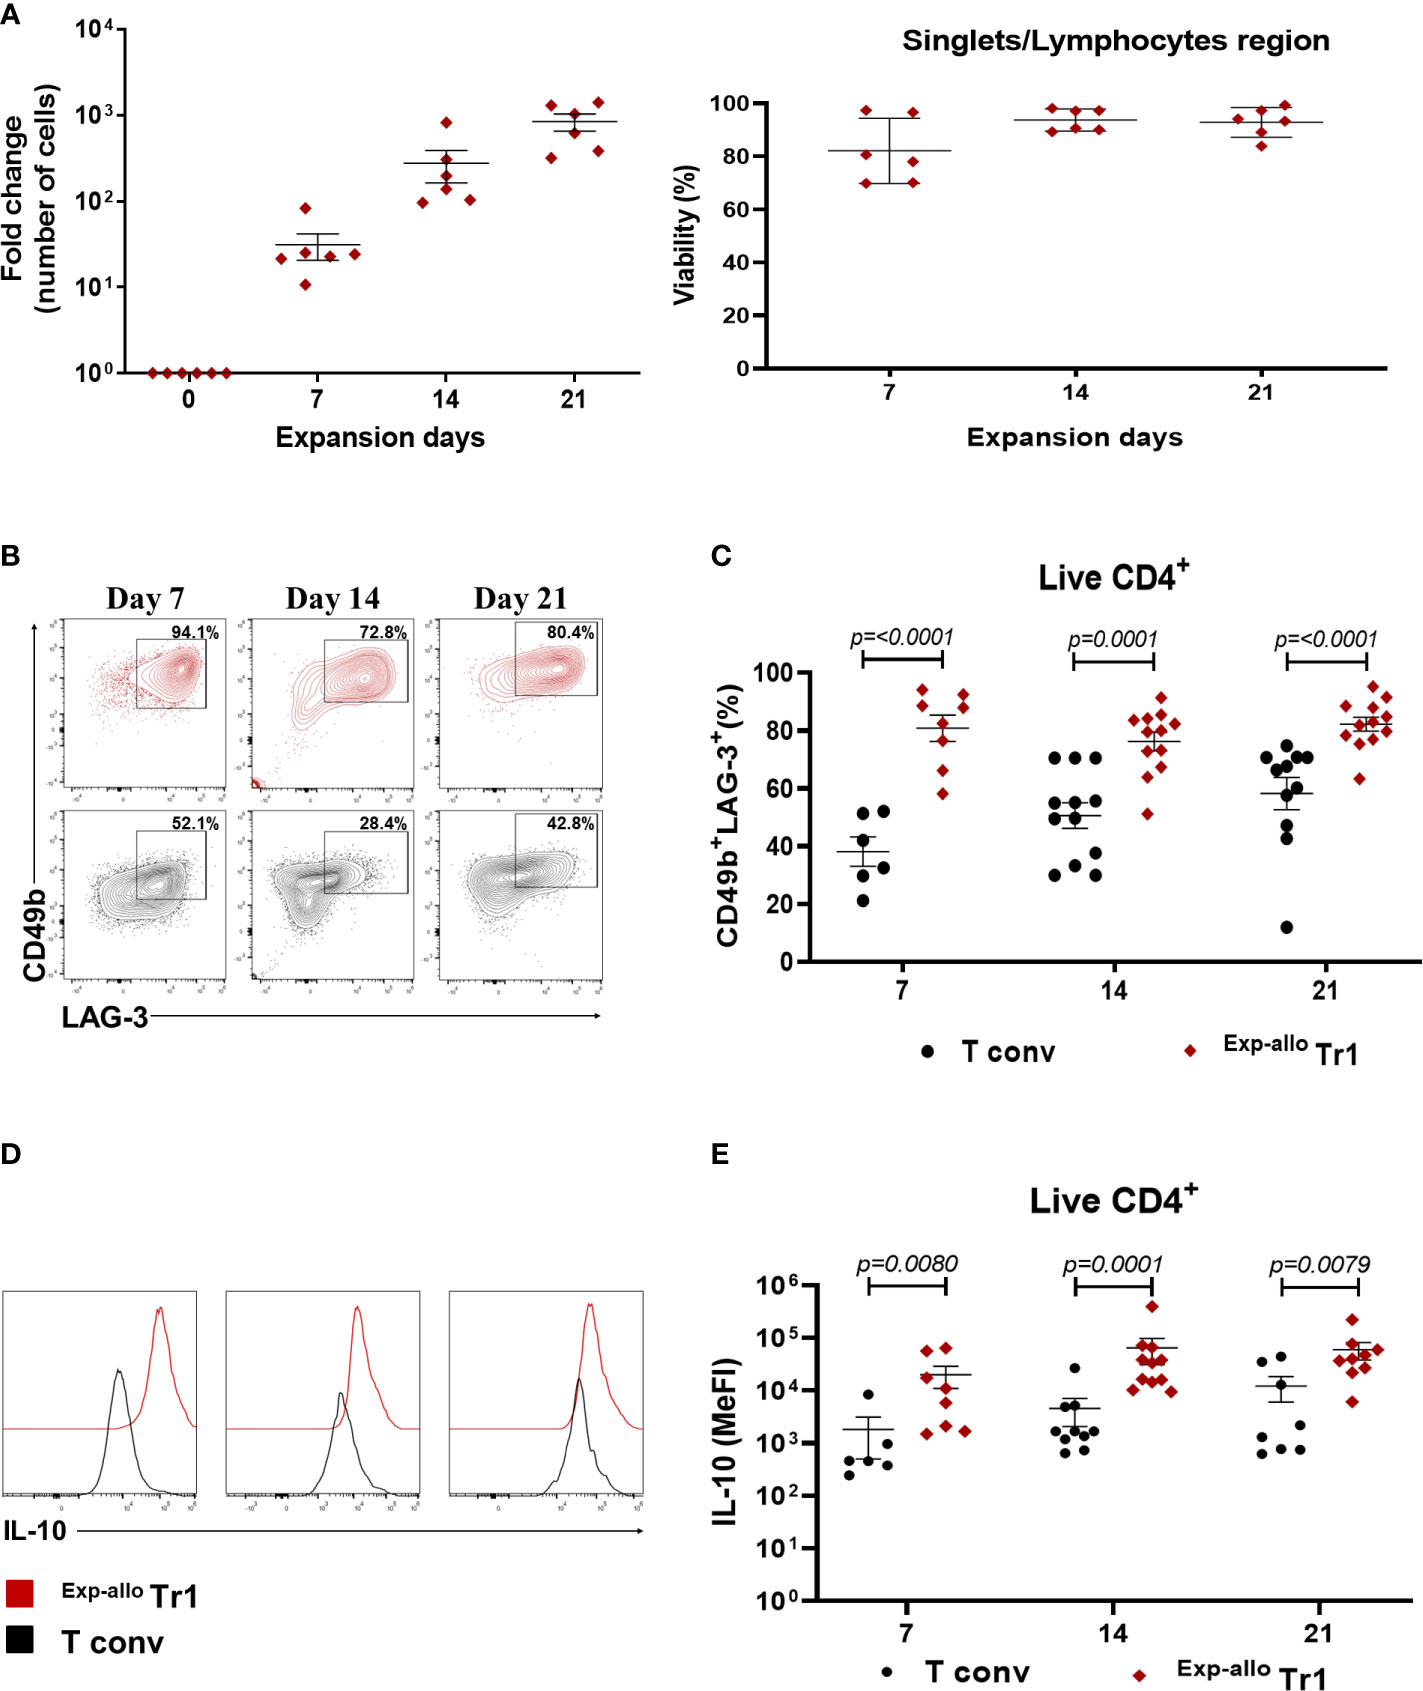
Figure 3 Purified Allo Tr1 cells can be long-term expanded, conserving their CD49b+LAG3+ phenotype and IL-10 production. FACS-sorter Allo Tr1 cells or T conv were polyclonally-expanded for 21 days in the presence of IL-10 plus IL-2 or only IL-2, respectively. (A) Left, Allo Tr1 cell proliferation reaching an average fold increase of 840 times at day 21 of stimulation (n= 6). Fold expansion was calculated by dividing the number of Tr1 cells obtained on the evaluated day by the number of Tr1 cells on day 1 of FACS-sorting. Right, viability of Exp-allo Tr1. Data are representative of four independent experiments. (B) Representative contour-plot of LAG-3 and CD49b co-expression in Exp-allo Tr1 cells (red) and T conv (black) at each cycle of in vitro expansion. (C) Proportion of CD49b+LAG-3+ in Exp-allo Tr1 cells (red, n= 6-12) compared to T conv (black, n= 6-12). (D) Representative histograms of IL-10 production in Exp-allo Tr1 cells and T conv. (E) Median Fluorescence Intensity (MeFI) of IL-10 in Exp-allo Tr1 cells (red) compared with T conv (black) throughout the expansion. All experiments were performed in duplicates. Data are representative of six independent experiments. The results are shown as mean ± SEM. The statistical analysis were performed using the unpaired-t test or the Mann–Whitney U test.
To further investigate the phenotypic markers of Exp-allo Tr1 cells, we evaluated the expression of co-inhibitory receptors related to their suppressive function at 7, 14, and 21 days of polyclonal expansion. Importantly, both the percentage (Figures 4A, S3A) and expression levels (MeFi, Figure 4B) of TIM-3, TIGIT and PD-1 were maintained in Exp-allo Tr1 cells throughout the polyclonal expansion. Of note, these co-inhibitory receptors were similarly expressed in expanded T conv, as it would be expected in long-term stimulated T cells (Figures S3A, B). Interestingly, Exp-allo Tr1 cells showed significantly increased levels (MeFI) of CD39 and CTLA-4 (Figure 4B) at 21 days of expansion compared to expanded T conv cells.
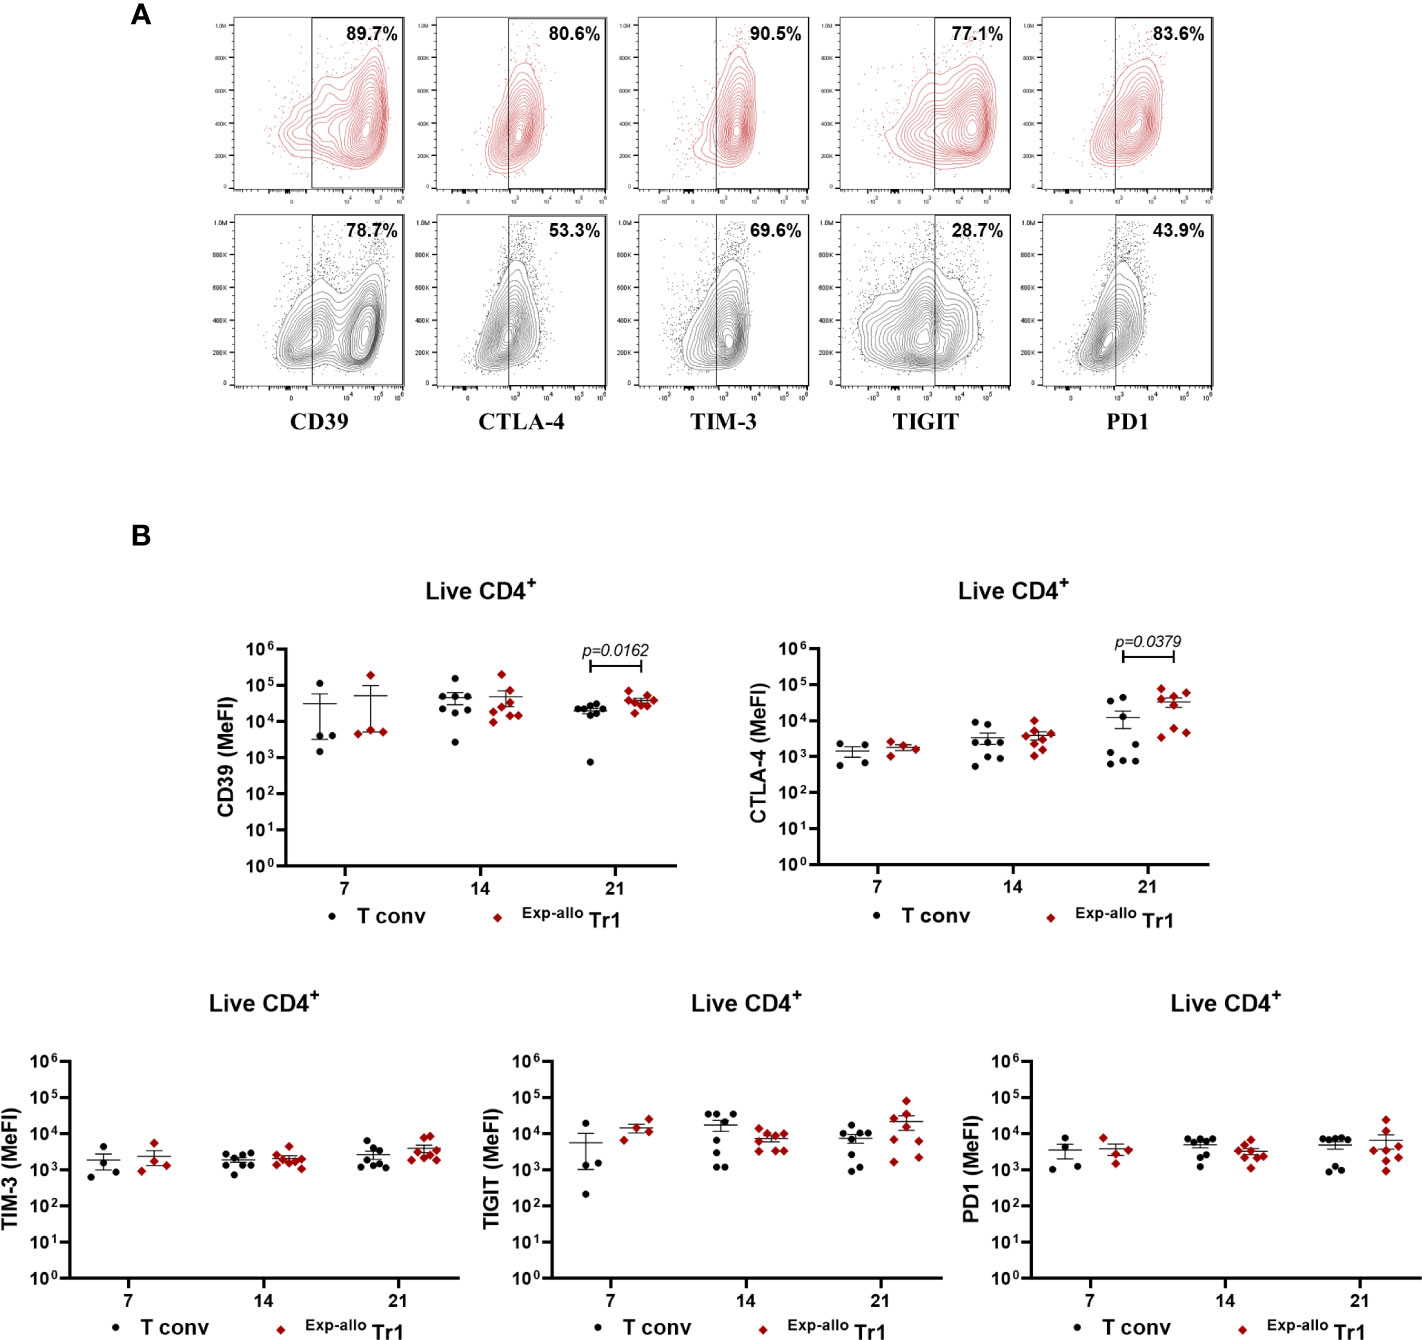
Figure 4 Long-term Exp-allo Tr1 cells maintain a high expression of co-inhibitory receptors. Purified Allo Tr1 cells were polyclonally expanded for 21 days and the expression of co-inhibitory receptors were evaluated. (A) Representative contour-plot of expression of co-inhibitory receptors in Exp-allo Tr1 cells (red) and Allo T conv (black). (B) Levels of expression (MeFI) of TIM-3, TIGIT, PD1, CTLA-4 and CD39 in Exp-allo Tr1 (red, n= 4-8) and Allo T conv (black, 4-8) at day 21 of stimulation. All experiments were performed in duplicates. Data are representative of six independent experiments. The results are shown as mean ± SEM. The statistical analysis were performed using an unpaired-t test or the Mann–Whitney U test.
3.3 High dimensional analysis of Exp-allo Tr1 confirms a distinct regulatory profile that differentiates from expanded T conv cells
Opt-tSNE was performed on live CD4+ cells from individual samples were down-sampled to 12,660 events per sample, individual samples were electronically barcoded, and finally concatenated for downstream analyses. A total of six samples post-expansion (from three individuals) were included in the analysis, three Exp-allo Tr1 cells and the corresponding T conv cells. Opt-tSNE was run using all compensated parameters except the previously gated live CD4 and prior parent populations. Two major islands were identified in the resulting opt-tSNE maps. These were pulled together predominantly according to Exp-allo Tr1 versus T conv expanded populations. Both major islands contained populations from all three patients (Figure 5A), demonstrating a non-patient bias in the dimensionality reduction.
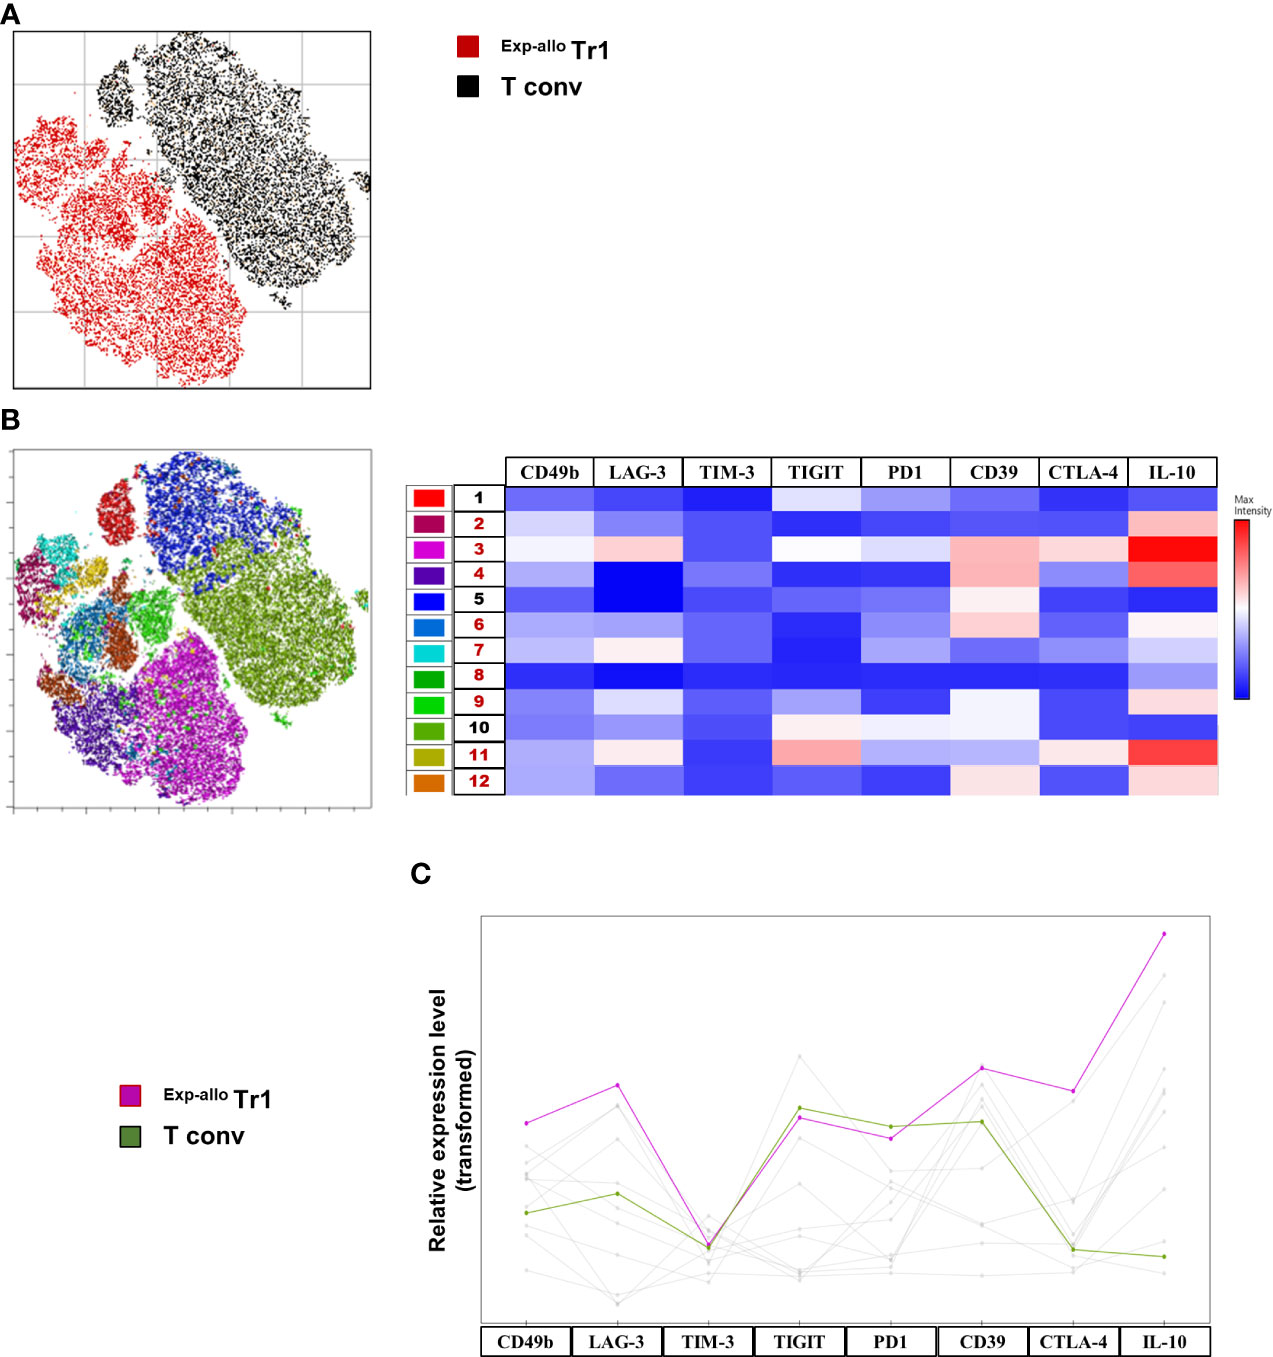
Figure 5 High dimensional analysis of Exp-allo Tr1 shows a differential expression profile compared to T conv cells. Purified Allo Tr1 cells were polyclonally expanded for 21 days, co-inhibitory receptors were evaluated, and high dimensional analysis was used to further identify and explore their expression profile. (A) Dimensionality reduction by Opt-SNE from live CD4+ Exp-allo Tr1 (n= 3) cells and T conv (n= 3) cells showed two major islands characterized by Tr1 (red) versus T conv (black) culturing conditions right panel). (B) X-Shift clustering analysis identified 11 clusters (excluding cluster 8, which represents 0.18% of the Tr1 population) corresponding to one major island composed of Exp-allo Tr1 (2, 3, 4, 6, 7, 9, 11 and 12) and the other with T conv (1, 5 and 10). The resulting heat map of median fluorescence expression from each cluster shows a distinct expression profile between Exp-allo Tr1 and T conv clusters. Clusters 3 and 10 were selected as representative of each culturing conditions clearly showing overexpression IL-10, CD39, LAG-3 and CTLA-4 wherein T conv were relatively low expressors for all these markers compared to Exp-allo Tr1 (C). Relative expression line graph of median fluorescence intensity shows the level expression of each co-inhibitory molecule from the underlying most representative populations: Exp-allo Tr1 (pink) vs T conv (green). Data are representative of two independent experiments.
To identify cell clustering within our high-dimensional data visualized with opt-tSNE, we ran X-Shift on the live CD4+ population (23). X-shift clustering identified 11 clusters (Figure S4), three clusters (Clusters 1, 5, 10) were found to have been composed exclusively from T conv cells and composing one of the two major opt-tSNE islands (Figure 5B). The remaining eight clusters (Clusters 2-4, 6-8, 9, 11-12) were found to have been composed exclusively of the Exp-allo Tr1 cells and composing the other major opt-tSNE island (Figure 5B). FlowJo’s ClusterExplorer and ViolinBox were used to phenotype the X-Shift clusters (Figure 5C). Importantly, only the eight clusters identified in the expanded Tr1 cells (Clusters 2-4, 6-8, 9, 11-12) expressed high IL-10, albeit at varying levels of expression. In contrast, T conv cell related clusters expressed lower levels of IL-10. We selected clusters 3 and 10, as the most representative of Exp-allo Tr1 (46%) and T conv (70%) respectively, and compared their expression profiles. As shown in Figures 5B, C, Cluster 3, in addition to IL-10, showed distinctive high levels of CD49b, CD39, CTLA-4 and LAG3 compared to Cluster 10, while both clusters expressed similar levels of TIGIT, TIM-3 and PD-1.
3.4 Exp-allo Tr1 cells express a chemokine receptor profile relevant for solid organ allotransplantation homing
The phenotypical characterization of Tr1 cell populations candidates in cellular therapy, has mainly focused on the expression of molecules involved in their suppressive function, nevertheless, the evaluation of CR expression is key to ensure the migratory potential of infused Tr1 and the induction of effective tolerance towards de graft. To evaluate the homing potential of our Exp-allo Tr1 cells, we evaluated at day 21 of expansion the expression of CCR2, CXCR3, CCR4, CCR5 and CCR7 which are known to direct the migration of T cells to the allograft and draining lymph nodes, respectively (Figure 6). As previously reported for Tr1 cells (17), we showed a high percentage of Exp-allo Tr1 cells expressing CCR5 (90.09% ± 4.9) and this was significantly increased compared to T conv cells (47.1% ± 12.8%). On the other hand, expression of CXCR3 and CCR4 showed a trend towards a decrease in Exp-allo Tr1 cells compared to T conv cells (CXCR3 60.3% ± 25.51 vs 86.30% ± 7.7, p=0.0940; CCR4 60.3% ± 9.7 vs 93.2% ± 5.2, p=0.0759). By contrast, we found lower expression of CCR7 in both Exp-allo Tr1 cells (26.08% ± 19.4) and T conv cells (18.6% ± 18) compared to other receptors while high proportion of both populations were CCR2+ (93.3% ± 4 vs 95.8% ± 1.1) (Figure 6B). Interestingly, when we compared the MeFI values of CR expression, we found significantly increased levels of CCR5, but decreased levels of CCR4, in Exp-allo Tr1 cells compared to T conv cells. Finally, CXCR3 was moderately upregulated on T conv compared to Exp-allo Tr1 cells and no significant differences were found in CCR2 and CCR7 MeFI values between both subpopulations (Figure 6C).
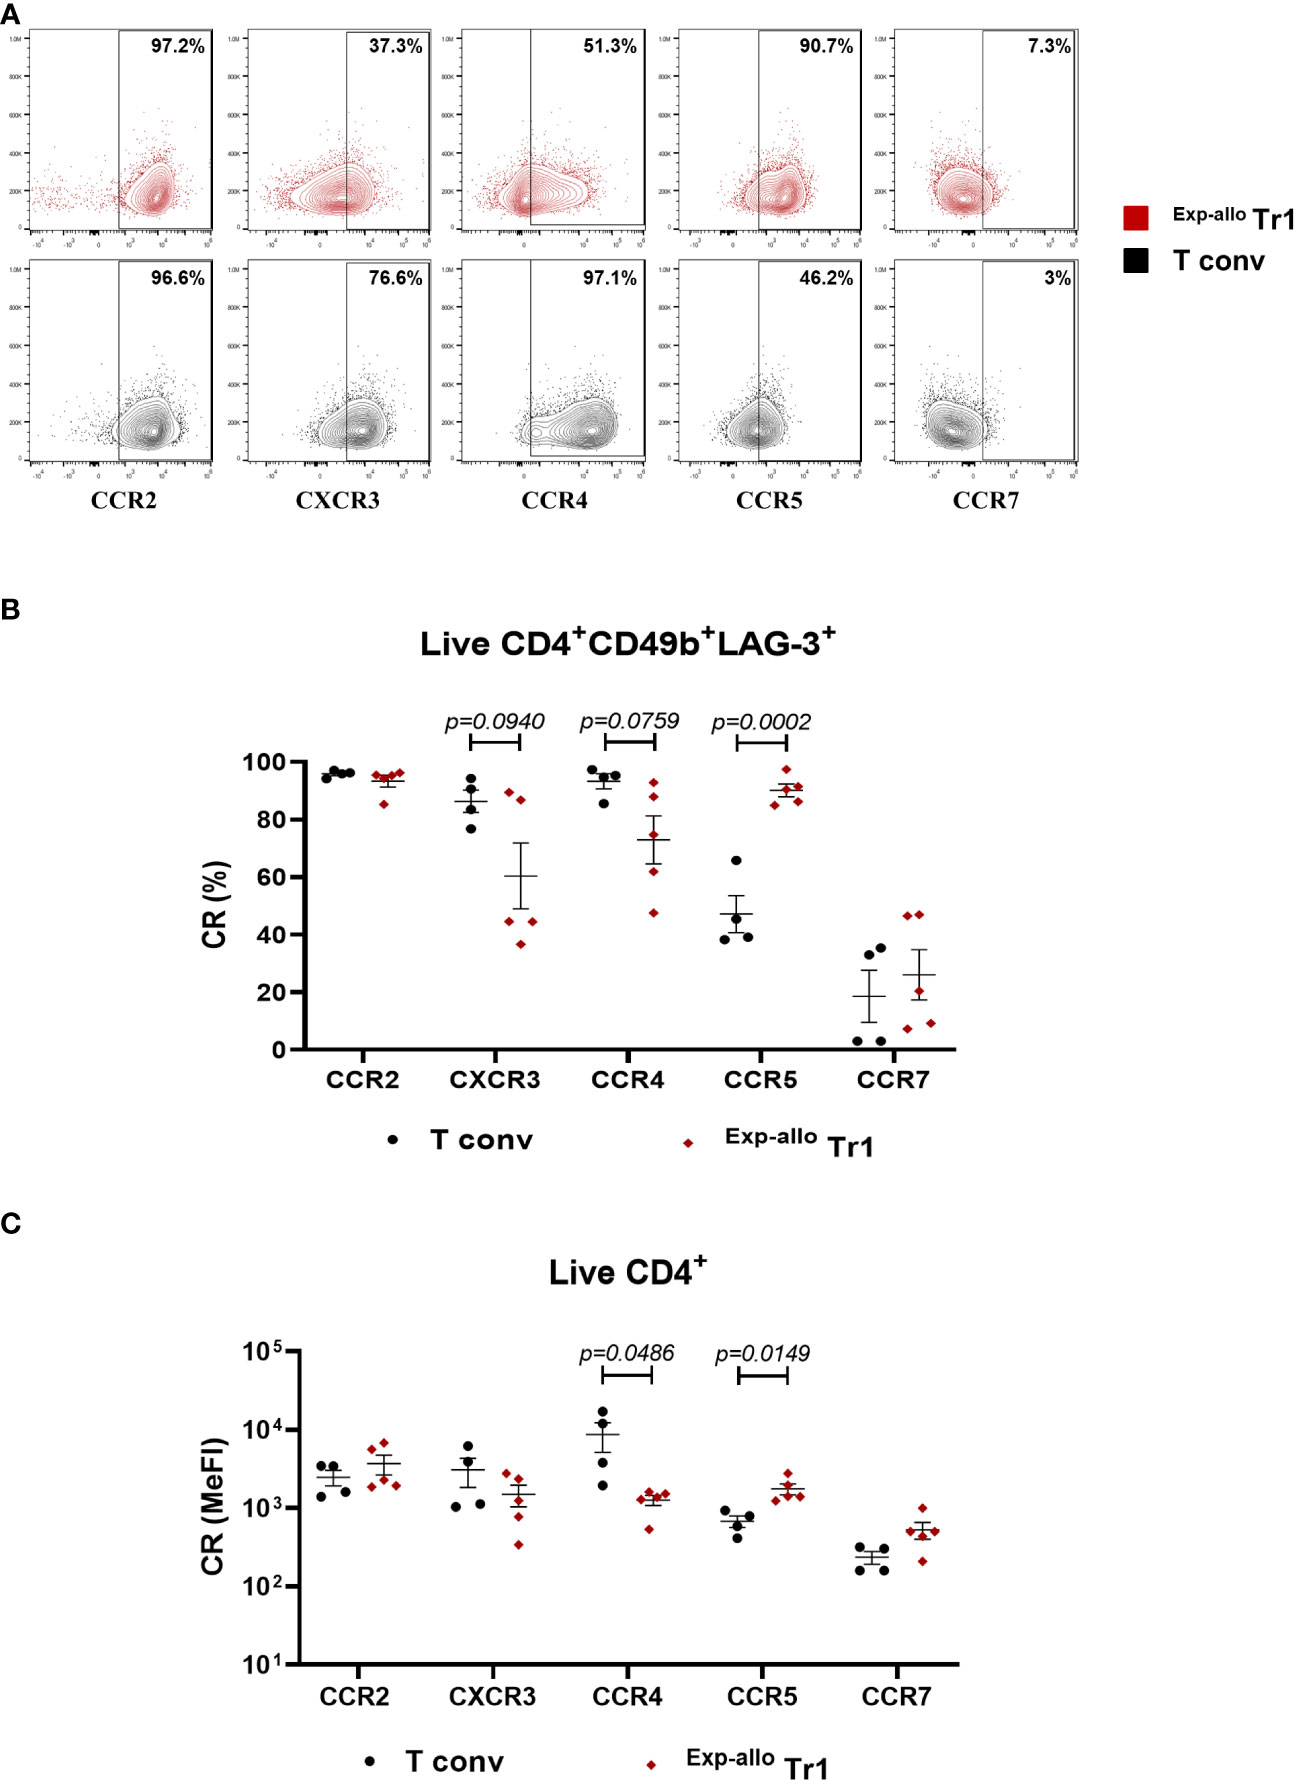
Figure 6 Exp-allo Tr1 cells show a high expression of chemokines receptors relevant for homing to allografts. Purified Allo Tr1 cells were polyclonally expanded for 21 days and the expression of CR receptors were evaluated. (A) Representative contour-plot of chemokines receptors expression in Exp-allo Tr1 cells (red) and Allo T conv (black). (B) Percentages or (C) levels of expression (MeFI) of chemokine receptors CCR2, CXCR3, CCR4, CCR5 and CCR7 in Exp-allo Tr1 cells (red, n= 5) and T conv (black, n= 4) at day 21 of expansion. All experiments were performed in duplicates. Data are representative of three independent experiments. The results are shown as mean ± SEM. The statistical analysis was performed using the unpaired t-test or the Mann–Whitney U test.
3.5 Exp-allo Tr1 cells secrete cytokines with an anti-inflammatory profile
Another essential aspect to consider in the characterization of Tr1 cells is their cytokine production profile. We evaluated the cytokine secretion from Exp-allo Tr1 cell supernatant cultures, using a cytokine-based assay (CBA) (Figure 7). As we expected, the production of the anti-inflammatory cytokines IL-10 and TGF-β were significantly higher in Exp-allo Tr1 cultures compared to expanded T conv cells. By contrast, the production of pro-inflammatory cytokines TNF-α, and IL-1β and IL-4, by Exp-allo Tr1 was decreased when compared to T conv cells. Additionally, the production of IL-17, IL-6, and IL-9 were very low or undetectable in both T cell populations. The secretion of IFN-γ, granzyme B (GzMB) and perforin has been previously reported in Tr1 cells (reviewed in (7)); here, we found a similar production of GzMB and perforin but a trend towards to increase the IFN-γ production in Exp-allo Tr1 compared to T conv cells. Remarkably, the production of IL-2 was lower in T conv in comparison with Exp-allo Tr1. In conclusion, the cytokine production of the Exp-allo Tr1 cells fits with an anti-inflammatory profile.
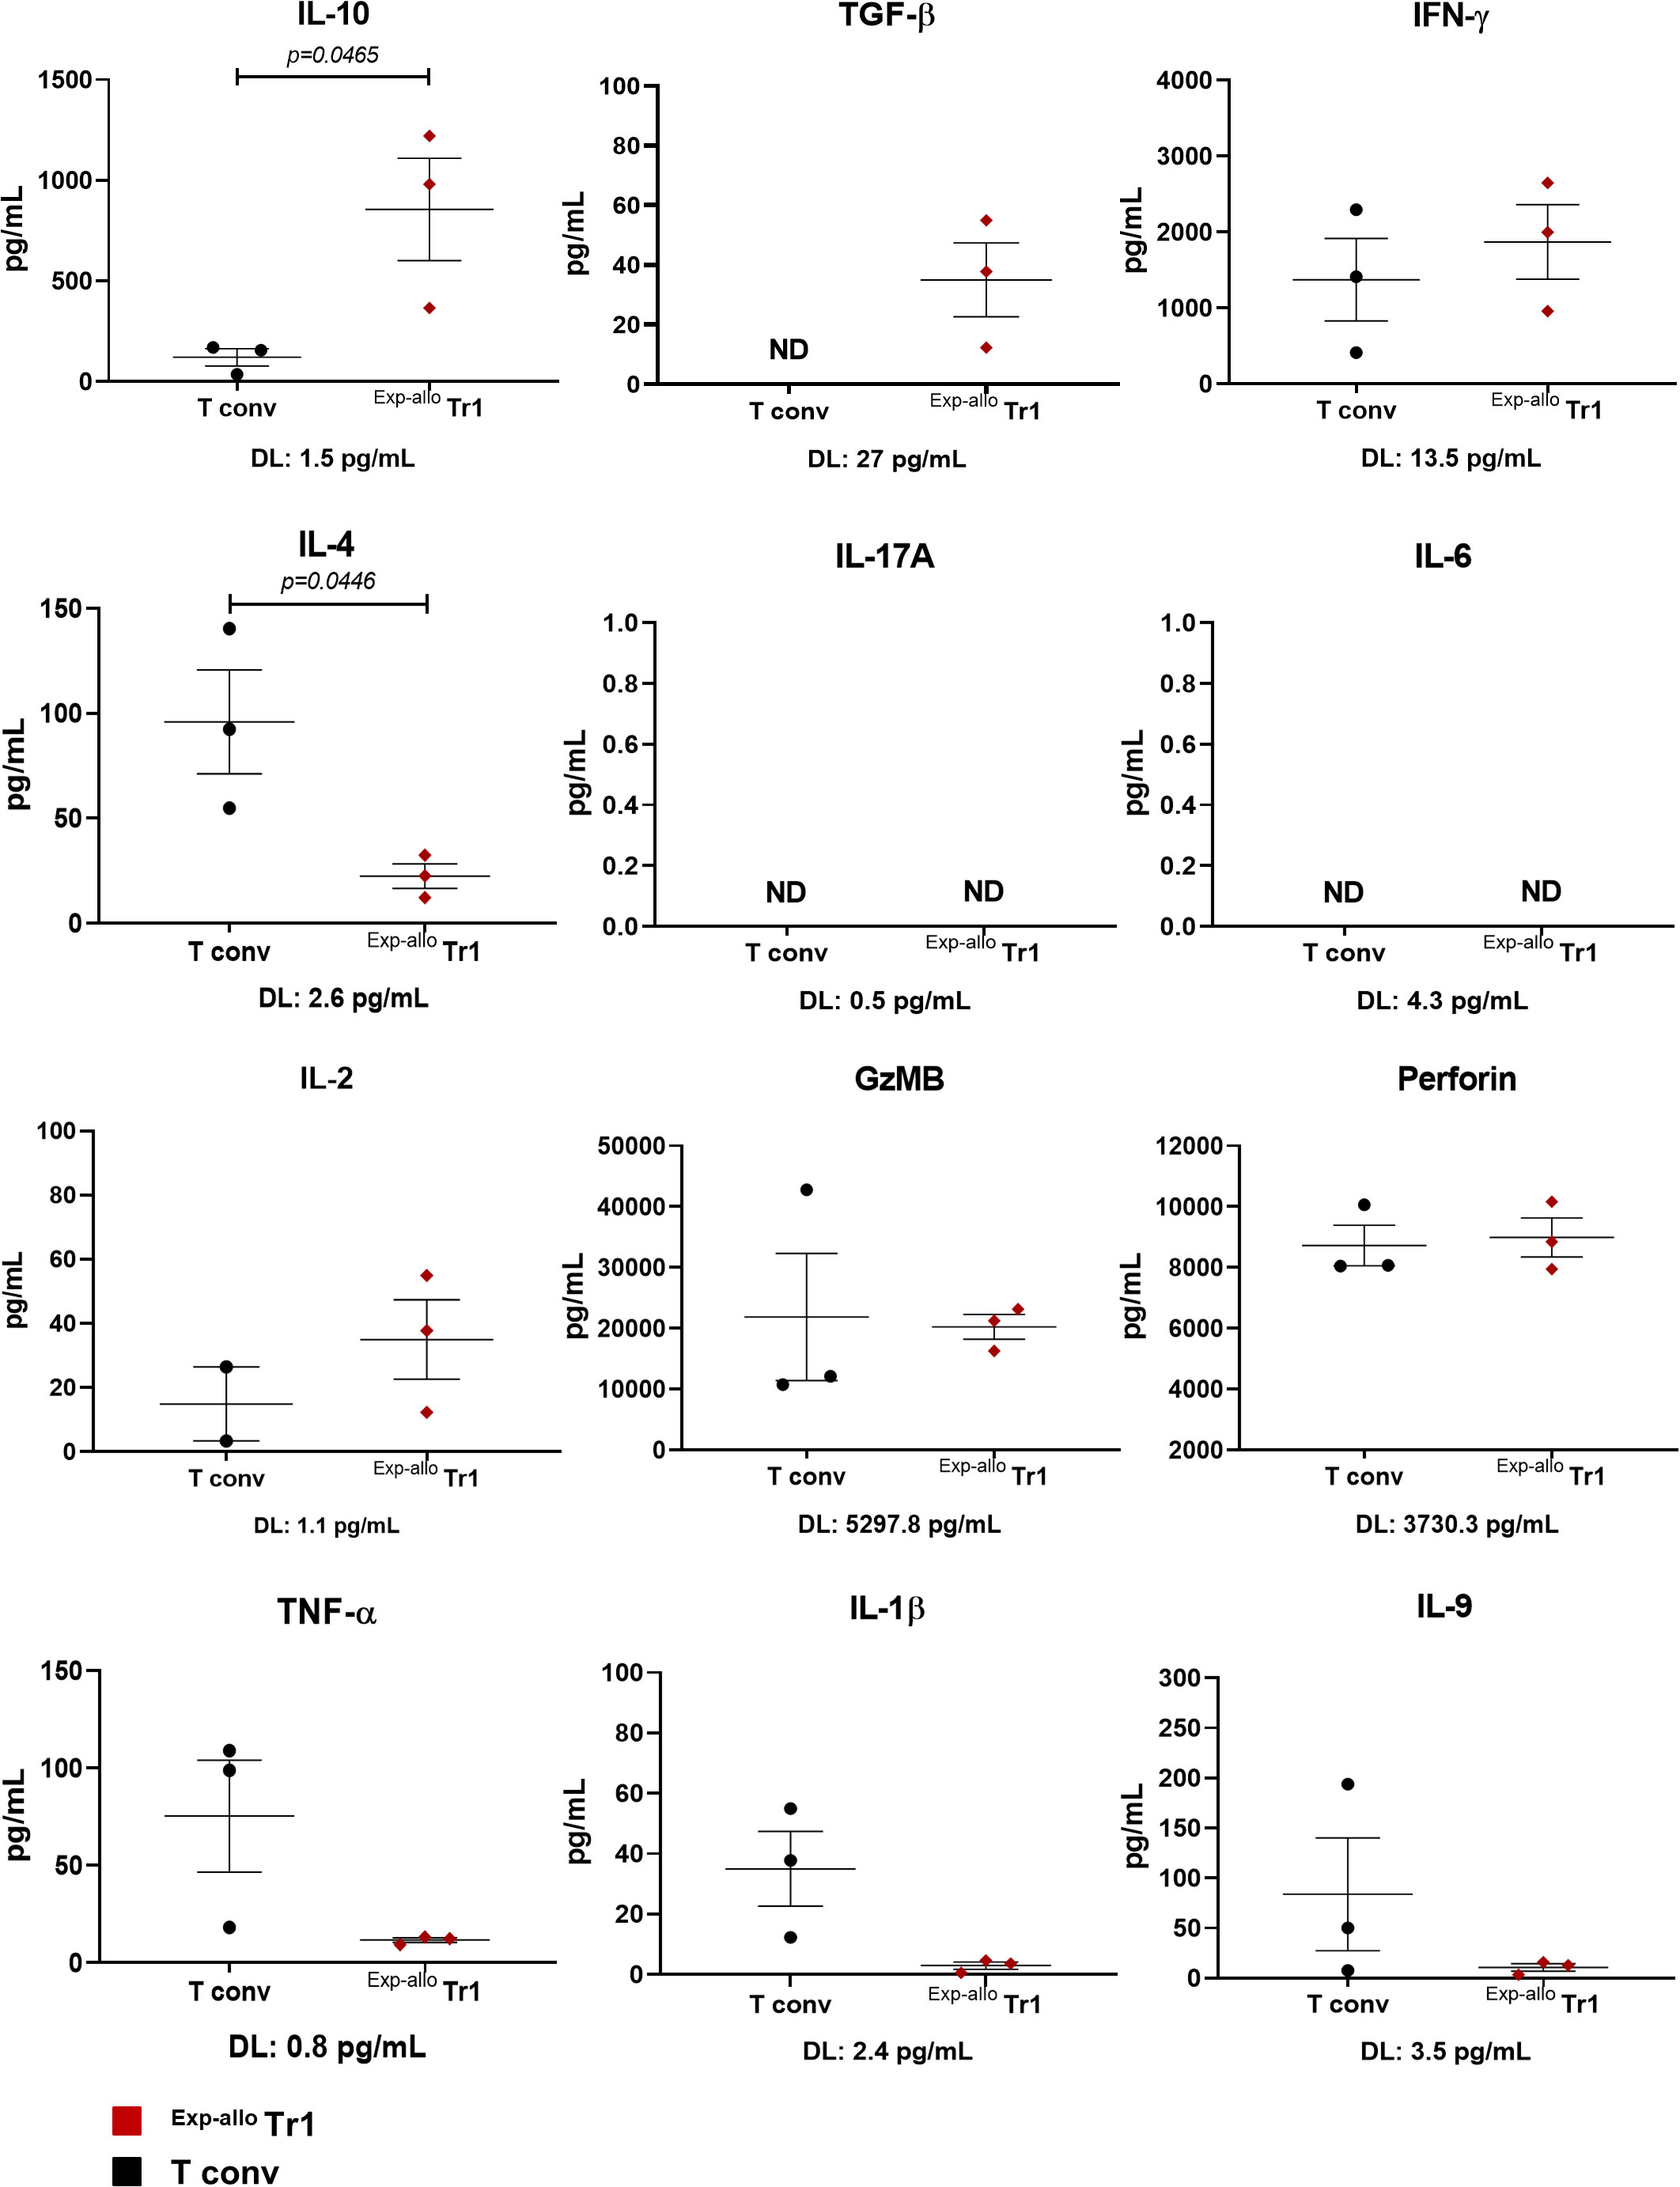
Figure 7 Prolonged expanded Allo Tr1 has a higher production of anti-inflammatory cytokines, but does not produce inflammatory cytokines. Exp-allo Tr1 cells (red, n= 3) and T conv (black, n= 3) cells expanded for three weeks were restimulated for 4 days, and supernatants were analyzed for cytokine production by cytometric bead array. The detection limits (pg/mL) for each cytokine are shown below each graph. All experiments were performed in duplicates. Data are representative of three independent experiments. The results are shown as mean ± SEM (n= 3). Statistical analysis was performed using an unpaired t-test or the Mann Whitney U test.
3.6 Exp-allo Tr1 cells suppress responder T cells proliferation efficiently
After phenotypical characterization of Exp-allo Tr1 cells and to ensure the functionality, we next evaluated their ability to suppress allospecifically CD4+ and CD8+ responder T cells (R.T.C.). As shown in Figure 8, we observed a reduction of the R.T.C. proliferation at all ratios evaluated, showing the most significant suppression at the 1:1 ratio for both CD4+ (Figures 8A, B) and CD8+ T cells (Figures 8C, D). Importantly, the suppressive capacity of Exp-allo Tr1 cells was significantly lower when T cells were stimulated with allogeneic moDC from a not related individual (Third-party) compared to the DCs towards which they were initially expanded (Allo) for both CD4+ (Figures 8E, F) and CD8+ (Figures 8G, H) proliferation.
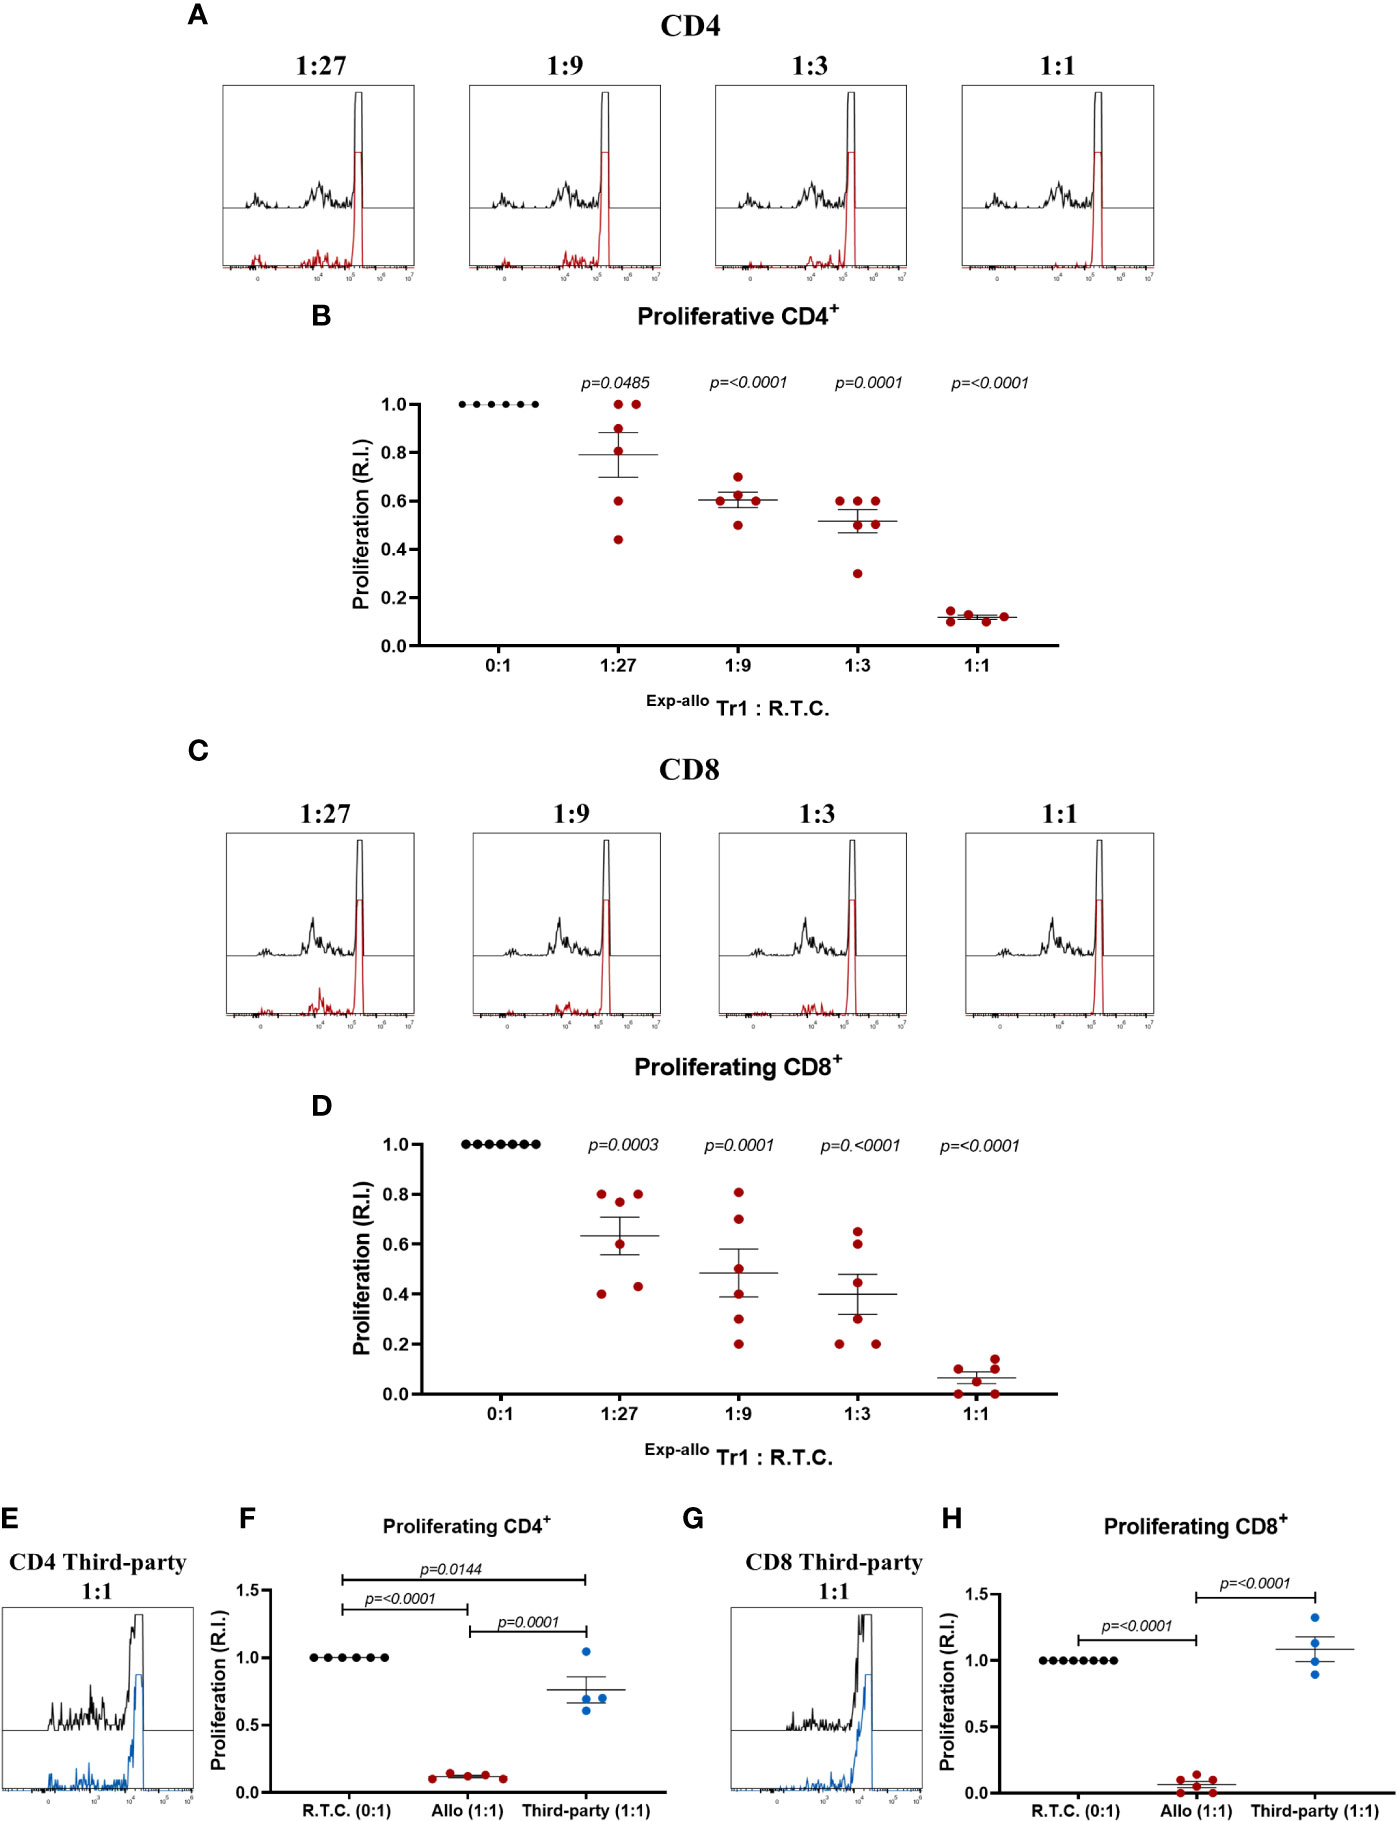
Figure 8 In vitro Exp-allo Tr1 cells suppress the proliferation of T conv cells in an alloantigen-specific way. Exp-allo Tr1 were co-cultured with conventional CD3+ R.T.C. (labeled with CFSE) at different evaluated ratios and stimulated with allogeneic moDC from their respective donors or from non-related individuals (Third Party); on day 4 of culture, R.T.C. proliferation was evaluated by flow cytometry. (A–D) Exp-allo Tr1 inhibited the proliferation of both CD4+ (A, B) and CD8+ (C, D) R.T.C. at all evaluated ratios (n= 5-6). (E–H) Exp-allo Tr1 suppresses the proliferation of CD8+ (E, F) and CD4+ (G, H) R.T.C. cells only when they are stimulated with the allogeneic DCs with which they were initially expanded (Allogenic, red, n= 4-5), but do not suppress when they are stimulated with unrelated DCs (Third Party, blue, n= 4). Representative histograms are shown in (A), (C) and (E). All experiments were performed in duplicates. Data are representative of four independent experiments. The results are shown as mean ± SEM. Statistical analysis was performed using the unpaired-t test or one sample t and Wilcoxon test.
Under inflammatory conditions, it has been demonstrated that some cytokines (IL-1β, TNF-α, IL-6) may be involved in FOXP3+ Treg suppression downmodulation (18, 25, 26), however this has not yet been extensively studied in Tr1 populations. Thus, we evaluated the suppression of Exp-allo Tr1 cells in the presence of an inflammatory environment. Markedly, Exp-allo Tr1 cells were able to suppress the CD4+ (Figures 9A, B) and CD8+ (Figures 9C, D) R.T.C proliferation even in the presence of exogenous IL-1β, IL-6, IFN-γ and TNF-α in the co-cultures, either alone or all together.
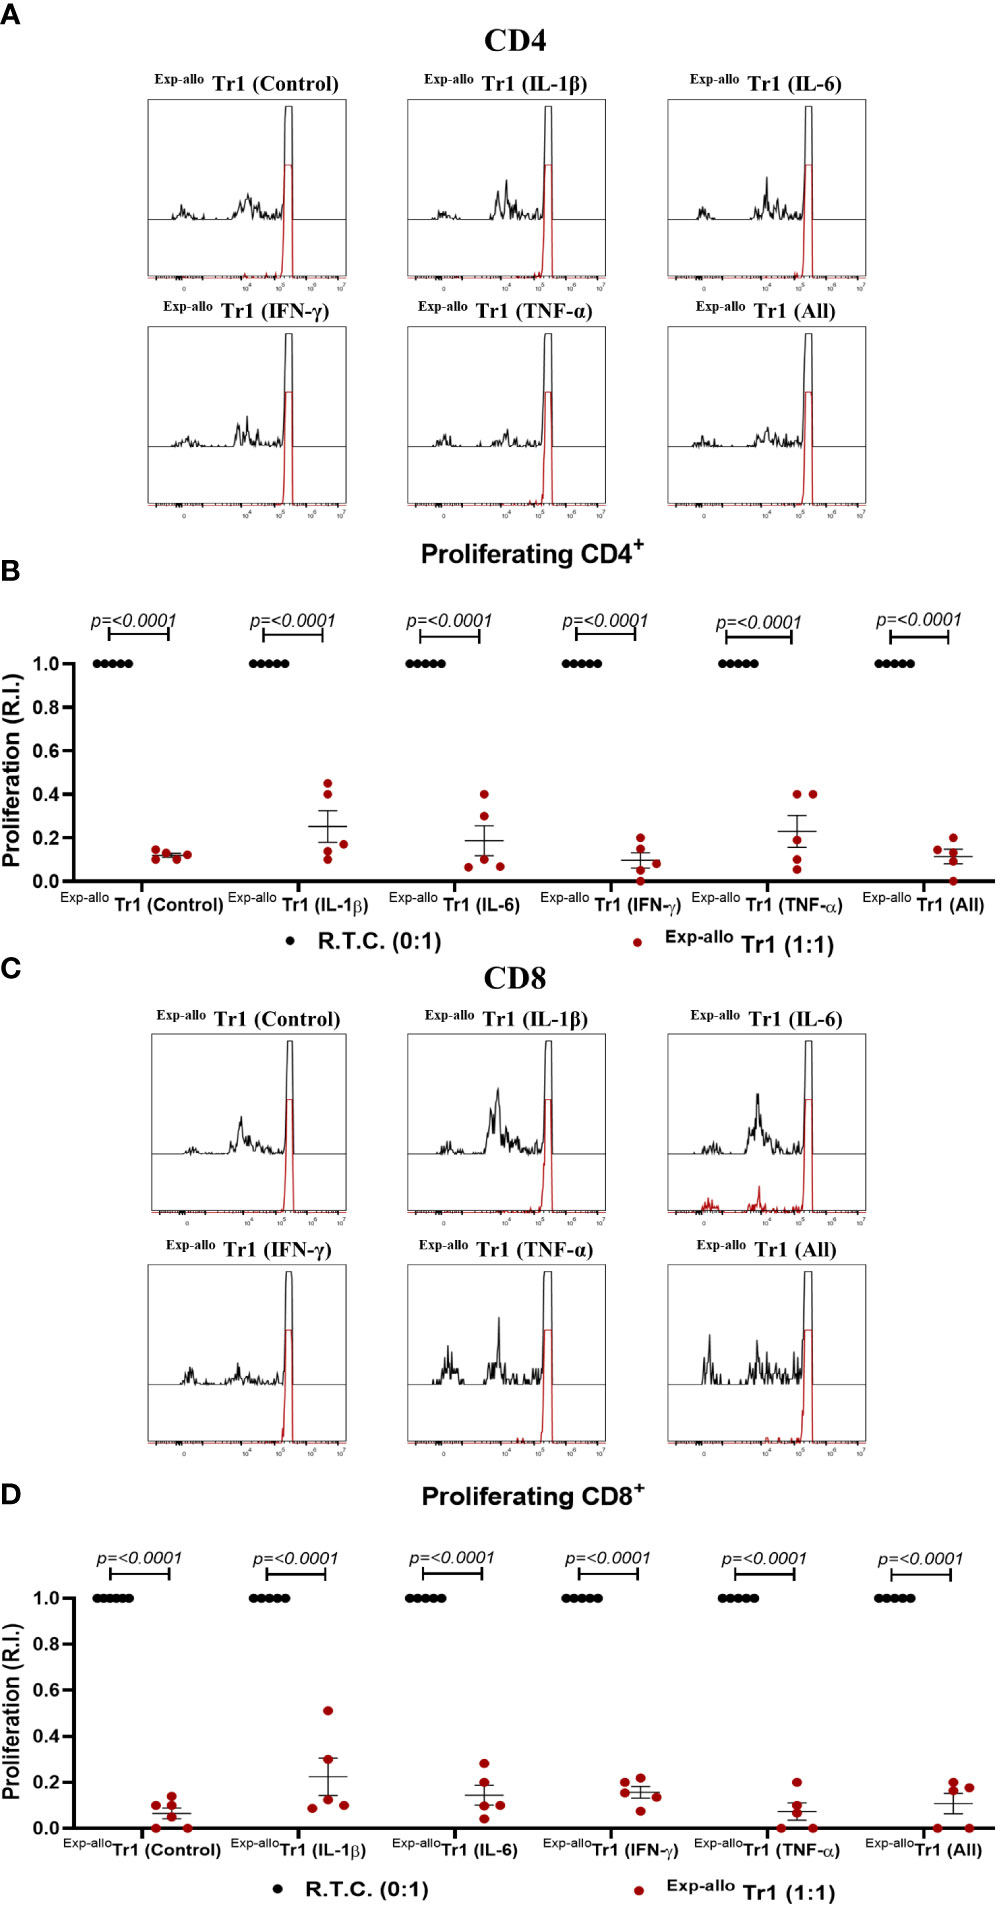
Figure 9 Exp-allo Tr1 cells maintain their suppressive capacity in presence of inflammatory cytokines. Co-culture of Exp-allo Tr1 and conventional CD3+ T cells were stimulated with allogeneic moDC in the presence or absence of inflammatory cytokines and T cell proliferation was evaluated. (A–D) Exp-allo Tr1 efficiently suppressed the proliferation of both CD8+ (A, B) and CD4+ (C, D) R.T.C. in the presence of inflammatory cytokines IL-1β, IL-6, IFN-γ, TNF-α or all together (n= 5). All experiments were performed in duplicates. Data are representative of four independent experiments. The results are shown as mean ± SEM. Statistical analysis was performed using the unpaired-t test or one sample t and Wilcoxon test.
3.7 Proinflammatory cytokines do not affect the phenotype and suppressive function in Exp-allo Tr1 cells
It has been widely reported that an inflammatory microenvironment can directly influence the phenotype or functionality of CD4+ T cells. Thus, Exp-allo Tr1 cells were further expanded for two extra weeks in the presence of IL-2 plus rhIL-1β, rhIL-6, rhIFN-γ, rhTNF-α, or all together, or with IL-10 (Exp-allo Tr1 control conditions). After these two extra expansion rounds, we did not observe significant difference in neither CD49b and LAG-3 (Figures 10A, B) nor in TIM-3, TIGIT, PD-1, CD39, CTLA-4 expression and in the IL-10 production under proinflammatory cytokine conditions (Figure 10C).
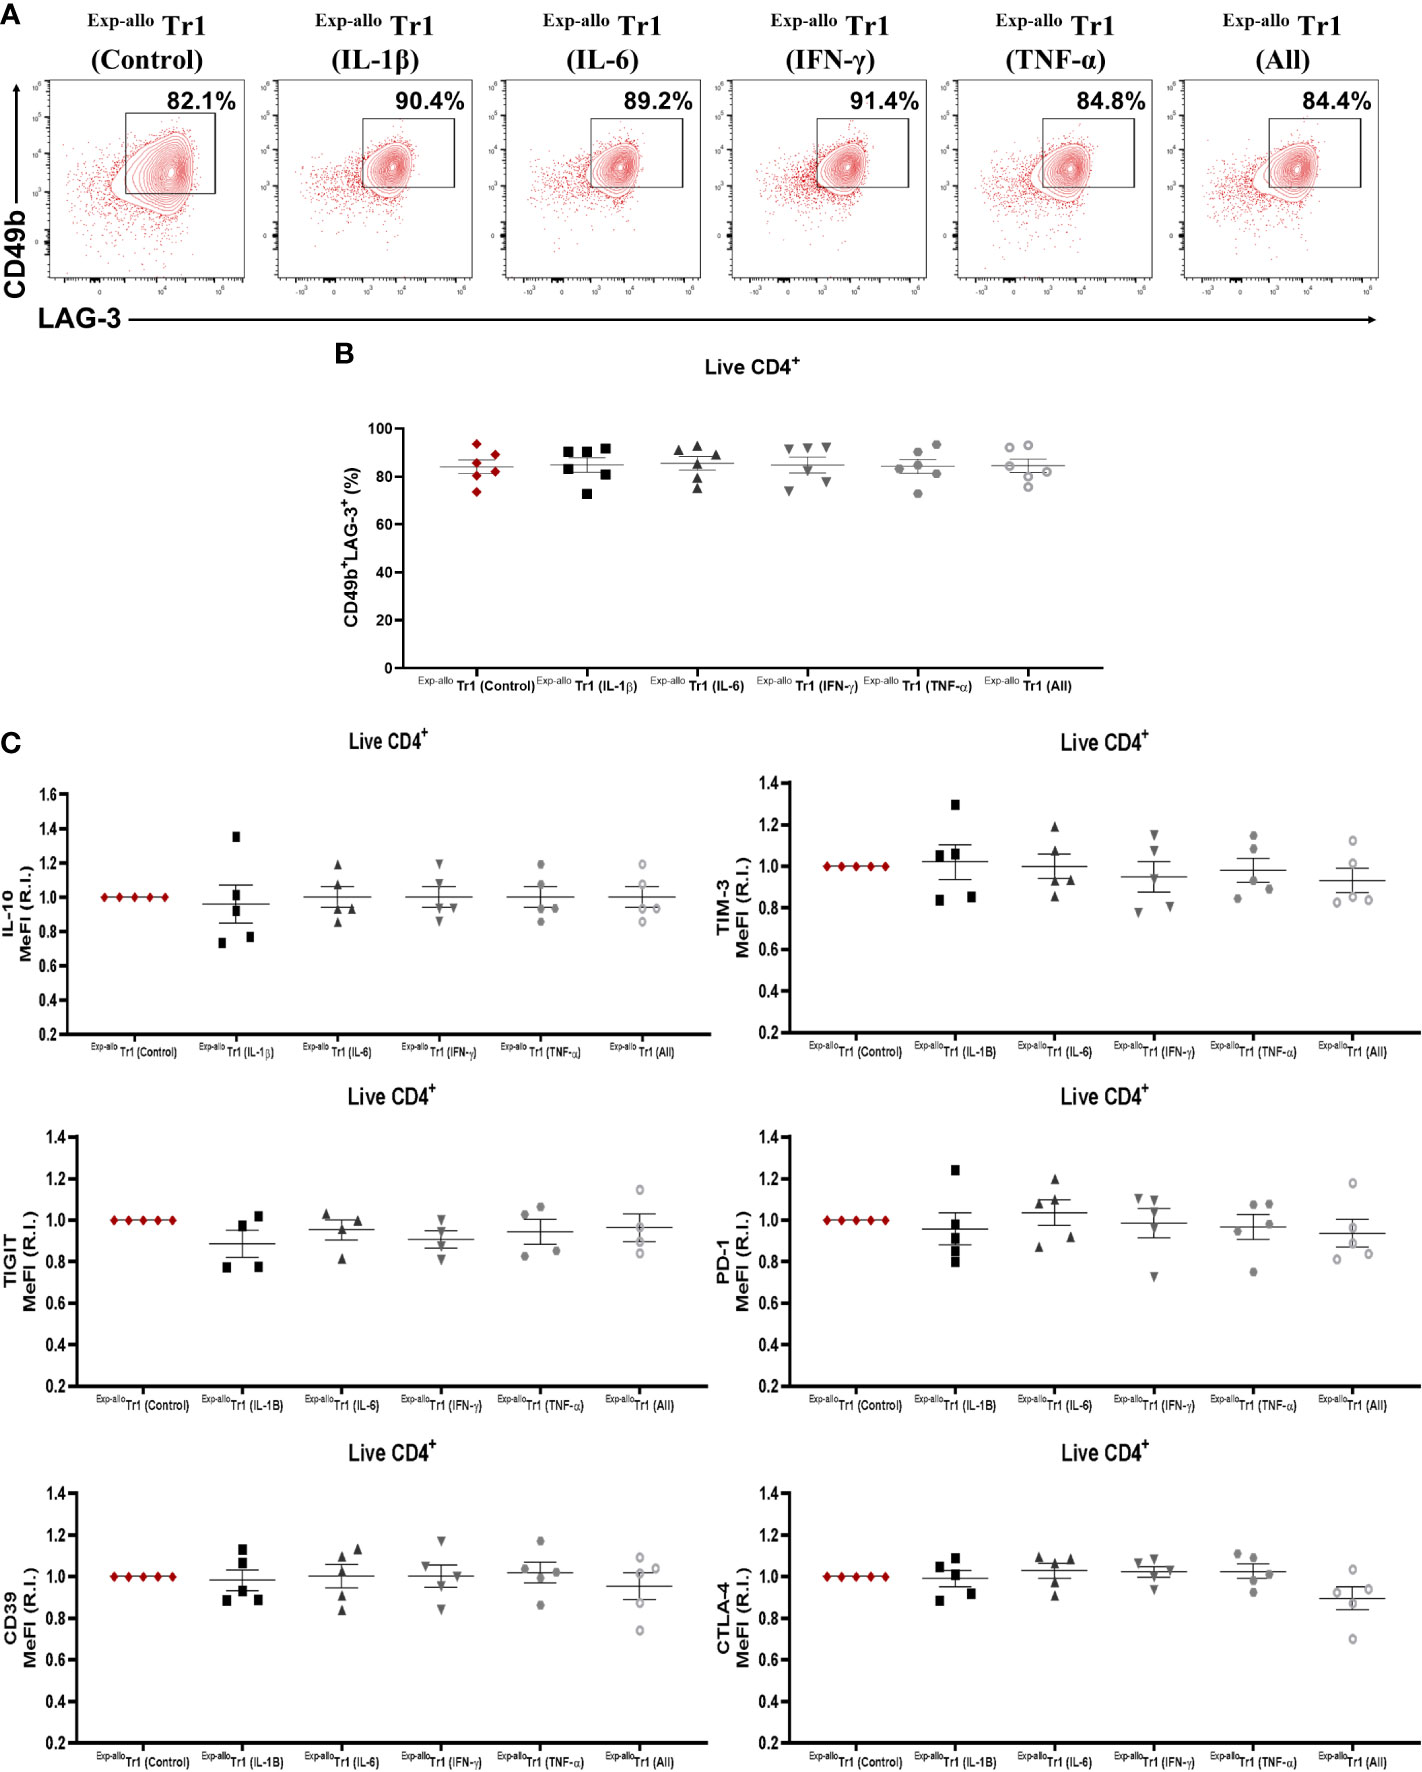
Figure 10 Exp-allo Tr1 cells maintain their immunosuppressive phenotype after stimulation in an inflammatory microenvironment. Exp-allo Tr1 cells were stimulated with anti-CD3/anti-CD28 in the presence or absence of pro-inflammatory cytokines (IFN-γ, IL-6, IL-1β, TNF-α or all together) for two additional weeks. (A) Representative contour-plot of CD49b and LAG-3 expression in Exp-allo Tr1 activated in presence of inflammatory cytokines. (B) Proportion of CD49b+LAG-3+ expression in Exp-allo Tr1 cells activated in presence or absence of inflammatory cytokines (n= 5). (C) Relative increase (IR) of IL-10, TIM-3, TIGIT, PD-1, CD39 and CTLA-4 (MeFI). RI was calculated by dividing the value of all the conditions by the value of control Exp-allo Tr1 condition. All experiments were performed in duplicates. Data are representative of four independent experiments. The results are shown as mean ± SEM. Statistical analysis was performed using the unpaired-t test or one sample t and Wilcoxon test. No significant differences were observed.
Once we demonstrated that phenotype and IL-10 production were not affected by pro-inflammatory cytokines, we next evaluated if Exp-allo Tr1 cells were able to maintain the capacity to suppress R.T.C. proliferation. As shown in Figure 11, we observed that Exp-allo Tr1 preserved their suppressive potential towards CD4 and CD8 R.T.C. proliferation, even after being expanded in the presence of all the pro-inflammatory cytokines together. (Figures 11A, B). These results support our previous observation of the stability of Exp-allo Tr1 suppressive function in presence of proinflammatory cytokines (Figure 8).
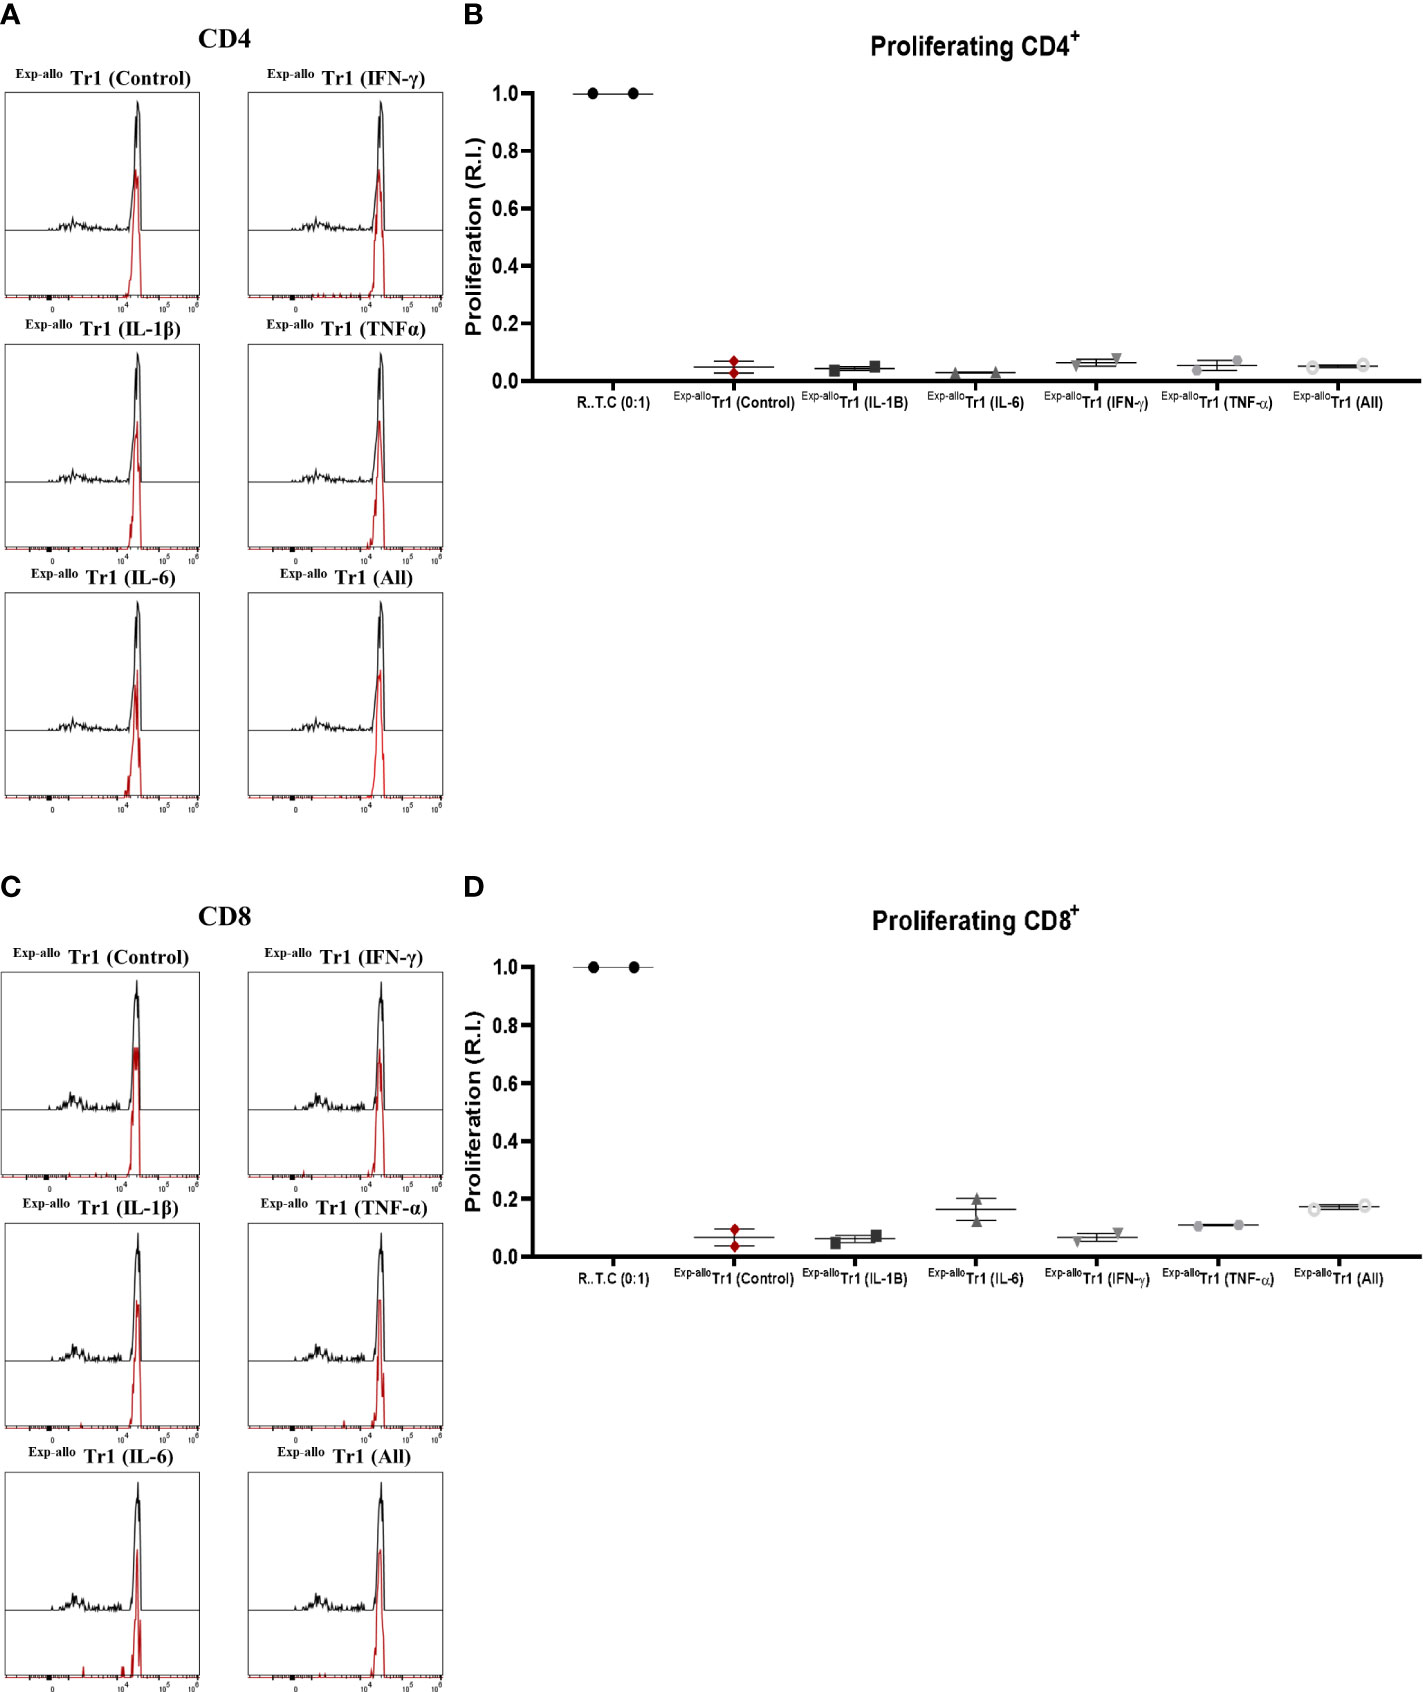
Figure 11 Exp-allo Tr1 cells maintain their suppressive function after stimulation in an inflammatory microenvironment. Exp-allo Tr1 activated in presence or absence of pro-inflammatory cytokines (IFN-γ, IL-6, IL-1β, TNF-α or all together) were co-cultured with conventional CD3+ R.T.C. (labeled with CFSE) at 1:1 ratio and stimulated with allogeneic moDC from their respective donors, on day 4 of co-culture. (A–D) Exp-allo Tr1 efficiently suppressed the proliferation of both CD4+ (A, B) and CD8+ (C, D) R.T.C. after being activated in presence of IL-1β, IL-6, IFN-γ, TNF-α or all together (n= 2). All experiments were performed in duplicates. Data are representative of two independent experiments. The results are shown as mean ± SEM. Statistical analysis was performed using the unpaired-t test or one sample t and Wilcoxon test.
4 Discussion
In recent years new advances in the in vitro generation of Tr1 have demonstrated their potential as therapeutic tools for transplantation tolerance. IL-10 tolerogenic capacity was exploited to establish two experimental protocols; one used allogeneic CD3-depleted PBMC to generate IL-10 anergized T cells, containing Tr1 cells (IL-10-DLI) (27), and the other used tolerogenic DC10, with high production of IL-10 and co-expression HLA-G and ILT-4 (24), giving rise to T10 or T-allo 10 (reviewed in (7). Both methodologies have been implemented using GMP grade standards showing promising results in clinical trials and a beneficial outcome in HSCT patients for improving immune reconstitution without increasing the risk of GvHD (ALT-TEN (15), NCT01656135 (16), and NCT03198234 (17).
As previously mentioned, we used monocyte-differentiated DC10 in ours protocol and we were able to generate a higher percentage of CD49b+LAG-3+ Allo Tr1 compared to previous works (46.5% ± 19.1 vs 6% ± 3 (16) and 10.5% [9 to 13% interquartile range (IQR)] (17). These differences might be because we performed some modifications in the original protocol, including a restimulation with rhIL-10 (10 ng/mL) and rhIL-2 (50 U/mL) in the co-cultures at day 7, compared to the work of Gregory et al, where only add rhIL–2 (20 U/mL) (24). It has been reported that IL-10 signaling is required to promote Tr1 cell differentiation (28), while IL-2 signaling promotes the proliferation and survival of T cells (29). Additionally, we used non-irradiated DC10 as stimulators which were able to induce a higher percentage of CD49b+LAG-3+ Allo Tr1 compared to irradiated DC10 (46.5% vs 12.0%, data not shown). These results suggest that in addition to IL-10 production and HLA-G/ILT4 signaling (24), another important stimulus provided by non-irradiated DC10 could be contributing to the Allo Tr1 differentiation.
When we evaluated IL-10 production by a flow cytometry-based IL-10 secretion assay at day 14 of co-culture (DC10:nT), we found an average of 28.7% ± 15 of IL-10+ cells within the CD49b+LAG-3+ population, which identifies functional Tr1 cells. This method ensures a direct detection of IL-10 producing Allo Tr1 cells (9), without interference of other potential contaminating subpopulations in the co-culture, which cannot be avoided in the studies using ELISA-based methods previously reported (16, 17).
One of the main challenges in the field of Tr1 therapy is the isolation of a pure Tr1 cell population that could increase the efficiency of the treatment in vivo and reduce possible long-term side effects induced by contaminating effector cells in the final population. Additionally, cell therapy using FACS-based isolation protocols have shown safety in clinical trials in kidney transplant patients (30, 31). With this aim in mind, we purified the CD49b+LAG-3+ cells from the initial allogeneic co-cultures by FACS sorting to ensure the obtention of an homogeneous Tr1 cell population. This is highly relevant for cell therapy purposes as it has been recently reported that Tr1 cells are the main functionally active component within T-allo 10 cell product displaying different suppressive mechanisms (17). Thus, infusion of a highly purified Tr1 subpopulation may allow to reduce the total cell numbers required to maintain long term tolerance.
To date, few clinical trials have been reported using a heterogeneous population of tolerogenic cells that contain different proportions of Tr1 cells. These studies determined the number of cells to be infused per kg of body weight based on the characteristics of the cellular population. It has been suggested that the number of cells required for clinical trials ranges from 3 x 10⁵-6/kg (CD3+ cells) (15) to 11-19 x 106/kg containing sufficient Tr1 cells for inducing efficient allograft tolerance. However, in these studies the actual numbers of Tr1 cells was not directly evaluated, but rather, the numbers of infused cells were adjusted based on their in vitro tolerogenic potential (16). Considering the relatively low numbers of purified Tr1 cells obtained from our allogeneic co-cultures, we developed a polyclonal expansion protocol that allowed an increase of 840 times the initial numbers at day 21. In addition, our protocol allows us to determine the numbers of Tr1 cells transferred and may reduce the numbers Tr1 needed to achieve tolerance. To our knowledge this is the first protocol that enables allospecific Tr1 cell expansion. A different approach for total polyclonal Tr1 ex vivo expansion has recently reported a 70-fold increase after 18 days of expansion with anti-CD3 and anti-CD28 beads (32), although the authors reported less than 50% of CD49b+LAG-3+ cells within the expanded population, while our expansion protocol maintained more than 80% of Allo Tr1 for over three weeks of expansion.
Currently, co-expression of CD49b and LAG-3 molecules together with IL-10 production, are the current markers used to identify Tr1 cells. Interestingly, Exp-allo Tr1 cells showed higher expression levels of LAG-3 compared to T conv cells and furthermore, IL-10 production was maintained through the expansion cycles (Figure 2), demonstrating that LAG-3 and IL-10 are closely related to Exp-allo Tr1. In addition, the expression of other co-inhibitory molecules have also been related in different scenarios to the Tr1 cell identity as well as their capacity to suppress effector T cells. In this context, murine CD49b+LAG-3+IL-10+ Tr1 cells expressing TIM-3, TIGIT and PD-1 have been related with a higher suppressive function compared with “Tr1-like” subpopulations, showing low or null expression of these molecules (9). Another report demonstrated that the ectoenzyme CD39 is important for Tr1 suppressive functions through the generation of adenosine (33). While human Tr1 cells have shown a higher expression of CTLA-4 and PD-1 compared to non-Tr1 cells, moreover, both molecules were key for the suppressive function against effector cells (17). The constant expression of TIM-3, TIGIT, PD1, CD39, and CTLA-4 during 21 days of expansion on Exp-allo Tr1 was in agreement with a high suppressive function. Notably, the higher expression of CTLA-4, CD39, LAG-3 and IL-10 in our Exp-allo Tr1 at day 21, compared to T conv, might be directly related to their suppressive potential.
In addition to expressing co-inhibitory receptors, CIR+ Tr1 were also reported to express CCR5, which is also displayed by our Exp-allo Tr1. The functional relevance of CCR5 and CXCR3 expression on T conv cells has been described to be pathogenic in mice and human solid organ transplantation (34). In accordance, combined CXCR3 and CCR5 blockade were effective for prolonging allograft in a model of allogeneic heart transplantation (35), thus the expressión of these receptors in Tregs could suggest a tolerance induction as a result of direct suppression on T conv. However, detailed expression of chemokine receptors on in vitro differentiated Tr1 cells had not been yet evaluated. To aim for the potential clinical use of Exp-allo Tr1 cells to generate allograft tolerance, the evaluation of chemokine receptors with homing potential toward the allograft needs to be considered. In the context of kidney transplantation, expression of CXCR3, CCR2 and CCR4 on Foxp3+ Tregs was found to be key in preventing allograft rejection (reviewed in (20)). Therefore, expression of CXCR3, CCR2 and CCR4 in our Exp-allo Tr1 cells (Figure 6) strongly suggest their potential homing towards the kidney allograft.
As several co-inhibitor receptors are expressed by other T cell subpopulations, including long-term stimulated T cells, it was important a deeper phenotypic analysis that allowed us to distinguish our Exp-allo Tr1 cells from activated T conv cells, that may also display markers typically expressed by exhausted T cells (36, 37). In this context, high dimensional analysis of multiparametric flow cytometry data has been employed for the characterization of tumor-infiltrating lymphoid populations (38) as well as in phenotypic analysis of Treg cell subpopulations (39). Importantly, our opt-tSNE analysis demonstrated that Exp-allo Tr1 cells are clearly distinguishable from activated T conv cells, as they each group into distinct islands (Figure 5A) and with each island being differentiated by the expression of IL-10 (Figures 5B, C).
An important mechanism of Treg-mediated suppression is closely related to their cytokine secretion profile. As expected, and as previously reported in Tr1 cells, IL-10, TGF-β, IFN-γ, GzMB and perforin were significantly produced by our Exp-allo Tr1 confirming their identity (Figure 7). Besides, our Exp-allo Tr1 cells also produced low levels of IL-2 and IL-4 (8, 40, 41). On the other hand, parallel cultures using expanded T conv cells showed moderate production of IL-2 and IFN-γ which is is in agreement with the long-term expansion conditions used and correlate with the expression of several markers typically expressed by exhausted T cells (TIGIT, TIM-3 and PD-1) (29, 37). The secretion of IL-10 and TGF-β was higher in our Exp-allo Tr1 cells compared to T conv cells, according to their suppressive phenotype. In contrast, the pro-inflammatory cytokines TNF-α and the Th2 cytokine IL-4 were singularly produced by expanded T conv cells compared with Exp-allo Tr1 cells confirming their differential inflammatory versus regulatory phenotype. Of note, Exp-allo Tr1 cells did not produce detectable levels of IL-17 as it has been reported for effector T cells (42). In addition, GzMB and perforin, that are important mechanisms for Tr1-mediated suppressive function, were significantly expressed to comparable levels with activated T conv cells (9, 43, 44), indicating their cytotoxic potential.
Most impressive are the findings of the suppressive function of Exp-allo Tr1 cells against allospecific CD4+ and CD8+ T cells, in accordance with the phenotypic characteristics of these cells. In contrast with other reports where allogeneic suppression was assessed at a ratio of 1:1, using an heterogeneous population of Tr1-containing cells (16, 17), we explored the Exp-allo Tr1 suppressive potential by comparing different Tr1:R.T.C. ratios, showing that Exp-allo Tr1 are able to suppress both CD4+ and CD8+ allogeneic T cells from 1:27 ratio, showing the highest potential at 1:1 ratio. This allows us to identify more precisely the suppressive function of a specific number of Tr1, and therefore extrapolate the effective Tr1 dose needed for in vivo tolerance. Remarkably, after polyclonal expansion our Exp-allo Tr1 remains allospecific, as proliferation towards third-party is significantly lower than to allo DCs.
One of the major concerns in Treg therapy is to ensure long term stability of the infused cells (45). Several studies have reported that several cytokines, including IL-6, IL-23 TNF-α, IL-17 and IL-4, can promote a downregulation of FOXP3, leading to the loss of their suppressive capacity and acquisition of an inflammatory phenotype (18, 19). Importantly, our group has recently reported that purified allospecific FOXP3+ Tregs and de novo generated CD4+CD25+FOXP3+ allospecific iTregs cells can be efficiently expanded in vitro maintaining their phenotype and antigen-specific suppressive function, even under a proinflammatory environment (IFN-γ, IL-4, TNF-α and IL-6) (46, 47). However, it was not clear whether in vitro differentiated Allo Tr1 cells were able to maintain their phenotype and function under proinflammatory conditions. Moreover, an extensive profile of pro-inflammatory cytokines has been detected in the serum of transplanted patients and in animal models (48, 49). Exceptionally, our findings indicate high stability of Exp-allo Tr1 both in their phenotypic markers (CD49b, LAG-3, IL-10, TIM-3, TIGIT, PD1, CD39, and, CTLA-4) as well as in the maintenance of the allogeneic suppressive function, after two expansion cycles in presence of proinflammatory cytokines IL-1β, IL-6, IFN-γ, and TNF-α. This is relevant since pro-inflammatory cytokines have been detected in serum of transplanted patients and animal models (48, 49).
On the other hand, the analysis of Tr1 in vivo stability in a mouse model of allogeneic pancreatic islet transplantation demonstrated that transferred congenic Tr1 cells expand and can be traced more than 3 months after transplantation and are sufficient to induce long-term tolerance (50). Currently, it is hard to trace human transferred Tr1 cells, however, some reports suggest that in vivo Tr1 cells may be stable and promote the generation of new Tr1 cells (infectious tolerance) (51). Following this concept, we wondered if long-term in vitro expansion of Exp-allo Tr1 in a pro-inflammatory environment could be negatively affected.
Among the issues that remain to be evaluated are the molecular mechanisms involved in Exp-allo Tr1 stability, including analysis of single cell transcriptomics which would allow us to identify the key molecules (transcription factors, epigenetic mechanisms) that are key for the establishment and maintenance of the Tr1 lineage. In this context, different transcription factors have been reported to regulate Tr1-like phenotype and function (c-Maf, BATF, Blimp-1, Eomes, AhR, Erg2, IRF1) (8, 52), however more extensive studies are needed in human cells. We believe that our Exp-allo Tr1 provides a good model to explore these mechanisms, as it achieves the obtention of large numbers of purified antigen-specific Tr1 cells, which could also be used for genetic manipulations, such as those proposed for improving stability of Foxp3+ Tregs (53, 54) aiming to ensure long term stability in vivo in cell therapy protocols used both in transplantation as other immune-associated diseases.
One interesting issue that has not yet been addressed is the potential relationship between Foxp3+ Tregs and Tr1. The relatively high abundance and co-localization of these Treg subpopulations in some tissues, such as the small and large intestine (55), as well as reports showing the induction of Tr1 cells after Tregs transfer in a mice model of pancreatic islet transplantation (56) suggest a potential interplay between these two subpopulations that could be considered in future human clinical trials.
In summary, our data demonstrate for the first time the feasibility of expanding a purified allospecific Tr1 population efficiently and at a large-scale, maintaining their characteristic phenotype (CD49b+LAG-3+) and IL-10 production. Moreover, Exp-allo Tr1 cells express an enriched suppressive phenotype TIM-3, TIGIT, PD-1, CD39 and CTLA-4, and produce significant levels of TGF-β, IFN-γ, GzMB and perforin which correlate with their ability of suppress CD4+ and CD8+ proliferation in an alloantigen-specific manner. Most importantly, Exp-allo Tr1 are functionally stable even in the presence of inflammatory cytokines including IL-1β, IL-6, IFN-γ, TNF-α. We propose that this highly purified Tr1 population could improve efficiency in vivo of Tr1-based immunotherapy and reduce the risk of potential side effects produced by heterogeneous populations in long term organ transplanted patients.
Data availability statement
The raw data supporting the conclusions of this article will be made available by the authors, without undue reservation.
Ethics statement
The studies involving human participants were reviewed and approved by The Comité de Ëtica en Investigación" from the National Institute for Medical Sciences and Nutrition Salvador Zubirán, Reference 3886. Written informed consent for participation was not required for this study in accordance with the national legislation and the institutional requirements.
Author contributions
GS and SA-C contributed to conception and design of the study. GS, SA-C, AC-H and KR-C contributed to the generation of data. GS, SA-C, AC-H, CA-S and EA-S contributed to the analysis and interpretation of data. GS, SA-C, AC-H, EA-S, CA-S and JA-G, wrote sections of the manuscript. GS, SA-C, AC-H, EA-S, KR-C, JA-G, CA-S and LM-B contributed to manuscript revision, read, and approved the submitted version.
Funding
This study was supported by Grant #302815 from Consejo Nacional de Ciencia y Tecnología (CONACyT, Pronace-Salud). SA-C is a PhD student of the Program “Doctorado en Ciencias Bioquímicas”, Universidad Nacional Autónoma de México and is supported by a fellowship from CONACyT (#773064). AC-H and EA-S are supported by postdoctoral fellowship from CONACyT #549444 and #508108).
Acknowledgments
The authors thank the MSc. Carlos Castellanos Barba and MSc. Anaí Fuentes Rodríguez from the National Laboratory of Flow Cytometry for technical support in the cell sorting of samples and MVZ Oscar Hernández-Campos for technical support. The authors also thank the Blood Bank of Instituto Nacional de Enfermedades Respiratorias, Mexico City, Mexico.
Conflict of interest
CA-S was employed by Accellix.
The remaining authors declare that the research was conducted in the absence of any commercial or financial relationships that could be constructed as a potential conflict of interest.
Publisher’s note
All claims expressed in this article are solely those of the authors and do not necessarily represent those of their affiliated organizations, or those of the publisher, the editors and the reviewers. Any product that may be evaluated in this article, or claim that may be made by its manufacturer, is not guaranteed or endorsed by the publisher.
Supplementary material
The Supplementary Material for this article can be found online at: https://www.frontiersin.org/articles/10.3389/fimmu.2023.1062456/full#supplementary-material
References
1. Roncarolo MG, Yssel H, Touraine JL, Betuel H, De Vries JE, Spits H. Autoreactive T cell clones specific for class I and class ii hla antigens isolated from a human chimera. J Exp Med (1988) 167(5):1523–34. doi: 10.1084/jem.167.5.1523
2. Bacchetta R, Bigler M, Touraine JL, Parkman R, Tovo PA, Abrams J, et al. High levels of interleukin 10 production in vivo are associated with tolerance in scid patients transplanted with hla mismatched hematopoietic stem cells. J Exp Med (1994) 179(2):493–502. doi: 10.1084/jem.179.2.493
3. Huber S, Gagliani N, Esplugues E, O'Connor W Jr., Huber FJ, Chaudhry A, et al. Th17 cells express interleukin-10 receptor and are controlled by Foxp3- and Foxp3+ regulatory Cd4+ T cells in an interleukin-10-Dependent manner. Immunity (2011) 34(4):554–65. doi: 10.1016/j.immuni.2011.01.020
4. Bertolini TB, Biswas M, Terhorst C, Daniell H, Herzog RW, Piñeros AR. Role of orally induced regulatory T cells in immunotherapy and tolerance. Cell Immunol (2021) 359:104251. doi: 10.1016/j.cellimm.2020.104251
5. Gagliani N, Jofra T, Valle A, Stabilini A, Morsiani C, Gregori S, et al. Transplant tolerance to pancreatic islets is initiated in the graft and sustained in the spleen. Am J Transplant (2013) 13(8):1963–75. doi: 10.1111/ajt.12333
6. Gagliani N, Magnani CF, Huber S, Gianolini ME, Pala M, Licona-Limon P, et al. Coexpression of Cd49b and lag-3 identifies human and mouse T regulatory type 1 cells. Nat Med (2013) 19(6):739–46. doi: 10.1038/nm.3179
7. Gregori S, Roncarolo MG. Engineered T regulatory type 1 cells for clinical application. Front Immunol (2018) 9:233. doi: 10.3389/fimmu.2018.00233
8. Song Y, Wang N, Chen L, Fang L. Tr1 cells as a key regulator for maintaining immune homeostasis in transplantation. Front Immunol (2021) 12:671579. doi: 10.3389/fimmu.2021.671579
9. Brockmann L, Soukou S, Steglich B, Czarnewski P, Zhao L, Wende S, et al. Molecular and functional heterogeneity of il-10-Producing Cd4+ T cells. Nat Commun (2018) 9(1):5457. doi: 10.1038/s41467-018-07581-4
10. Yu H, Gagliani N, Ishigame H, Huber S, Zhu S, Esplugues E, et al. Intestinal type 1 regulatory T cells migrate to periphery to suppress diabetogenic T cells and prevent diabetes development. Proc Natl Acad Sci (2017) 114(39):10443–8. doi: 10.1073/pnas.1705599114
11. Barrat FJ, Cua DJ, Boonstra A, Richards DF, Crain C, Savelkoul HF, et al. In vitro generation of interleukin 10-producing regulatory Cd4(+) T cells is induced by immunosuppressive drugs and inhibited by T helper type 1 (Th1)- and Th2-inducing cytokines. J Exp Med (2002) 195(5):603–16. doi: 10.1084/jem.20011629
12. Battaglia M, Stabilini A, Draghici E, Migliavacca B, Gregori S, Bonifacio E, et al. Induction of tolerance in type 1 diabetes Via both Cd4+Cd25+ T regulatory cells and T regulatory type 1 cells. Diabetes (2006) 55(6):1571–80. doi: 10.2337/db05-1576
13. Clemente-Casares X, Blanco J, Ambalavanan P, Yamanouchi J, Singha S, Fandos C, et al. Expanding antigen-specific regulatory networks to treat autoimmunity. Nature (2016) 530(7591):434–40. doi: 10.1038/nature16962
14. Roncarolo MG, Gregori S, Bacchetta R, Battaglia M, Gagliani N. The biology of T regulatory type 1 cells and their therapeutic application in immune-mediated diseases. Immunity (2018) 49(6):1004–19. doi: 10.1016/j.immuni.2018.12.001
15. Bacchetta R, Lucarelli B, Sartirana C, Gregori S, Lupo Stanghellini MT, Miqueu P, et al. Immunological outcome in haploidentical-hsc transplanted patients treated with il-10-Anergized donor T cells. Front Immunol (2014) 5:16. doi: 10.3389/fimmu.2014.00016
16. Mfarrej B, Tresoldi E, Stabilini A, Paganelli A, Caldara R, Secchi A, et al. Generation of donor-specific Tr1 cells to be used after kidney transplantation and definition of the timing of their in vivo infusion in the presence of immunosuppression. J Trans Med (2017) 15(1):40. doi: 10.1186/s12967-017-1133-8
17. Chen PP, Cepika AM, Agarwal-Hashmi R, Saini G, Uyeda MJ, Louis DM, et al. Alloantigen-specific type 1 regulatory T cells suppress through ctla-4 and pd-1 pathways and persist long-term in patients. Sci Trans Med (2021) 13(617):eabf5264. doi: 10.1126/scitranslmed.abf5264
18. Guo H, Xun L, Zhang R, Hu F, Luan J, Lao K, et al. Stability and inhibitory function of treg cells under inflammatory conditions in vitro. Exp Ther Med (2019) 18(4):2443–50. doi: 10.3892/etm.2019.7873
19. Sawant DV, Vignali DA. Once a treg, always a treg? Immunol Rev (2014) 259(1):173–91. doi: 10.1111/imr.12173
20. Lamarche C, Levings MK. Guiding regulatory T cells to the allograft. Curr Opin Organ Transplant (2018) 23(1):106–13. doi: 10.1097/mot.0000000000000483
21. Alvarez CM, Opelz G, Garcia LF, Süsal C. Expression of regulatory T–Cell-Related molecule genes and clinical outcome in kidney transplant recipients. Transplantation (2009) 87(6):857–63. doi: 10.1097/TP.0b013e318199fa57
22. Belkina AC, Ciccolella CO, Anno R, Halpert R, Spidlen J, Snyder-Cappione JE. Automated optimized parameters for T-distributed stochastic neighbor embedding improve visualization and analysis of Large datasets. Nat Commun (2019) 10(1):5415. doi: 10.1038/s41467-019-13055-y
23. Samusik N, Good Z, Spitzer MH, Davis KL, Nolan GP. Automated mapping of phenotype space with single-cell data. Nat Methods (2016) 13(6):493–6. doi: 10.1038/nmeth.3863
24. Gregori S, Tomasoni D, Pacciani V, Scirpoli M, Battaglia M, Magnani CF, et al. Differentiation of type 1 T regulatory cells (Tr1) by tolerogenic dc-10 requires the Il-10–dependent Ilt4/Hla-G pathway. Blood (2010) 116(6):935–44. doi: 10.1182/blood-2009-07-234872
25. Deknuydt F, Bioley G, Valmori D, Ayyoub M. Il-1β and il-2 convert human treg into Th17 cells. Clin Immunol (2009) 131(2):298–307. doi: 10.1016/j.clim.2008.12.008
26. Valencia X, Stephens G, Goldbach-Mansky R, Wilson M, Shevach EM, Lipsky PE. Tnf downmodulates the function of human Cd4+Cd25hi T-regulatory cells. Blood (2006) 108(1):253–61. doi: 10.1182/blood-2005-11-4567
27. Bacchetta R, Gregori S, Serafini G, Sartirana C, Schulz U, Zino E, et al. Molecular and functional characterization of allogantigen-specific anergic T cells suitable for cell therapy. Haematologica (2010) 95(12):2134–43. doi: 10.3324/haematol.2010.025825
28. Brockmann L, Gagliani N, Steglich B, Giannou AD, Kempski J, Pelczar P, et al. Il-10 receptor signaling is essential for Tr1 cell function in vivo. J Immunol (Baltimore Md 1950) (2017) 198(3):1130–41. doi: 10.4049/jimmunol.1601045
29. Spolski R, Li P, Leonard WJ. Biology and regulation of il-2: From molecular mechanisms to human therapy. Nat Rev Immunol (2018) 18(10):648–59. doi: 10.1038/s41577-018-0046-y
30. Chandran S, Tang Q, Sarwal M, Laszik ZG, Putnam AL, Lee K, et al. Polyclonal regulatory T cell therapy for control of inflammation in kidney transplants. Am J Transplant (2017) 17(11):2945–54. doi: 10.1111/ajt.14415
31. Trzonkowski P, Bieniaszewska M, Juścińska J, Dobyszuk A, Krzystyniak A, Marek N, et al. First-in-Man clinical results of the treatment of patients with graft versus host disease with human ex vivo expanded Cd4+Cd25+Cd127- T regulatory cells. Clin Immunol (Orlando Fla) (2009) 133(1):22–6. doi: 10.1016/j.clim.2009.06.001
32. Cook L, Stahl M, Han X, Nazli A, MacDonald KN, Wong MQ, et al. Suppressive and gut-reparative functions of human type 1 T regulatory cells. Gastroenterology (2019) 157(6):1584–98. doi: 10.1053/j.gastro.2019.09.002
33. Mascanfroni ID, Takenaka MC, Yeste A, Patel B, Wu Y, Kenison JE, et al. Metabolic control of type 1 regulatory T cell differentiation by ahr and Hif1-A. Nat Med (2015) 21(6):638–46. doi: 10.1038/nm.3868
34. Melter M, Exeni A, Briscoe DM. Chemokines and their receptors in human clinical solid organ transplantation. Curr Opin Organ Transplant (2002) 7(1):77–84. doi: 10.1097/00075200-200203000-00016
35. Schnickel GT, Hsieh GR, Garcia C, Shefizadeh A, Fishbein MC, Ardehali A. Role of Cxcr3 and Ccr5 in allograft rejection. Transplant Proc (2006) 38(10):3221–4. doi: 10.1016/j.transproceed.2006.10.164
36. Yi JS, Cox MA, Zajac AJ. T-Cell exhaustion: Characteristics, causes and conversion. Immunology (2010) 129(4):474–81. doi: 10.1111/j.1365-2567.2010.03255.x
37. Wherry EJ, Kurachi M. Molecular and cellular insights into T cell exhaustion. Nat Rev Immunol (2015) 15(8):486–99. doi: 10.1038/nri3862
38. Faccani C, Rotta G, Clemente F, Fedeli M, Abbati D, Manfredi F, et al. Workflow for high-dimensional flow cytometry analysis of T cells from tumor metastases. Life Sci Alliance (2022) 5(10):e202101316. doi: 10.26508/lsa.202101316
39. Mason GM, Lowe K, Melchiotti R, Ellis R, de Rinaldis E, Peakman M, et al. Phenotypic complexity of the human regulatory T cell compartment revealed by mass cytometry. J Immunol (2015) 195(5):2030–7. doi: 10.4049/jimmunol.1500703
40. Groux H, O'Garra A, Bigler M, Rouleau M, Antonenko S, de Vries JE, et al. A Cd4+ T-cell subset inhibits antigen-specific T-cell responses and prevents colitis. Nature (1997) 389(6652):737–42. doi: 10.1038/39614
41. Fillatreau S, O'Garra A. Interleukin-10 in health and disease. Curr Top Microbiol Immunol Berlin Heidelberg: Springer (2014).
42. Kimura A, Naka T, Kishimoto T. Il-6-Dependent and -independent pathways in the development of interleukin 17-producing T helper cells. Proc Natl Acad Sci (2007) 104(29):12099–104. doi: 10.1073/pnas.0705268104
43. Gruarin P, Maglie S, De Simone M, Häringer B, Vasco C, Ranzani V, et al. Eomesodermin controls a unique differentiation program in human il-10 and ifn-Γ coproducing regulatory T cells. Eur J Immunol (2019) 49(1):96–111. doi: 10.1002/eji.201847722
44. Guipouy D, Gertner-Dardenne J, Pfajfer L, German Y, Belmonte N, Dupré L. Granulysin- and granzyme-dependent elimination of myeloid cells by therapeutic ova-specific type 1 regulatory T cells. Int Immunol (2019) 31(4):239–50. doi: 10.1093/intimm/dxy083
45. Safinia N, Grageda N, Scottà C, Thirkell S, Fry LJ, Vaikunthanathan T, et al. Cell therapy in organ transplantation: Our experience on the clinical translation of regulatory T cells. Front Immunol (2018) 9:354. doi: 10.3389/fimmu.2018.00354
46. Alvarez-Salazar EK, Cortés-Hernández A, Arteaga-Cruz S, Alberú-Gómez J, Soldevila G. Large-Scale generation of human allospecific induced tregs with functional stability for use in immunotherapy in transplantation. Front Immunol (2020) 11:375. doi: 10.3389/fimmu.2020.00375
47. Cortés-Hernández A, Alvarez-Salazar EK, Arteaga-Cruz S, Rosas-Cortina K, Linares N, Alberú Gómez JM, et al. Highly purified alloantigen-specific tregs from healthy and chronic kidney disease patients can be long-term expanded, maintaining a suppressive phenotype and function in the presence of inflammatory cytokines. Front Immunol (2021) 12:686530. doi: 10.3389/fimmu.2021.686530
48. Mota AP, Menezes CA, Alpoim PN, Cardoso CN, Martins SR, Alves LV, et al. Regulatory and pro-inflammatory cytokines in Brazilian living-related renal transplant recipients according to creatinine plasma levels. Nephrol (Carlton Vic) (2018) 23(9):867–75. doi: 10.1111/nep.13114
49. Lattmann T, Hein M, Horber S, Ortmann J, Teixeira MM, Souza DG, et al. Activation of pro-inflammatory and anti-inflammatory cytokines in host organs during chronic allograft rejection: Role of endothelin receptor signaling. Am J Transplant (2005) 5(5):1042–9. doi: 10.1111/j.1600-6143.2005.00807.x
50. Gagliani N, Jofra T, Stabilini A, Valle A, Atkinson M, Roncarolo MG, et al. Antigen-specific dependence of Tr1-cell therapy in preclinical models of islet transplant. Diabetes (2010) 59(2):433–9. doi: 10.2337/db09-1168
51. Jofra T, Di Fonte R, Galvani G, Kuka M, Iannacone M, Battaglia M, et al. Tr1 cell immunotherapy promotes transplant tolerance Via de novo Tr1 cell induction in mice and is safe and effective during acute viral infection. Eur J Immunol (2018) 48(8):1389–99. doi: 10.1002/eji.201747316
52. Solé P, Santamaria P. Re-programming autoreactive T cells into T-regulatory type 1 cells for the treatment of autoimmunity. Front Immunol (2021) 12:684240. doi: 10.3389/fimmu.2021.684240
53. Sato Y, Passerini L, Piening BD, Uyeda MJ, Goodwin M, Gregori S, et al. Human-engineered treg-like cells suppress Foxp3-deficient T cells but preserve adaptive immune responses in vivo. Clin Trans Immunol (2020) 9(11):e1214. doi: 10.1002/cti2.1214
54. Goodwin M, Lee E, Lakshmanan U, Shipp S, Froessl L, Barzaghi F, et al. Crispr-based gene editing enables Foxp3 gene repair in ipex patient cells. Sci Adv (2020) 6(19):eaaz0571. doi: 10.1126/sciadv.aaz0571
55. Maynard CL, Harrington LE, Janowski KM, Oliver JR, Zindl CL, Rudensky AY, et al. Regulatory T cells expressing interleukin 10 develop from Foxp3+ and Foxp3– precursor cells in the absence of interleukin 10. Nat Immunol (2007) 8(9):931–41. doi: 10.1038/ni1504
Keywords: Type 1 Tregs, allospecific, expansion, transplantation, tolerance, inflammatory cytokines
Citation: Arteaga-Cruz S, Cortés-Hernández A, Alvarez-Salazar EK, Rosas-Cortina K, Aguilera-Sandoval C, Morales-Buenrostro LE, Alberú-Gómez JM and Soldevila G (2023) Highly purified and functionally stable in vitro expanded allospecific Tr1 cells expressing immunosuppressive graft-homing receptors as new candidates for cell therapy in solid organ transplantation. Front. Immunol. 14:1062456. doi: 10.3389/fimmu.2023.1062456
Received: 05 October 2022; Accepted: 08 February 2023;
Published: 24 February 2023.
Edited by:
Antoine Toubert, Université Paris Cité, FranceReviewed by:
Sabrina N. Copsel, University of Miami, United StatesCaroline Lamarche, Montreal University, Canada
Copyright © 2023 Arteaga-Cruz, Cortés-Hernández, Alvarez-Salazar, Rosas-Cortina, Aguilera-Sandoval, Morales-Buenrostro, Alberú-Gómez and Soldevila. This is an open-access article distributed under the terms of the Creative Commons Attribution License (CC BY). The use, distribution or reproduction in other forums is permitted, provided the original author(s) and the copyright owner(s) are credited and that the original publication in this journal is cited, in accordance with accepted academic practice. No use, distribution or reproduction is permitted which does not comply with these terms.
*Correspondence: Gloria Soldevila, c29sZGV2aUB1bmFtLm14