 Joseph W. Guarnieri1Alessia Angelin1Deborah G. Murdock1
 Patrick Schaefer1Prasanth Portluri1
 Timothy Lie1,2
 Jessica Huang1
 Douglas C. Wallace1,3*
- 1Center for Mitochondrial and Epigenomic Medicine, Division of Human Genetics, The Children’s Hospital of Philadelphia, Philadelphia, PA, United States
- 2Department of biology, University of Pennsylvania, Philadelphia, PA, United States
- 3Department of Pediatrics, Division of Human Genetics, Perelman School of Medicine, University of Pennsylvania, Philadelphia, PA, United States
Background: Compared to healthy controls, severe COVID19 patients display increased levels of activated NLRP3-inflammasome (NLRP3-I) and interleukin (IL)-1β. SARS-CoV-2 encodes viroporin proteins E and Orf3a(2-E+2-3a) with homologs to SARS-CoV-1, 1-E+1-3a, which elevate NLRP3-I activation; by an unknown mechanism. Thus, we investigated how 2-E+2-3a activates the NLRP3-I to better understand the pathophysiology of severe COVID-19.
Methods: We generated a polycistronic expression-vector co-expressing 2-E+2-3a from a single transcript. To elucidate how 2-E+2-3a activates the NLRP3-I, we reconstituted the NLRP3-I in 293T cells and used THP1-derived macrophages to monitor the secretion of mature IL-1β. Mitochondrial physiology was assessed using fluorescent microscopy and plate reader assays, and the release of mitochondrial DNA (mtDNA) was detected from cytosolic-enriched fractions using Real-Time PCR.
Results: Expression of 2-E+2-3a in 293T cells increased cytosolic Ca++ and elevated mitochondrial Ca++, taken up through the MCUi11-sensitive mitochondrial calcium uniporter. Increased mitochondrial Ca++ stimulated NADH, mitochondrial reactive oxygen species (mROS) production and the release of mtDNA into the cytosol. Expression of 2-E+2-3a in NLRP3-I reconstituted 293T cells and THP1-derived macrophages displayed increased secretion of IL-1β. Increasing mitochondrial antioxidant defenses via treatment with MnTBAP or genetic expression of mCAT abolished 2-E+2-3a elevation of mROS, cytosolic mtDNA levels, and secretion of NLRP3-activated-IL-1β. The 2-E+2-3a-induced release of mtDNA and the secretion of NLRP3-activated-IL-1β were absent in cells lacking mtDNA and blocked in cells treated with the mitochondrial-permeability-pore(mtPTP)-specific inhibitor NIM811.
Conclusion: Our findings revealed that mROS activates the release of mitochondrial DNA via the NIM811-sensitive mitochondrial-permeability-pore(mtPTP), activating the inflammasome. Hence, interventions targeting mROS and the mtPTP may mitigate the severity of COVID-19 cytokine storms.
Graphical Abstract
Introduction
Approximately 609 million cases of COVID-19 have been reported globally, resulting in over 6.5 million deaths (1). COVID-19 is caused by SARS-CoV-2 whose genome structure encodes a polyprotein that is cleaved into 16 non-structural proteins as well as the structural proteins S (Spike), E (Envelope), M (Membrane), and N (Nucleocapsid), plus seven open reading frames (Orfs) 3a, 6, 7a/b, 8, 9b, and 10. Severe COVID-19 manifests as pneumonia, acute respiratory distress syndrome, respiratory failure, and cytokine storm resulting in multiple organ failure (2–4). The cytokine storm results from the elaboration of pro-inflammatory cytokines such as IL-1β (5–7).
The production of mature IL-1β requires the activation of the mitochondrially-bound NLRP3-inflammasome (NLRP3-I), which encompasses the NLR family pyrin domain containing 3 (NLRP3) receptor; the adaptor molecule apoptosis-associated speck-like protein containing a caspase activation and recruitment domain (ASC); and the pro-IL-1β-converting enzyme pro-caspase-1 (CASP1). Upon activation, the NLRP3-I triggers the proteolytic cleavage of pro-caspase-1 (pro-CASP1), and CASP1 cleaves pro-IL-1β and pro-IL-18 to generate IL-1β and IL-18 which are secreted from the cell (8). Autopsy samples from severe COVID-19 patients display increased NLRP3-I activation in lung tissues and peripheral blood mononuclear cells (2), and monocytes isolated from severe COVID-19 patients have increased levels of activated NLRP3-I and IL-1β (4). Thus, understanding the mechanism by which SARS-CoV-2 activates the NLRP3-I is imperative for understanding the pathophysiology of severe COVID-19.
Recently, mitochondrial dysfunction has been shown to activate the innate immune system via mROS production and oxidation of the mitochondrial DNA (mtDNA) during replication. mtDNA replication is induced by the expression of the rate-limiting enzyme cytosine monophosphate kinase 2 (CMPK2). The oxidized mtDNA (Ox-mtDNA) is released from the mitochondrion to bind and activate the NLRP3-I (9, 10). While the mechanism by which SARS-CoV-2 activates the NLRP3-I is unknown, expression of the SARS-CoV-1/2 viroporins have been associated with activation of NLRP3-I (11–15) and are known to be membrane ion channels (16, 17).
SARS-CoV-2 encodes two viroporins E (2-E) and ORF3a (2-3a), with homologues to SARS-CoV-1 proteins (18). SARS-CoV-1/2 E and 3a viroporins localize to the endoplasmic reticulum (ER), Golgi apparatus, and plasma membrane (18) where they increase the permeability to cations such as Ca++ (19, 20). For SARS-CoV-1, the 1-E and 1-3a have been shown to activate the NLRP3-I in human monocyte-derived macrophages (11, 13, 15). In LPS-primed macrophages, co-expression of 1-E plus 1-3a resulted in higher levels of IL-1β secretion than either viroporin alone (11). 1-E has been reported to activate NLRP3-I through disrupting Ca++ homeostasis in cells (12, 14), and activation of the NLRP3-I and secretion of IL-1β by 1-E and 1-3a is mitigated by treatment with the mROS scavenger MitoQ (11). However, the mechanism by which SARS-CoV-2 activates the NLRP3-I has yet to be elucidated.
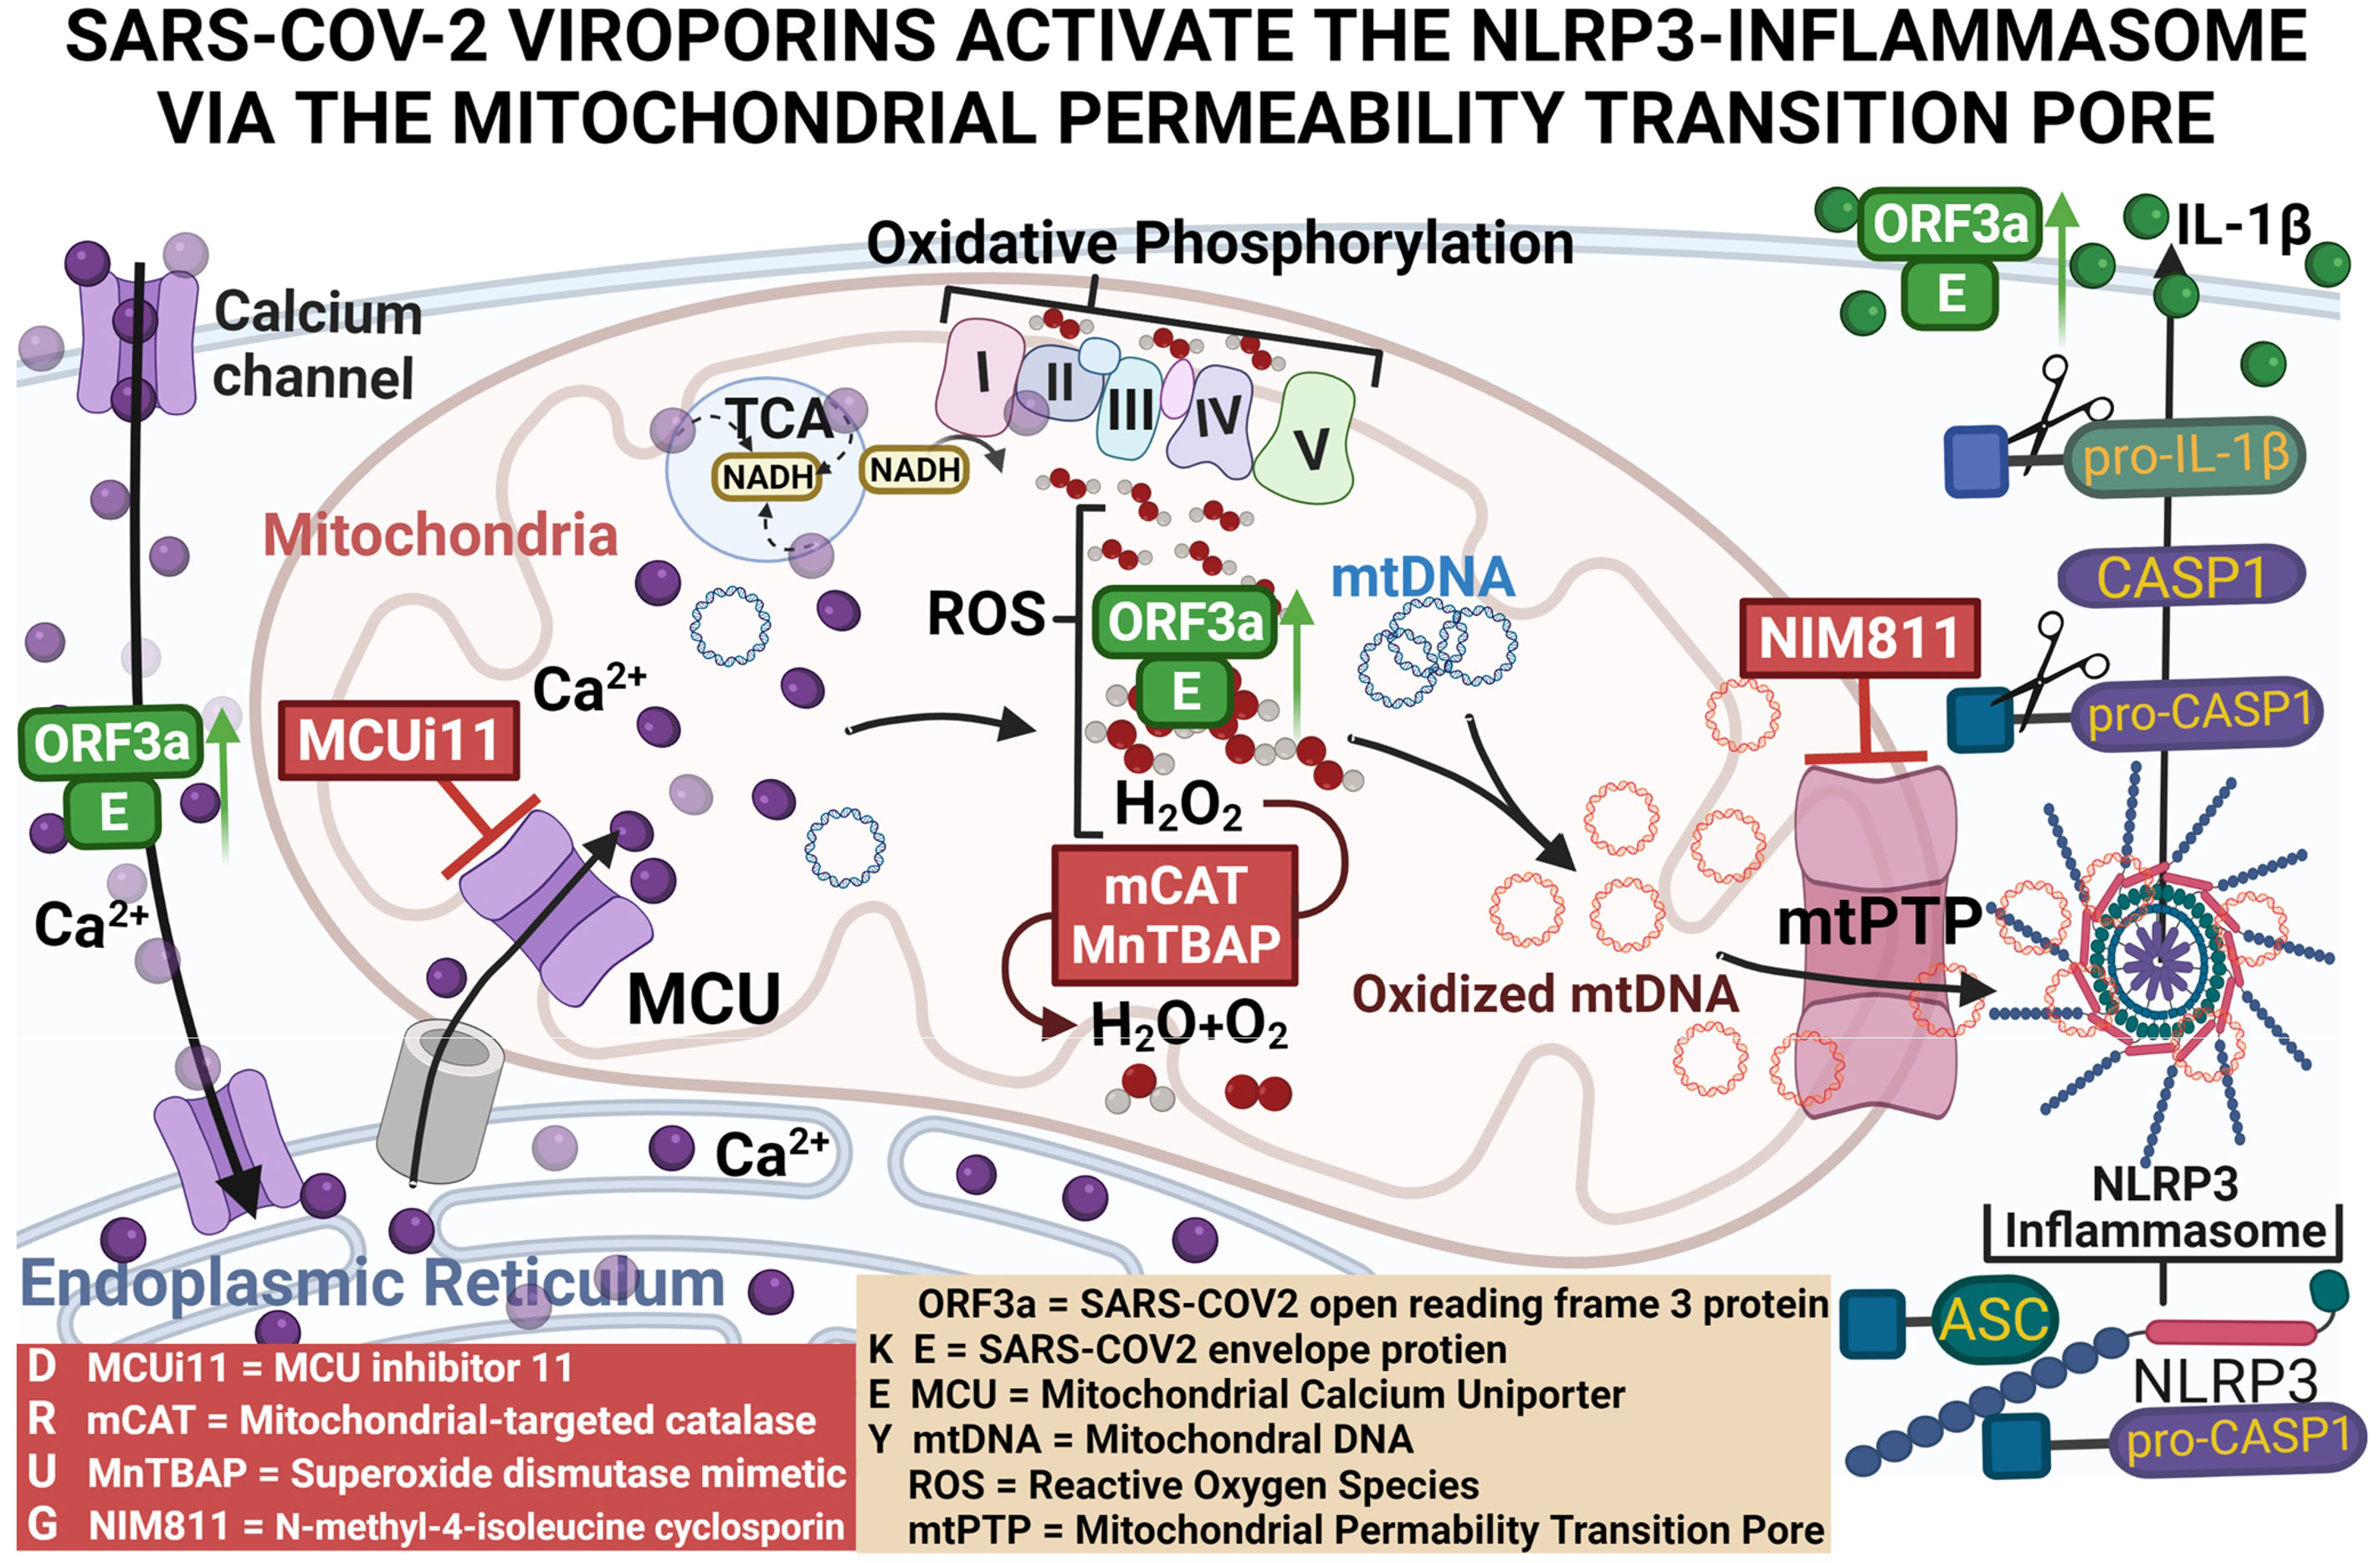
We hypothesized that expression of 2-E plus 2-3a results in increased Ca++ flux into the cytosol where it is taken up by the mitochondrion through the mitochondrial Ca++ uniporter (MCU). Within the mitochondrion, the Ca++ activates the pyruvate and α-ketoglutarate dehydrogenases to generate excessive NADH (21). The increased NADH overloads the mitochondrial electron transport chain producing increased mROS. The mROS oxidizes the mtDNA, and the Ox-mtDNA is released through the mtPTP to bind to the NLRP3 inflammasome. This activates caspase-1 to cleave pro-IL-1β and pro-IL-18 resulting in the secretion of active IL-1β and IL-18 (10, 22). Our current results support this scenario, thus placing mitochondrial function at the nexus between SARS-CoV-2 infection and the cytokine storm.
Methods
Cells, infections, and reagents
293T & THP1 cells were obtained from the American Type Culture Collection (ATCC). Cells were grown at 37°C with an atmosphere of 98% humidity and 5% CO2. 293T cells were maintained in Dulbecco’s modified Eagle’s medium + GlutaMAX™ supplement with pyruvate (GIBCO), 1% non-essential amino acids (SIGMA), and 10% fetal bovine serum (FBS) (Takara Bio). 293T-ρ0 were generate as previously described in (23). 293T-ρ0 cells were maintained in the same media used to maintain 293T cells with the addition of 100 ug/mL of Uridine (SIGMA). THP1 cells were grown in RPMI 1640 Medium (GIBCO) supplemented with 10% FBS (Takara Bio). 293T and 293T-ρ0 cells were infected with lenti viruses (MOI 4) as previously described (24). THP1 cells were infected with lenti viruses (MOI 8) with the addition of 10 μg/ml polybrene (VectorBuilder) and spin-inoculated at 700×g for 25min.
Plasmids, viral vectors, THP1 stable-transformants
Plasmid vectors
To express the components of the NLRP3-inflammasome (NLFP3-I), we utilized four plasmids expressing mouse NLRP3 (pcDNA3-N-Flag-NLRP3, Addgene plasmid # 75127), ASC (pcDNA3-N-Flag-ASC1, Addgene plasmid # 75134), CASP1 (pcDNA3-N-Flag-Caspase-1, Addgene plasmid # 75128) and pro-IL-1B (pCMV-pro-Il1b-C-Flag, Addgene plasmid # 75131). The use and construction of the NLRP3-I expression plasmids were previously described (25).
The plasmid vector used to express mitochondrial-targeted catalase (mCAT) and its respective control vector were p-mCAT (VectorBuilder ID VB170403-1078nzg) and p-EV (VectorBuilder ID VB210726-1273jte). The p-mCAT transgene cassette was transcribed from the 212 nucleotide elongation factor α1 “short” (EFS) promoter. The EFS promoter transcribes a polycistronic transcript encoding EGFP (enhanced green fluorescent protein), a self-cleaving 2A peptide site, followed by mCAT cDNA, and terminated by a simian virus 40 (SV40) late polyA sequence. p-EV is identical to the p-mCAT construct, except lacking the EGFP and mCAT sequences.
Lentiviral vectors
The lentiviral vector used to co-express 2-E+2-3a was LV-E3a (Vectorbuilder ID VB210112-1153ufz) and its respective control vector LV-EV (Vectorbuilder ID VB210112-1153ufz). The LV-E3a vector contains the cytomegalovirus (CMV) promoter, the 2-E+2-3a viroporins obtained from Gordon et al., 2020 (18) separated by a 2A peptide site, and terminated by a SV40 late polyA sequence cloned into the LV-EV vector. The viroporin sequences deduced from the protein sequences were modified by adding an ATG codon 5’ and three N-terminal FLAG-tags added to the 3’ end of each viral protein. LV-EV is an empty vector.
The lentiviral vector expressing our mCAT and its respective control vector were LV-mCAT (VectorBuilder 210909-1242kdf) and LV-EV (VectorBuilder 900122-0484ubz). The LV-mCAT vector includes the EFS promoter, EGFP, 2A peptide site, mCAT, and SV40 late polyA sequence. The LV-EVcontrol vector lacks the EGFP and mCAT sequences.
THP1 mCAT stable-transformants
THP1 cells were transduced with LV-mCAT or empty vector and selected with puromycin. Expression of stable-transformants of mCAT were validated by EGFP fluorescence.
Method details
Cell staining
293T cells were plated at a density of 45 × 103 in 0.2% gelatin-coated (ScienCell) 96-well glass-bottom plates with high-performance #1.5 mm cover glass (Cellvis). Twenty-four hours post-plating, sub-confluent monolayers of 293T cells were transduced with LV-EV or LV-E3a. Twenty-four hours post-transduction, cells were washed two times with phosphate-buffered saline (PBS), then stained. For determination of mROS levels, cells were co-stained with 3 μM MitoSOX™ Red (MitoSOX, mitochondrial superoxide indicator) and 50 nM MitoTracker™ Deep Red FM (MTDR) for 30 min at 37°C. For assaying mROS levels after treatment with Thapsigargin (TG) using the plate reader, cells were stained with 3 μM MitoSOX for 30 min at 37°C.To quantify mROS after staining, cells were washed three times in PBS, maintained in FluoroBrite™ DMEM (GIBCO) supplemented with 12.5 mM HEPES (SIGMA) and 1% non-essential amino acids (SIGMA), and the fluorescence measured.
To determine cytosolic Ca++ levels, cells were washed three times with Tyrode’s Salts (Sigma-Aldrich), stained for 40 min with 2 μM Fura Red™, acetoxymethyl ester (AM), cell-permeant (Fura-Red) in 0.02% pluronic F127 (Pluronic® F-127) detergent. To determine mitochondrial Ca++ levels, cells were washed three times with Tyrode’s Salts, stained for 40 min with 10 μM Rhod-2, AM, cell-permeant (Rhod2) and 50 nM MTDR in 0.02% pluronic F127. After staining cells were washed three times, maintained in Tyrode’s Salts, and the florescence measured. To determine mitochondrial Ca++ levels after treating with TG, cells were stained for 40 min with 10 μM Rhod2, washed three times, maintained in Tyrode’s Salts, and the florescence measured.
SpectraMax plate reader assay
Measurement of mROS and cytosolic and mitochondrial Ca++ levels
After staining cells (see “Cell Staining”), mean fluorescence was assessed using the SpectraMax® Paradigm® Multi-mode Detection Platform, equipped with a Tunable Wavelength (TUNE) Detection Cartridge (Molecular Devices). mROS was quantified by MitoSOX fluorescence (ex:540 nm, em:590 nm) and MTDR (ex:633 nm, em:680 nm) and MitoSOX/MTDR calculated. Rhod2 fluorescence for mitochondrial Ca++ level (ex:540 nm, em:590 nm) and MTDR (ex:633 nm, em:680 nm), and Rhod2/MTDR calculated. Fura-Red fluorescence was measured for cytosolic bound-Ca++ level using ex:405 nm, em:637 nm and unbound-Ca++ level using ex:514 nm, em:672 nm. The ratio of bound-Ca++/unbound-Ca++ was calculated.
Measurement of mitochondrial Ca++ and mROS after treating with TG
After staining cells with Rhod2 or MitoSOX (“Cell Staining”), cells were treated for 10 min with or without 10 μM mitochondria channel uniporter inhibitor 11 (MCUi11), or dimethylsulfoxide (DMSO) as a negative control. Mitochondrial Ca++ determined from Rhod2 was measured using ex:540 nm, em:590 nm and mROS from MitoSOX using ex:540 nm, em:590 nm. Cells were then treated with 2.5 μM TG and changes in mitochondrial Ca++ or mROS recorded every 15 seconds for 180 seconds. Relative change in mitochondrial Ca++ was calculated by dividing the average change in Rhod2 fluorescence after treatment with TG by Rhod2 fluorescence before treatment with TG. Relative change in mROS levels were calculated by dividing the average change in MitoSOX fluorescence after treatment with TG by MitoSOX fluorescence before treatment with TG.
Confocal microscopy
Live-cell fluorescence imaging was performed using a Zeiss 710 LSM confocal microscope with an environmental chamber maintained at 37°C and 5% CO2. Laser lines used: diode 405 nm, Argon 514 nm, HeNe lasers 543 nm and 633 nm excitation wavelengths. Fluorescence was analyzed using ImageJ. Fluorescence intensities of stained cells were normalized to the unstained negative cells. A minimum of 60 images was taken for each condition across at least three independent experiments.
Fluorescence lifetime imaging microscopy (FLIM) of NADH autofluorescence
Fluorescence lifetime imaging microscopy (FLIM) of NADH autofluorescence was performed according to Schaefer et al. (26). Using FLIM, NADH was measured on a Zeiss LSM 710 Laser Scanning Microscope equipped with a pulsed, two-photon titanium-sapphire laser (80 MHz, 100 fs pulse width). NADH was excited at 730 nm and emission was recorded through a 460/60 nm bandpass filter using the hybrid detector HPM-100-40, mounted on the NDD port of the LSM710. Time-correlated single photon counting (TCSPC) was performed with a temporal resolution of 256 time channels within a pulse period of 12.5 ns, resulting in FLIM images of 512 × 512 pixel. The final measurement settings were 60 sec collection time; ≈ 15 μsec pixel dwell time; 135 × 135 μm2 scanning area using a Plan-Apochromat 63x/1.40 Oil DIC M27 lens. SPCM 9.8 was used to record the data, which were subsequently analyzed using SPCImage 8.0 by fitting (WLS method) of a biexponential decay with lifetime components fixed to 400 ps and 2500 ps for free and protein-bound NADH, respectively. Final analysis settings were square binning of 2, peak threshold adapted to background, and shift fixed at a pixel with clear NADH signal. The mean NADH lifetime (tmean) was calculated and is depicted in false-color coding with red indicating a shorter and blue a longer NADH lifetime. For subcellular analysis, region of interests (ROIs) of similar size were drawn for five nuclei across each image. For the mitochondria-rich region, the peak threshold was increased to remove nuclear and cytosolic NADH signal, averaging only the tmean of the mitochondrial NADH.
Catalase assay
Catalase activity was assessed through cleavage of H2O2 in 293T cell lysates collected twenty-four hours post-transfection with p-mCAT or p-EV, using a Catalysis Activity Kit (Abcam, ab83464).
Western blot analysis
Twenty-four hours post-transduction, cells were washed with cold PBS and then lysed with 2.5% n-Dodecyl-B-D-Maltoside in 20 mM HEPES (pH 7.4), 50 mM β-glycerophosphate, 2 mM EGTA, 10% (v/v) glycerol, and 0.01% Bromophenol blue. Lysates were electrophoresed on 4 to 12%, Bis-Tris gels (Invitrogen) SDS-polyacrylamide NuPAGE™ gels. Gels were transferred to a nitrocellulose membrane by the iBlot Gel Transfer System (Invitrogen), membranes blocked for one hour in 5% nonfat milk in 150 mM NaCl and 25 mM Tris-buffered saline in 0.1% Tween® 20 Detergent (TBST) then incubated overnight at 4°C with shaking. The primary antibody was diluted 1:1000 in TBST. Membranes were then washed three times with TBST and incubated with Alexa Fluor-conjugated secondary antibodies for one hour at room temperature. Protein levels were quantified using the Odyssey imaging system (LiCOR Biosciences). GAPDH as a loading control.
Detection of secreted IL-1β in 293T cells with reconstituted NLRP3-I and THP1 macrophages
293T cells were plated at a density of 100 × 103 in 24-well plates. Twenty-four hours post-plating sub-confluent monolayers of 293T cells were infected with LV-EV or LV-E3a. Six hours post-infection cells were co-transfected using the TransIT-X2® Dynamic Delivery System (Mirus Bio) with the plasmids encoding the components of the NLRP3-I (25), followed by p-mCAT or p-EV transduction. Twenty-four hours post-transfection, cells were washed two times with PBS, then cultured with or without the addition of 50 uM MnTBAP. Cell lysates and culture supernatants were collected twelve hours post-treatment and centrifuged to remove cell debris. Supernatant IL-1β was quantified by ELISA (Abcam, ab197742).
THP-1 cells were plated at a density of 100 × 103 in 96-well plates. THP1 cells were infected with LV-EV or LV-E3a. Six hours post-infection, THP1 cells were differentiated into macrophages with 50 ng/ml Phorbol 12-myristate 13-acetate (PMA) overnight. After differentiation, cells were washed two times with PBS, and fresh media was added with the addition of 100 μM MnTBAP, 5 μM MCC950, or 10 μM N-methyl-4-isoleucine-cyclosporin (NIM811). Nine hours post-treatment with MnTBAP or MCC950 or one-hour post-treatment with NIM811, THP1 macrophages were stimulated with 100 ng/ml Lipopolysaccharides (LPS) and 2.5 μM of nigericin for nine hours. Supernatants were collected, centrifuged, and the amount of IL-1β in the supernatants measured by ELISA (Abcam, ab46052). THP1 cells stably expressing LV-mCAT or control vector, were infected with LV-EV or LV-E3a, and 6 hours post-infection the THP1 cells were differentiated into macrophages, and supernatant IL-1β quantified via ELISA.
Detection of mtDNA from cytosolic-enriched fractions in 293T cells
Twenty-four hours post-plating, sub-confluent monolayers of 293T cells were infected with LV-EV or LV-E3a. Six hours post-infection, cells were transfected with the plasmids encoding p-mCAT or p-EV, or twenty-four hours post-infection cells were treated with or without the addition of 50 uM MnTBAP or 10 uM NIM811. Twenty-four hours post-transfection or ten hours post-treatment, cells were washed with PBS, then dissociated from the plate with Trypsin. The dissociated cells were then pelleted via centrifugation and lysed with hypertonic buffer consisting of 20 mM Tris-HCl (pH 7.4), 10 mM NaCl, and 3 mM MgCl2 for fifteen minutes on ice, then treated with Non-Ionic Detergent P-40 (NP-40) 0.05% (v/v) and vortexed at max speed. Cell lysates were centrifuged for 15 minutes at 1,000 g, and the resulting supernatants were centrifuged for 1 hour at 200,000 g to isolate a cytosolic enriched fraction. After centrifugation, protein concentrations were determined from the resulting supernatants by Bradford assay using the Bio-Rad protein assay (Bio-Rad, Hercules, CA). DNA was isolated from equal amounts of protein using the DNA Clean & Concentrator-5 (Zymo Research, 11-303). Levels of mitochondrial DNA in the cytosolic enriched fraction were then determined via TaqMan Real-Time PCR assays to detect mitochondrial NADH dehydrogenase subunit 5 (MT-ND5) using the TaqMan probe (MT-ND5 Hs02596878_g1).
Statistical and reproducibility
For quantitative analyses, a minimum of 3 biological replicates were analyzed. Western blot data are from the respective experiment, processed in parallel, and represent at least three independent experiments. One-way ANOVA was performed for statistical differences between three or more groups, followed by a post hoc Tukey’s HSD test to test for statistical differences. For studies that require a quantitative evaluation between two groups, statistical significance was determined using unpaired two-tail Student’s t-test. All data bar graphs, data are reported as mean ± standard error of the mean (SEM). All statistical analysis was done on GraphPad Prism 9.01. For student’s t-test * = p < value 0.05, ** = p < value 0.01, *** = p < value 0.001, **** = p < value 0.0001).
Results
Expression of 2-E+2-3a increases Ca++ leakage into the cytosol, elevates mitochondrial Ca++ levels, and increases mROS production
A major unanswered question is how 2-E and 2-3a activate the NLRP3-I. We hypothesized that expression of 2-E and 2-3a results in increased Ca++ flux into the cytosol where it is taken up by the mitochondrion through the MCU. Within the mitochondrion, the Ca++ activates the pyruvate and α-ketoglutarate dehydrogenases to generate excessive NADH. The increased NADH overloads the electron transport chain producing increased mROS. The mROS oxidizes the mtDNA which is released through the mtPTP to bind to the NLRP3-I. This activates caspase 1 to cleave pro-IL-1β and pro-IL-18 resulting in the secretion of active IL-1β and IL-18 (10, 22).
To test this hypothesis, we constructed a polycistronic expression vector combining 2-E+2-3a (LV-E3a) to determine how these viroporins function synergistically to engage the NLRP3-I (Figures 1A, B). In this vector the 2-E+2-3a sequences were separated by the self-cleaving 2A peptide site (27) to allow co-expression from a single transcript. The expression of 2-E+2-3a in LV-E3a transduced 293T cells was confirmed by Western blot (Figure 1C). We then demonstrated that LV-E3a transduced 293T cells experience increased cytosolic Ca++ with Fura-Red by plate reader assay (Figures 1D, J) and confocal microscopy (Figure 1E). Additionally, we demonstrated that LV-E3a transduced 293T cells experience increased mitochondrial Ca++ with Rhod2 by plate reader assay (Figures 1F, J) and confocal microscopy (Figure 1G). The LV-E3a transduced 293T cells had elevated levels of both cytosolic and mitochondrial Ca++.
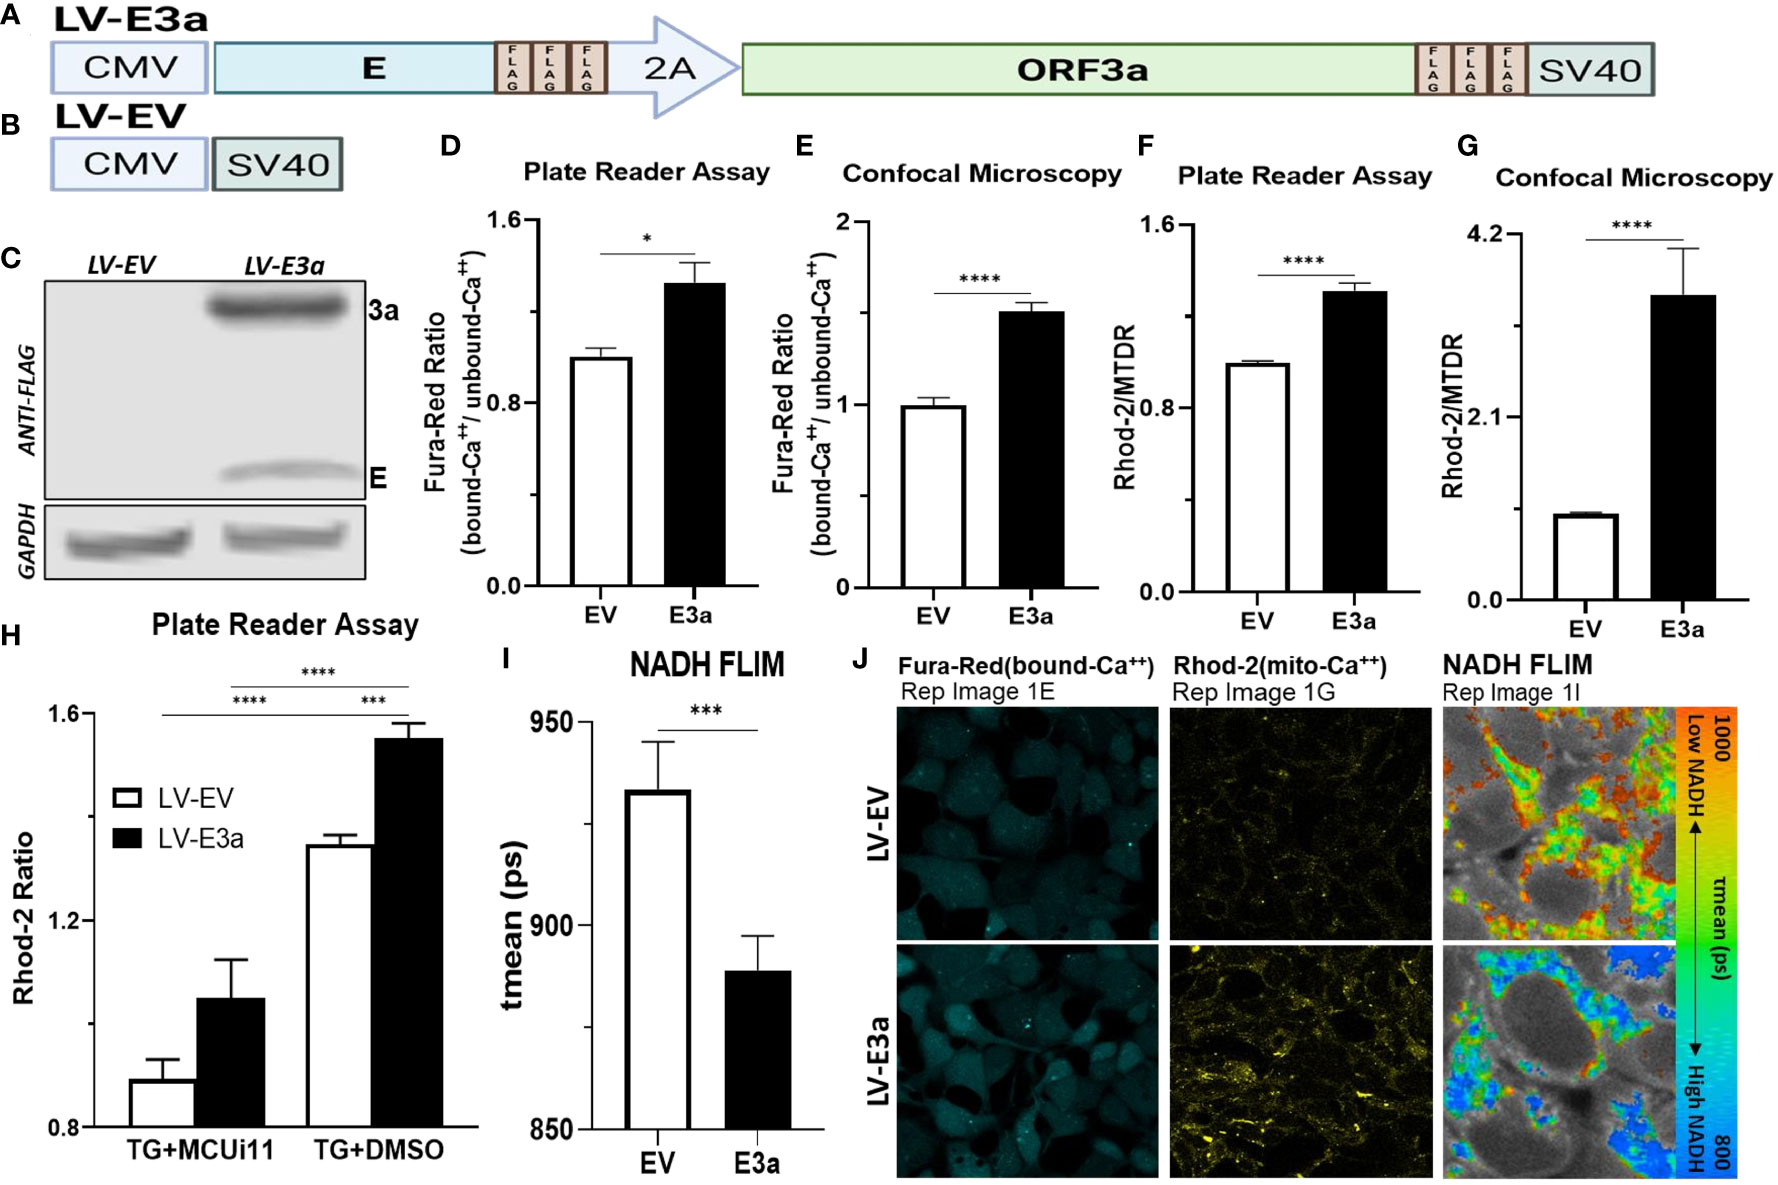
Figure 1 Expression of 2-E+2-3a induces mROS production by elevating mitochondrial Ca++ levels. (A, B) Schematics of our LV-EV and LV-E3a vectors. (C) 293T cells were transduced with LV-EV or LV-E3a, and samples analyzed by immunoblot with a mouse monoclonal antibody against FLAG-Tag, to detect the FLAG-tagged 2-E+2-3a viroporins. GAPDH was a loading control. (D, E) 24 hrs post-transduction cells were stained with Fura-Red to measure cytosolic Ca++ levels, (F, G) and with Rhod2 & Mitotracker Deep Red (MTDR) to measure mitochondrial Ca++ levels. (E, G, J) data from confocal microscopy or (D, F) data from plate reader assays. (H) 24 hrs post-transduction with LV-EV or LV-E3a 293T cells were treated with or without 10 μM MCUi11, and then 2.5 μM TG and stained with Rhod2 to measure mitochondrial Ca++ levels by plate reader assays. (I) Cells, 24 hrs post-transduction with LV-EV or LV-E3a, were analyzed for mean mitochondrial NADH lifetime (tmean) indicating (NAD+/NADH ratio) using FLIM. (J) Representative images of Fura-Red, Rhod2-stained, and NADH lifetime imaged cells. Scale bar = 30 μm. Error bars represent SEM from 3 independent experiments; statistically significant data is indicated with asterisks (*).
Treating with thapsigargin (TG) triggers Ca++ flux into the cytosol resulting in increased mitochondrial Ca++ uptake (28, 29). Treatment with the mitochondrial calcium uniporter inhibitor 11 (MCUi11) blocks Ca++ entry into the mitochondrion (30, 31). Treatment with MCUi11 abolished mitochondrial calcium uptake in LV-E3a transduced cells (Figure 1H) following TG treatment. Thus, expression of 2-E+2-3a in 293T cells results in increased Ca++ flux into the cytosol resulting in an elevation of cytosolic Ca++. The cytosolic Ca++ is then taken up by the mitochondrial calcium uniporter resulting in elevated mitochondrial Ca++ (Figure 1H).
Elevated mitochondrial Ca++ activates the tricarboxylic acid cycle dehydrogenases generating excess NADH (21). Expression of 2-E+2-3a in 293T cells resulted in increased mitochondrial NADH levels detected via NADH fluorescence lifetime imaging (FLIM) (NAD+/NADH) mean (ps) (Figures 1I, J).
Excessive NADH levels can overload the electron transport chain producing increased mROS. The increased NDAH in 2-E+2-3a expressing 293T cells was associated with increased mROS production detected by staining transduced cells with MitoSOX, which detects mitochondrial superoxide anion production (Figures 2A–C). To determine if the increased mROS was due to the entry of Ca++ into the mitochondrion, we treated the cells with MCUi11 which blocked the increased mROS production (Figure 2D). As predicted MCUi11 blocked the increased mROS production. Hence the increased mROS production in 2-E+2-3a cells was dependent on elevated mitochondrial Ca++.
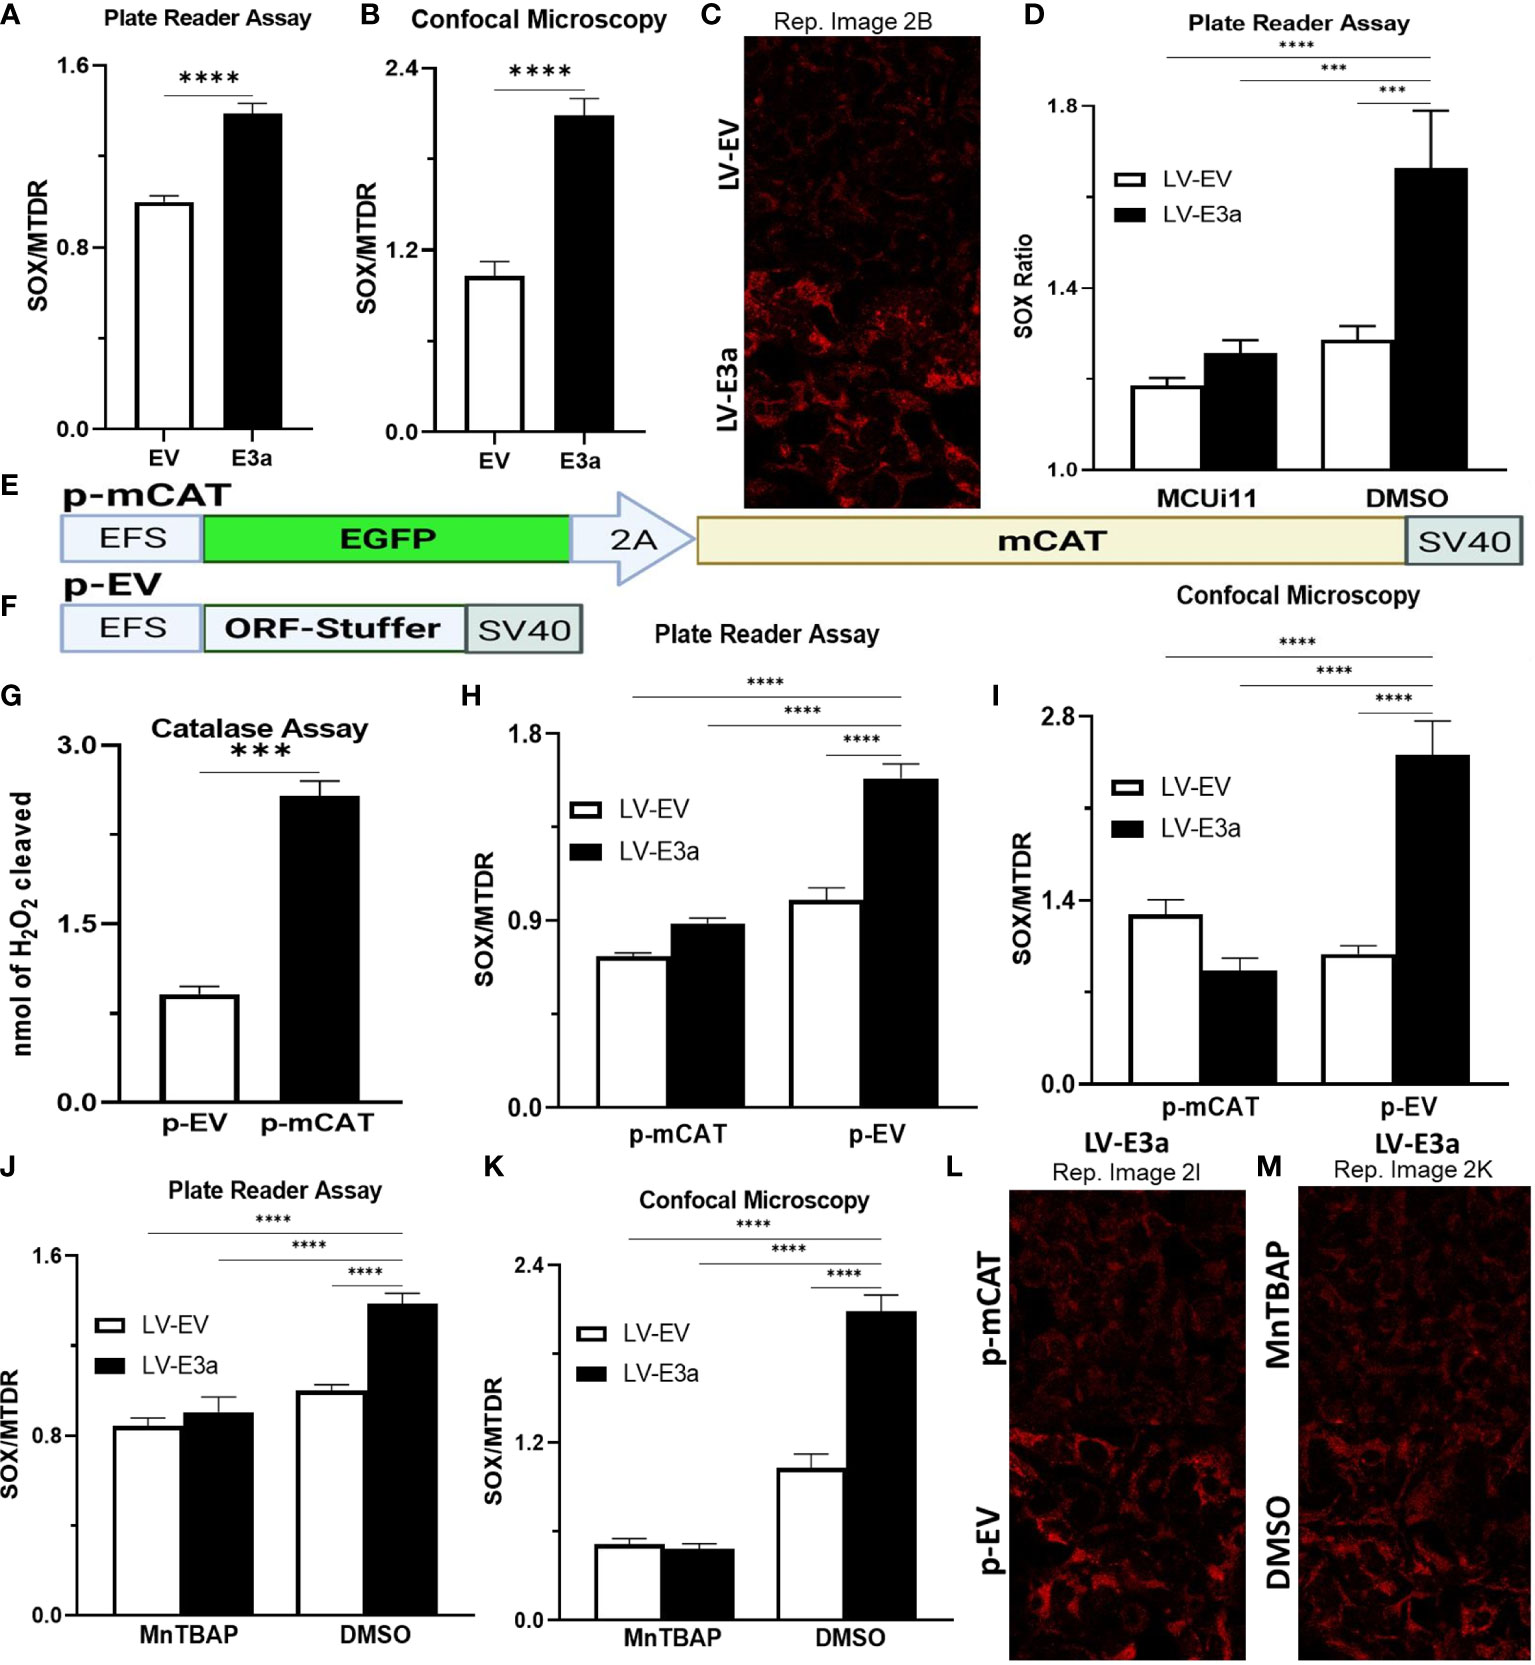
Figure 2 Expression of mCAT or treatment with the mROS scavenger MnTBAP antioxidant defenses blocks 2-E+2-3a induced mROS. (A–C) 24 hrs post-transduction cells were stained with MitoSOX and MTDR to measure mROS levels via (A) data from plate reader assays or (B, C) data from confocal microscopy. (D) 24 hrs post-transduction with LV-EV or LV-E3a 293T, cells were treated with or without 10 μM MCUi11, and then 2.5 μM TG and stained with MitoSOX to measure mROS levels by plate reader assays. (E, F) Schematics of p- p-mCAT and EV vectors. (G) Catalase assay through cleavage of H2O2 in 293T cell lysates collected 24 hrs post-transfection with p-EV or p-mCAT. (H-M) 24 hrs post-transfection levels of mROS assessed using MitoSOX and MTDR fluorescence 293T cells transduced with LV-EV or LV-E3a and transfected (H, I, L) with p-mCAT or its respective control p-EV or (J, K, M) cultured in the presence or absence of 50 μM MnTBAP, DMSO used as a negative control. MTDR fluorescence was used to normalize for mitochondrial content with mROS expressed as the ratio of MitoSOX/MTDR, by (H, J) plate reader assays or (I, K, L, M) confocal microscopy. (C, L, M) Representative images of MitoSOX-stained cells. Scale bar = 30 μm. Error bars represent SEM from 3 independent experiments; statistically significant data is indicated with asterisks (*).
To confirm that the 2-E+2-3a induced ROS production was mROS, we transfected the 2-E+2-3a expressing 293T cells with a vector expressing mitochondrially-targeted catalase (mCAT) (Figures 2E–I, L) which removes mitochondrial H2O2 (32). We also treated the cells with the mitochondrially targeted catalytic metalloporphyrin anti-oxidant, MnTBAP (Figures 2J, K, M) (33). Treatment with either MnTBAP or mCAT extinguished the 2-E+2-3a activated ROS product, confirming that the ROS was generated by the mitochondrion.
2-E+2-3a induced mROS is involved in NLRP3-activation and IL-1β production. SARS-CoV-1, activation of the NLRP3-I and associated pathogenicity were observed for both viroporins 1-E+1-3a (11, 14, 34, 35). To determine if this is the case for SARS-CoV-2, we used two model systems to determine if 2-E+2-3a expression activates the NLRP3-I via the mitochondrion. In the first, we reconstituted the inflammasome in 293T cells by transforming with plasmids encoding the components of the NLRP3-I (Figure 3A) (25). In the second, we employed the human acute monocytic leukemia derived cell line, THP1, which can be converted to macrophages by treatment with phorbol ester (PMA) and the macrophages treated with LPS + nigericin (Figure 3B) (36). The reconstituted NLRP3-I 293T cells were transduced with the 2-E+2-3a expression vector (Figure 3A). The THP-1 cells were first transduced with the 2-E+2-3a expression vector and then treated with PMA and LPS + nigericin (Figure 3B). The expression of 2-E+2-3a in both cell systems, 293T (Figure 3C) and THP1 macrophages (Figures 3D–F) resulted in enhanced secretion of NLRP3-activated IL-1β in 293T-NLRP3-I (Figure 3E) and THP1 macrophages (Figures 3D, E).
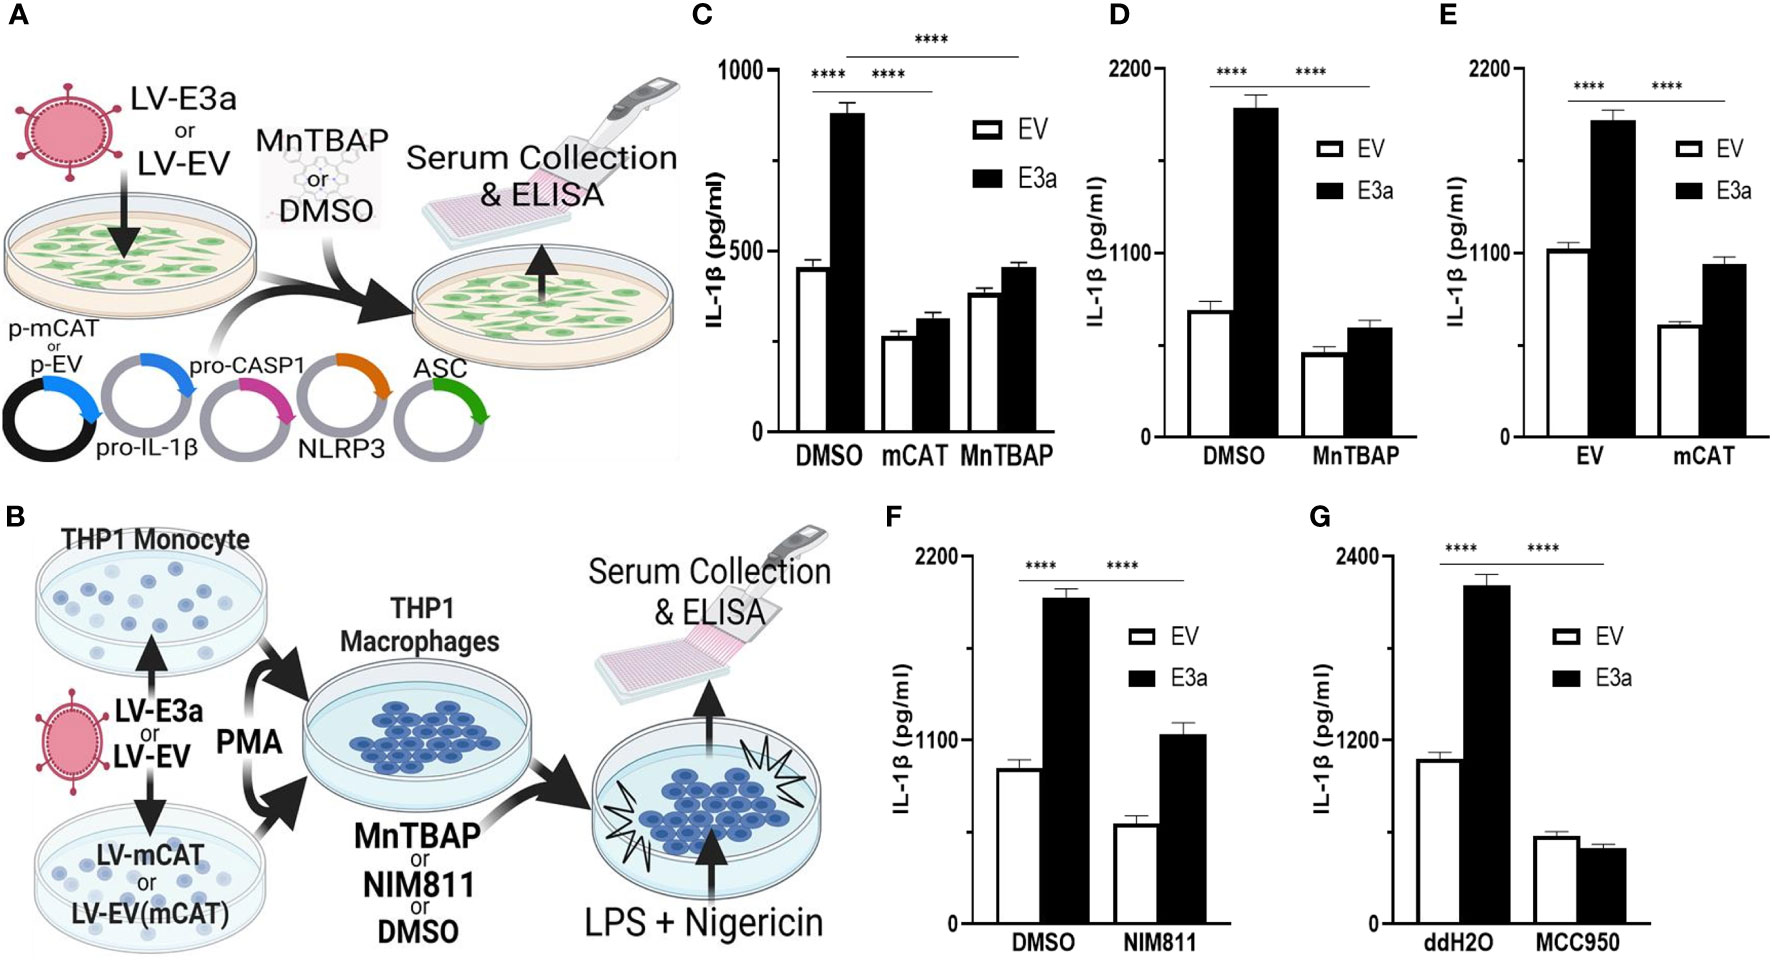
Figure 3 mROS and the mtPTP are required for activation of the NLRP3-I by the 2-E+2-3a viroporins. (A, B) Experimental design used to assess NLRP3-activated by IL-1β in cell-free supernatants quantified by ELISA. (A) 293T cells with an NLRP3-I reconstitution system (NLRP3, ASC, pro-CASP1, pro-IL-1β) and (B) THP1 differentiated into macrophages and primed with LPS + nigericin. (C) 293T cells transfected with LV-EV or LV-E3a were transfected with the NLRP3-I plasmids and p-mCAT or its control plasmid p-EV, or cultured in the presence or absence of 50 μM MnTBAP. (D, F, G) THP1 cells were transduced with LV-EV or LV-E3a, differentiated into macrophages, treated with LPS + nigericin, and treated with 5 μM MCC950, 100 μM MnTBAP or 10 μM NIM811, the supernatants analyzed for IL-1β by ELISA. (E) THP1 cells stably expressing LV-mCAT or control plasmid were infected with LV-EV or LV-E3a, differentiated into macrophages, and supernatant IL-1β levels determined via ELISA. Error bars represent SEM from 3 independent experiments; statistically significant data is indicated with asterisks (*).
We then confirmed that 2-E+2-3a expression activates the NLRP3-I and IL-1β secretion via increased mROS production. 293T cells expressing the inflammasome proteins (Figure 3C) and LPS-nigericin treated THP1 macrophages (Figures 3D, E) were treated with mitochondrially targeted antioxidants: transformation with mCAT or treatment with MnTBAP. Both mCAT expression and MnTBAP treatment impaired IL-1β secretion.
We then determined if mROS activation of the NLRP3-I was mediated by release of a mitochondrial component via the mtPTP, which has been conjectured but not proven. We treated 2-E+2-3a transduced THP1 macrophages with the specific mtPTP inhibitor N-methyl-4-isoleucine-cyclosporin (NIM811). NIM811 blocks the mtPTP by binding to cyclophilin D, analogous to cyclosporin A (CsA), but without calcineurin inactivation (37–39). NIM811 treatment suppressed the secretion of IL-1β following LPS + nigericin activation of the THP1 macrophages (Figure 3F) demonstrating for the first time the mtPTP is the route by which a mitochondrial factor, presumably mtDNA, reaches the NRLP3-I. Finally, to confirm that 2-E+2-3a secretion of IL-1β occurred through NRLP3-I, we treated THP1 macrophages with MCC950, a selective small molecule inhibitor that binds to the NACHT domain of NLRP3 (40). MCC950 blocked IL-1β secretion in 2-E+2-3a expressing THP1 macrophages, demonstrating that E3a secretion of IL-1β, was mainly through the activation of the NLRP3-I (Figure 3G).
We next demonstrated that LV-E3a transduced 293T cells increased levels of cytosolic mtDNA via Real-Time PCR quantification of mitochondrial NADH dehydrogenase subunit 5 (MT-ND5) in cytosolic-enriched supernatants (Figures 4A–C). To confirm that 2-E+2-3a increased the levels of cytosolic mtDNA via efflux through the mtPTP, we treated 2-E+2-3a expressing 293T cells with NIM811, which extinguished the 2-E+2-3a elevation of cytosolic mtDNA. This confirms that mtPTP opening contributes to 2-E+2-3a elevation of cytosolic mtDNA (Figure 4B). To determine if mROS contributed to 2-E+2-3a release of mtDNA we transduced 293T cell expressing 2-E+2-3a cells with mCAT or treated the cells with MnTBAP. Both mitochondrial catalytic antioxidants impaired 2-E+2-3a elevation of cytosolic mtDNA (Figures 4B, C). Finally, to confirm that 2-E+2-3a activation of the NRLP3-I, was dependent on mtDNA we showed that secretion of the IL-1β was lost in 293T cells with a reconstituted inflammasome (Figure 4D) that had been cured of their resident mtDNA (ρ0 cells). The presence of mtDNA is thus an absolute requirement for 2-E+2-3a activation of the NRLP3-I.
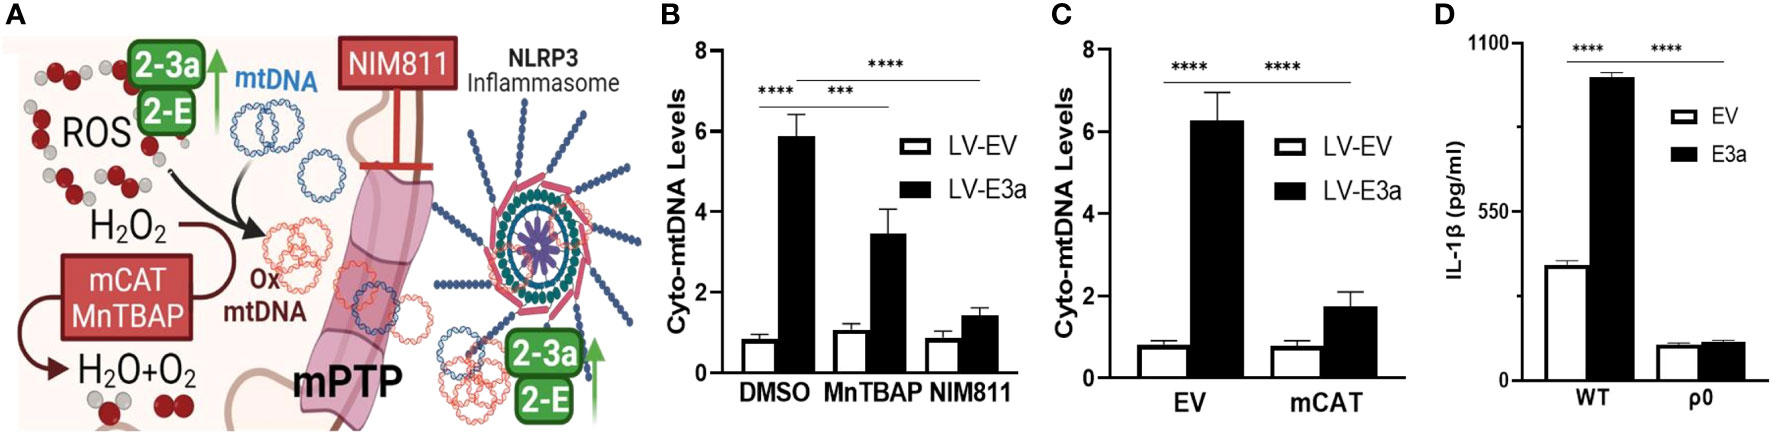
Figure 4 2-E+2-3a viroporins induced mROS is required for the release of mtDNA from the mitochondrion into the cytosol via the mtPTP. (A) Representative Figure. (B, C) 293T cells were transduced with LV-EV or LV-E3a. (B) 24 hrs post-transduction cells were treated with or without 50 uM MnTBAP or 10 μM NIM811. 10 hrs post-treatment, cells were lysed, cytosolic-enriched fractions collected, DNA isolated from the cytosolic-enriched fractions, and levels of cytosolic mtDNA determined by RT-PCR with a probe specific for MT-ND5. (C) 6 hrs post-transduction with LV-EV or LV-E3a, 293T cells were transfected with p-mCAT or its control plasmid p-EV. 24 hrs post-transfection, levels of cytosolic mtDNA were determined as described above. (D) 293T or 293T-ρ0 cells transduced with LV-EV or LV-E3a were transfected with the NLRP3-I plasmids the supernatants analyzed for IL-1β by ELISA. Error bars represent SEM from 3 independent experiments; statistically significant data is indicated with asterisks (*).
Thus, we have demonstrated that co-expression of 2-E+2-3a enhances Ca++ leakage into the cytosol, increasing levels of cytosolic and mitochondrial Ca++. This 2-E+2-3a mediated increase in mitochondrial Ca++ increases mitochondrial NADH in association with increased mROS. mtDNA is then released into the cytosol via the mtPTP which activates the NLRP3-I stimulating the secretion of IL-1β. Increasing mitochondrial antioxidant defenses through treatment with the pharmacological mROS scavenger MnTBAP or genetic expression of mCAT blocks 2-E+2-3a induced activation of the NLRP3-I, which is absolutely dependent on the presence of mtDNA. Together these findings reveal that the mechanism by which 2-E+2-3a engage the NLRP3-I is via viroporin manipulation of mitochondrial physiology causing release of mtDNA to bind to the NLRP3-I.
Discussion
A variety of mechanisms have been proposed to activate the NLRP3-I. These include interferon antagonism, organelle stress, mROS production, direct binding to inflammasome components (9, 10), and cellular expression of viroporins (16, 17). SARS-CoV-1/2 have been shown to agonizes the NLRP3-I by three mechanisms. First, through direct viral protein interaction with components or regulatory proteins of the NLRP3-I, via 2-N interaction with the NLRP3 receptor, and 1-3a interaction with CASP1 & TNF Receptor Associated Factor 3 (TRAF3) (13, 15, 36). Second, by increasing NF-κB-dependent target gene transcription of pro-inflammatory cytokines such as IL-18 and IL-1β through the 2-N, 2-S, 2-7a, 1-3a & 2-3a proteins (15, 36, 41, 42). Third, by distress or cellular damage caused by SARS-CoV-1/2 viroporins (11–13, 15, 43), which are transmembrane pore-forming proteins that localize to membranes and augment cell permeability to ions.
All human coronaviruses encode one or more viroporins that antagonize the NLRP3-I (44–47). SARS-CoV-1 encodes for three viroporins 1-E, 1-3a, and 1-8b. Several studies have shown that 1-E & 1-3a activate the NLRP3-I in various human cell lines transduced with the components of the NLRP3-I or LPS-primed macrophages and monocyte-derived macrophages (11, 13, 15). The 1-E viroporin has been reported to engage the NLRP3-I and elicit production of chemokines and cytokines through disrupting cellular Ca++ homeostasis (12, 14). Treatment of LPS-primed macrophages with the mROS scavenger MitoQ decreased 1-E or 1-3a activation of the NLRP3-I and secretion of IL-1β and co-expression of 1-E and 1-3a significantly increased levels of IL-1β secretion demonstrating a synergistic effect between the two viroporins (11).
SARS-CoV-2 encodes two viroporins 2-E & 2-3a, which share high sequence homology with their SARS-CoV-1 counterparts and function as cation-selective ion channels (19, 48). Both 1-3a & 2-3a stimulate NF-κB-dependent gene transcription and that 2-E increases the transcription of pro-inflammatory cytokines and chemokines, including IL-1β (13, 14, 42). However, the central role of the mitochondrion in viroporin activation of the NLRP3-I and the central role of mitochondrial Ca++, mROS, and mtDNA in viroporin-induced inflammation had not been determined. Our paper now demonstrates that the activation of the NLRP3-I via the 2-E and 2-3a proteins requires mitochondrial signaling via mitochondrial uptake of Ca++, increased NADH and mROS levels, the presence of mtDNA, and the release of mtDNA through the mtPTP. By inducing Ca++ release into the cytosol, 2-E+2-3a likely activates the tricarboxylic acid cycle dehydrogenases generating the excess NADH (21). The resulting excessive reducing equivalents likely then overloads the electron transport chain producing increased mROS. Presumably, the increased mROS damages the mtDNA and activates mtPTP opening. This increases cytosolic mtDNA, which can bind to and activate the NLRP3-I.
While our experiments did not confirm that the mtDNA released through the mtPTP was oxidized, other studies have shown that oxidized mtDNA is a ligand of NLRP3-I (10, 22). Thus, we complete the mitochondrial innate immune activation pathway by showing that the presence of mtDNA is required for activation of the NLRP3-I and that release of mtDNA is via the mtPTP.
Demonstration that SARS-CoV-2 activated the inflammasome via the mitochondria provides new approaches to mitigating the severity of the cytokine storm. Previous studies have indicated that generalized antioxidants such as N-acetyl cysteine (49), glutathione (50), and catalase (51) can reduce viral propagation and pathology. Our data extend these observations by identifying the sequence of events by which SARS-CoV-2 activates the NLRP3-I, thus demonstrating that mROS and the mtPTP are critical steps in NLRP3-I activation. Therefore more effective therapies may be obtained using mitochondrially targeted catalytic antioxidants such as MnTBAP (33), EUK-8, and EUK-134 (52) and also inhibitors of the mtPTP such as NIM811 (37, 38).
Data availability statement
The original contributions presented in the study are included in the article/supplementary material. Further inquiries can be directed to the corresponding author.
Author contributions
Conceptualization: JG, DW. Methodology: JG, PP, PS, DW, AA, DM. Literature and concept integration: JG, PP, DW, AA, DM. Formal Analysis: JG, PS, DW, AA, DM. Literature and concept integration: JG, P.P, DW, AA, DM, AA, DM, DW. Writing – Original Draft: JG. Investigation: JG, AA, DM, DW, TL, JH. Sample Collection: JG, T.L. Writing – Review & Editing: JG, DW, AA, DM, PS, TL. Visualization: JG, DW, AA, DM. Supervision: JG, P.P, DW, AA, DM. Funding Acquisition: DW. All authors contributed to the article and approved the submitted version.
Funding
This work was supported by DOD grant W81XWH-21-1-0128 awarded to D.C.W.
Acknowledgments
The authors thank Dr. Bruce Beutler for gifts of expression plasmids and Dr. Cristina Mammucari (Department of Biomedical Sciences, University of Padua, 35131 Padua, Italy) and Dr. Kevin Foskett (Department of Cell and Developmental Biology, University of Pennsylvania, 19104 Philadelphia, Pennsylvania) and Dr. Diego De Stefani (Department of Biomedical Sciences, University of Padua, Padua, Italy) for gifting MCUi11, which they purchased from AKos Consulting & Solutions GmbH.
Conflict of interest
DW serves of the advisory boards of Plano Therapeutics, Medical Excellent Capital, and has a grant from March Therapeutics.
The remaining authors declare that the research was conducted in the absence of any commercial or financial relationships that could be construed as a potential conflict of interest.
Publisher’s note
All claims expressed in this article are solely those of the authors and do not necessarily represent those of their affiliated organizations, or those of the publisher, the editors and the reviewers. Any product that may be evaluated in this article, or claim that may be made by its manufacturer, is not guaranteed or endorsed by the publisher.
References
1. Dong E, Du H, Gardner L. An interactive web-based dashboard to track COVID-19 in real time. Lancet Infect Dis (2020) 20(5):533–4. doi: 10.1016/S1473-3099(20)30120-1
2. Rodrigues TS, de Sá KSG, Ishimoto AY, Becerra A, Oliveira S, Almeida L, et al. Inflammasomes are activated in response to SARS-CoV-2 infection and are associated with COVID-19 severity in patients. J Exp Med (2021) 218(3). doi: 10.1084/jem.20201707
3. Yang L, Xie X, Tu Z, Fu J, Xu D, Zhou Y. The signal pathways and treatment of cytokine storm in COVID-19. Signal transduction targeted Ther (2021) 6(1):255. doi: 10.1038/s41392-021-00679-0
4. Ferreira AC, Soares VC, de Azevedo-Quintanilha IG, Dias S, Fintelman-Rodrigues N, Sacramento CQ, et al. SARS-CoV-2 engages inflammasome and pyroptosis in human primary monocytes. Cell Death Discovery (2021) 7(1):43. doi: 10.1038/s41420-021-00428-w
5. Ajaz S, McPhail MJ, Singh KK, Mujib S, Trovato FM, Napoli S, et al. Mitochondrial metabolic manipulation by SARS-CoV-2 in peripheral blood mononuclear cells of patients with COVID-19. Am J Physiol Cell Physiol (2021) 320(1):C57–65. doi: 10.1152/ajpcell.00426.2020
6. Wen W, Su W, Tang H, Le W, Zhang X, Zheng Y, et al. Immune cell profiling of COVID-19 patients in the recovery stage by single-cell sequencing. Cell discov (2020) 6:31. doi: 10.1038/s41421-020-0168-9
7. Lucas C, Wong P, Klein J, Castro TBR, Silva J, Sundaram M, et al. Longitudinal analyses reveal immunological misfiring in severe COVID-19. Nature (2020) 584(7821):463–9. doi: 10.1038/s41586-020-2588-y
8. Broz P, Dixit VM. Inflammasomes: Mechanism of assembly, regulation and signalling. Nat Rev Immunol (2016) 16(7):407–20. doi: 10.1038/nri.2016.58
9. West AP, Shadel GS. Mitochondrial DNA in innate immune responses and inflammatory pathology. Nat Rev Immunol (2017) 17(6):363–75. doi: 10.1038/nri.2017.21
10. Zhong Z, Liang S, Sanchez-Lopez E, He F, Shalapour S, Lin XJ, et al. New mitochondrial DNA synthesis enables NLRP3 inflammasome activation. Nature (2018) 560(7717):198–203. doi: 10.1038/s41586-018-0372-z
11. Chen IY, Moriyama M, Chang MF, Ichinohe T. Severe acute respiratory syndrome coronavirus viroporin 3a activates the NLRP3 inflammasome. Front Microbiol (2019) 10:50. doi: 10.3389/fmicb.2019.00050
12. Nieto-Torres JL, Verdiá-Báguena C, Jimenez-Guardeño JM, Regla-Nava JA, Castaño-Rodriguez C, Fernandez-Delgado R, et al. Severe acute respiratory syndrome coronavirus e protein transports calcium ions and activates the NLRP3 inflammasome. Virology (2015) 485:330–9. doi: 10.1016/j.virol.2015.08.010
13. Siu KL, Yuen KS, Castano-Rodriguez C, Ye ZW, Yeung ML, Fung SY, et al. Severe acute respiratory syndrome coronavirus ORF3a protein activates the NLRP3 inflammasome by promoting TRAF3-dependent ubiquitination of ASC. FASEB J (2019) 33(8):8865–77. doi: 10.1096/fj.201802418R
14. Xia B, Shen X, He Y, Pan X, Liu FL, Wang Y, et al. SARS-CoV-2 envelope protein causes acute respiratory distress syndrome (ARDS)-like pathological damages and constitutes an antiviral target. Cell Res (2021) 31(8):847–60. doi: 10.1038/s41422-021-00519-4
15. Yue Y, Nabar NR, Shi CS, Kamenyeva O, Xiao X, Hwang IY, et al. SARS-coronavirus open reading frame-3a drives multimodal necrotic cell death. Cell Death Dis (2018) 9(9):904. doi: 10.1038/s41419-018-0917-y
16. Hover S, Foster B, Barr JN, Mankouri J. Viral dependence on cellular ion channels - an emerging anti-viral target? J Gen Virol (2017) 98(3):345–51. doi: 10.1099/jgv.0.000712
17. Nieva JL, Madan V, Carrasco L. Viroporins: Structure and biological functions. Nat Rev Microbiol (2012) 10(8):563–74. doi: 10.1038/nrmicro2820
18. Gordon DE, Hiatt J, Bouhaddou M, Rezelj VV, Ulferts S, Braberg H, et al. Comparative host-coronavirus protein interaction networks reveal pan-viral disease mechanisms. Science (2020) 370(6521):eabe9403. doi: 10.1126/science.abe9403
19. Kern DM, Sorum B, Mali SS, Hoel CM, Sridharan S, Remis JP, et al. Cryo-EM structure of SARS-CoV-2 ORF3a in lipid nanodiscs. Nat Struct Mol Biol (2021) 28(7):573–82. doi: 10.1038/s41594-021-00619-0
20. Verdiá-Báguena C, Aguilella VM, Queralt-Martín M, Alcaraz A. Transport mechanisms of SARS-CoV-E viroporin in calcium solutions: Lipid-dependent anomalous mole fraction effect and regulation of pore conductance. Biochim Biophys Acta Biomembranes. (2021) 1863(6):183590. doi: 10.1016/j.bbamem.2021.183590
21. Denton RM. Regulation of mitochondrial dehydrogenases by calcium ions. Biochim Biophys Acta (2009) 1787(11):1309–16. doi: 10.1016/j.bbabio.2009.01.005
22. Xian H, Liu Y, Rundberg Nilsson A, Gatchalian R, Crother TR, Tourtellotte WG, et al. Metformin inhibition of mitochondrial ATP and DNA synthesis abrogates NLRP3 inflammasome activation and pulmonary inflammation. Immunity (2021) 54(7):1463–77.e11. doi: 10.1016/j.immuni.2021.05.004
23. Mueller EE, Mayr JA, Zimmermann FA, Feichtinger RG, Stanger O, Sperl W, et al. Reduction of nuclear encoded enzymes of mitochondrial energy metabolism in cells devoid of mitochondrial DNA. Biochem Biophys Res Commun (2012) 417(3):1052–7. doi: 10.1016/j.bbrc.2011.12.093
24. Potluri P, Procaccio V, Scheffler IE, Wallace DC. High throughput gene complementation screening permits identification of a mammalian mitochondrial protein synthesis (ρ-) mutant. Biochim Biophys Acta (2016) 1857(8):1336–43. doi: 10.1016/j.bbabio.2016.02.021
25. Shi H, Wang Y, Li X, Zhan X, Tang M, Fina M, et al. NLRP3 activation and mitosis are mutually exclusive events coordinated by NEK7, a new inflammasome component. Nat Immunol (2016) 17(3):250–8. doi: 10.1038/ni.3333
26. Schaefer PM, Hilpert D, Niederschweiberer M, Neuhauser L, Kalinina S, Calzia E, et al. Mitochondrial matrix pH as a decisive factor in neurometabolic imaging. Neurophotonics (2017) 4(4):045004. doi: 10.1117/1.NPh.4.4.045004
27. Szymczak-Workman AL, Vignali KM, Vignali DA. Verification of 2A peptide cleavage. Cold Spring Harb Protoc (2012) 2012(2):255–7. doi: 10.1101/pdb.prot067892
28. Csordás G, Weaver D, Hajnóczky G. Endoplasmic reticulum-mitochondrial contactology: Structure and signaling functions. Trends Cell Biol (2018) 28(7):523–40. doi: 10.1016/j.tcb.2018.02.009
29. Bagur R, Hajnóczky G. Intracellular Ca(2+) sensing: Its role in calcium homeostasis and signaling. Mol Cell (2017) 66(6):780–8. doi: 10.1016/j.molcel.2017.05.028
30. Di Marco G, Vallese F, Jourde B, Bergsdorf C, Sturlese M, De Mario A, et al. A high-throughput screening identifies MICU1 targeting compounds. Cell Rep (2020) 30(7):2321–31.e6. doi: 10.1016/j.celrep.2020.01.081
31. Márta K, Hasan P, Rodríguez-Prados M, Paillard M, Hajnóczky G. Pharmacological inhibition of the mitochondrial Ca(2+) uniporter: Relevance for pathophysiology and human therapy. J Mol Cell Cardiol (2021) 151:135–44. doi: 10.1016/j.yjmcc.2020.09.014
32. Schriner SE, Linford NJ, Martin GM, Treuting P, Ogburn CE, Emond M, et al. Extension of murine life span by overexpression of catalase targeted to mitochondria. Science (2005) 308(5730):1909–11. doi: 10.1126/science.1106653
33. Melov S, Schneider JA, Day BJ, Hinerfeld D, Coskun P, Mirra SS, et al. A novel neurological phenotype in mice lacking mitochondrial manganese superoxide dismutase. Nat Genet (1998) 18(2):159–63. doi: 10.1038/ng0298-159
34. Nieto-Torres JL, DeDiego ML, Verdiá-Báguena C, Jimenez-Guardeño JM, Regla-Nava JA, Fernandez-Delgado R, et al. Severe acute respiratory syndrome coronavirus envelope protein ion channel activity promotes virus fitness and pathogenesis. PloS pathogens. (2014) 10(5):e1004077. doi: 10.1371/journal.ppat.1004077
35. Zhang X, Liu Y, Liu J, Bailey AL, Plante KS, Plante JA, et al. A trans-complementation system for SARS-CoV-2 recapitulates authentic viral replication without virulence. Cell (2021) 84(8):2229–38.e13. doi: 10.1016/j.cell.2021.02.044
36. Pan P, Shen M, Yu Z, Ge W, Chen K, Tian M, et al. SARS-CoV-2 n protein promotes NLRP3 inflammasome activation to induce hyperinflammation. Nat Commun (2021) 12(1):4664. doi: 10.1038/s41467-021-25015-6
37. Dittmar M, Lee JS, Whig K, Segrist E, Li M, Kamalia B, et al. Drug repurposing screens reveal cell-type-specific entry pathways and FDA-approved drugs active against SARS-Cov-2. Cell Rep (2021) 35(1):108959. doi: 10.1016/j.celrep.2021.108959
38. Tóth E, Maléth J, Závogyán N, Fanczal J, Grassalkovich A, Erdős R, et al. Novel mitochondrial transition pore inhibitor n-methyl-4-isoleucine cyclosporin is a new therapeutic option in acute pancreatitis. J Physiol (2019) 597(24):5879–98. doi: 10.1113/JP278517
39. Zhang M, He Q, Chen G, Li PA. Suppression of NLRP3 inflammasome, pyroptosis, and cell death by NIM811 in rotenone-exposed cells as an in vitro model of parkinson’s disease. Neuro-degenerative Dis (2020) 20(2-3):73–83. doi: 10.1159/000511207
40. Coll RC, Hill JR, Day CJ, Zamoshnikova A, Boucher D, Massey NL, et al. MCC950 directly targets the NLRP3 ATP-hydrolysis motif for inflammasome inhibition. Nat Chem Biol (2019) 15(6):556–9. doi: 10.1038/s41589-019-0277-7
41. Albornoz EA, Amarilla AA, Modhiran N, Parker S, Li XX, Wijesundara DK, et al. SARS-CoV-2 drives NLRP3 inflammasome activation in human microglia through spike protein. Mol Psychiatry (2022). doi: 10.1101/2022.01.11.475947
42. Su CM, Wang L, Yoo D. Activation of NF-κB and induction of proinflammatory cytokine expressions mediated by ORF7a protein of SARS-CoV-2. Sci Rep (2021) 11(1):13464. doi: 10.1038/s41598-021-92941-2
43. Shi CS, Nabar NR, Huang NN, Kehrl JH. SARS-coronavirus open reading frame-8b triggers intracellular stress pathways and activates NLRP3 inflammasomes. Cell Death Discovery (2019) 5:101. doi: 10.1038/s41420-019-0181-7
44. Zhang R, Wang K, Ping X, Yu W, Qian Z, Xiong S, et al. The ns12.9 accessory protein of human coronavirus OC43 is a viroporin involved in virion morphogenesis and pathogenesis. J Virol (2015) 89(22):11383–95. doi: 10.1128/JVI.01986-15
45. Zhang R, Wang K, Lv W, Yu W, Xie S, Xu K, et al. The ORF4a protein of human coronavirus 229E functions as a viroporin that regulates viral production. Biochim Biophys Acta (2014) 1838(4):1088–95. doi: 10.1016/j.bbamem.2013.07.025
46. Surya W, Li Y, Verdià-Bàguena C, Aguilella VM, Torres J. MERS coronavirus envelope protein has a single transmembrane domain that forms pentameric ion channels. Virus Res (2015) 201:61–6. doi: 10.1016/j.virusres.2015.02.023
47. Abdul-Rasool S, Fielding BC. Understanding human coronavirus HCoV-NL63. Open Virol J (2010) 4:76–84. doi: 10.2174/1874357901004010076
48. Mandala VS, McKay MJ, Shcherbakov AA, Dregni AJ, Kolocouris A, Hong M. Structure and drug binding of the SARS-CoV-2 envelope protein transmembrane domain in lipid bilayers. Nat Struct Mol Biol (2020) 27(12):1202–8. doi: 10.1038/s41594-020-00536-8
49. Geiler J, Michaelis M, Naczk P, Leutz A, Langer K, Doerr HW, et al. N-acetyl-L-cysteine (NAC) inhibits virus replication and expression of pro-inflammatory molecules in A549 cells infected with highly pathogenic H5N1 influenza a virus. Biochem Pharmacol (2010) 79(3):413–20. doi: 10.1016/j.bcp.2009.08.025
50. Cai J, Chen Y, Seth S, Furukawa S, Compans RW, Jones DP. Inhibition of influenza infection by glutathione. Free Radical Biol Med (2003) 34(7):928–36. doi: 10.1016/S0891-5849(03)00023-6
51. Shi X, Shi Z, Huang H, Zhu H, Zhou P, Zhu H, et al. Ability of recombinant human catalase to suppress inflammation of the murine lung induced by influenza a. Inflammation (2014) 37(3):809–17. doi: 10.1007/s10753-013-9800-2
52. Melov S, Doctrow SR, Schneider JA, Haberson J, Patel M, Coskun PE, et al. Lifespan extension and rescue of spongiform encephalopathy in superoxide dismutase 2 nullizygous mice treated with superoxide dismutase-catalase mimetics. J Neurosci (2001) 21(21):8348–53. doi: 10.1523/JNEUROSCI.21-21-08348.2001
Keywords: COVID-19, NLRP3-inflammasome, viroporin, mitochondrial permeability transition pore, mitochondria in innate immune responses
Citation: Guarnieri JW, Angelin A, Murdock DG, Schaefer P, Portluri P, Lie T, Huang J and Wallace DC (2023) SARS-COV-2 viroporins activate the NLRP3-inflammasome by the mitochondrial permeability transition pore. Front. Immunol. 14:1064293. doi: 10.3389/fimmu.2023.1064293
Received: 08 October 2022; Accepted: 30 January 2023;
Published: 20 February 2023.
Edited by:
Martijn van Griensven, Maastricht University, NetherlandsReviewed by:
Rod Russell, Memorial University of Newfoundland, CanadaJavier Traba, Autonomous University of Madrid, Spain
Copyright © 2023 Guarnieri, Angelin, Murdock, Schaefer, Portluri, Lie, Huang and Wallace. This is an open-access article distributed under the terms of the Creative Commons Attribution License (CC BY). The use, distribution or reproduction in other forums is permitted, provided the original author(s) and the copyright owner(s) are credited and that the original publication in this journal is cited, in accordance with accepted academic practice. No use, distribution or reproduction is permitted which does not comply with these terms.
*Correspondence: Douglas C. Wallace, d2FsbGFjZWQxQGVtYWlsLmNob3AuZWR1