 Mingming Xu1†
 Ping Hu
 Yang Pan
 Shangren Wang
 Xiaoqiang Liu
- 1Department of Urology, Tianjin Medical University General Hospital, Tianjin, China
- 2Department of Orthopedics, Tianjin Medical University General Hospital, Tianjin, China
Background: Diabetic nephropathy (DN) is the primary cause of end-stage renal disease, but existing therapeutics are limited. Therefore, novel molecular pathways that contribute to DN therapy and diagnostics are urgently needed.
Methods: Based on the Gene Expression Omnibus (GEO) database and Limma R package, we identified differentially expressed genes of DN and downloaded oxidative stress-related genes based on the Genecard database. Then, immune and oxidative stress-related hub genes were screened by combined WGCNA, machine learning, and protein-protein interaction (PPI) networks and validated by external validation sets. We conducted ROC analysis to assess the diagnostic efficacy of hub genes. The correlation of hub genes with clinical characteristics was analyzed by the Nephroseq v5 database. To understand the cellular clustering of hub genes in DN, we performed single nucleus RNA sequencing through the KIT database.
Results: Ultimately, we screened three hub genes, namely CD36, ITGB2, and SLC1A3, which were all up-regulated. According to ROC analysis, all three demonstrated excellent diagnostic efficacy. Correlation analysis revealed that the expression of hub genes was significantly correlated with the deterioration of renal function, and the results of single nucleus RNA sequencing showed that hub genes were mainly clustered in endothelial cells and leukocyte clusters.
Conclusion: By combining three machine learning algorithms with WGCNA analysis, this research identified three hub genes that could serve as novel targets for the diagnosis and therapy of DN.
Introduction
Diabetic nephropathy (DN), characterized by proteinuria, hypertension, and progressive reductions in kidney function, is the most common cause of end-stage renal disease in developed countries and poses a serious social and economic burden (1–3). According to studies, the number of individuals with DN is rising along with the global prevalence of diabetes, which is predicted to climb from 537 million to 783 million over the course of the next 20 years or so (4). The present course of therapy, in contrast, emphasizes renin-angiotensin system blockage, blood pressure management, and glycemic control (5). As a result, novel targets for DN diagnosis and therapy are desperately needed. With the advancement of bioinformatics, its research techniques have been actively used in recent years to explore targets for numerous illnesses, including DN.
A significant amount of data points to the importance of immune and oxidative stress in the etiology of diabetic nephropathy (6). In this research, we identified diagnostic genes for DN by a bioinformatic approach combining immune infiltration and oxidative stress and validated them with an additional external dataset, as shown in Figure 1 for the specific study route.
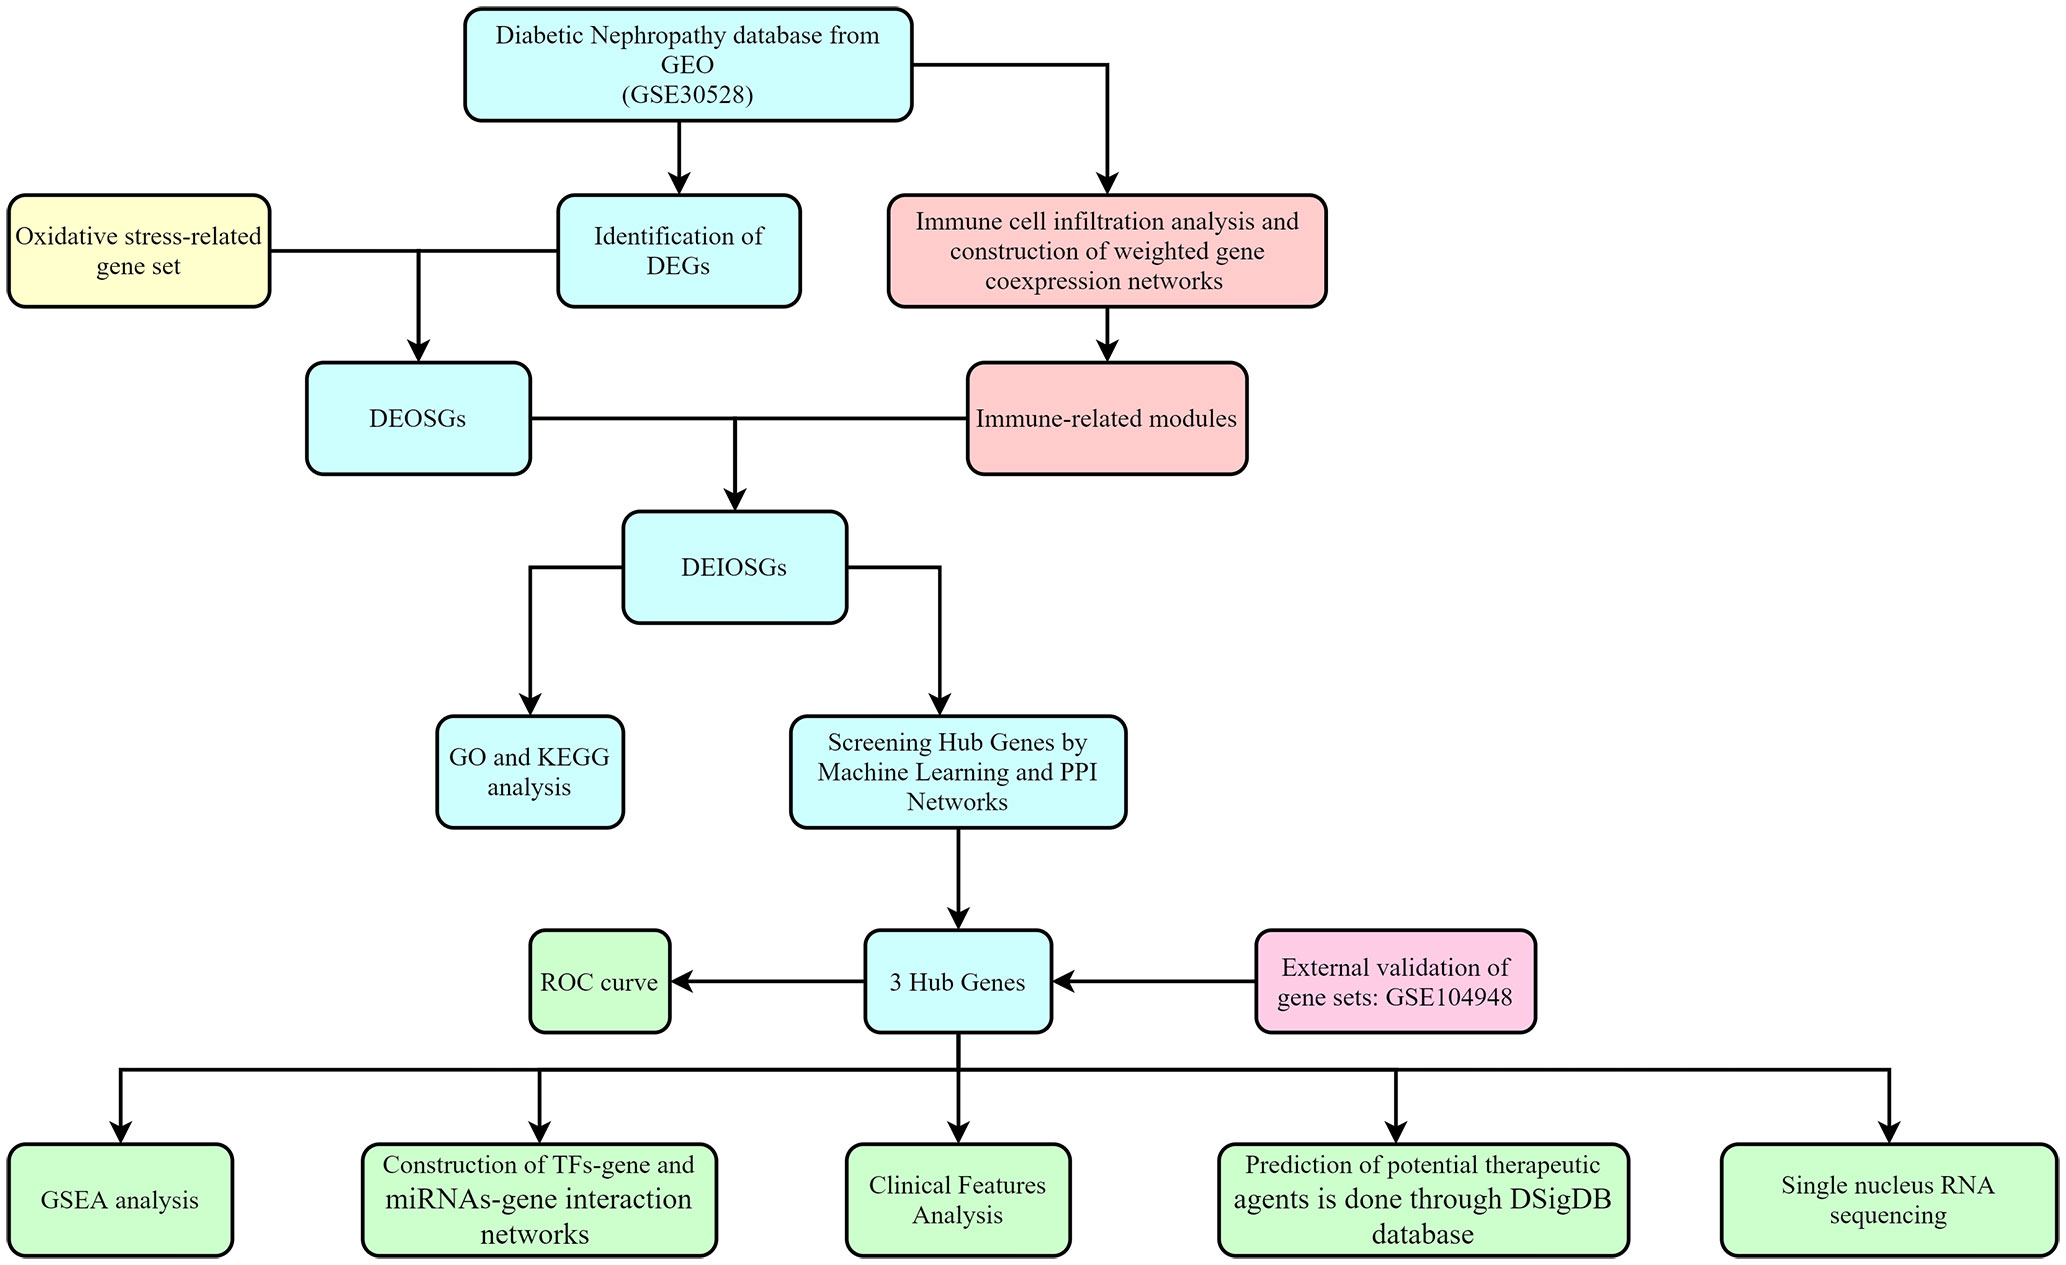
Figure 1 Flowchart for research.
Materials and methods
Source of data
We screened three diabetic nephropathy datasets: GSE30528 (GPL571) contained nine cases of diabetic nephropathy and thirteen controls; GSE104948 (GPL22945) served as a validation set and contained seven cases of diabetic nephropathy and eighteen controls; and GSE131882 (GPL24676) contained three early diabetic nephropathy and three control samples for single nucleus RNA sequencing. Additionally, using a relevance score of greater than 7 as a screening criterion, we were able to extract 855 genes associated with oxidative stress from the Genecard database. Table 1 displays the pertinent details.
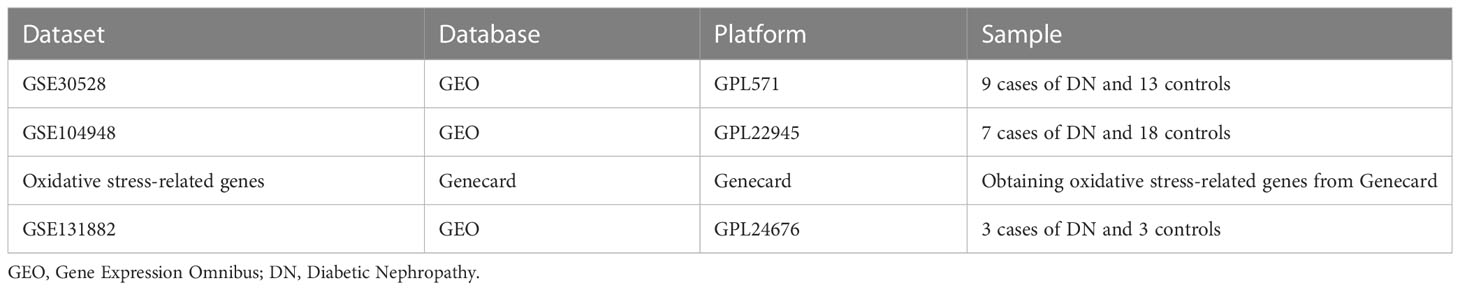
Table 1 Summary of the data sets utilized in this research and their features.
Identification of DEGs
With |log2 fold change (FC)| > 0.5 and p < 0.05 as screening criteria, differentially expressed genes (DEGs) from GSE30528 were identified utilizing “Limma” R package, where log FC > 0.5, p < 0.05 was Up, log FC < -0.5, p < 0.05 was Down. The heat map and volcano map of DEG were plotted using the “Pheatmap” R package and “ggplot2” R package, respectively.
Subsequently, the obtained DEGs were intersected with 855 oxidative stress-related genes to obtain differentially expressed genes related to oxidative stress (DEOSGs).
Immune infiltration analysis and construction of weighted gene co-expression networks
CIBERSORT employs a deconvolution algorithm to estimate the composition and abundance of immune cells in a mixture of cells based on transcriptome data. In the present study, we first assessed the proportion of 22 immune cell species in normal and diabetic nephropathy samples in GSE30528 using the CIBERSORT algorithm (7).
Weighted Gene Go-expression Network Analysis (WGCNA) is performed to identify modules of highly correlated genes, summarize the interconnections between modules and associations with external sample traits, and identify candidate biomarkers or therapeutic targets. In our research, WGCNA was constructed by the R package “WGCNA” to identify the modules with the highest relevance to immune cells in diabetic nephropathy patients (8). Specifically, we preprocessed the sample data and removed the outliers. Subsequently, the correlation matrix was constructed by the “WGCNA” software package. The optimal soft threshold was chosen to convert the correlation matrix into an adjacency matrix, and a topological overlap matrix (TOM) was created from the adjacency matrix. The TOM-based phase dissimilarity metric was utilized to categorize genes with similar expression patterns into gene modules using average linkage hierarchical clustering. The two modules with the strongest relevance to immune cells were selected as key modules for subsequent analysis.
Finally, the genes in DEOSGs and key modules were intersected, and the intersected genes were described as differentially expressed immune-related oxidative stress genes (DEIOSGs) for further study.
Gene ontology (GO) and Kyoto Encyclopedia of Genes Genomes (KEGG) functional enrichment analysis
In this research, the “clusterProfiler” R package was implemented to conduct GO and KEGG functional enrichment analysis in R to assess gene-related biological processes (BP), molecular functions (MF), cellular components (CC), and gene-related signaling pathways.
Screening hub genes by machine learning and PPI networks
Least Absolute Shrinkage and Selection Operator (LASSO) logistic regression analysis is a data mining method that sets the coefficients of less important variables to zero by applying the L1-penalty (lambda) in order to filter out the significant variables and construct the best classification model (9). Support Vector Machine-Recursive Feature Elimination (SVM-RFE) analysis is a supervised machine learning technique for identifying the optimal core genes by dropping the feature vectors generated by SVM (10). Random Forest (RF) analysis is a decision tree-based machine learning method that focuses on evaluating the significance of variables by scoring the importance of each variable (11). In combination with machine learning algorithms, the cytoHubba plugin is frequently applied for the identification of key genes. On the one hand, diagnostic genes from DEIOSG were assessed using the three machine learning algorithms separately (12). After that, the intersection of the three machine learning algorithms was established.
On the other hand, the STRING database was exploited to establish protein-protein interaction (PPI) networks, which Cytoscape then visualized. The differential genes were then evaluated using 12 algorithms in the cytoHubba plugin, and finally the top 10 genes for each algorithm were taken as intersection and visualized through the ImageGP platform (13).
Ultimately, the genes obtained by both methods in total were identified as hub genes.
Clinical analysis
The Nephroseq v5 database (http://v5.nephroseq.org) (14) is a comprehensive information platform for evaluating the correlation between gene expression levels and clinical characteristics of kidney diseases. To explore the correlation between the expression of hub genes and clinical features, we mined the Nephroseq v5 database.
GSEA analysis
We performed a single-gene GSEA analysis to investigate the possible roles of hub genes.
Regulatory network construction and potential drug prediction
The JASPAR database (15) and the TarBase database (16) were accessed by the NetworkAnalyst (https://www.networkanalyst.ca/) (17) to predict transcription factors (TFs) and miRNAs, respectively. Subsequently, the results were visualized using Cytoscape software.
We used the Enrichr platform (https://amp.pharm.mssm.edu/Enrichr/) (18) to access the DSigDB database (19) for potential drug prediction.
Single nucleus RNA sequencing
A single-cell sequencing database for kidney disease called the Kidney Integrative Transcriptomics (K.I.T.) database was developed by Ben Humphrey’s lab at Washington University (http://humphreyslab.com/SingleCell/) (20). To explore the distribution of hub genes in cell groups, we applied the database for analysis and visualization of the results. In one of them, we used single nucleus RNA sequencing data from diabetic nephropathy that was initially taken from the GSE131882 dataset.
Statistical analysis
GraphPad Prism 8.0 (GraphPad Software, CA, USA) was implemented to conduct the statistical analysis. The diagnostic value of hub genes was evaluated with ROC curve analysis. Hub genes were analyzed for correlation with clinical features via Pearson analysis. An unpaired t-test was performed for the assessment of hub gene differential expression. P < 0.05 was defined as statistically significant.
Results
Identification of DEGs
A total of 1696 DEGs were acquired from GSE30528, and another 855 oxidative stress-related genes were mined from the Genecard database, and 111 DEOSGs were generated by taking the intersection of the two (Figures 2A–C).
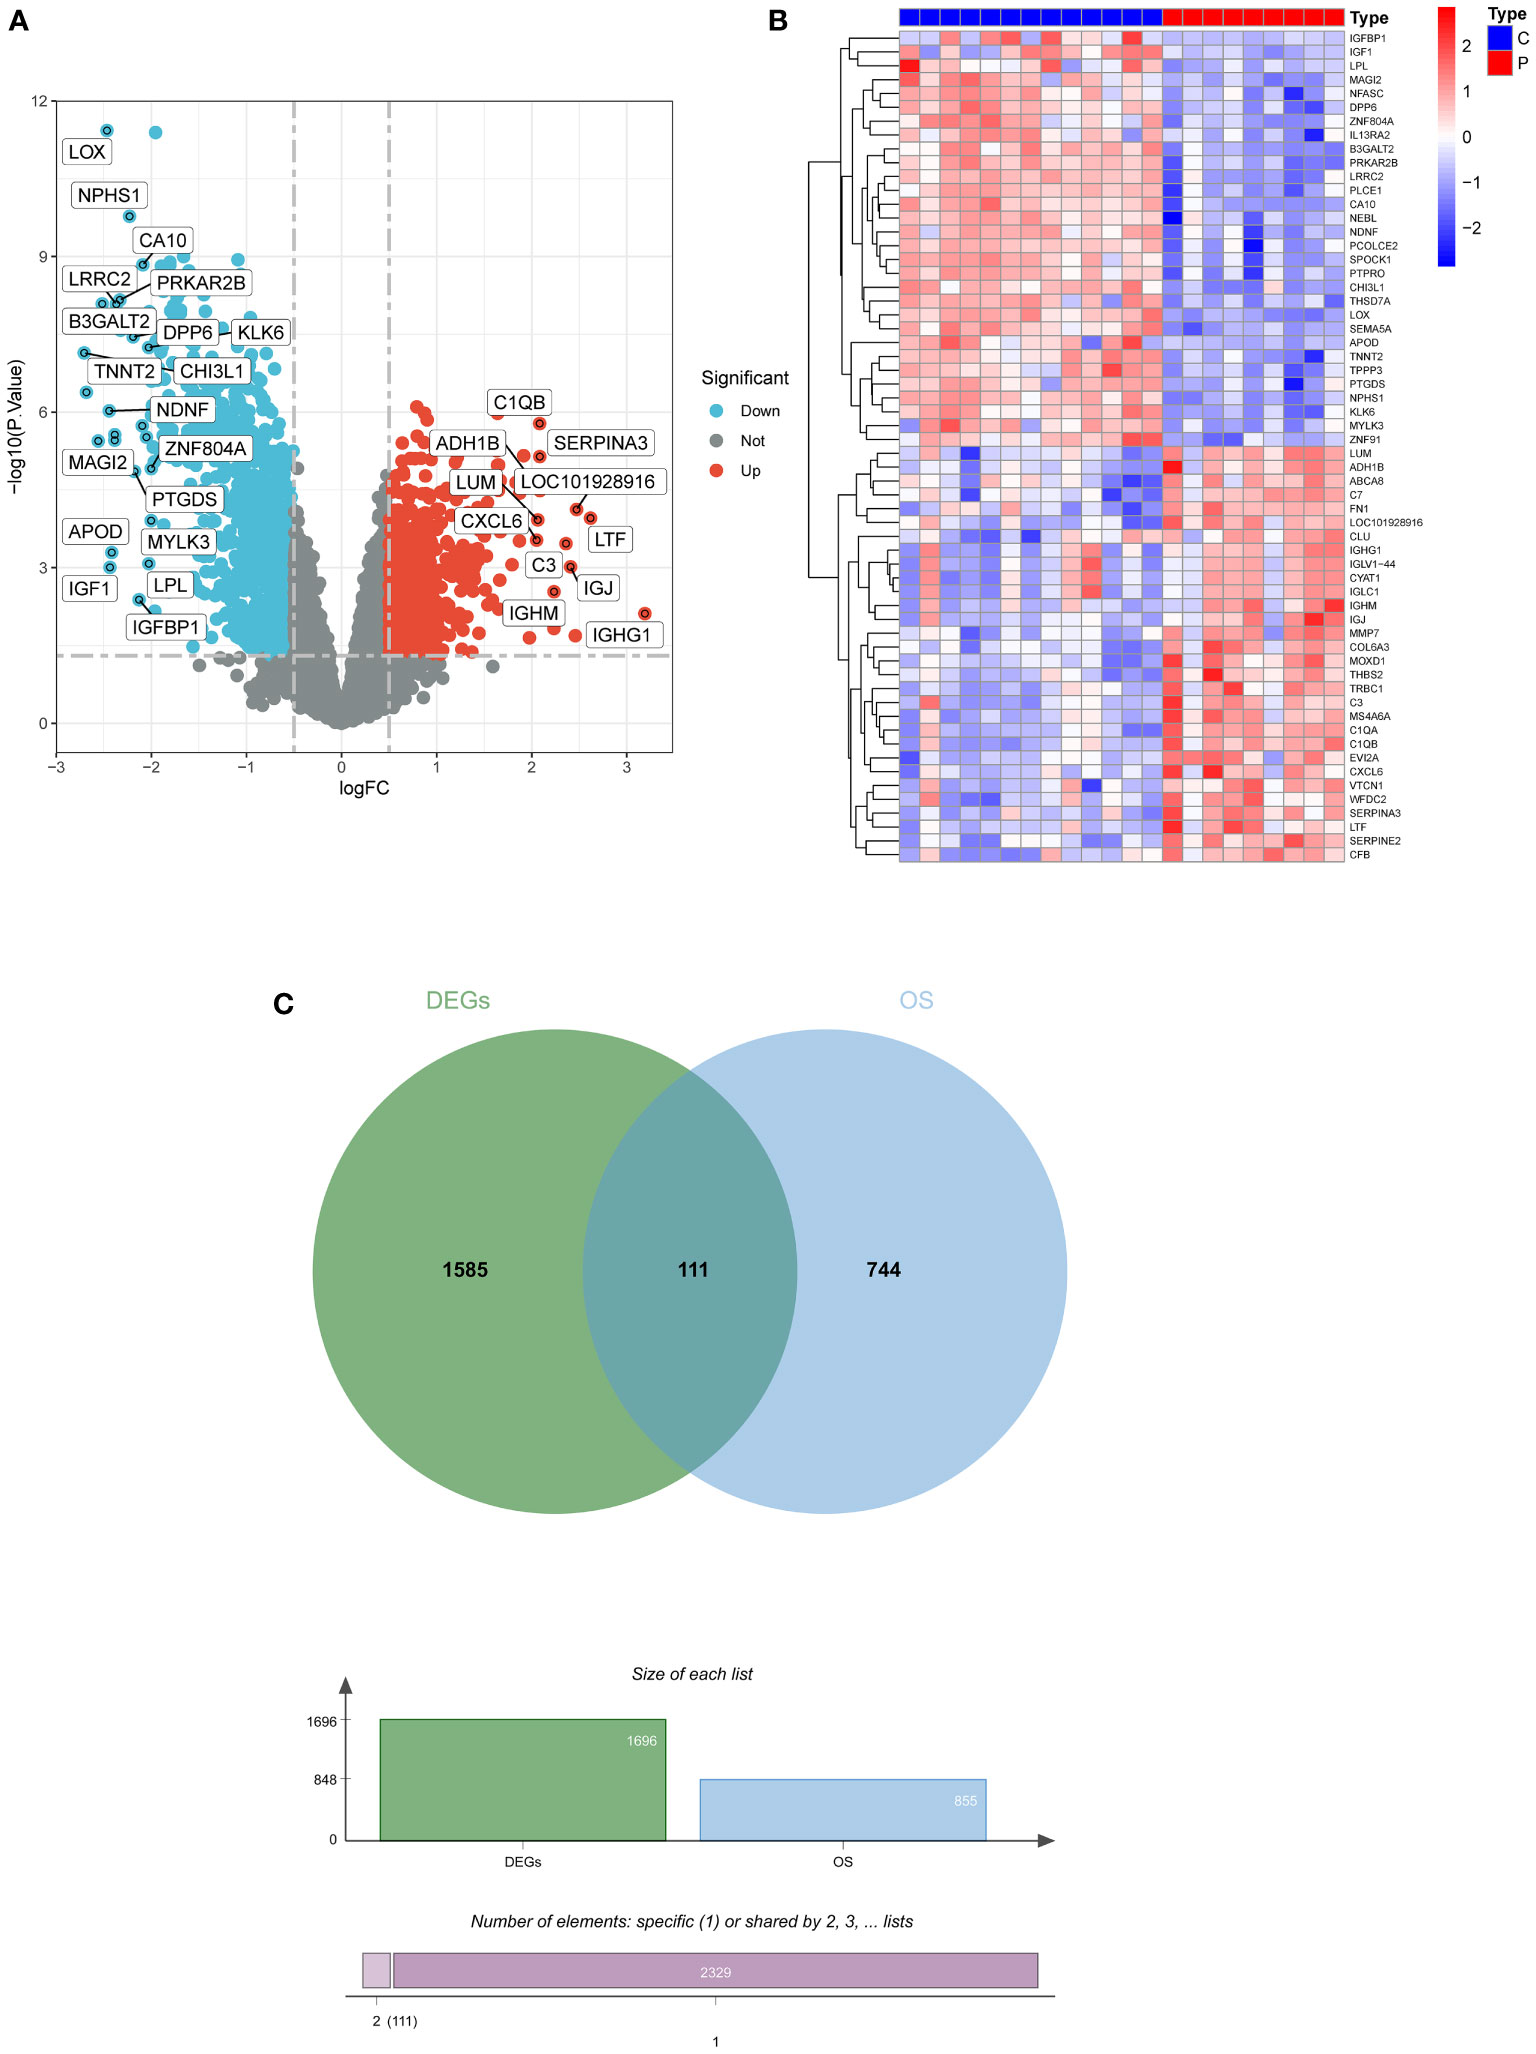
Figure 2 Screening for DEGs. (A) Volcano plot of DEGs in GSE30528. (B) Heatmap of DEGs in GSE30528. (C) Venn diagrams of DEOSGs. DEGs, differentially expressed genes; DEOSGs, differentially expressed genes related to oxidative stress.
Immune infiltration analysis and construction of weighted gene coexpression networks
Five immune cell types, including T cells CD4 naive, T cells gamma delta, NK cells resting, Dendritic cells resting, and mast cells resting, were demonstrated to be comparable between DN and control samples using the CIBERSORT algorithm (Figure 3A).
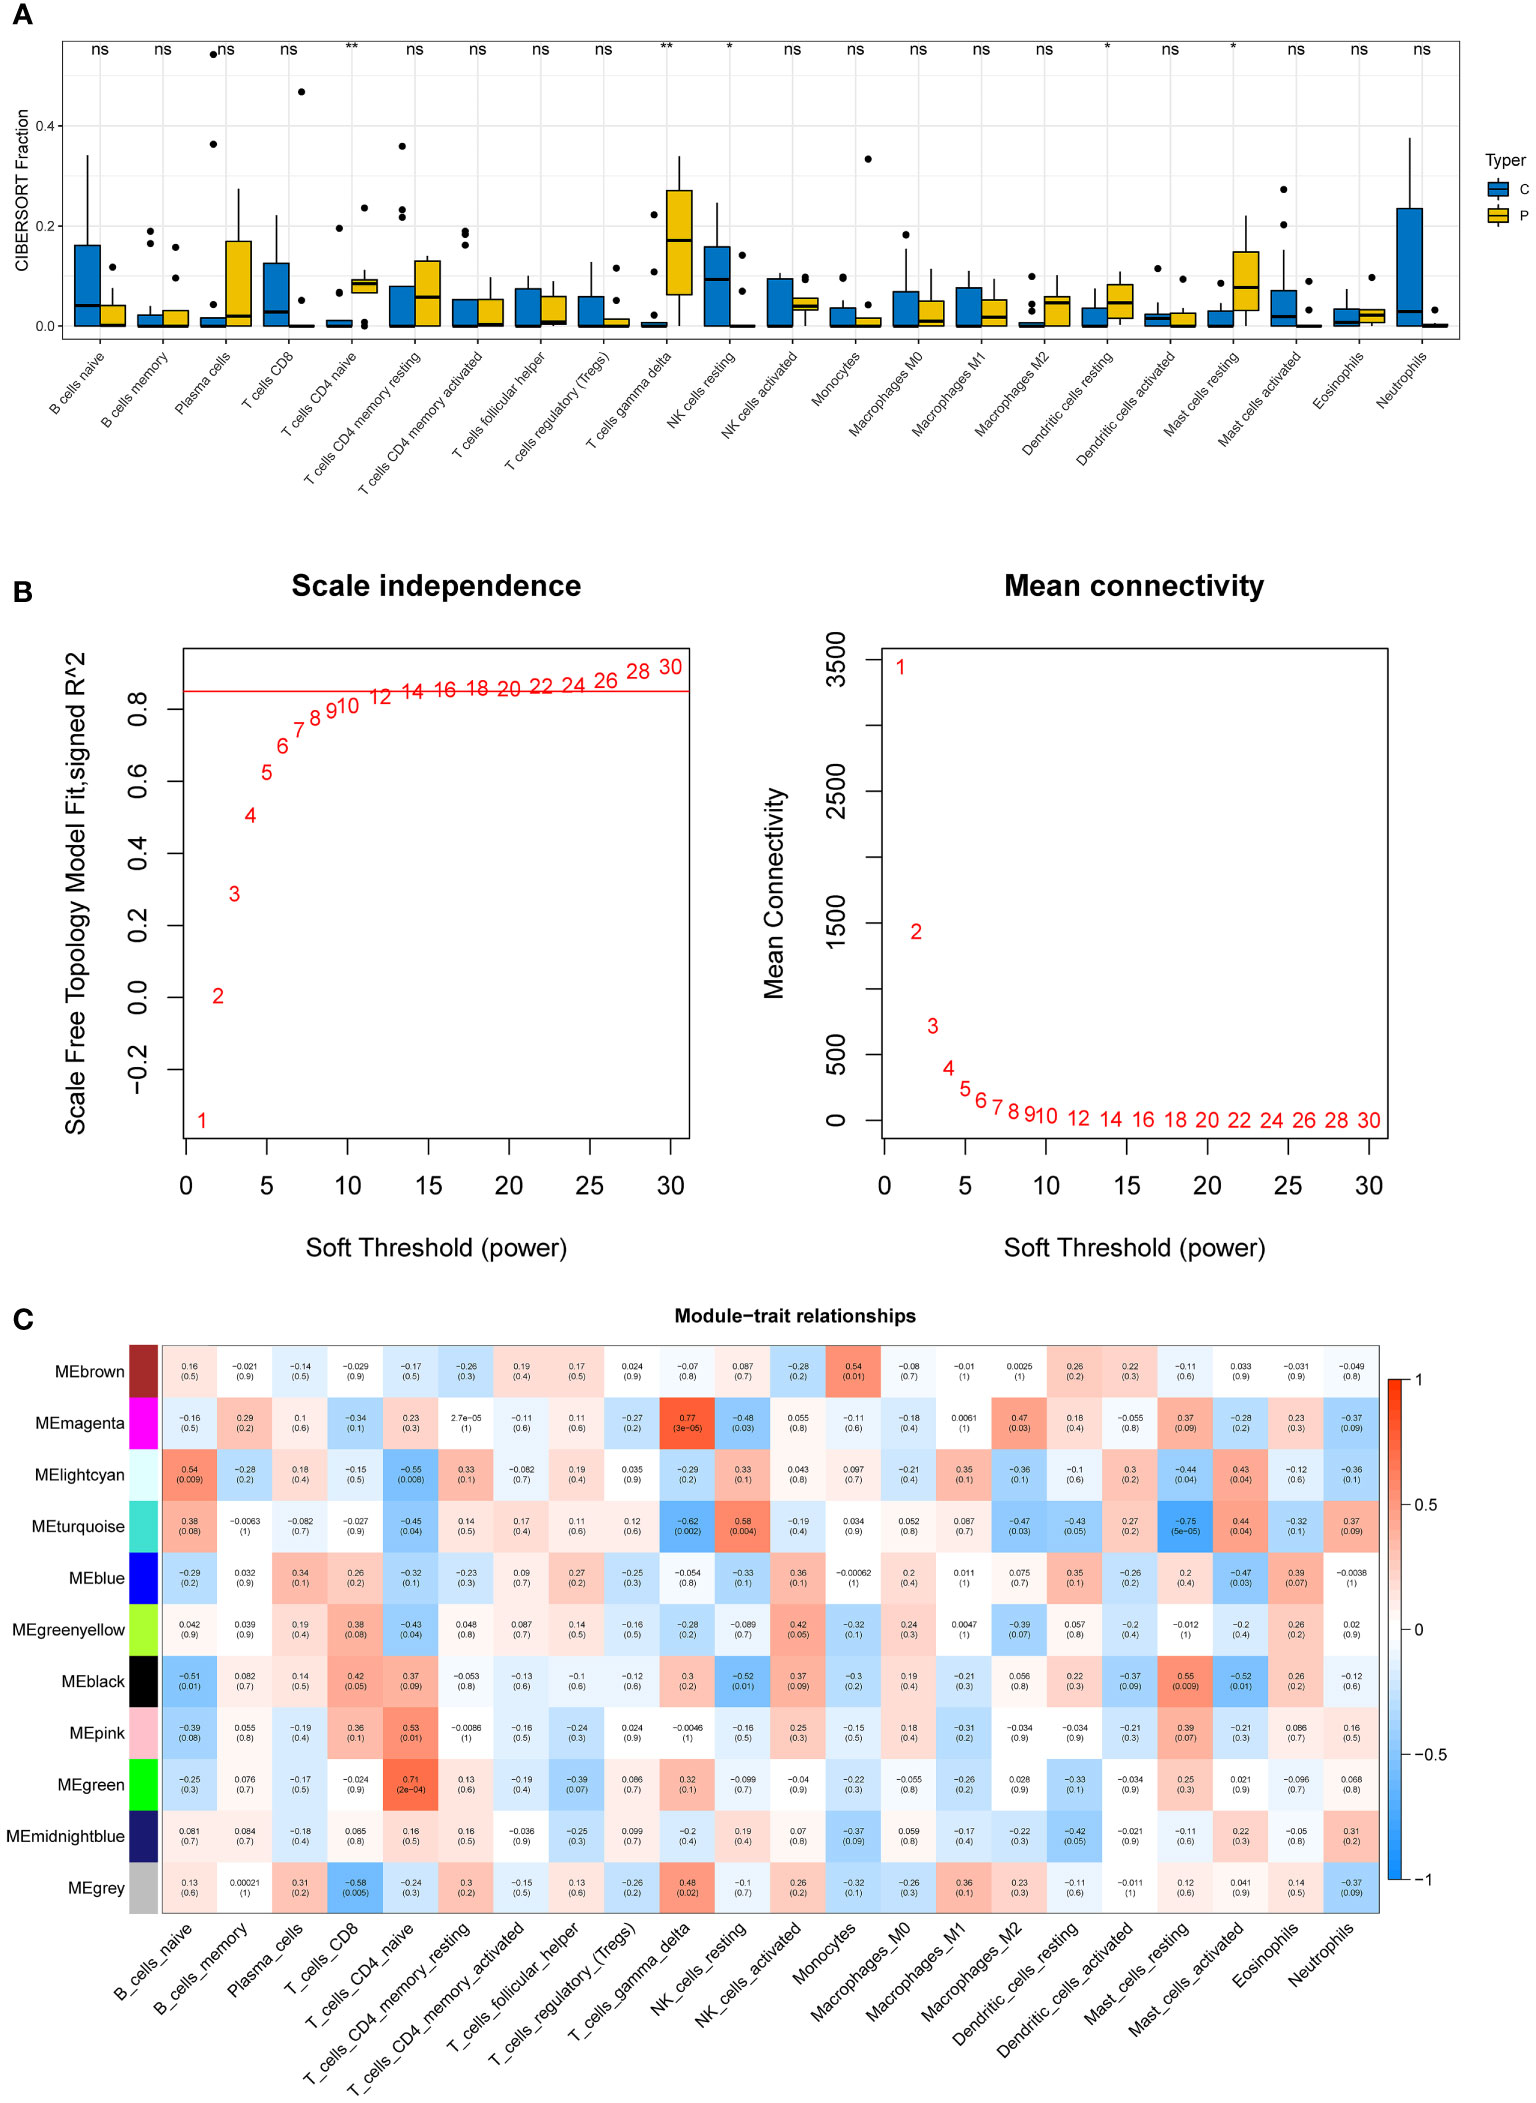
Figure 3 Immune infiltration analysis and construction of weighted gene co-expression networks. (A) 22 immune cells in samples with normal and diabetic nephropathy in GSE30528. (B) Choosing the best soft-threshold power. (C) 11 modules revealed by the WGCNA. WGCNA, weighted gene co-expression network analysis.
The soft-threshold power in this research was calibrated to 14 (scale-free R2 = 0.85) (Figure 3B). Last but not least, a sum of 11 modules was revealed by the WGCNA analysis (Figure 3C). In particular, the green module and the magenta module had strong positive correlations with T cell CD4 naive and gamma delta subsets, respectively. Due to their significance in association with immunological infiltrating cells, the green and magenta modules were considered for additional investigation.
Acquisition and functional enrichment analysis of DEIOSGs
DEIOSGs are the genes that overlap DEOSGs with the magenta and green modules generated by WGCNA, and a total of 24 DEIOSGs were identified (Figure 4A).
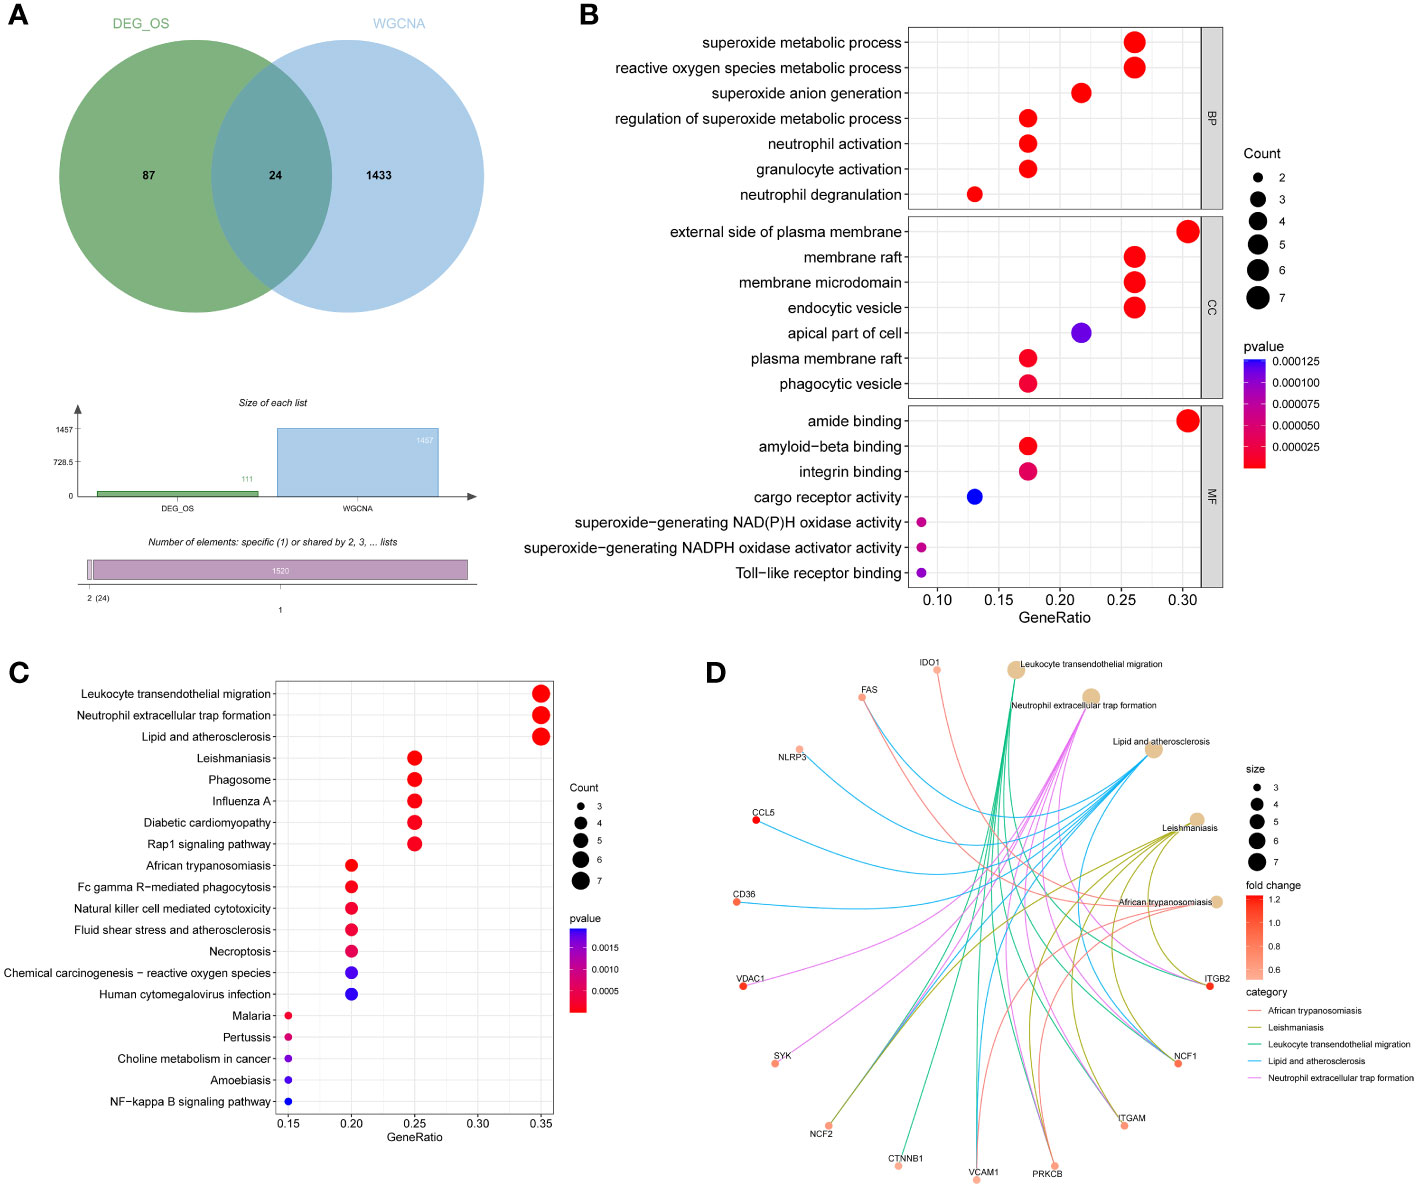
Figure 4 Acquisition and functional enrichment analysis of DEIOSGs. (A) Venn diagrams of DEIOSGs. (B) The GO outcomes are displayed with a bubble plot. (C) A bubble plot was constructed to illustrate the KEGG outcomes. (D) Results of KEGG are depicted on circle charts. DEIOSGs, differentially expressed immune-related oxidative stress genes; GO, Gene Ontology; KEGG, Kyoto Encyclopedia of Genes and Genomes; BP, biological process; CC, cellular component; MF, molecular function.
Furthermore, we performed the functional enrichment of 24 DEIOSGs via GO and KEGG. In the BP assessment, DEIOSGs were mostly engaged in superoxide metabolic processes, neutrophil activation, and other functions. DEIOSGs have been localized to the external side of the plasma membrane, endocytic vesicle, and other structures in CC. DEIOSG changes associated with MF include amide binding, integrin binding, and superoxide-generating NAD(P)H oxidase activity (Figure 4B). According to KEGG analysis, DEIOSGs are particularly abundant in leukocyte transendothelial migration, neutrophil extracellular trap formation, lipid and atherosclerosis, diabetic cardiomyopathy, natural killer cell mediated cytotoxicity and other pathways (Figures 4C, D).
Screening hub genes by machine learning and PPI networks
Firstly, 6 genes were extracted from DEIOSGs using the LASSO regression algorithm (Figure 5A). Secondly, the SVM-RFE algorithm identified 6 genes (Figure 5B). Then, 7 genes were selected by the RF algorithm (Figure 5C). Subsequently, the three were overlapped by the Venn diagram and finally two genes were obtained, namely CD36 and SLC1A3 (Figure 5D). Meanwhile, from the PPI network, we obtained a gene, namely ITGB2, through the cytoHubba plugin (Figures 6A, B). Finally, a total of 3 hub genes were identified by both methods, all of which were up-regulated.
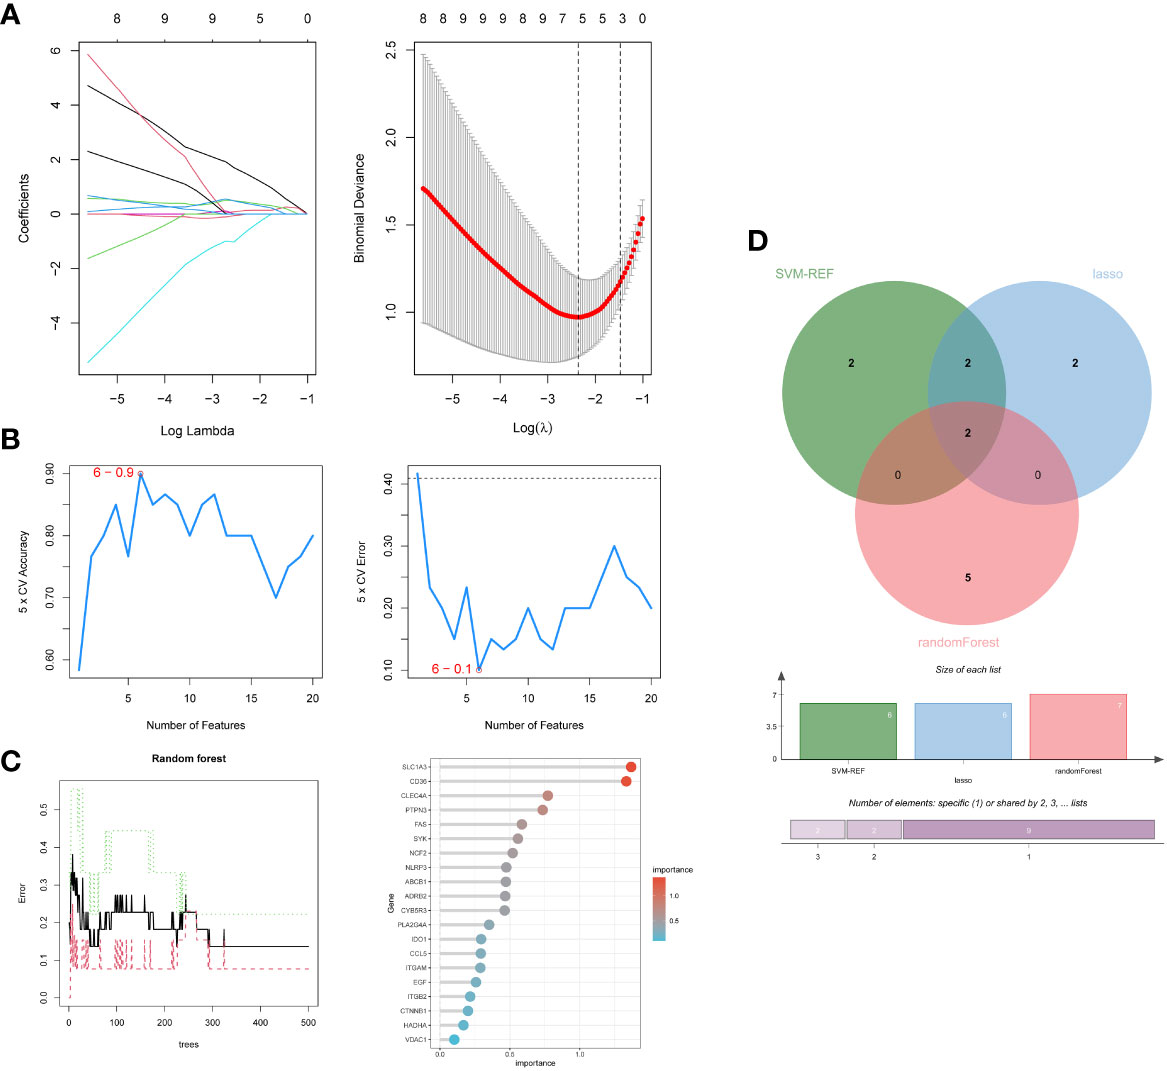
Figure 5 Screening hub genes by machine learning. (A) LASSO regression algorithm. (B) SVM-RFE algorithm. (C) RF algorithm. (D) Venn diagrams for three algorithms. LASSO, Least Absolute Shrinkage and Selection Operator; SVM-RFE, Support Vector Machine-Recursive Feature Elimination; RF, Random Forest.
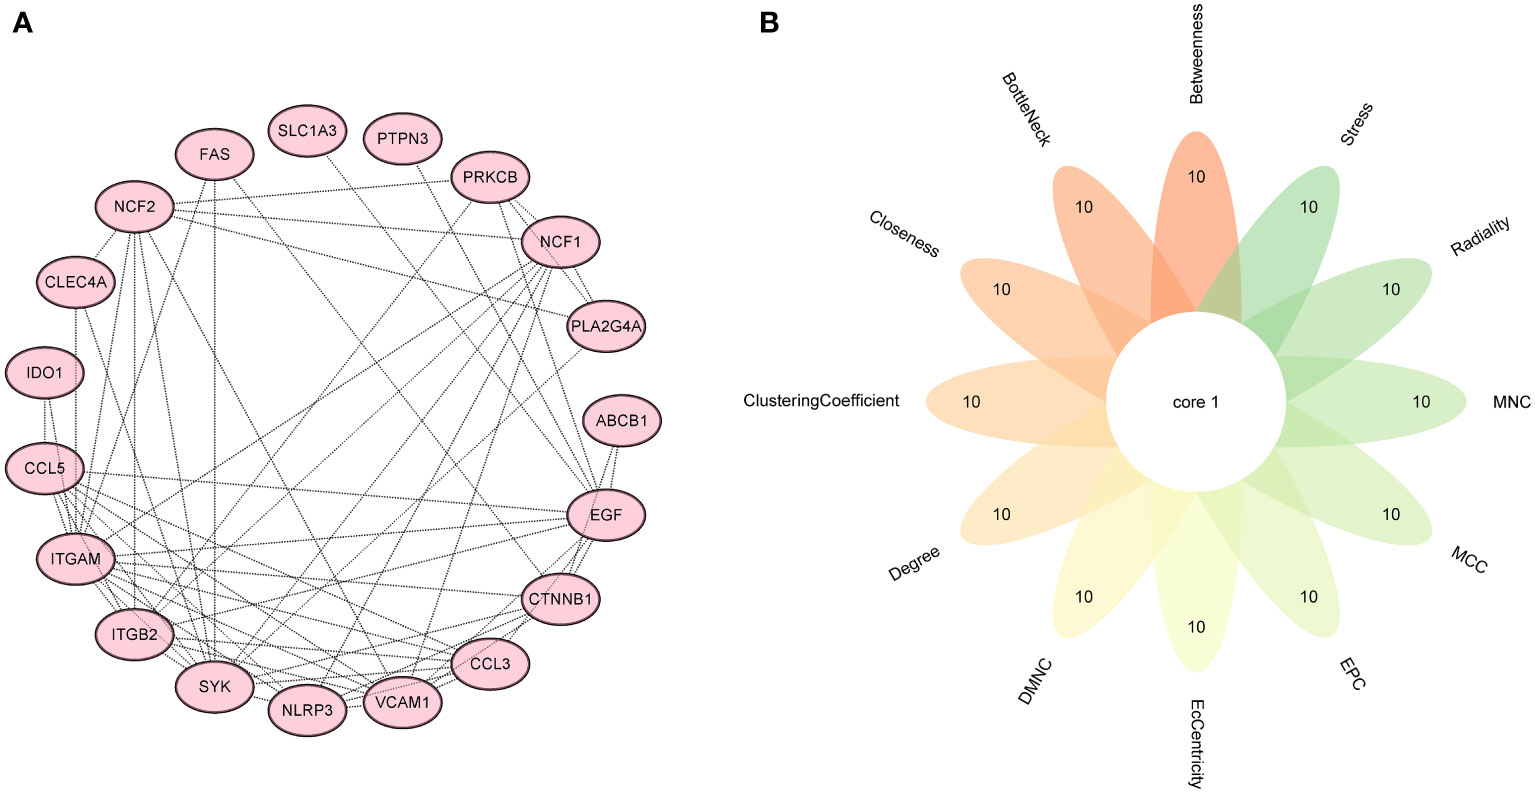
Figure 6 Screening hub genes by PPI network. (A) PPI network. (B) Venn diagrams for 12 algorithms in cytoHubba plugin. PPI, protein-protein interaction.
Expression of hub genes and validation of external datasets
When compared to the normal control sample, we discovered in the GSE30528 dataset that these genes were expressed more highly in DN (Figures 7A–C). We next confirmed the expression of these genes using another dataset, and the results revealed that these genes were likewise more strongly expressed in DN than control in GSE104948, and they were all statistically significant (Figures 7D–F).
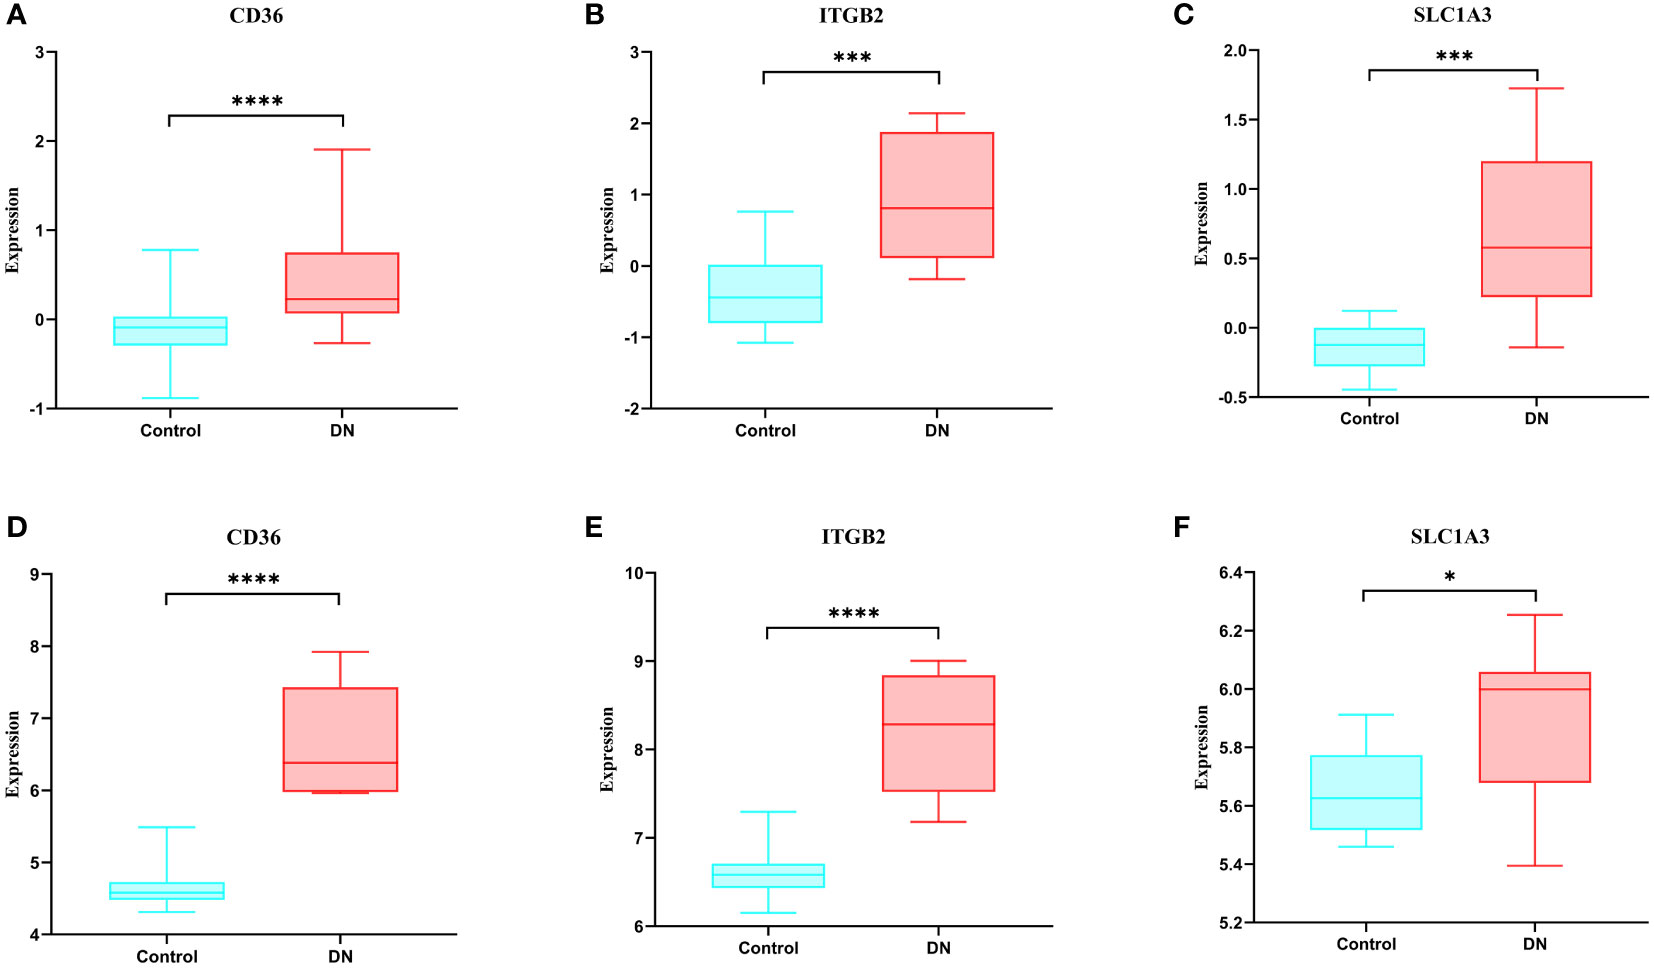
Figure 7 Expression of hub genes and validation of external datasets. (A-C) Expression of hub genes in the GSE30528 dataset. (D-F) Expression of hub genes in the GSE104948 dataset. * p<0.05; ** p<0.01; *** p<0.001; **** p<0.0001.
ROC curve analysis
To explore the diagnostic efficacy of the 3 hub genes, we implemented a ROC curve analysis in which hub genes with an AUC value > 0.7 were used as diagnostic markers. In the GSE30528 dataset, the AUC values were 0.8215 for CD36, 0.9402 for SLC1A3, and 0.9060 for ITGB2 (Figures 8A–C).
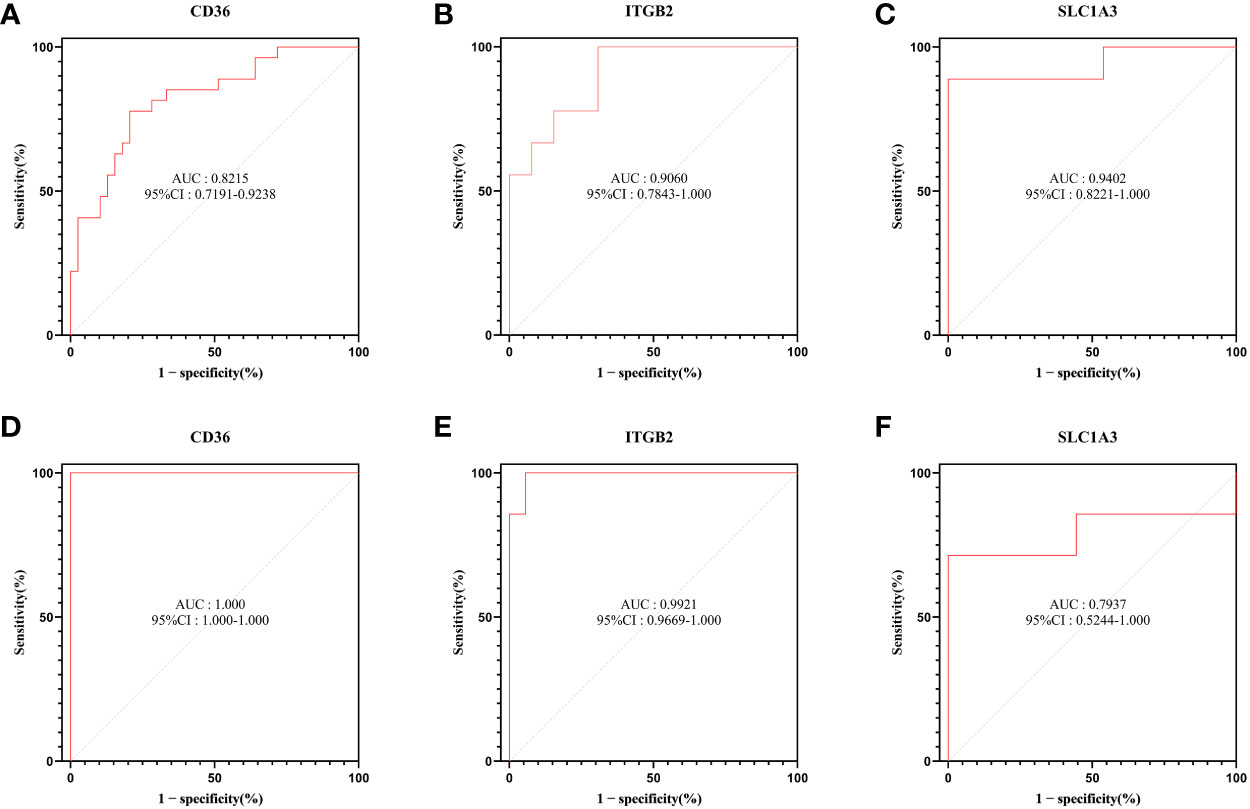
Figure 8 ROC curve analysis. (A–C) Hub genes in the GSE30528 dataset were analyzed using ROC curves. (D–F) Hub genes in the GSE104948 dataset were analyzed using ROC curves.
In the GSE104948 dataset, the AUC values of CD36 were 1.000 (95% CI: 1.000-1.000), AUC values of SLC1A3 were 0.7937 (95% CI: 0.5244-1.000), AUC values of ITGB2 were 0.9921 (95% CI: 0.9669-1.000) (Figures 8D–F).
GSEA analysis
According to GSEA findings, the CD36 high expression group was highly enriched for primary immunodeficiency and viral protein interaction with cytokines and cytokine receptors (Figure 9A). The ITGB2 high expression group was mostly concentrated in the citrate cycle (TCA cycle) and proteasome (Figure 9B). Allograft rejection, primary immunodeficiency, and systemic lupus erythematosuswere all associated with increased SLC1A3 expression (Figure 9C).

Figure 9 (A-C) GSEA analysis of hub genes.
Clinical analysis
In DN patients, correlation analysis revealed a negative correlation between CD36 expression and glomerular filtration rate (GFR) (r = -0.860, p < 0.001) and a positive correlation between CD36 expression and serum creatinine (r = 0.887, p < 0.001) (Figures 10A, B). ITGB2 expression was negatively correlated with glomerular filtration rate (GFR) (r = -0.2031, p = 0.6002) but not statistically different, whereas ITGB2 expression was positively correlated with serum creatinine (r = 0.5590, p = 0.020) (Figures 10C, D).
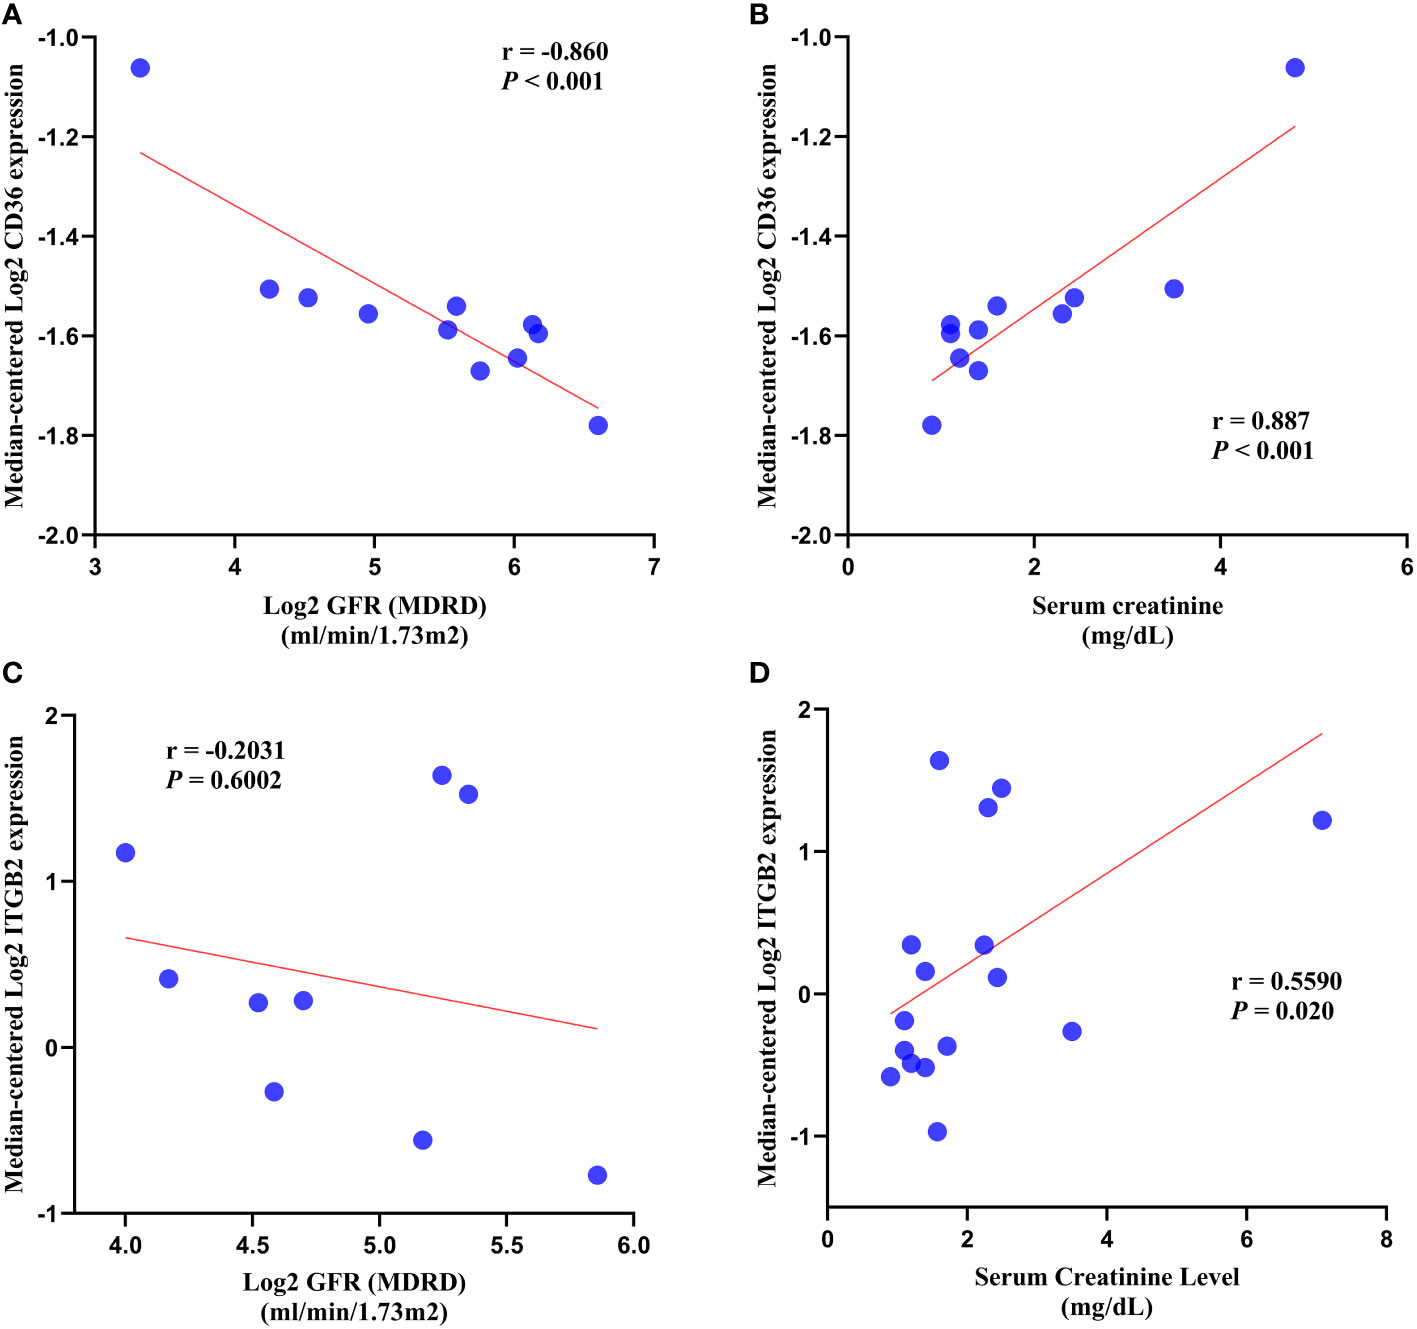
Figure 10 Correlation analysis. (A, B) Correlation analysis of CD36 with GFR and serum creatinine. (C, D) Correlation analysis of ITGB2 with GFR and serum creatinine. GFR, glomerular filtration rate.
Regulatory network construction and potential drug prediction
Using the JASPAR database, 31 TFs were finally obtained, among which, there were 9 TFs with degree≥2, and they were FOXC1, FOXL1, YY1, PPARG, STAT3, HINFP, MAX, USF1, USF2 (Figure 11A). Possible miRNAs were predicted by the TarBase database with 10 miRNAs of degree≥2 (Figure 11B).
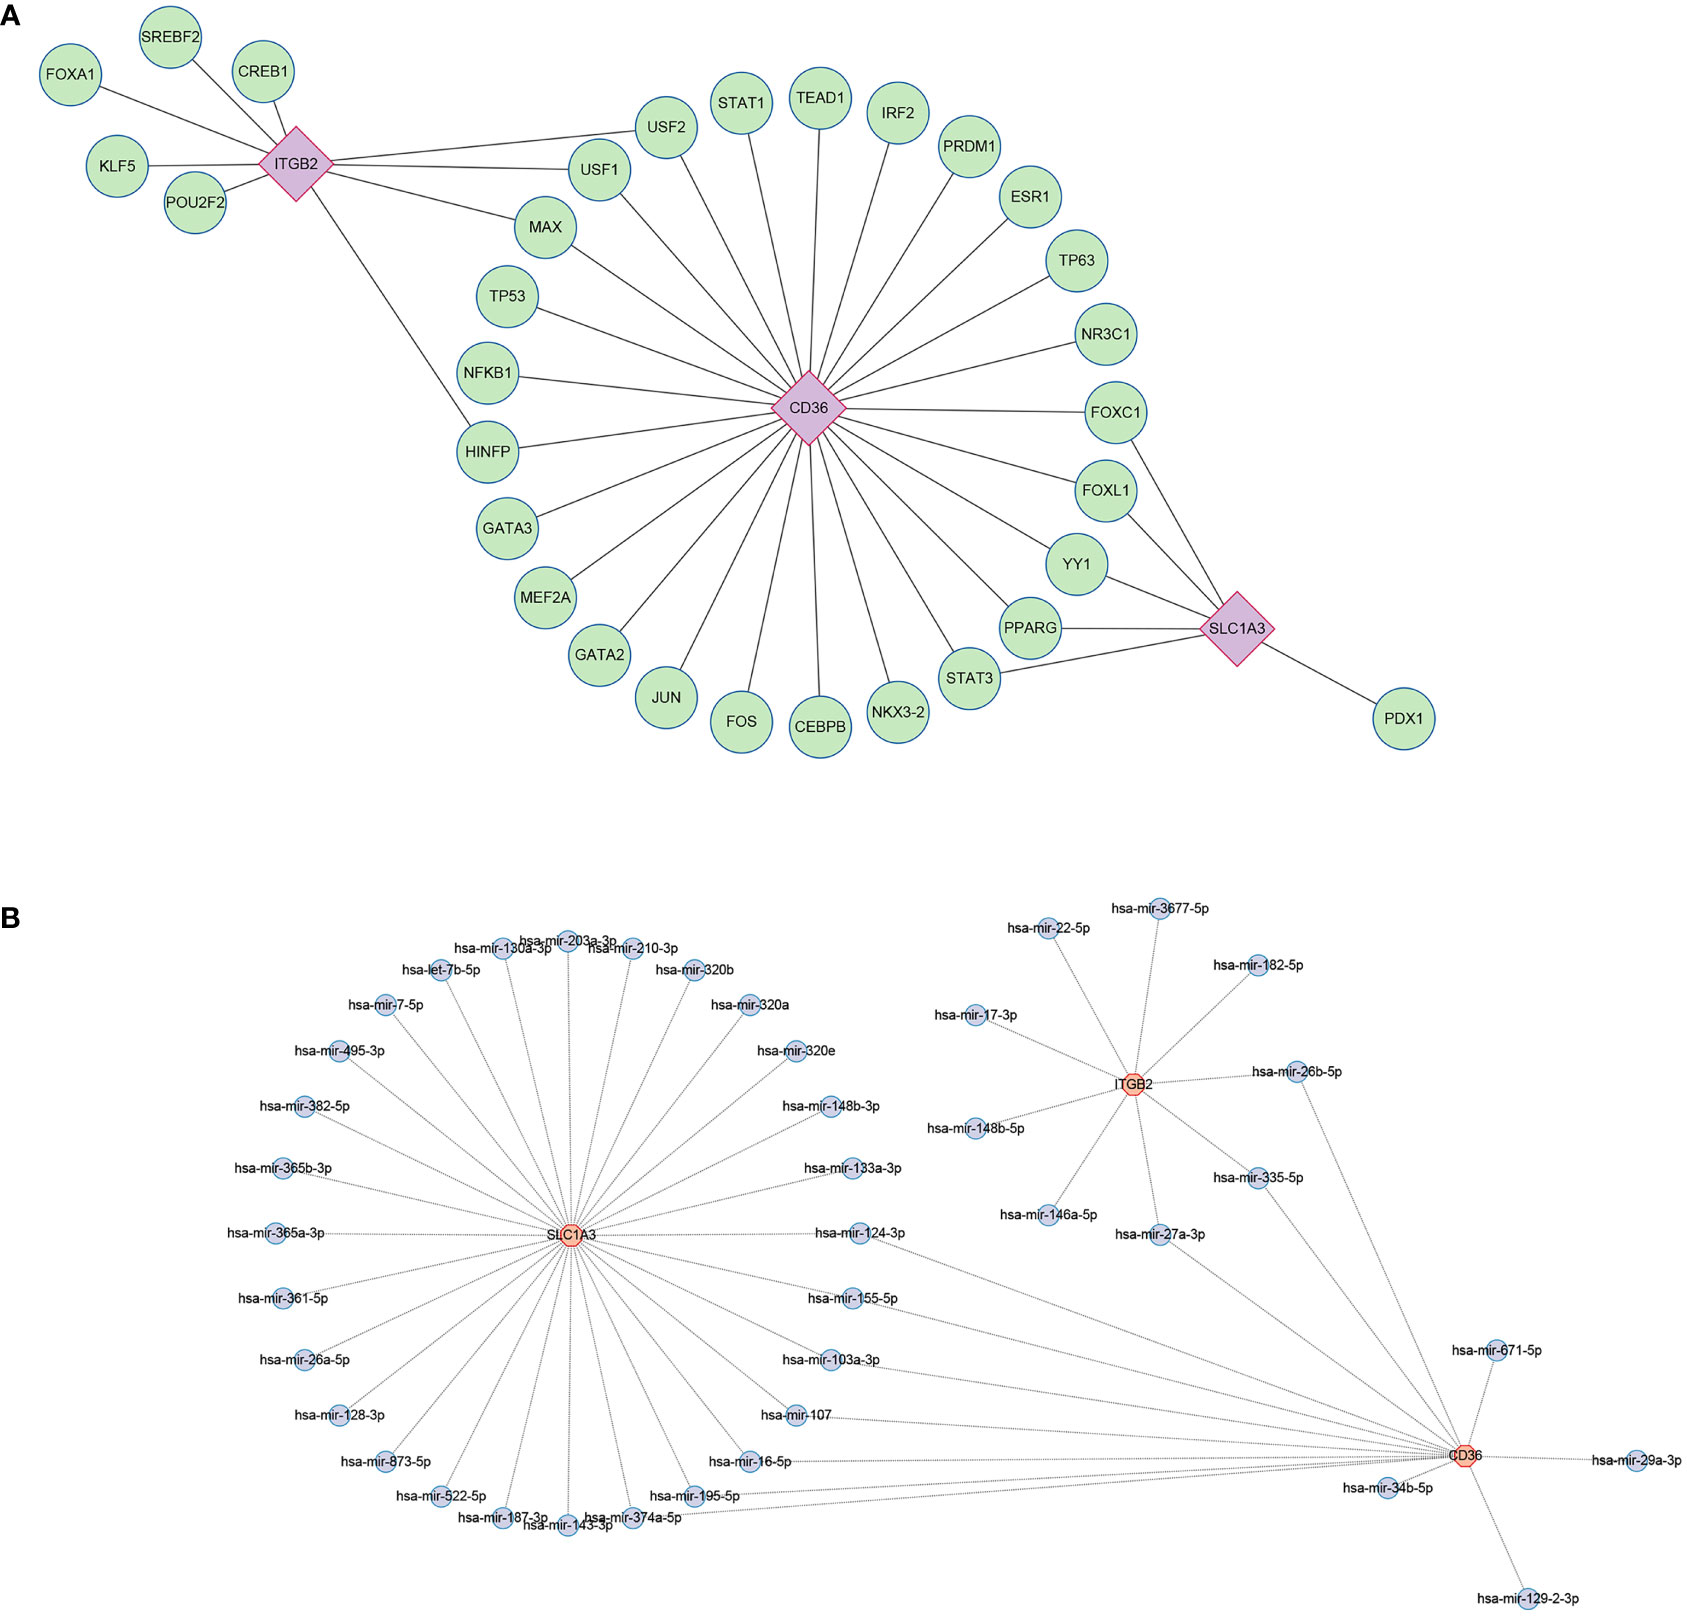
Figure 11 Regulatory network. (A) Interaction network of TFs and genes for the hub genes. (B) Network of interactions between miRNAs and the hub genes. TF, transcription factors; miRNA, microRNA.
Eighty-seven potential therapeutic agents were screened in the DSigDB database with a cut-off value of Adjusted p-value < 0.05 (Supplementary Table 1).
Single nucleus RNA sequencing
By single nucleus RNA sequencing, we determined the distribution of CD36, ITGB2 and SLC1A3 in 12 cell groups (Figure 12A), among which CD36 was mainly distributed in endothelium and ITGB2 and SLC1A3 were highly expressed in leukocyte (Figures 12B-D).
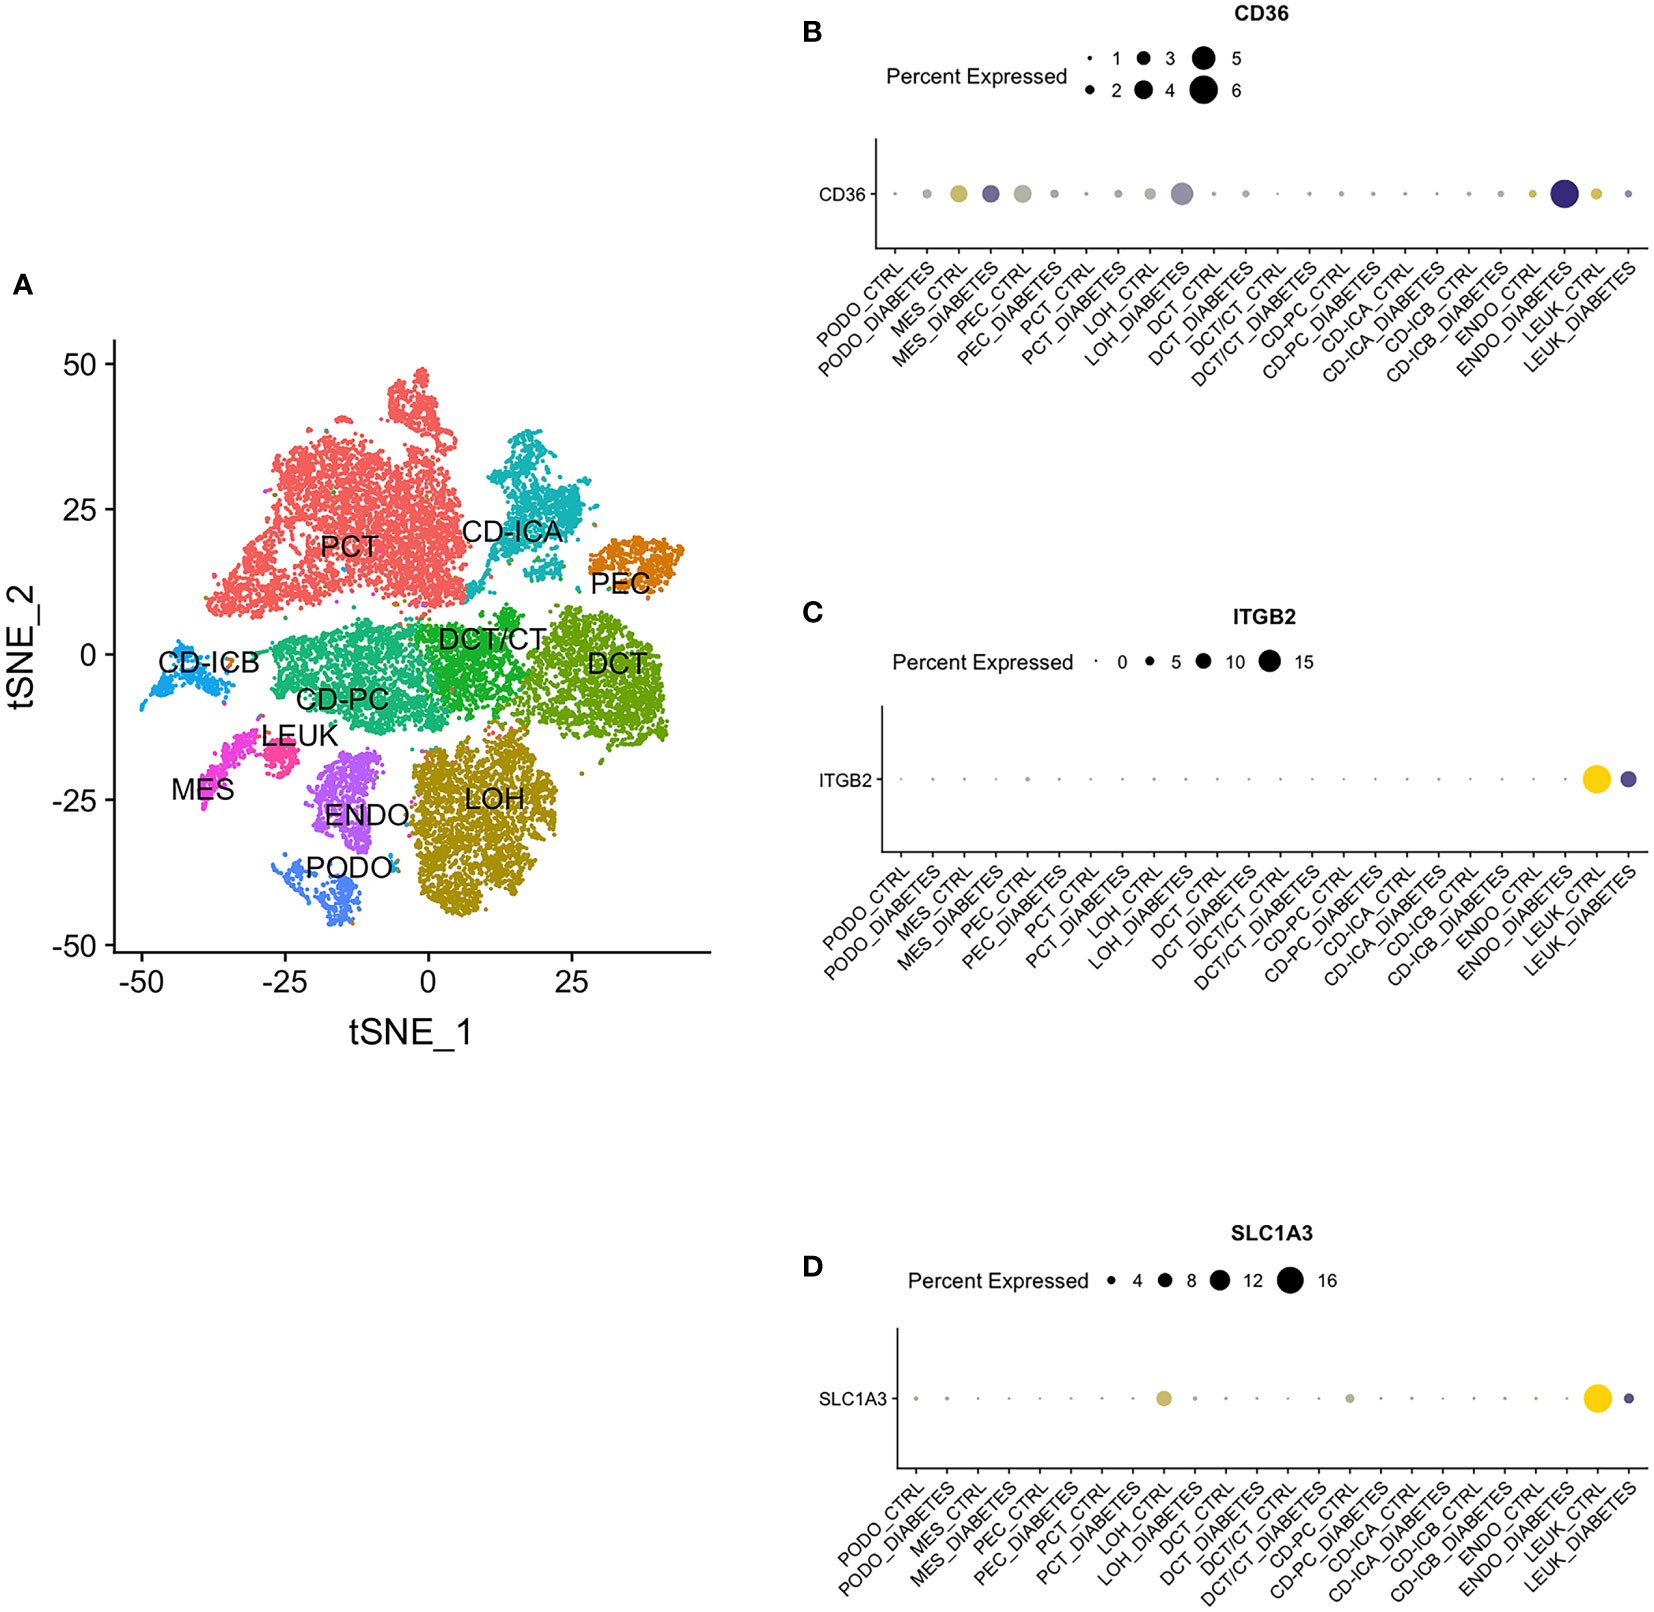
Figure 12 Single Nucleus RNA Sequencing. (A) The distribution of hub genes in 12 cell groups. (B) CD36. (C) ITGB2. (D) SLC1A3. PCT, proximal convoluted tubule; CD, collecting duct; ICA, Type A intercalated cells; ICB, Type B intercalated cells; PEC, parietal epithelial cells; PC, principal cell; DCT, distal convoluted tubule; CT, connecting tubule; LOH, loop of Henle; PODO, podocyte; ENDO, endothelium; MES, mesangial cell; LEUK, leukocyte.
Discussion
Diabetic nephropathy is triggered by a combination of several factors (21). However, its specific mechanisms remain to be explored. Due to the heterogeneity of individuals, the present therapeutic effects for diabetic nephropathy are constrained, making the necessity for novel molecular pathways that contribute to DN therapy and diagnosis essential. The progression of DN has been determined to be significantly controlled by immune infiltration and oxidative stress (22, 23). Meanwhile, with the progression of a diverse range of informatics technologies, machine learning algorithms and WGCNA have become more mature and are widely applied for the prediction of disease markers and therapeutic targets. In this research, we retrieved transcriptomic datasets from the GEO database and, combining machine learning, WGCNA, and PPI networks, identified a set of three immune and oxidative stress-related hub genes, namely CD36, ITGB2, and SLC1A3, and validated them with an additional dataset. We implemented ROC curve analysis to assess the diagnostic value of hub genes, and the results showed that all three hub genes had excellent diagnostic efficacy.
CD36, commonly regarded as a scavenger receptor, is located in a wide range of renal cells (24), which is consistent with our single nucleus RNA sequencing analysis. Lipid metabolism, immunological inflammation, and renal fibrosis are its key areas of involvement. According to research, a possible therapeutic target for the prevention of renal fibrosis may be CD36 (25). Little research has been performed on the function of CD36 in immune-related oxidative stress, even though CD36 is broadly investigated in the pathogenesis of DN. In this research, we discovered that CD36 expression was elevated in the renal tissues of individuals with diabetic nephropathy and had a diagnostic accuracy value (AUC > 0.80). Cohort studies revealed that sCD36 levels in plasma and urine were raised in DN patients and correlated with DN severity, indicating that sCD36 may be a diagnostic marker for DN progression (26). Furthermore, the mechanism of CD36 engagement in DN is mostly attributed to oxidative stress triggered by lipid deposition (27), which is consistent with the results of our functional enrichment analysis. Hou Y. et al. revealed that CD36 contributed to DN progression by triggering epithelial-mesenchymal transition (EMT) through the induction of reactive oxygen species (ROS) production (28). Additionally, the outcomes of animal studies suggested that inhibiting CD36 might shield diabetic mice from kidney harm and oxidative stress (29).
ITGB2, a member of the integrin family, is mostly expressed in immune cells and is connected to a variety of metabolic pathways as well as immune functions such as leukocyte extravasation (30). Similarly, ITGB2 is crucial for the growth of tumors. For instance, it is primarily in charge of the invasion and metastasis of tumor cells in gliomas, which is closely connected to the immune microenvironment (31). The engagement of ITGB2 in DN development, however, has received relatively little research. In our research, we observed that ITGB2 with upregulated expression also has excellent diagnostic efficacy (AUC > 0.90). Based on the most recent experimental research, ITGB2 is essential for the progression of diabetes, and the ITGB2 gene deficiency may hopefully prevent the disease (32). This paves the way for ITGB2 to become a diagnostic marker for DN. Furthermore, there is a growing consensus that EMT is essential for the development of DN (33, 34). And ITGB2 is also closely related to the regulation of EMT (35, 36).
SLC1A3, an aspartate and glutamate transporter, is abundantly expressed in cerebral and tumor tissues and is associated with immune inflammation as well as proliferation and metastasis of tumors (37). It has also been proposed that SLC1A3 is involved in the amino acid-related metabolism of adipocytes (38). Furthermore, insulin has been demonstrated to regulate the expression and activity of SLC1A3 (39). And SLC1A3 is mainly involved in diabetic retinopathy in diabetic complications (40). In our results, SLC1A3 is expressed more strongly in DN patients than in healthy controls.
According to the results of our investigation, CD36, which was upregulated in renal tissue, was significantly linked to reduced GFR and increased serum creatinine, implying that CD36 expression may be associated with reduced renal function in patients with DN. ITGB also has a similar presentation.
As we all know, the two key mechanisms in the progression of DN are oxidative stress and immunity, and they are inexorably intertwined. Hyperglycemia is a central factor in kidney damage in DN patients (41). On one hand, hyperglycemia induces oxidative stress by activating the renin-angiotensin-aldosterone system (RAAS), which leads to renal injury (42). On the other hand, the stress caused by persistent hyperglycemia can lead to a high production of inflammatory molecules and the accumulation of immune complexes, a process that is closely related to immune cells such as mast cells (43). The results of immune infiltration analysis also suggest that mast cells, NK cells and T cells are closely associated with the development of DN. In addition, the results of our functional enrichment analysis also suggest that DEIOSGs are mainly enriched in immune and oxidative stress-related pathways. Therefore, therapeutic strategies targeting immune and oxidative stress are particularly important and promising.
However, this study has several limitations. The evidence is based on publicly available data, and although we performed expression validation with another dataset, further experiments are needed to validate these 3 diagnostic markers before they can be applied to the clinic.
In conclusion, by combining three machine learning algorithms with WGCNA analysis, this research identified three hub genes that could serve as novel targets for the diagnosis and therapy of DN.
Data availability statement
The datasets presented in this study can be found in online repositories. The names of the repository/repositories and accession number(s) can be found in the article/Supplementary Material.
Author contributions
The manuscript was conceived by MX. PH and MX were responsible for software operation and analysis. PH, HZ, and YP performed the data compilation. Data analysis and interpretation were performed by HZ and SW. MX completed the manuscript. XL and LL were responsible for manuscript review and revision. The article was submitted with the authorization of all authors who also contributed to the article.
Funding
The research was supported by the National Natural Science Funds of China (82171594) and the Zhao Yi-Cheng Medical Science Foundation (ZYYFY2018031).
Acknowledgments
Thanks to GEO database and K.I.T. database contributors for sharing the data.
Conflict of interest
The authors declare that the research was conducted in the absence of any commercial or financial relationships that could be construed as a potential conflict of interest.
Publisher’s note
All claims expressed in this article are solely those of the authors and do not necessarily represent those of their affiliated organizations, or those of the publisher, the editors and the reviewers. Any product that may be evaluated in this article, or claim that may be made by its manufacturer, is not guaranteed or endorsed by the publisher.
Supplementary material
The Supplementary Material for this article can be found online at: https://www.frontiersin.org/articles/10.3389/fimmu.2023.1084531/full#supplementary-material
References
1. Flyvbjerg A. The role of the complement system in diabetic nephropathy. Nat Rev Nephrol (2017) 13:311–8. doi: 10.1038/nrneph.2017.31
2. Umanath K, Lewis JB. Update on diabetic nephropathy: Core curriculum 2018. Am J Kidney Dis: Off J Natl Kidney Foundation (2018) 71:884–95. doi: 10.1053/j.ajkd.2017.10.026
3. Thomas B. The global burden of diabetic kidney disease: Time trends and gender gaps. Curr Diabetes Rep (2019) 19:18. doi: 10.1007/s11892-019-1133-6
4. Tuttle KR, Agarwal R, Alpers CE, Bakris GL, Brosius FC, Kolkhof P, et al. Molecular mechanisms and therapeutic targets for diabetic kidney disease. Kidney Int (2022) 102:248–60. doi: 10.1016/j.kint.2022.05.012
5. Alicic R, Nicholas SB. Diabetic kidney disease back in focus: Management field guide for health care professionals in the 21st century. Mayo Clin Proc (2022) 97:1904–19. doi: 10.1016/j.mayocp.2022.05.003
6. Dai X, Liao R, Liu C, Liu S, Huang H, Liu J, et al. Epigenetic regulation of TXNIP-mediated oxidative stress and NLRP3 inflammasome activation contributes to SAHH inhibition-aggravated diabetic nephropathy. Redox Biol (2021) 45:102033. doi: 10.1016/j.redox.2021.102033
7. Sui S, An X, Xu C, Li Z, Hua Y, Huang G, et al. An immune cell infiltration-based immune score model predicts prognosis and chemotherapy effects in breast cancer. Theranostics (2020) 10:11938–49. doi: 10.7150/thno.49451
8. Zhang B, Horvath S. A general framework for weighted gene co-expression network analysis. Stat Appl Genet Mol Biol (2005) 4. doi: 10.2202/1544-6115.1128
9. Zhang J, Yu R, Guo X, Zou Y, Chen S, Zhou K, et al. Identification of TYR, TYRP1, DCT and LARP7 as related biomarkers and immune infiltration characteristics of vitiligo via comprehensive strategies. Bioengineered (2021) 12:2214–27. doi: 10.1080/21655979.2021.1933743
10. Lin X, Li C, Zhang Y, Su B, Fan M, Wei H. Selecting feature subsets based on SVM-RFE and the overlapping ratio with applications in bioinformatics. Mol (Basel Switzerland) (2017) 23:52. doi: 10.3390/molecules23010052
11. Alakwaa FM, Chaudhary K, Garmire LX. Deep learning accurately predicts estrogen receptor status in breast cancer metabolomics data. J Proteome Res (2018) 17:337–47. doi: 10.1021/acs.jproteome.7b00595
12. Qu LH, Luo WJ, Yan ZG, Liu WP. FAM171B as a novel biomarker mediates tissue immune microenvironment in pulmonary arterial hypertension. Mediators Inflammation (2022) 2022:1878766. doi: 10.1155/2022/1878766
13. Chen T, Liu YX, Huang L. ImageGP: An easy-to-use data visualization web server for scientific researchers. iMeta (2022) 1:e5. doi: 10.1002/imt2.5
14. Lay AC, Hale LJ, Stowell-Connolly H, Pope RJ, Nair V, Ju W, et al. IGFBP-1 expression is reduced in human type 2 diabetic glomeruli and modulates β1-integrin/FAK signalling in human podocytes. Diabetologia (2021) 64:1690–702. doi: 10.1007/s00125-021-05427-1
15. Fornes O, Castro-Mondragon JA, Khan A, van der Lee R, Zhang X, Richmond PA, et al. JASPAR 2020: update of the open-access database of transcription factor binding profiles. Nucleic Acids Res (2020) 48:D87–d92. doi: 10.1093/nar/gkz1001
16. Coutinho de Almeida R, Ramos YFM, Mahfouz A, den Hollander W, Lakenberg N, Houtman E, et al. RNA Sequencing data integration reveals an miRNA interactome of osteoarthritis cartilage. Ann Rheumatic Dis (2019) 78:270–7. doi: 10.1136/annrheumdis-2018-213882
17. Zhou G, Soufan O, Ewald J, Hancock REW, Basu N, Xia J. NetworkAnalyst 3.0: A visual analytics platform for comprehensive gene expression profiling and meta-analysis. Nucleic Acids Res (2019) 47:W234–w241. doi: 10.1093/nar/gkz240
18. Xie M, Li Z, Li X, Ai L, Jin M, Jia N, et al. Identifying crucial biomarkers in peripheral blood of schizophrenia and screening therapeutic agents by comprehensive bioinformatics analysis. J Psychiatr Res (2022) 152:86–96. doi: 10.1016/j.jpsychires.2022.06.007
19. Qing J, Hu X, Li C, Song W, Tirichen H, Yaigoub H, et al. Fucose as a potential therapeutic molecule against the immune-mediated inflammation in IgA nepharopathy: An unrevealed link. Front Immunol (2022) 13:929138. doi: 10.3389/fimmu.2022.929138
20. Wilson PC, Wu H, Kirita Y, Uchimura K, Ledru N, Rennke HG, et al. The single-cell transcriptomic landscape of early human diabetic nephropathy. Proc Natl Acad Sci United States America (2019) 116:19619–25. doi: 10.1073/pnas.1908706116
21. Alicic RZ, Rooney MT, Tuttle KR. Diabetic kidney disease: Challenges, progress, and possibilities. Clin J Am Soc Nephrol: CJASN (2017) 12:2032–45. doi: 10.2215/CJN.11491116
22. Alicic RZ, Cox EJ, Neumiller JJ, Tuttle KR. Incretin drugs in diabetic kidney disease: biological mechanisms and clinical evidence. Nat Rev Nephrol (2021) 17:227–44. doi: 10.1038/s41581-020-00367-2
23. Tang SCW, Yiu WH. Innate immunity in diabetic kidney disease. Nat Rev Nephrol (2020) 16:206–22. doi: 10.1038/s41581-019-0234-4
24. Karunakaran U, Elumalai S, Moon JS, Won KC. CD36 signal transduction in metabolic diseases: Novel insights and therapeutic targeting. Cells (2021) 10(7):1833. doi: 10.3390/cells10071833
25. Yang X, Okamura DM, Lu X, Chen Y, Moorhead J, Varghese Z, et al. CD36 in chronic kidney disease: Novel insights and therapeutic opportunities. Nat Rev Nephrol (2017) 13:769–81. doi: 10.1038/nrneph.2017.126
26. Shiju TM, Mohan V, Balasubramanyam M, Viswanathan P. Soluble CD36 in plasma and urine: A plausible prognostic marker for diabetic nephropathy. J Diabetes Complications (2015) 29:400–6. doi: 10.1016/j.jdiacomp.2014.12.012
27. Puchałowicz K, Rać ME. The multifunctionality of CD36 in diabetes mellitus and its complications-update in pathogenesis, treatment and monitoring. Cells (2020) 9(8):1877. doi: 10.3390/cells9081877
28. Hou Y, Wu M, Wei J, Ren Y, Du C, Wu H, et al. CD36 is involved in high glucose-induced epithelial to mesenchymal transition in renal tubular epithelial cells. Biochem Biophys Res Commun (2015) 468:281–6. doi: 10.1016/j.bbrc.2015.10.112
29. Hou Y, Wang Q, Han B, Chen Y, Qiao X, Wang L. CD36 promotes NLRP3 inflammasome activation via the mtROS pathway in renal tubular epithelial cells of diabetic kidneys. Cell Death Dis (2021) 12:523. doi: 10.1038/s41419-021-03813-6
30. Zhang X, Dong Y, Zhao M, Ding L, Yang X, Jing Y, et al. ITGB2-mediated metabolic switch in CAFs promotes OSCC proliferation by oxidation of NADH in mitochondrial oxidative phosphorylation system. Theranostics (2020) 10:12044–59. doi: 10.7150/thno.47901
31. Xu H, Zhang A, Han X, Li Y, Zhang Z, Song L, et al. ITGB2 as a prognostic indicator and a predictive marker for immunotherapy in gliomas. Cancer Immunol Immunother: CII (2022) 71:645–60. doi: 10.1007/s00262-021-03022-2
32. Glawe JD, Patrick DR, Huang M, Sharp CD, Barlow SC, Kevil CG. Genetic deficiency of Itgb2 or ItgaL prevents autoimmune diabetes through distinctly different mechanisms in NOD/LtJ mice. Diabetes (2009) 58:1292–301. doi: 10.2337/db08-0804
33. Du L, Qian X, Li Y, Li XZ, He LL, Xu L, et al. Sirt1 inhibits renal tubular cell epithelial-mesenchymal transition through YY1 deacetylation in diabetic nephropathy. Acta Pharmacol Sin (2021) 42:242–51. doi: 10.1038/s41401-020-0450-2
34. Tang G, Li S, Zhang C, Chen H, Wang N, Feng Y. Clinical efficacies, underlying mechanisms and molecular targets of Chinese medicines for diabetic nephropathy treatment and management. Acta Pharm Sinica B (2021) 11:2749–67. doi: 10.1016/j.apsb.2020.12.020
35. Zu L, He J, Zhou N, Zeng J, Zhu Y, Tang Q, et al. The profile and clinical significance of ITGB2 expression in non-Small-Cell lung cancer. J Clin Med (2022) 11(21):6421. doi: 10.3390/jcm11216421
36. Li J, Zhang Z, Feng X, Shen Z, Sun J, Zhang X, et al. Stanniocalcin-2 promotes cell EMT and glycolysis via activating ITGB2/FAK/SOX6 signaling pathway in nasopharyngeal carcinoma. Cell Biol Toxicol (2022) 38:259–72. doi: 10.1007/s10565-021-09600-5
37. Sun J, Nagel R, Zaal EA, Ugalde AP, Han R, Proost N, et al. SLC1A3 contributes to l-asparaginase resistance in solid tumors. EMBO J (2019) 38:e102147. doi: 10.15252/embj.2019102147
38. Krycer JR, Fazakerley DJ, Cater RJ, Naghiloo S., Burchfield JG, et al. The amino acid transporter, SLC1A3, is plasma membrane-localised in adipocytes and its activity is insensitive to insulin. FEBS Lett (2017) 591:322–30. doi: 10.1002/1873-3468.12549
39. Poblete-Naredo I, Angulo C, Hernández-Kelly L, López-Bayghen E, Aguilera J, Ortega A. Insulin-dependent regulation of GLAST/EAAT1 in bergmann glial cells. Neurosci Lett (2009) 451:134–8. doi: 10.1016/j.neulet.2008.12.049
40. Sheng L, Luo Q, Chen L. Amino acid solute carrier transporters in inflammation and autoimmunity. Drug Metab Disposition: Biol Fate Chem (2022) 50(9):1228-37. doi: 10.1124/dmd.121.000705
41. DeFronzo RA, Reeves WB, Awad AS. Pathophysiology of diabetic kidney disease: impact of SGLT2 inhibitors. Nat Rev Nephrol (2021) 17:319–34. doi: 10.1038/s41581-021-00393-8
42. Sagoo MK, Gnudi L. Diabetic nephropathy: Is there a role for oxidative stress? Free Radical Biol Med (2018) 116:50–63. doi: 10.1016/j.freeradbiomed.2017.12.040
Keywords: diabetic nephropathy, bioinformatic analysis, machine learning, WGCNA, biomarker
Citation: Xu M, Zhou H, Hu P, Pan Y, Wang S, Liu L and Liu X (2023) Identification and validation of immune and oxidative stress-related diagnostic markers for diabetic nephropathy by WGCNA and machine learning. Front. Immunol. 14:1084531. doi: 10.3389/fimmu.2023.1084531
Received: 30 October 2022; Accepted: 13 February 2023;
Published: 22 February 2023.
Edited by:
Jialin Gao, First Affiliated Hospital of Wannan Medical College, ChinaReviewed by:
Xudong Zhang, Sun Yat-sen University, ChinaParimala Narne, University of Hyderabad, India
Copyright © 2023 Xu, Zhou, Hu, Pan, Wang, Liu and Liu. This is an open-access article distributed under the terms of the Creative Commons Attribution License (CC BY). The use, distribution or reproduction in other forums is permitted, provided the original author(s) and the copyright owner(s) are credited and that the original publication in this journal is cited, in accordance with accepted academic practice. No use, distribution or reproduction is permitted which does not comply with these terms.
*Correspondence: Xiaoqiang Liu, eGlhb3FpYW5nbGl1MUAxNjMuY29t; Li Liu, MTg2MjIyMDgzNzNAMTYzLmNvbQ==
†These authors have contributed equally to this work