 Le Zhang1,2†
 Jiayidaer Badai1†
 Guan Wang1,2Xufang Ru3,4
 Wenkai Song1
 Yujie You1Jiaojiao He1
 Suna Huang4
 Hua Feng4
 Runsheng Chen1,5,6*‡
 Yi Zhao1,6,7*‡
 Yujie Chen3,4*‡
- 1College of Computer Science, Sichuan University, Chengdu, China
- 2Innovation Center of Nursing Research, West China Hospital, Sichuan University, Chengdu, China
- 3Chinese Academy of Sciences (CAS) Key Laboratory of Separation Science for Analytical Chemistry, Dalian Institute of Chemical Physics, Chinese Academy of Sciences, Dalian, China
- 4Department of Neurosurgery and State Key Laboratory of Trauma, Burn and Combined Injury, Southwest Hospital, Army Medical University, Chongqing, China
- 5Center for Big Data Research in Health, Institute of Biophysics, Chinese Academy of Sciences, Beijing, China
- 6West China Biomedical Big Data Center, West China Hospital, Sichuan University, Chengdu, China
- 7Research Center for Ubiquitous Computing Systems, Institute of Computing Technology, Chinese Academy of Sciences, Beijing, China
Introduction: Central nervous system (CNS) diseases, such as neurodegenerative disorders and brain diseases caused by acute injuries, are important, yet challenging to study due to disease lesion locations and other complexities.
Methods: Utilizing the powerful method of spatial transcriptome analysis together with novel algorithms we developed for the study, we report here for the first time a 3D trajectory map of gene expression changes in the brain following acute neural injury using a mouse model of intraventricular hemorrhage (IVH). IVH is a common and representative complication after various acute brain injuries with severe mortality and mobility implications.
Results: Our data identified three main 3D global pseudospace-time trajectory bundles that represent the main neural circuits from the lateral ventricle to the hippocampus and primary cortex affected by experimental IVH stimulation. Further analysis indicated a rapid response in the primary cortex, as well as a direct and integrated effect on the hippocampus after IVH stimulation.
Discussion: These results are informative for understanding the pathophysiological changes, including the spatial and temporal patterns of gene expression changes, in IVH patients after acute brain injury, strategizing more effective clinical management regimens, and developing novel bioinformatics strategies for the study of other CNS diseases. The algorithm strategies used in this study are searchable via a web service (www.combio-lezhang.online/3dstivh/home).
1 Introduction
Intraventricular hemorrhage (IVH) refers to bleeding inside the ventricles of the brain or a hematoma dislodging from the periventricular brain parenchyma, which is usually secondary to traumatic brain injury, subarachnoid hemorrhage, or spontaneous intracerebral hemorrhage. IVH is one of the common complications after various acute brain injuries (1–3) that causes severe mortality and mobility dysfunction and is a great economic and societal burden. To date, the gold standard for the treatment of IVH is hematoma removal and hydrocephalus prevention (4), which relieves the general pathophysiological effects and elevated intracranial pressure in the lateral walls of the ventricles (3) as well as reduces the obstructions and inflammatory responses from blood metabolic stimulations (5, 6). However, a recently completed large-scale randomized clinical trial (CLEAR III, Trial No. NCT00784134) employing alteplase to effectively clear intraventricular hematomas did not demonstrate adequate neurobehavioral benefits for IVH patients (7–9). With the development of neurosurgery and the improvement of neurocritical care, the direct IVH mortality rate has gradually decreased. However, we still need to understand the neurological dysfunction that occurs after IVH in order to alleviate it and produce better outcomes in these patients. Indeed, the pathophysiology of how these hematoma stimulations in the ventricles cause neurological dysfunction remains unknown.
For this reason, this study investigated the pathophysiological mechanism of secondary neurological dysfunction after IVH and the related intervention strategies by developing a bioinformatics analysis workflow based on spatial transcriptome sequencing (10, 11). First, by constructing 3D pseudospace-time trajectories (12, 13), we identified the cell subtypes (14) generated after IVH stimulation and their potentially similar cell types. We then explored and validated the important pathophysiological mechanisms for these cell subtypes by carrying out cell–cell communication strength (12, 13) and pathway analyses (15–19).
In summary, our study not only identified the brain regions affected by secondary neurological dysfunction after IVH stimulation from a 3D perspective but also allows for the further investigation of driving cell types and molecular pathways, which might benefit the construction of translational intervention strategies for secondary brain injuries after IVH at the molecular and cellular levels in the distant future (20–22). Finally, our study is available via a web service (www.combio-lezhang.online/3dstivh/home).
2 Materials and methods
2.1 Experimental setup
Five wild-type C57/BL6 male mice (weighing 25 ± 5 g, 8 weeks old, from the Experimental Animal Center of the Third Military Medical University, Chongqing, China) were used in this study. These mice were housed in a temperature-controlled room under specific-pathogen-free conditions and a standard 12-h light/dark cycle, with ad libitum access to food and water. All experiments were reported in compliance with the Animal Research: Reporting In Vivo Experiments (ARRIVE) guidelines. The experimental protocols were approved by the Laboratory Animal Welfare and Ethics Committee of the Third Military Medical University (AMUWEC2020762) and performed according to the Guide for the Care and Use of Laboratory Animals.
An IVH model was established according to previously described methods with modified coordinates. Briefly, mice in each group were deeply anesthetized by an intraperitoneal injection of 2 mg of ketamine and 0.4 mg of xylazine in 0.9% saline. A feedback-controlled heating pad was used to maintain body temperature at 37.0°C. A small cranial burr hole was drilled, and a 32-gauge needle was inserted stereotaxically into the right lateral ventricle (coordinates: 1.0 mm lateral, 0.24 mm posterior, and 2.5 mm ventral to the bregma) to establish the IVH model under stereotactic guidance. Approximately 25 μl of autologous blood was then injected at a rate of 5 μl/min using a microinfusion pump (Harvard Apparatus, Holliston, MA, USA). The burr hole was sealed with bone wax, and the skin incision was closed with sutures after the needle was removed. Sham-operated mice underwent the same surgery without blood injection. The brains of the mice were harvested at different time points after IVH stimulation, after they were deeply anesthetized for further study.
2.2 Visium spatial transcriptome sequencing
We collected wild-type C57/BL6 mouse brains, which were classified into the no-surgery group (control), the needle-puncture group without blood injection (sham), and the needle-puncture group with blood injection on the first, third, and seventh days. These brains were then frozen on dry ice in an optimal cutting temperature (OCT) compound.
Frozen brains were then sectioned coronally at 10 μm on a cryostat and mounted on 10X Genomics Visium spatial transcriptome slides. The tissue locations of the library patches started from the emergence of the lateral ventricle, with 20 μm intervals and a 10-μm margin of error (SM Table 1).
For morphological analysis and spatial alignment of sequencing data, sections were fixed in methanol at −20°C for 30 min before hematoxylin and eosin (H&E) staining. Additionally, all fractions were measured using a bioanalyzer (Agilent 2100) meeting the RNA integrity number RIN>=7.
After brightfield imaging, we permeabilized 19 brain sections, the permeabilization time of which are listed in SM Table 1. After tissue permeabilization, we isolated poly-A mRNA at each point in the capture region and added spatial barcodes and unique molecular identities into reads for library construction.
A DNF-915 kit and our library detection instrument were employed for quantification by qPCR. After the library was quantified, we performed PE150 paired-end sequencing using the Illumina NovaSeq 6000 S4 sequencing platform with 50,000–100,000 reads per locus (spot).
Finally, genomes and images were aligned to the mouse reference genome mm10-3.0.0 by SpaceRanger (v1.1.0) software. The data were analyzed and normalized by using Seurat (v3.1.2) software and the transform package, respectively.
2.3 Cell subtype analysis
2.3.1 Cell subtype identification
We used the top 30 up/downregulated 3D transition genes for each 3D subtrajectory (SM Table 1 and SR3 Table 2) as input. We then employed our developed algorithm (SM Tables 4, 5) to identify a cell subtype that corresponded to the selected trajectory at different times (SM Tables 4, 5 and SR4 Table 1).
2.3.2 Similarity algorithm for cell subtypes
We used the marker gene sets of cell subtypes corresponding to the selected trajectory at different times (SM Tables 4, 5 and SR4 Table 2) as input. We then employed a similarity algorithm for cell subtypes (SM Tables 4, 6) to describe the similarity between cell subtypes at different times within the same trajectory (SM Tables 4, 6 and SR4 Table 3).
2.3.3 Search for similar cell types by CellMeSH
Here, we used marker genes of the cell subtypes as input. We then found the top 5 similar cell types for each cell subtype by using the CellMeSH database (23). Next, we performed a union operation for these top 5 similar cell types.
2.4 Cell−cell communication analysis
We use (SM Tables 4, 6 and SR5 Table 2) for each ligand−receptor pair (LRn) of cell subtypes and for all the brain regions as the input. We then employed the cell−cell communication strength (density) algorithm (SM Tables 7, 8) to obtain the discrete interaction intensity () after conversion of the continuous interaction intensity and the sum of the interaction intensity of N points in the corresponding position (ZTTotal) (SM Tables 7, 8 and SR5 Table 3) to obtain the average DensityLRn for each ligand–receptor pair of the cell subtypes (SM Tables 7, 8 and SR5 Table 4).
2.5 Signaling pathway analysis
We used mutual pathway sets for our identified cell subtypes ( P_ATrajectoryn, n = 1 … N ) (SM Tables 7, 8 and SR6 Table 2) and similar cell types ( P_BTrajectoryn, n = 1 … N ) (SM Tables 7, 8 and SR6 Table 3) as the input. We then employed the similarity algorithm for mutual pathway sets (SM Tables 9, 10) to obtain the mutual pathway set ( P_interTrajectoryn ) (SM Tables 9, 10 and SR6 Table 4) and the similarity () between P_ATrajectoryn and P_BTrajectoryn (n = 1 … N).
3 Results
3.1 Developing a spatial transcriptome sequencing-based bioinformatics analysis workflow to investigate IVH
To comprehensively dissect the complex gene expression changes following acute brain injury, we first developed a spatial transcriptomics sequencing-based bioinformatics analysis workflow to investigate IVH (Figure 1).
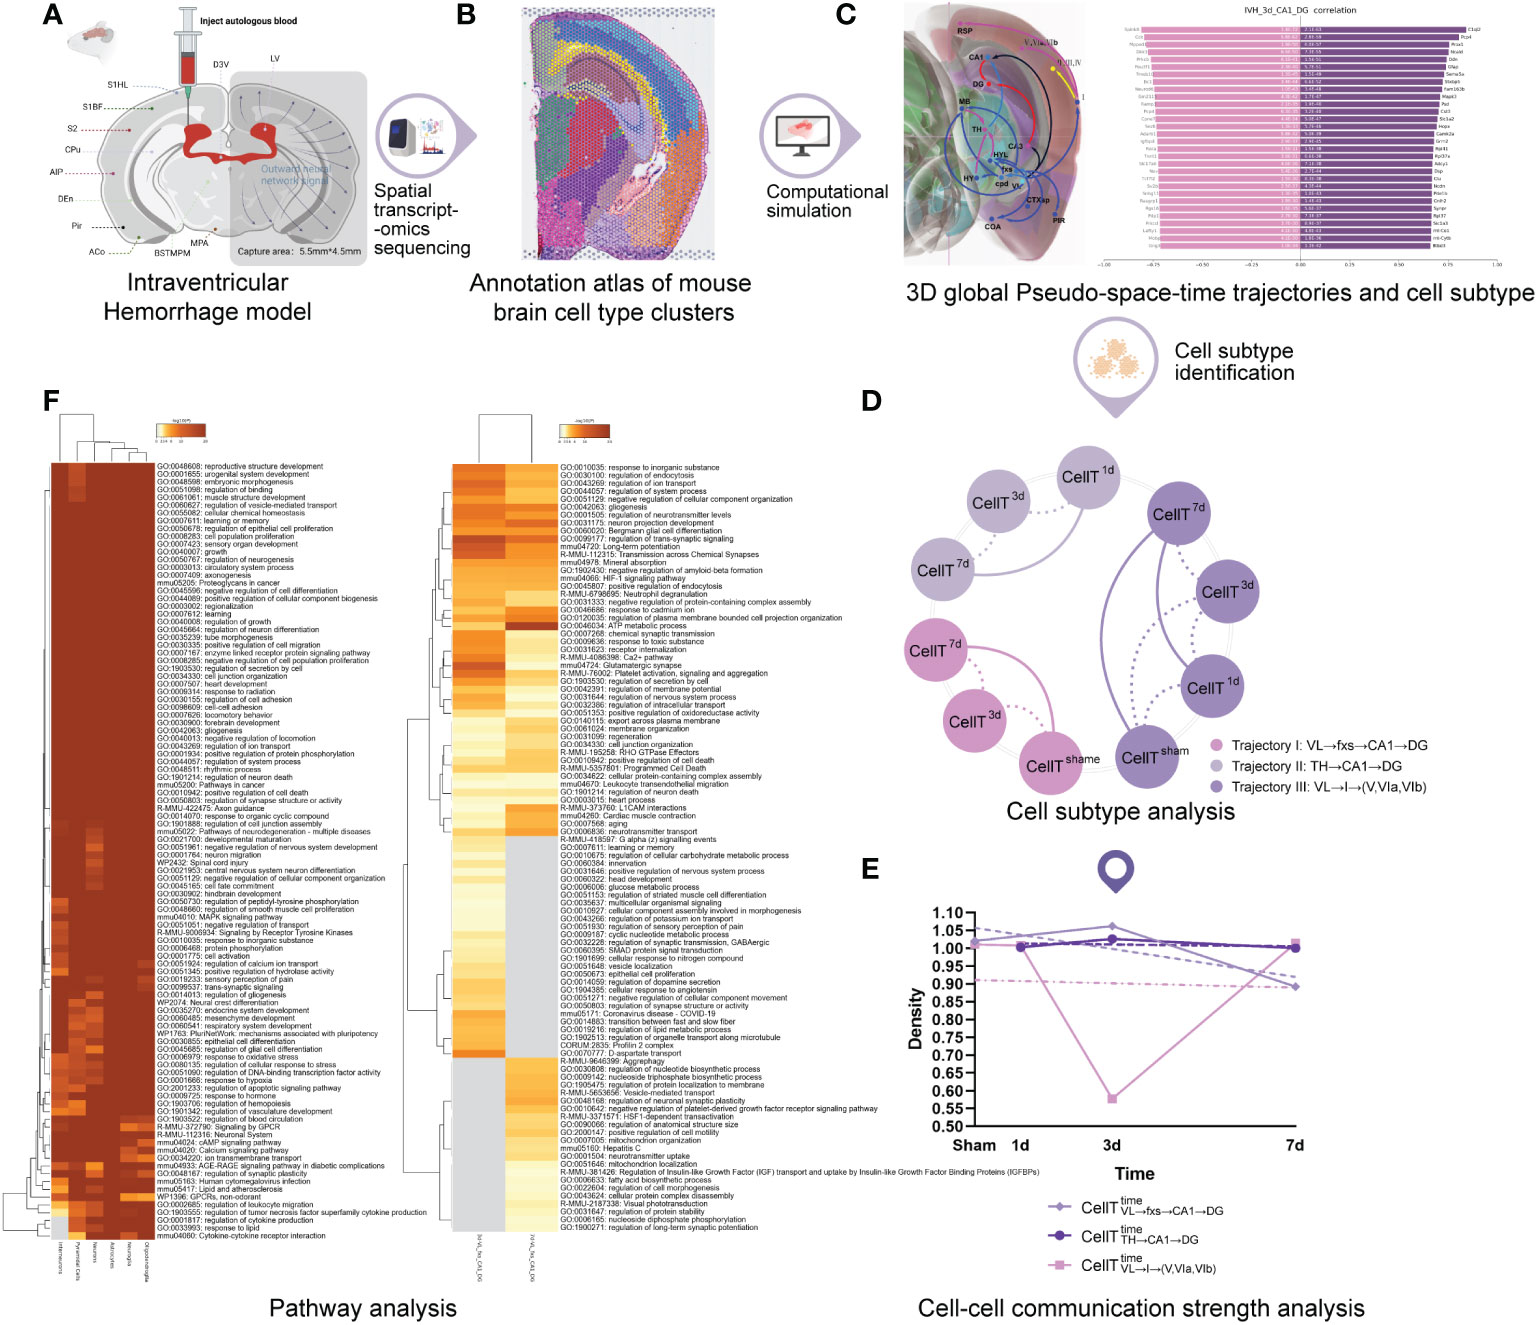
Figure 1 The workflow of the study. (A) Secondary intraventricular hemorrhage (IVH) experiment. (B) Annotation atlas of mouse brain cell-type clusters. (C) 3D global pseudospace-time trajectories and the transition gene sets. (D) Cell subtype analysis. (E) Cell−cell communication strength analysis. (F) Pathway analysis.
First, given the difficulty of conducting the analysis with human patient samples, we constructed an IVH model (Figure 1A) in mice by injecting autologous blood into the lateral ventricle (for technical details, please refer to Experimental procedures).
Spatial transcriptomics sequencing (10, 11) and the spatial and morphological expression (SME) clustering algorithm (12) were subsequently used to analyze frozen sections of IVH model mouse brain to obtain the annotation atlas of cell type clusters (Figure 1B; Visium spatial transcriptome sequencing of the Methods section) and to construct 3D global pseudospace-time trajectories (Figure 1C) and transition gene sets. More extensive cell subtype characterizations were performed on the three identified 3D global pseudospace-time trajectories at different times (Figure 1D). We further explored the molecular-level changes in these cell subtypes (Figure 1E) by using a newly developed cell–cell interaction intensity and density algorithm and evaluated the biological cha++racteristics of these cell subtypes using pathway analysis (Figure 1F).
3.2 3D global pseudospace-time trajectory reconstruction for mouse brain tissue after lateral ventricle hemorrhage
Initially, we used 19 original frozen sections from the brains of five mice with IVH stimulation as the input. After carrying out spatial transcriptome sequencing (10, 11), we performed H&E staining on the sections and examined spatial gene expression (Figure 2A (SR1 Figure 1; SR1 Table 1).
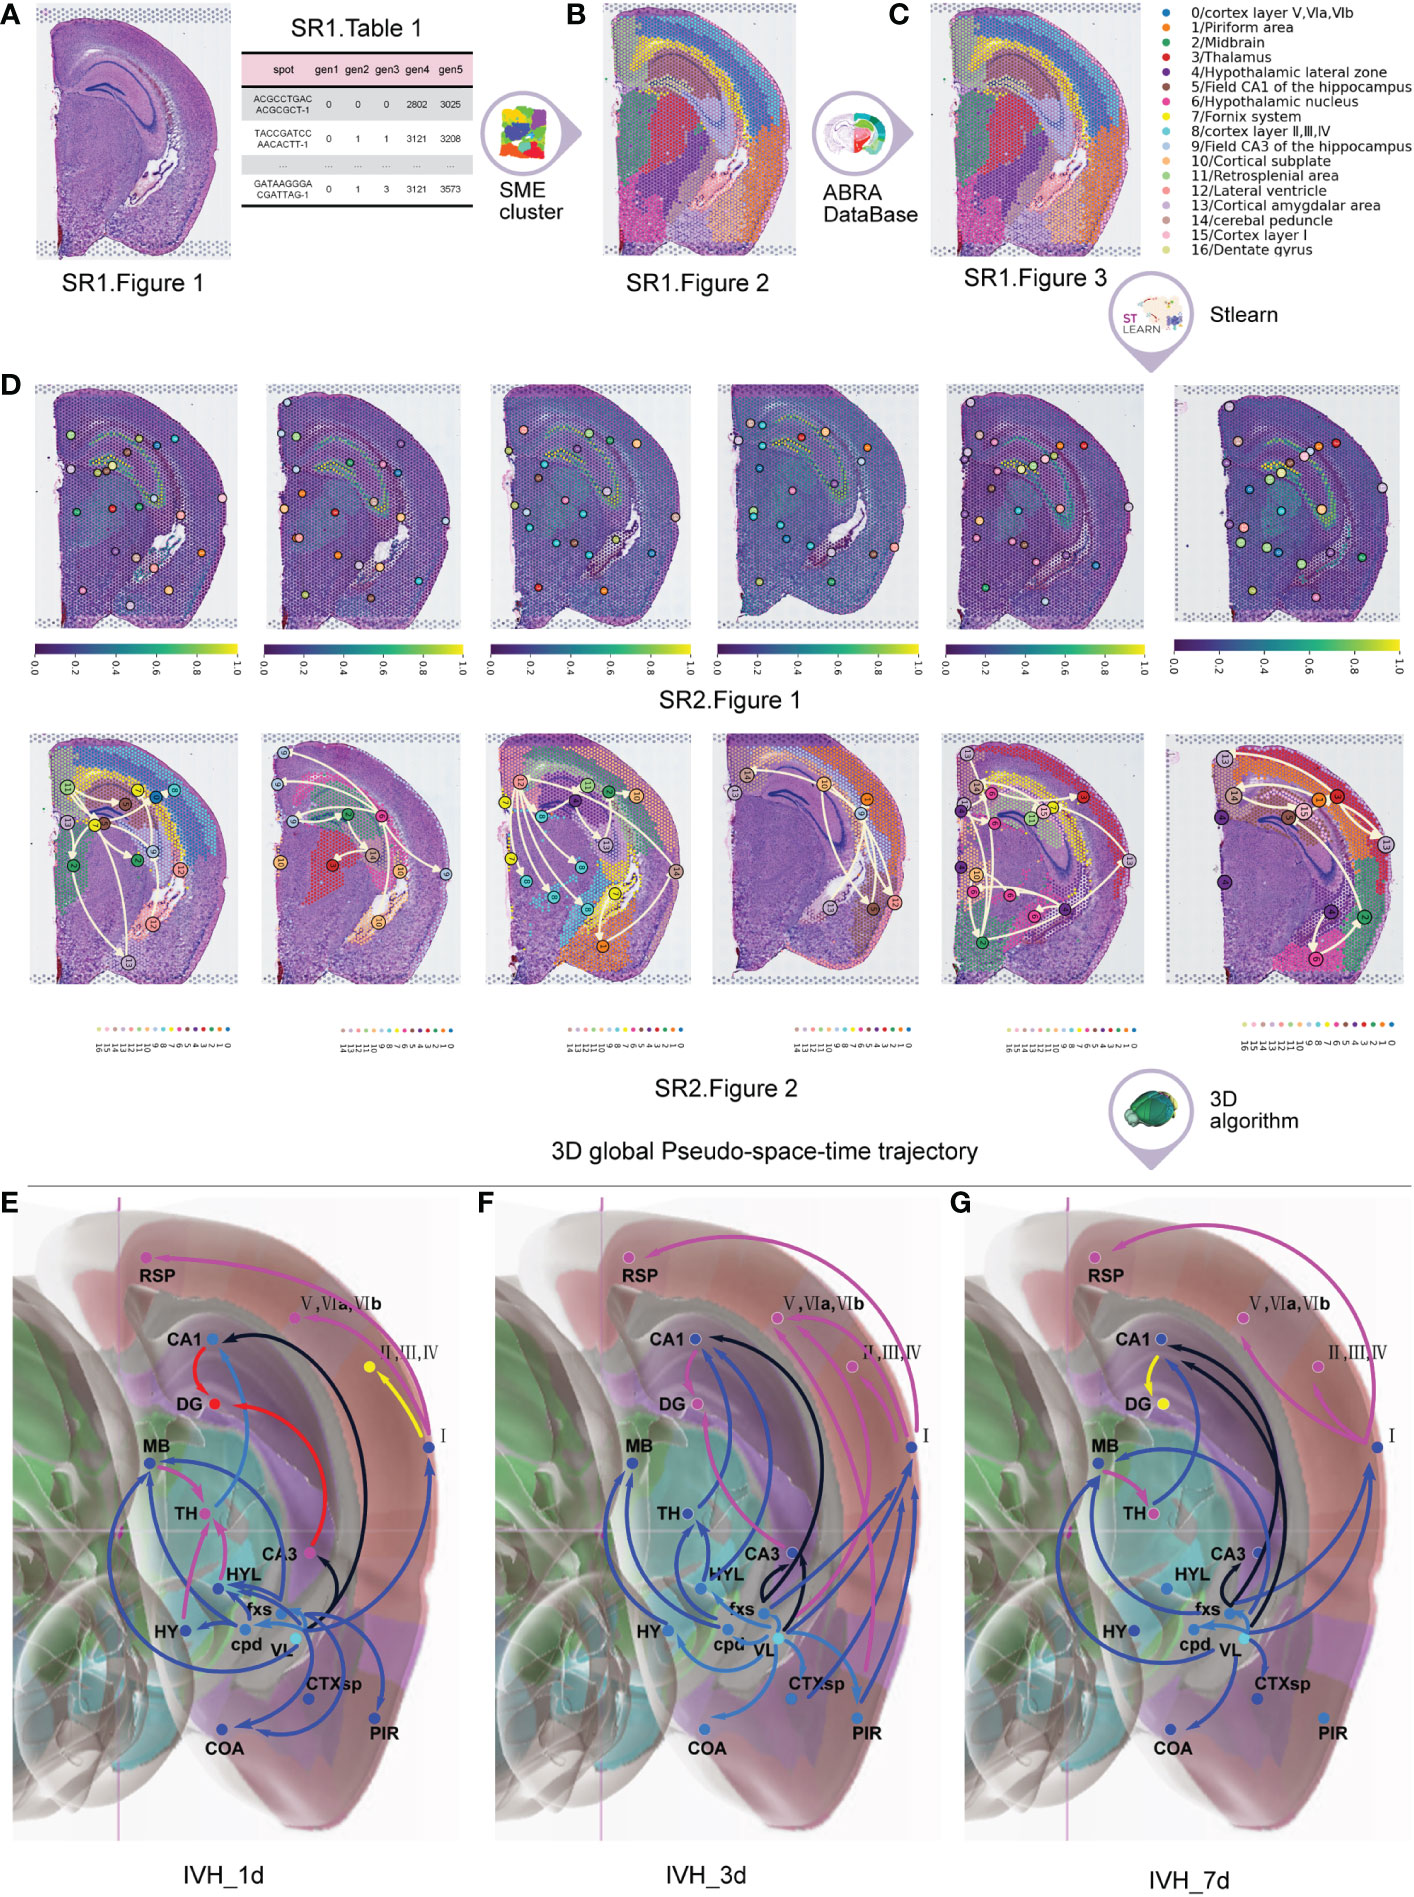
Figure 2 The process to obtain the 3D global pseudospace-time trajectory after IVH. (A) Hematoxylin and eosin (H&E)-stained sections and spatial gene expression. (B) Normalization and clustering of the cell types with similar gene expression. (C) Annotation atlas of cell-type clusters. (D) Planar diffusion pseudotime plots and planar global pseudospace-time trajectories. (E) The 3D global pseudospace-time trajectories on the first day after IVH stimulation. (F) The 3D global pseudospace-time trajectories on the third day after IVH stimulation. (G) The 3D global pseudospace-time trajectories on the seventh day after IVH stimulation.
Next, we employed the SME algorithm (12) to normalize and cluster the cell types with similar gene expressions (Figure 2B (SR1 Figure 2)) by inputting (SR1 Figure 1 and SR1 Table 1).
Following that, we obtained the annotation atlas of cell type clusters (24) (Figure 2C) in different brain regions by comparing the clustering results with the corresponding anatomical brain regions in the Allen Brain Reference Atlas map (25), which describes the whole transcriptional signal in the brains of mice after IVH stimulation (SR1 Figure 3).
We then employed the stLearn algorithm (12) to obtain the planar diffusion pseudotime plots and the planar global pseudospace-time trajectories (Figure 2D (SR2 Figures 1, 2)) by inputting (SR1 Figure 3).
Finally, we used a 3D global pseudospace-time trajectory reconstruction algorithm that we developed (SM Tables 2, 3) to obtain 3D global pseudospace-time trajectories (Figures 2E–G) by inputting Figures 2D (SR2 Figures 1, 2).
In addition to a disturbance in consciousness, it has been commonly observed that short-term motor dysfunction and long-term cognitive disorders occur after a single IVH. Table 1 classifies the 3D global pseudospace-time trajectories (Figures 2E–G) into three major trajectory bundles based on their pivotal effect after hematoma stimulation and their representative neural circuits that are involved in motor dysfunction and cognitive disorder.
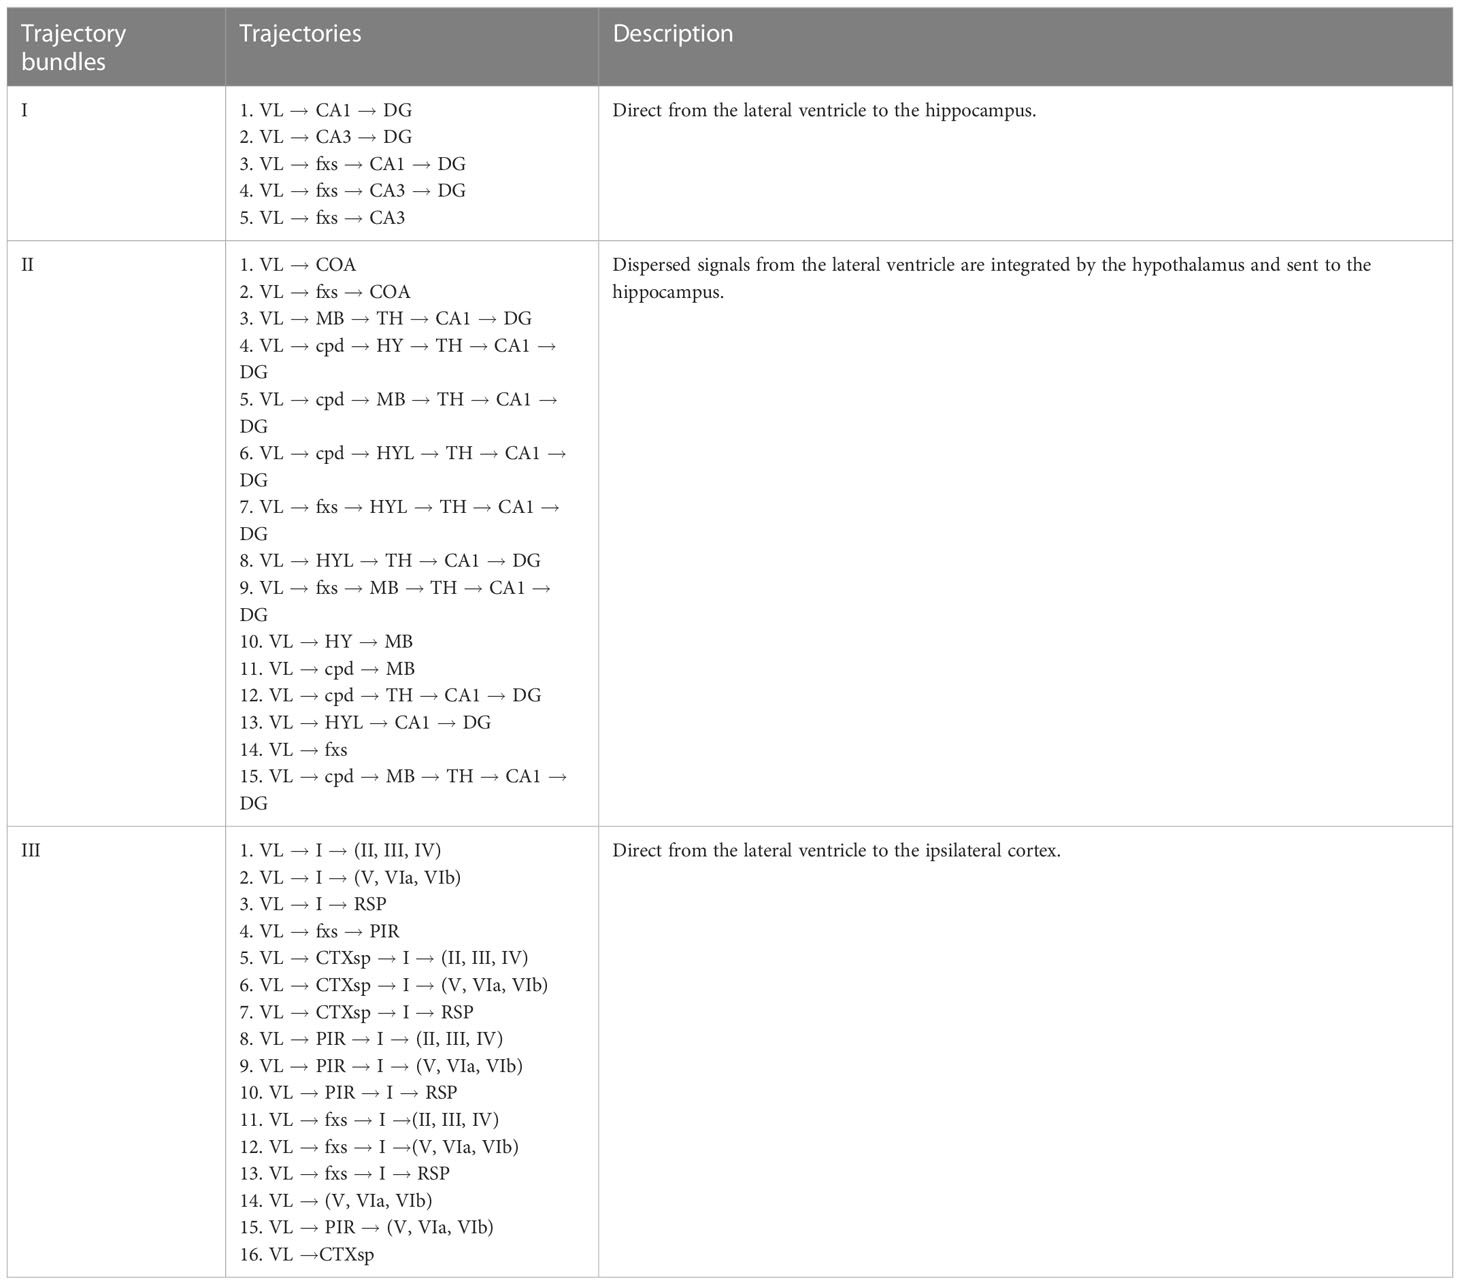
Table 1 Three major trajectory bundles from the lateral ventricle to the hippocampus and primary cortex after hematoma stimulation.
Here, trajectory groups I and II are described in Figures 2E–G (SR2 Figures S3.1A–C, 3.2B, C, 3.3B, C) for different times, which extend from the lateral ventricle to the hippocampus. Trajectory bundle III is described in Figures 2E–G (SR2 Figures 3.3A, 3.3A, D) for different times, which extend from the lateral ventricle to the primary cortex.
The following analysis of trajectory bundle III explores how hematoma stimulation in the lateral ventricle affects the cortex and causes motor dysfunction, while that of trajectory bundles I and II illustrates direct pathophysiological mechanisms of cognitive dysfunction after IVH, with unique neural circuits for hematoma stimulation in the lateral ventricle.
3.3 The trajectory-based transition gene set for 3D global pseudospace-time trajectories
Initially, we employed the Spearman’s correlation analysis to obtain the top 30 planar up/downregulated transition genes (Figure 3A (SR3 Table 1)) for each planar subtrajectory by inputting the planar global pseudospace-time trajectory (SR2 Figure 2) using stLearn software (12, 26–33).
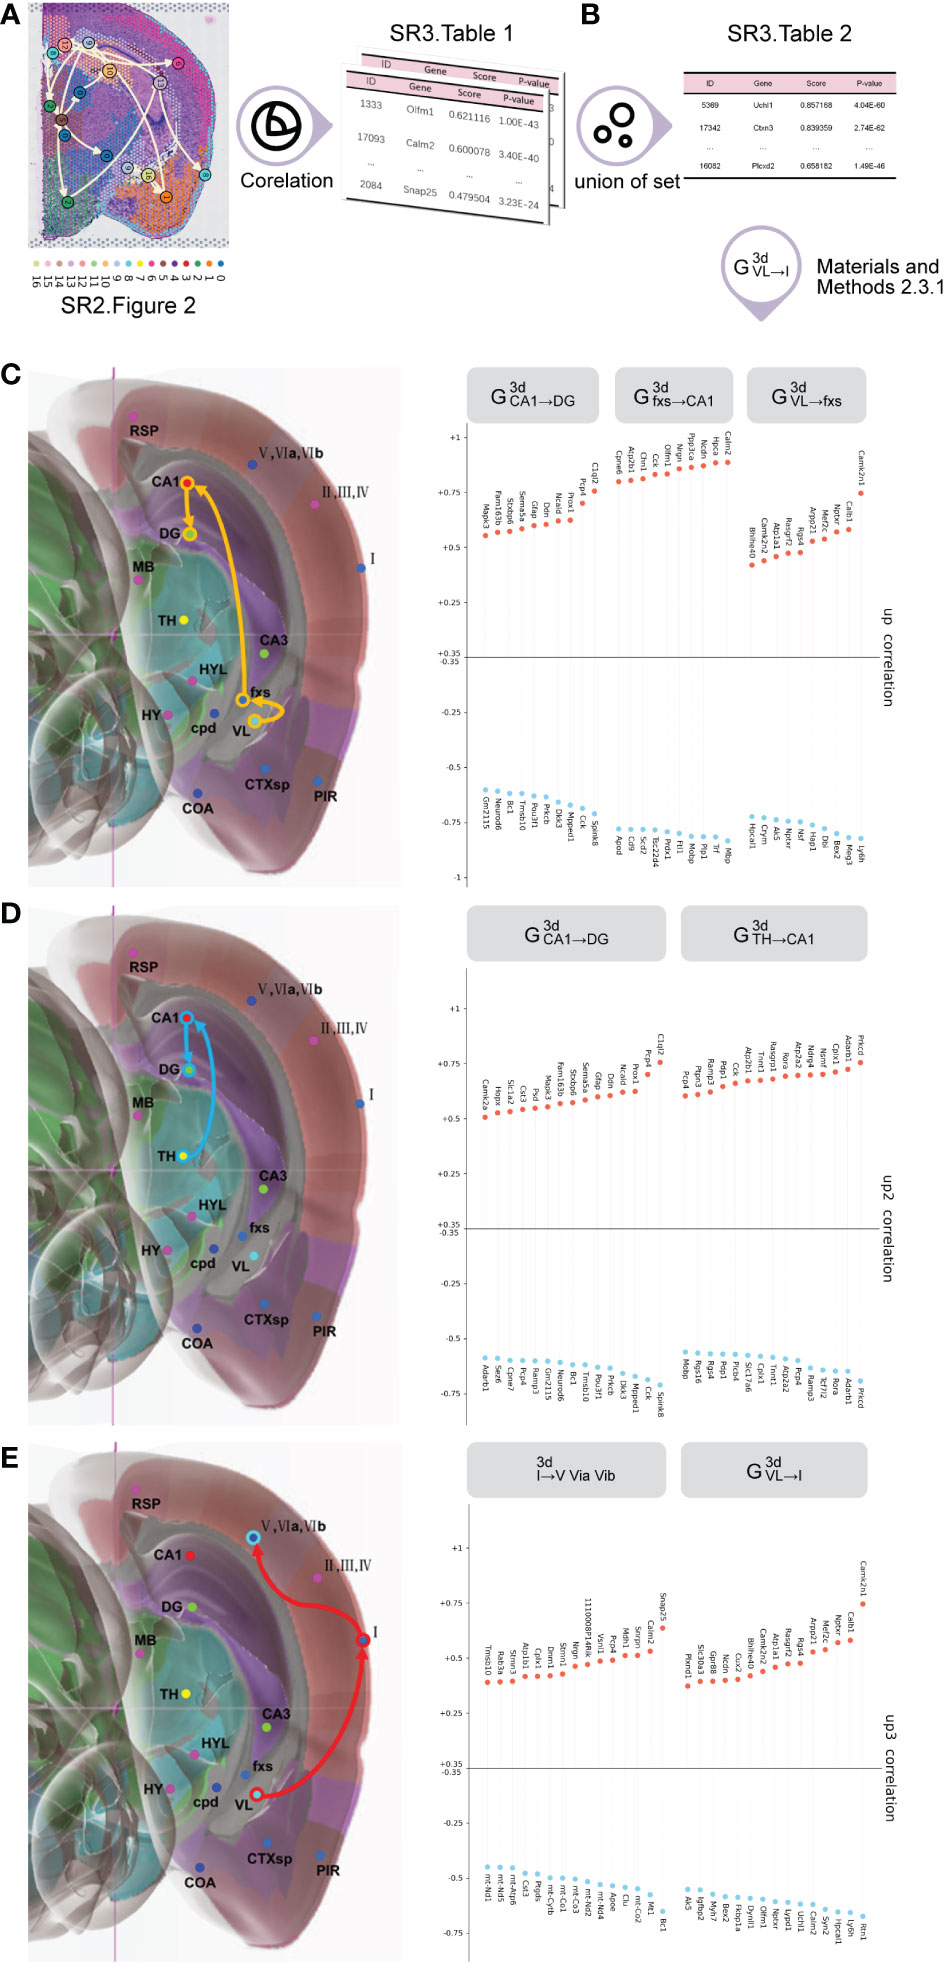
Figure 3 The process to obtain trajectory-based transition gene sets for 3D global pseudospace-time trajectories. (A) The top 30 planar up/downregulated transition genes for each planar subtrajectory. (B) The top 30 3D up/downregulated transition genes for each 3D subtrajectory. (C) The top 30 3D trajectory-based transition gene sets of VL→fxs→CA1→DG. (D) The top 30 3D trajectory-based transition gene sets of TH→CA1→DG. (E) The top 30 3D trajectory-based transition gene sets of VL→I→(V, VIa, VIb).
Among the three major global pseudospace-time trajectory bundles (Table 1), we chose frequently appearing trajectories from each trajectory bundle at different times for further analysis, which are VL→fxs→CA1→DG from trajectory bundle I, TH→CA1→DG from trajectory bundle II, and VL→I→(V, VIa, VIb) from trajectory bundle III.
VL→fxs→CA1→DG from trajectory bundle I could represent the mechanism of how hematoma stimulation in the lateral ventricle directly induces hippocampal activities and cognitive dysfunction.
TH→CA1→DG from trajectory bundle II might represent the transmission of multiple signals from the lateral ventricle and signal integration via the hypothalamus to the hippocampus, which might be a relatively long-term effect of hematoma stimulation.
The changes in VL→I→(V, VIa, VIb) from trajectory bundle III might reflect the acute and direct effect of hematoma stimulation on the primary cortex.
Next, we carried out a union operation for the top 30 planar up/downregulated transition genes for the same subtrajectory in different plane sections at the same time to obtain the top 30 3D up/downregulated transition genes (SR3 Table 2) for each 3D subtrajectory by inputting SR3 Table 1. When we performed a union operation for the top 30 planar up/downregulated transition genes, if different plane sections had the same gene with a different sign (up- or downregulated), we chose the gene whose absolute value was the greatest.
Here, Figures 3C–E are examples of the top 30 3D up/downregulated transition genes for each subtrajectory in VL→fxs→CA1→DG from trajectory bundle I, TH→CA1→DG from trajectory bundle II, and VL→I→(V, VIa, VIb) from trajectory bundle III.
3.4 Cell subtype analysis
As discussed in the Cell subtype analysis section, we chose VL→fxs→CA1→DG from trajectory bundle I, TH→CA1→DG from trajectory bundle II, and VL→I→(V, VIa,VIb) from trajectory bundle III for further analysis.
Initially, we employed our developed algorithm (SM Tables 4, 5) to identify cell subtypes in the selected trajectory at different times (Figure 4A (SR4 Table 1)) by inputting the top 30 up/downregulated 3D transition genes for each 3D subtrajectory (Figure 4A (SR3 Table 2)), the marker gene sets of which are listed in Figure 4B (SR4 Table 2). This process is detailed in the cell subtype identification section of the Methods.
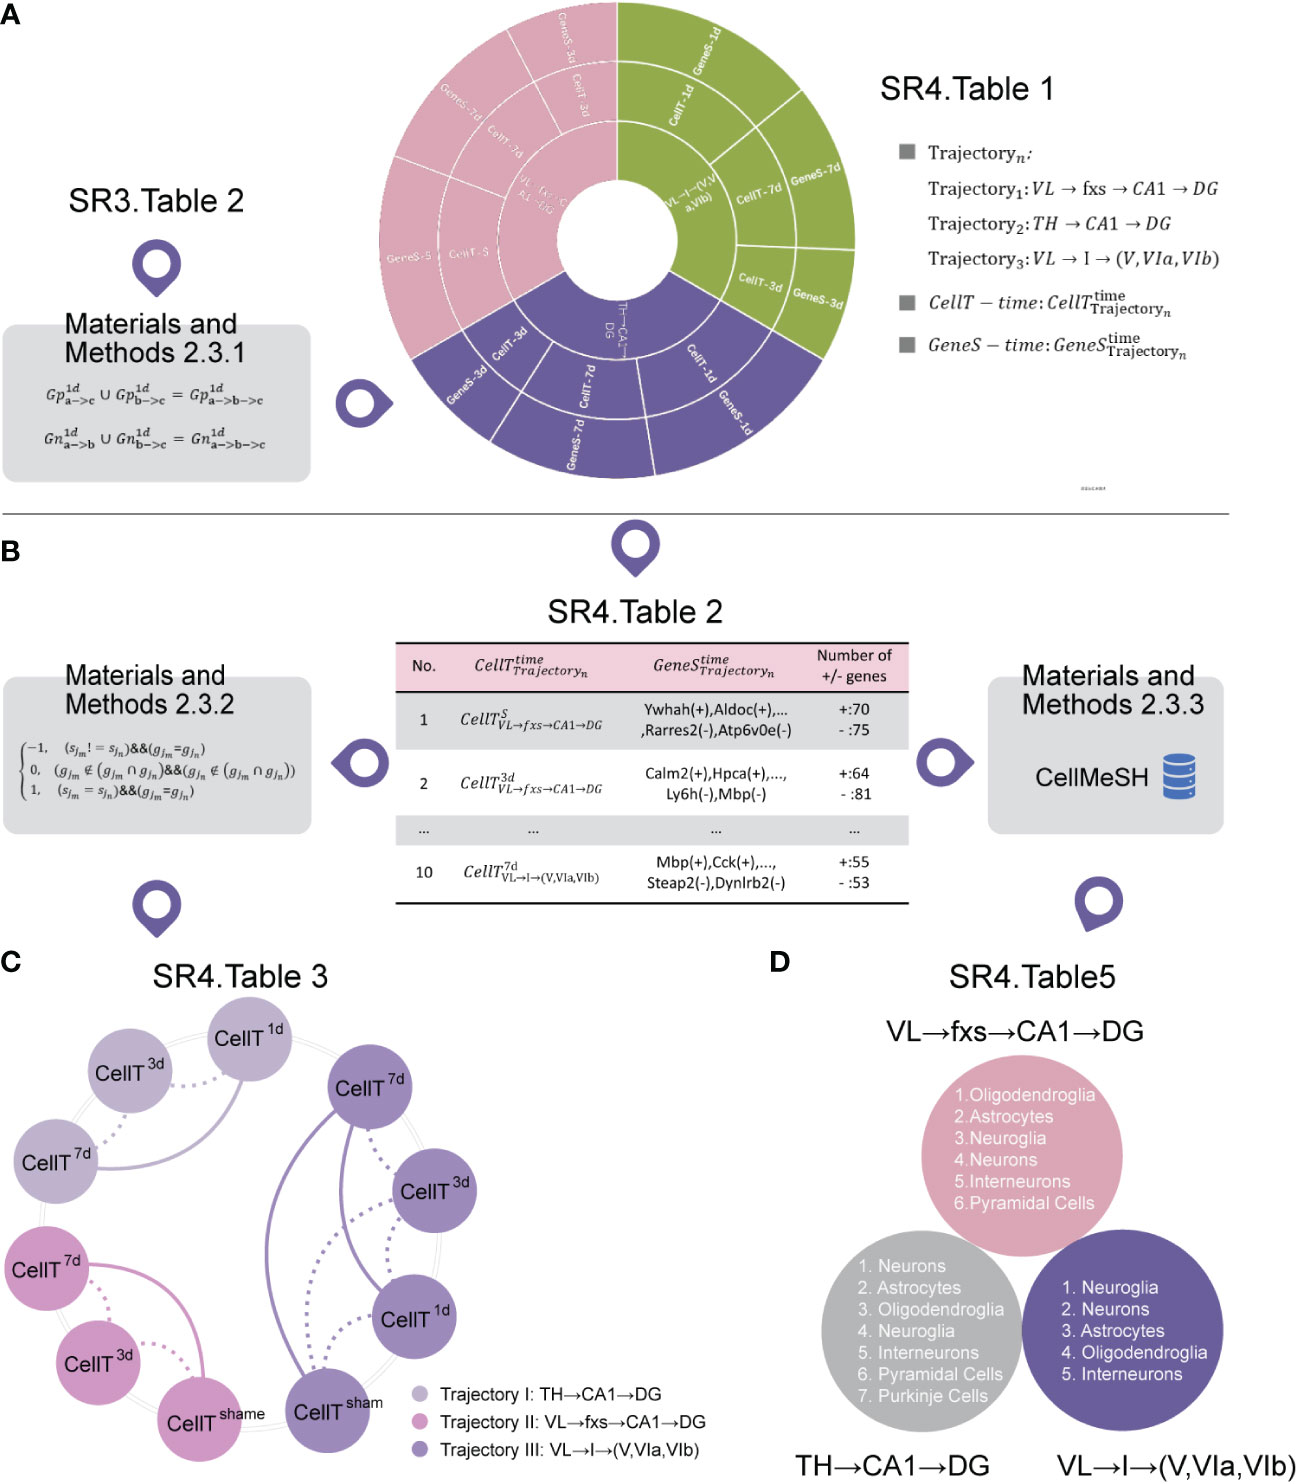
Figure 4 Cell subtype analysis. (A) The cell subtypes corresponding to the selected trajectory at different time points. (B) The marker gene sets of cell subtypes corresponding to the selected trajectory at different time points (SR4 Table 2). (C) Similarity analysis of cell subtypes at different time points within the same trajectory (SR4 Table 3). Among them, the thick line represents a high similarity between two time points, and the thin line represents a low similarity between two time points. (D) The cell types shared by our identified cell subtypes at different times within the same trajectory (SR4 Table 5).
We then built a similarity algorithm (SM Tables 4, 6) to describe the similarity between cell subtypes within the same trajectory at different times (Figure 4C (SR4 Table 3)) by inputting the marker gene sets (Figure 4B (SR4 Table 2)). This process is detailed in the similarity algorithm for cell subtypes in the Methods section.
Figure 4C shows that the degree of cell subtype similarity between the third day and the seventh day is small for each selected trajectory. Additionally, the degree of cell subtype similarity between the sham group and the third day are both small, but the degree of cell subtype similarity between the sham group and the seventh day are both great for VL → fxs → CA1 → DG and VL → I→ (V, VIa, VIb).
These findings indicate a pattern in which not only are the cell subtypes similar for VL → fxs → CA1 → DG, TH → CA1 → DG, and VL → I → (V, VIa, VIb) after IVH stimulation, but these cell subtypes are also different from the cell subtypes of the sham group.
It should be noted that we do not have a cell subtype for the first day or the sham group for VL → fxs → CA1 → DG and TH → CA1 → DG, respectively. Additionally, Figure 4C (SR4 Table 3) shows that the pattern is not as obvious for VL → I → (V, VIa, VIb).
Finally, we found cell types (Figure 4D (SR4 Table 4)) from a commonly used public single-cell sequencing database (CellMeSH (23)) that are similar to our identified cell subtypes (Figure 4A (SR4 Table 1)) as described in the Methods section. Additionally, Figure 4D (SR4 Table 5) describes the cell types that are most similar to our identified cell subtypes at different times within the same trajectory.
3.5 Cell−cell communication strength analysis
Initially, we employed the CellTalkDB database (34) to locate ligand–receptor pairs by inputting the up- and downregulated transition gene sets (Figure 5A (SR3 Table 2)). Figure 5A (SR5 Table 1) shows the up/downregulated transition ligand–receptor (LRn) pairs.
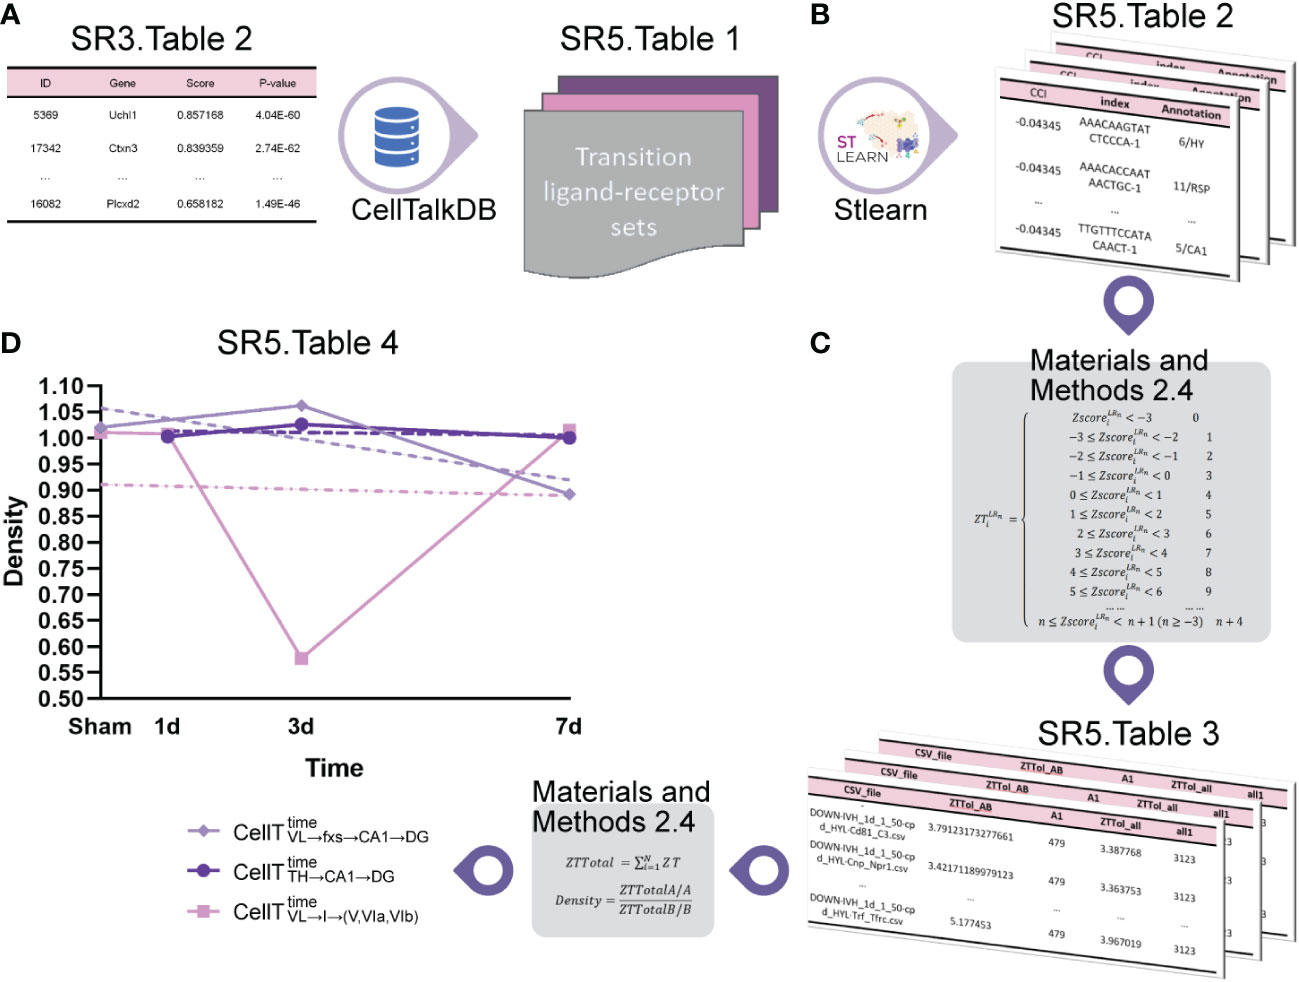
Figure 5 Cell−cell communication strength analysis. (A) The transition ligand–receptor sets. (B) The interaction intensity value . (C) The discrete interaction intensity value . (D) The cell−cell communication strength (density).
Next, we employed stLearn software (12) to analyze their interaction intensity by using Figure 5A (SR5 Table 1) as the input. Figure 5B (SR5 Table 2) shows the interaction intensity values, , for the up/downregulated transition ligand–receptor (LRn) pairs. We then obtained the discrete interaction intensity (Figure 5C (SR5 Table 3)) and the average DensityLRn values for each ligand–receptor pair in the cell subtypes (Figure 5D (SR5 Table 4)) by using the cell−cell communication analysis described in the Methods section.
Figure 5D shows that the density of increased from to and decreased from to ; the density of increased from to but decreased from to ; and the density of decreased from to and from to but increased from to .
Finally, the Kruskal−Wallis test (35) (SR5 Table 5) demonstrates that the density is significantly different among these cell subtypes in VL → fxs → CA1 → DG, TH → CA1 → DG, and VL → I → (V, VIa, VIb).
Therefore, we hypothesized that the cell−cell communication strength would greatly change on the third day after IVH stimulation and return to normal on the seventh day.
3.6 Pathway analysis
First, we employed CellMeSH (23) to identify the genes associated with similar cell types (Figure 6A (SR6 Table 1)) by inputting similar cell types (Figure 6A (SR4 Table 5)).
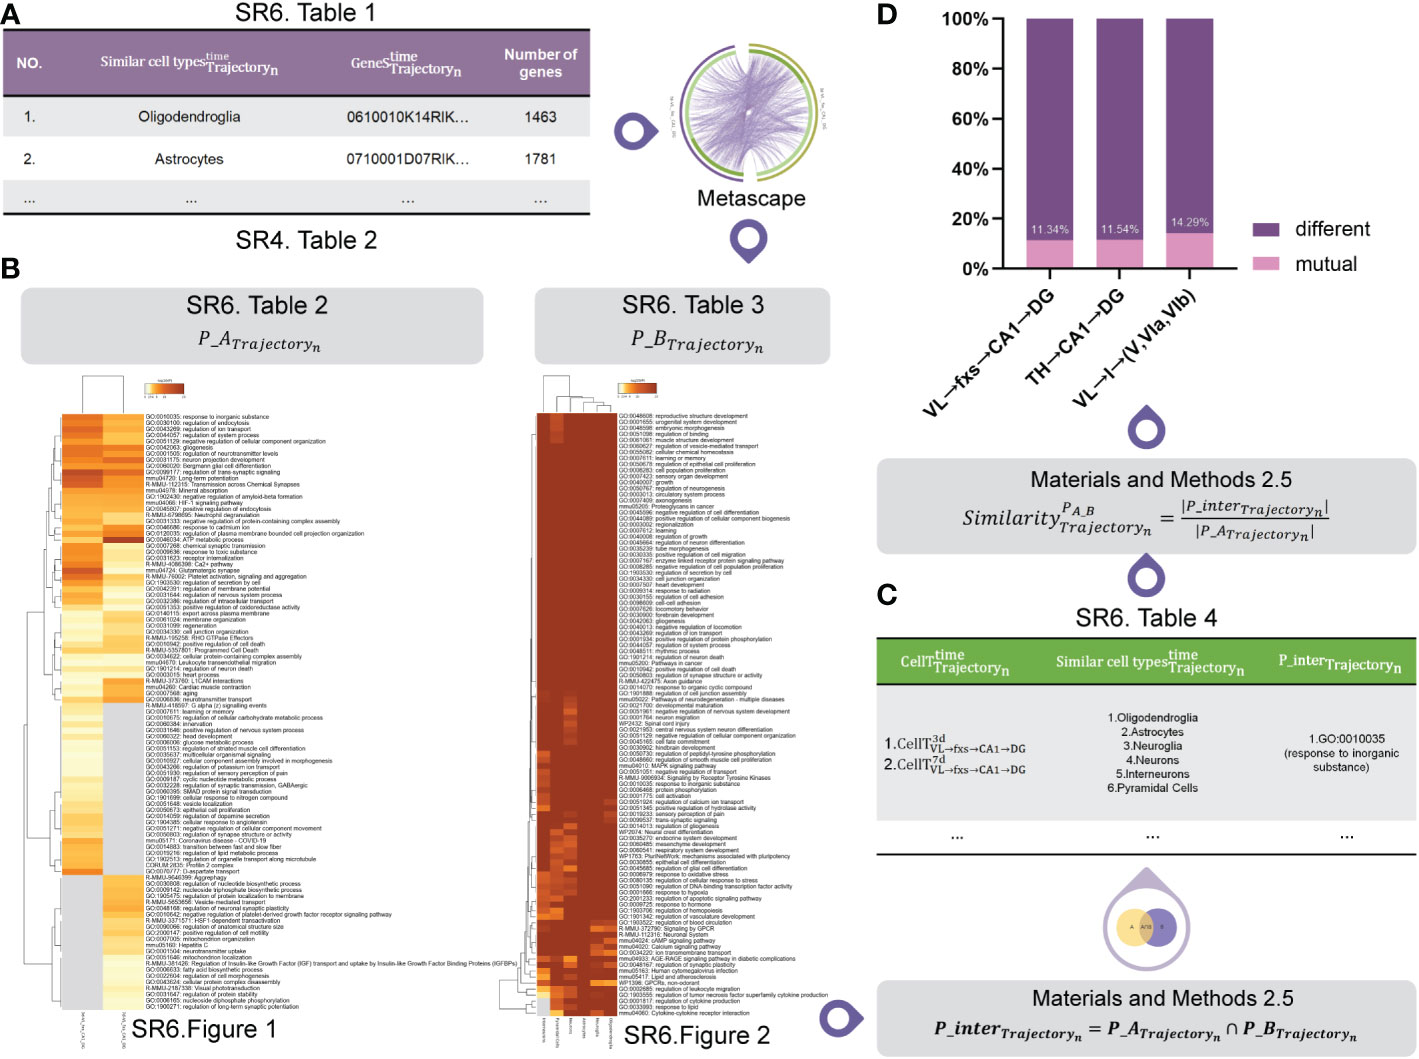
Figure 6 Pathway analysis. (A) The marker genes of similar cell types. (B) The mutual pathway sets for our identified cell subtypes P_ATrajectoryn and similar cell types P_BTrajectoryn . (C) The mutual pathway set P_interTrajectoryn between our identified cell subtypes P_ATrajectoryn and similar cell types P_BTrajectoryn . (D) The similarity between P_ATrajectoryn and P_BTrajectoryn .
Next, using Figure 6A (SR6 Table 1) and marker genes of our identified cell subtypes (Figure 6A (SR4 Table 2)) as the input, we employed Metascape software (15) to carry out pathway analysis for each of them. Figure 6B shows mutual pathway sets for our identified cell subtypes P_ATrajectoryn (Figure 6B (SR6 Table 2 and SR6 Figure 1)) and similar cell types P_BTrajectoryn (Figure 6B (SR6 Table 3 and SR6 Figure 2)).
Figure 6C (SR6 Table 4) shows the mutual pathway set P_interTrajectoryn between our identified cell subtypes P_ATrajectoryn and similar cell types P_BTrajectoryn , the process of which is detailed in the signaling pathway analysis section of the Methods.
Figure 6D shows that our identified cell subtypes and their similar cell types in VL → fxs → CA1 → DG, TH → CA1 → DG, and VL → I → (V, VIa, VIb) have 11, nine, and nine mutual pathways, respectively. Since they have mutual pathways (Figure 6C (SR6 Table 4)) and the proportion of these mutual pathways remained stable for each trajectory, we hypothesized that our identified cell subtypes and their similar cell types found using CellMeSH software (23) should be at the same molecular level.
4 Discussion
In the present study, we established an IVH mouse model by generating a hematoma in the lateral ventricle of the brain as primary stimulation for the ipsilateral hemisphere in mice. We then developed spatial transcriptome sequencing-based bioinformatic algorithms to investigate the 3D spatial brain regions affected by the primary stimulation of the hematoma in the ipsilateral ventricle after IVH (Figure 1). Investigations using this model have resulted in the following important findings: (1) the discovery of three 3D global pseudospace-time trajectories (Figure 2); (2) the identification of the cell subtypes within these trajectories at different times after IVH stimulation (Figure 3) and the elucidation of a similar pattern for these cell types within each 3D global pseudospace-time trajectory (Figure 4); (3) the observation that the cell−cell communication strength greatly changes after IVH stimulation and returns to a normal state later (Figure 5); and (4) the notion that our identified cell subtypes and their similar cell types found in the single-cell sequencing database (CellMeSH (23)) should be similar to each other at the molecular level (Figure 6).
SM Figure 1 indicates that 25 μl of autologous blood was injected into the contralateral ventricle to establish the IVH model used in this study, which exhibited obvious hematoma drainage across the interventricular foramen and deposition in the ipsilateral ventricle but without direct damage to the ependymal barrier in the ventricles. We suggest that this hematoma establishment method produces the ideal model to investigate the secondary neurological dysfunction derived from hematoma stimulation after IVH. The 3D global pseudospace-time trajectories (Figures 2E–G) indicated that hematoma stimulation in the lateral ventricle mainly affected the ipsilateral cortex and hippocampus. A recent analysis of the functional connectivity of the ipsilateral cortex indicated that IVH in infants born moderately preterm and later preterm was associated with the frontoparietal operculum and orbitofrontal cortex, which are related to language and cognition during development (36). In addition, low-grade IVH after germinal matrix hemorrhage in preterm neonates was reported to cause lower cerebral blood flow in posterior cortical and subcortical gray matter regions (37). Trajectory bundle III encompasses changes directly from the lateral ventricle to the ipsilateral cortex, suggesting the regional vulnerability of these brain structures. However, intraventricular extension after intracerebral hemorrhage might not be associated with dysphagia, even with a space-occupying effect and midline shift (38). As Figure 4C (SR4 Table 3) illustrates, we revealed a pattern in which not only are the cell subtypes after IVH stimulation similar for VL → fxs → CA1 → DG, TH → CA1 → DG, and VL → I → (V, VIa, VIb), but these cell subtypes are also different from the cell subtypes of the sham group. However, Figure 4C (SR4 Table 3) demonstrates that the pattern is not as obvious for VL → I → (V, VIa, VIb) compared to that of VL → fxs → CA1 → DG and TH → CA1 → DG. We explain this phenomenon as follows: (1) motor dysfunction usually occurs in most clinical patients with isolated IVH, and (2) our data show that lateral ventricle stimulation has only a transient effect on the ipsilateral cortex.
However, since most patients with IVH are in a supine resting state after onset, there is no clinical evidence to accurately describe the severity of motor dysfunction in its acute phase, and the effects of hematoma stimulation largely returned to normal after 7 days in model mice.
In addition to the limited evidence of hematoma stimulation in the lateral ventricle affecting the cortex, we also illustrated two major 3D global pseudospace-time trajectory bundles involving the hippocampus. Trajectory bundle I (Figures 4C (SR2 Figures 3.1A, B, 3.2B, 3.3B)) is a direct neuronal circuit from the lateral ventricle to the hippocampus, which, from our understanding, is closely associated with white matter lesions after intraventricular extension in spontaneous intracerebral hemorrhage patients (39). Trajectory bundle II (Figures 4C (SR2 Figures 3.1C, 3.2C, 3.3C)) is a novel integrated signaling circuit from the hypothalamus to the hippocampus that flexibly modulates long-term potentiation (40) and several factors of cognition (41). In addition, corpus callosum injury is also reported to strongly correlate with the severity of IVH (42) and serves as a prognostic marker for poor outcomes after brain trauma. Consistent with our previous rodent experiment, perihematomal tissue injury and neurocognitive deficits were reported in intracerebral hemorrhage with ventricular extension (43), and blood metabolites such as iron (44), oxyhemoglobin (45), and thrombin (45, 46) are well considered in this pathophysiological process. Combined with the negative results of the CLEAR III clinical trial, our data in Figure 4C indicated that the presence of a hematoma rapidly stimulates the direct neuronal circuit from the lateral ventricle to the hippocampus, and clearing the blood clots in the ventricle might not successfully remove these stimulations in the cerebrospinal fluid. Targeting subsequent secondary brain injuries due to hematoma stimulation in the ventricles might be a promising therapeutic strategy for IVH patients. Figure 4D (SR4 Table 5) illustrates the most affected or activated cell types by our identified cell subtypes (Figure 4B (SR4 Table 2)), which clearly correspond to the potential pathophysiological changes in these main trajectories/neural circuits after IVH stimulation.
For VL→fxs→CA1→DG from trajectory bundle I, which might be tightly associated with white matter lesions, as we discussed above, the most activated cell type is oligodendroglia, which is consistent with its being widely understood as the main participant in white matter and cognitive functions. Further pathway analysis indicated intense metabolic changes and synaptic activity, as well as gliogenesis and neural cell death in this trajectory. The cell−cell communication strength analysis exhibited strong cell–cell communication after IVH stimulation, which substantially weakened, as shown in Figure 5D. During the post-IVH period, 11 mutual pathways (Figure 6D) reflected the core pathophysiological changes, and these pathways may be potential clues and therapeutic targets for further preclinical study.
Additionally, in TH→CA1→DG from trajectory bundle II, it seems that neuronal cells are the main participants and cell proliferation is the pathway with the most substantial changes, which is supported by a recent study (47) that suggested hypothalamic circuits could regulate memory by modulating adult hippocampal neurogenesis.
However, pathway analysis (SR6 Figure 1.3) of VL→I→(V, VIa, VIb) from trajectory bundle III indicated an acute response to hypoxia and oxidative stress, which is consistent with the significant suppression of cell−cell communication strength within this trajectory on the third day after IVH stimulation (Figure 5D). Nevertheless, the communication strength recovered to a normal level on the seventh day after IVH stimulation, which might be an explanation for the short-term motor dysfunction in IVH patients and is worthy of clinical attention in the future.
Our proposed bioinformatics analysis workflow has the following innovations and limitations: First, we developed a 3D global pseudospace-time trajectory reconstruction algorithm that cannot only investigate the genetic changes in 3D global pseudospace-time trajectories but also identify cell subtypes within these trajectories at different times. However, due to the limited sections and the conflict between planner trajectories, this algorithm cannot obtain high accuracy.
Second, because our proposed similarity algorithm considers the up/downregulation of marker genes of cell subtypes, we can accurately compute the similarity between cell subtypes at different times on the same trajectory. However, since spatial transcriptome data only provide discrete up/downregulation data, the accuracy of our similarity algorithm is limited.
Third, our proposed cell−cell communication intensity density algorithm can uniformly measure cell−cell communication intensity for multiple spatial transcriptome sections at different times for each ligand−receptor pair within a cell subtype compared to a previous method (12) that analyzed cell−cell communication intensity for a single section. However, since we do not have an automatic algorithm to match cell subtype ligand–receptor pairs in the CellTalkDB database (34), it was time-consuming for us to process the cell subtypes that had many paired ligands.
In conclusion, we innovated a bioinformatics algorithm to discover three main 3D global pseudospace-time trajectory groups that represent the main neural circuits from the lateral ventricle to the hippocampus and primary cortex affected by experimental IVH stimulation. Further analysis indicated a rapid response in the primary cortex as well as a direct and integrated effect on the hippocampus after IVH stimulation. To the best of our knowledge, this is the first study to investigate secondary brain injury after IVH stimulation by using spatial transcriptome sequencing and bioinformatics analysis, but verification and further investigation by basic neuroscience and translational interventions are still needed. These data provide helpful information for elucidating the pathophysiological mechanism for the occurrence of IVH in patients after acute brain injury, as well as algorithm strategies for similar studies in the future. The algorithm strategies used in this study are searchable via a web service (www.combio-lezhang.online/3dstivh/home).
Data availability statement
The datasets presented in this study can be found in online repositories. The names of the repository/repositories and accession number(s) can be found below: https://www.ncbi.nlm.nih.gov/geo/, GSE214349.
Ethics statement
The animal study was reviewed and approved by Laboratory Animal Welfare and Ethics Committee of Third Military Medical University (AMUWEC2020762).
Author contributions
LZ and YC conceptualized and designed the experiments and supervised the research. XR, SH, and YC performed animal experiments. LZ, JB, GW, WS, YY, JH, and YC acquired and analyzed the data. LZ, JB, GW, WS, HF, RC, YZ, and YC interpreted the data. LZ, JB, WS, YZ, and YC drafted the manuscript. All authors have read and approved the current version of the manuscript.
Funding
This work was supported by the State Key Laboratory of Trauma, Burn and Combined Injury (No. SKLYQ202002 to YC), National Key Research and Development Program of China (Nos. 2021YFF1201200 to LZ), National Natural Science Foundation of China (No. 82030036 to HF), Sichuan Science and Technology Program (No. 2022YFS0048 to LZ), and Chongqing Technical Innovation and Application Development Project: Research and Application of Key Technology of Intelligent Risk Control Platform based on Cross-source Multi-dimensional Real-time Technology of Big Data (No.CSTB2022TIAD-KPX0067 to LZ).
Acknowledgments
The 10X Genomic Visium spatial transcriptome sequencing of this work was performed by Novogene Biotechnological Co., Ltd.
Conflict of interest
The authors declare that the research was conducted in the absence of any commercial or financial relationships that could be construed as a potential conflict of interest.
Publisher’s note
All claims expressed in this article are solely those of the authors and do not necessarily represent those of their affiliated organizations, or those of the publisher, the editors and the reviewers. Any product that may be evaluated in this article, or claim that may be made by its manufacturer, is not guaranteed or endorsed by the publisher.
Supplementary material
The Supplementary Material for this article can be found online at: https://www.frontiersin.org/articles/10.3389/fimmu.2023.1123652/full#supplementary-material
References
1. Yuh EL, Jain S, Sun X, Pisica D, Harris MH, Taylor SR, et al. Pathological computed tomography features associated with adverse outcomes after mild traumatic brain injury: A track-tbi study with external validation in center-tbi. JAMA Neurol (2021) 78(9):1137–48. doi: 10.1001/jamaneurol.2021.2120
2. Ban VS, El Ahmadieh TY, Aoun SG, Plitt AR, Lyon KA, Eddleman C, et al. Prediction of outcomes for ruptured aneurysm surgery. Stroke (2019) 50(3):595–601. doi: 10.1161/STROKEAHA.118.023771
3. Yogendrakumar V, Ramsay T, Fergusson D, Demchuk AM, Aviv RI, Rodriguez-Luna D, et al. New and expanding ventricular hemorrhage predicts poor outcome in acute intracerebral hemorrhage. Neurology (2019) 93(9):e879–e88. doi: 10.1212/wnl.0000000000008007
4. Hemphill JC 3rd, Greenberg SM, Anderson CS, Becker K, Bendok BR, Cushman M, et al. Guidelines for the management of spontaneous intracerebral hemorrhage: A guideline for healthcare professionals from the American heart Association/American stroke association. Stroke (2015) 46(7):2032–60. doi: 10.1161/str.0000000000000069
5. Karimy JK, Zhang J, Kurland DB, Theriault BC, Duran D, Stokum JA, et al. Inflammation-dependent cerebrospinal fluid hypersecretion by the choroid plexus epithelium in posthemorrhagic hydrocephalus. Nat Med (2017) 23(8):997–1003. doi: 10.1038/nm.4361
6. Zhang Z, Tan Q, Guo P, Huang S, Jia Z, Liu X, et al. Nlrp3 inflammasome-mediated choroid plexus hypersecretion contributes to hydrocephalus after intraventricular hemorrhage Via phosphorylated Nkcc1 channels. J Neuroinflamm (2022) 19(1):163. doi: 10.1186/s12974-022-02530-x
7. Hanley DF, Lane K, McBee N, Ziai W, Tuhrim S, Lees KR, et al. Thrombolytic removal of intraventricular haemorrhage in treatment of severe stroke: Results of the randomised, multicentre, multiregion, placebo-controlled clear iii trial. Lancet (London England) (2017) 389(10069):603–11. doi: 10.1016/s0140-6736(16)32410-2
8. Shah VA, Thompson RE, Yenokyan G, Acosta JN, Avadhani R, Dlugash R, et al. One-year outcome trajectories and factors associated with functional recovery among survivors of intracerebral and intraventricular hemorrhage with initial severe disability. JAMA Neurol (2022) 79(9):856–68. doi: 10.1001/jamaneurol.2022.1991
9. Roh DJ, Asonye IS, Carvalho Poyraz F, Magid-Bernstein JR, Joiner EF, Avadhani R, et al. Intraventricular hemorrhage expansion in the clear iii trial: A Post hoc exploratory analysis. Stroke (2022) 53(6):1847–53. doi: 10.1161/STROKEAHA.121.037438
10. Ståhl PL, Salmén F, Vickovic S, Lundmark A, Navarro JF, Magnusson J, et al. Visualization and analysis of gene expression in tissue sections by spatial transcriptomics. Sci (New York NY) (2016) 353(6294):78–82. doi: 10.1126/science.aaf2403
11. Rao A, Barkley D, Franca GS, Yanai I. Exploring tissue architecture using spatial transcriptomics. Nature (2021) 596(7871):211–20. doi: 10.1038/s41586-021-03634-9
12. Hu J, Schroeder A, Coleman K, Chen C, Auerbach BJ, Li M. Statistical and machine learning methods for spatially resolved transcriptomics with histology. Comput Struct Biotechnol J (2021) 19:3829–41. doi: 10.1016/j.csbj.2021.06.052
13. Zeng Z, Li Y, Li Y, Luo Y. Statistical and machine learning methods for spatially resolved transcriptomics data analysis. Genome Biol (2022) 23(1):83. doi: 10.1186/s13059-022-02653-7
14. Cui Zhou D, Jayasinghe RG, Chen S, Herndon JM, Iglesia MD, Navale P, et al. Spatially restricted drivers and transitional cell populations cooperate with the microenvironment in untreated and chemo-resistant pancreatic cancer. Nat Genet (2022) 54(9):1390–405. doi: 10.1038/s41588-022-01157-1
15. Zhou Y, Zhou B, Pache L, Chang M, Khodabakhshi AH, Tanaseichuk O, et al. Metascape provides a biologist-oriented resource for the analysis of systems-level datasets. Nat Commun (2019) 10(1):1523. doi: 10.1038/s41467-019-09234-6
16. Zhang L, Dai Z, Yu J, Xiao M. Cpg-Island-Based annotation and analysis of human housekeeping genes. Brief Bioinform (2021) 22(1):515–25. doi: 10.1093/bib/bbz134
17. Zhang L, Liu G, Kong M, Li T, Wu D, Zhou X, et al. Revealing dynamic regulations and the related key proteins of myeloma-initiating cells by integrating experimental data into a systems biological model. Bioinformatics (2021) 37(11):1554–61. doi: 10.1093/bioinformatics/btz542
18. Zhang L, Xiao M, Zhou J, Yu J. Lineage-associated underrepresented permutations (Laups) of mammalian genomic sequences based on a jellyfish-based laups analysis application (Jbla). Bioinformatics (2018) 34(21):3624–30. doi: 10.1093/bioinformatics/bty392
19. Zhang L, Zhang L, Guo Y, Xiao M, Feng L, Yang C, et al. Mcdb: A comprehensive curated mitotic catastrophe database for retrieval, protein sequence alignment, and target prediction. Acta Pharm Sin B (2021) 11(10):3092–104. doi: 10.1016/j.apsb.2021.05.032
20. Lei W, Zeng H, Feng H, Ru X, Zhang L. Development of an early prediction model for subarachnoid hemorrhage with genetic and signaling pathway analysis. Front Genet (2020) 11:391. doi: 10.3389/fgene.2020.00391
21. Zhang L, Li J, Yin K, Jiang Z, Li T, Hu R, et al. Computed tomography angiography-based analysis of high-risk intracerebral haemorrhage patients by employing a mathematical model. BMC Bioinf (2019) 20(Suppl 7):193. doi: 10.1186/s12859-019-2741-5
22. Zhang L, Tao W, Feng H, Chen Y. Transcriptional and genomic targets of neural stem cells for functional recovery after hemorrhagic stroke. Stem Cells Int (2017) 2017:2412890. doi: 10.1155/2017/2412890
23. Mao S, Zhang Y, Seelig G, Kannan S. Cellmesh: Probabilistic cell-type identification using indexed literature. Bioinf (Oxford England) (2021) 38(5):1393–402. doi: 10.1093/bioinformatics/btab834
24. Kuppe C, Ramirez Flores RO, Li Z, Hayat S, Levinson RT, Liao X, et al. Spatial multi-omic map of human myocardial infarction. Nature (2022) 608(7924):766–77. doi: 10.1038/s41586-022-05060-x
25. Lein ES, Hawrylycz MJ, Ao N, Ayres M, Bensinger A, Bernard A, et al. Genome-wide atlas of gene expression in the adult mouse brain. Nature. (2007) 445(7924):168–176. doi: 10.1038/nature05453
26. Liu GD, Li YC, Zhang W, Zhang L. A brief review of artificial intelligence applications and algorithms for psychiatric disorders. Engineering-Prc (2020) 6(4):462–7. doi: 10.1016/j.eng.2019.06.008
27. Song H, Chen L, Cui YT, Li Q, Wang Q, Fan JF, et al. Denoising of Mr and ct images using cascaded multi-supervision convolutional neural networks with progressive training. Neurocomputing (2022) 469:354–65. doi: 10.1016/j.neucom.2020.10.118
28. You Y, Lai X, Pan Y, Zheng H, Vera J, Liu S, et al. Artificial intelligence in cancer target identification and drug discovery. Signal Transduct Target Ther (2022) 7(1):156. doi: 10.1038/s41392-022-00994-0
29. Zhang L, Bai W, Yuan N, Du Z. Comprehensively benchmarking applications for detecting copy number variation. PloS Comput Biol (2019) 15(5):e1007069. doi: 10.1371/journal.pcbi.1007069
30. Zhang L, Qiao M, Gao H, Hu B, Tan H, Zhou X, et al. Investigation of mechanism of bone regeneration in a porous biodegradable calcium phosphate (Cap) scaffold by a combination of a multi-scale agent-based model and experimental Optimization/Validation. Nanoscale (2016) 8(31):14877–87. doi: 10.1039/c6nr01637e
31. Zhang L, Zhang S. Using game theory to investigate the epigenetic control mechanisms of embryo development: Comment on: "Epigenetic game theory: How to compute the epigenetic control of maternal-to-Zygotic transition" by qian Wang et al. Phys Life Rev (2017) 20:140–2. doi: 10.1016/j.plrev.2017.01.007
32. Zhang L, Zhao J, Bi H, Yang X, Zhang Z, Su Y, et al. Bioinformatic analysis of chromatin organization and biased expression of duplicated genes between two poplars with a common whole-genome duplication. Hortic Res (2021) 8(1):62. doi: 10.1038/s41438-021-00494-2
33. Zhang L, Zheng C, Li T, Xing L, Zeng H, Li T, et al. Building up a robust risk mathematical platform to predict colorectal cancer. Complexity (2017) 2017:1–14. doi: 10.1155/2017/8917258
34. Shao X, Liao J, Li C, Lu X, Cheng J, Fan X. Celltalkdb: A manually curated database of ligand-receptor interactions in humans and mice. Brief Bioinform (2021) 22(4):bbaa269:. doi: 10.1093/bib/bbaa269
35. Fan C, Zhang D, Zhang CH. On sample size of the kruskal-Wallis test with application to a mouse peritoneal cavity study. Biometrics (2011) 67(1):213–24. doi: 10.1111/j.1541-0420.2010.01407.x
36. Argyropoulou MI, Xydis VG, Drougia A, Giantsouli AS, Giapros V, Astrakas LG. Structural and functional brain connectivity in moderate-late preterm infants with low-grade intraventricular hemorrhage. Neuroradiology (2022) 64(1):197–204. doi: 10.1007/s00234-021-02770-3
37. Tortora D, Lo Russo FM, Severino M, Parodi A, Massirio P, Ramenghi LA, et al. Regional impairment of cortical and deep Gray matter perfusion in preterm neonates with low-grade germinal matrix-intraventricular hemorrhage: An asl study. Neuroradiology (2020) 62(12):1689–99. doi: 10.1007/s00234-020-02514-9
38. Hess F, Foerch C, Keil F, Seiler A, Lapa S. Association of lesion pattern and dysphagia in acute intracerebral hemorrhage. Stroke (2021) 52(9):2921–9. doi: 10.1161/STROKEAHA.120.032615
39. Kim BJ, Lee SH, Ryu WS, Kim CK, Chung JW, Kim D, et al. Extents of white matter lesions and increased intraventricular extension of intracerebral hemorrhage. Crit Care Med (2013) 41(5):1325–31. doi: 10.1097/CCM.0b013e31827c05e9
40. Ajibola MI, Wu JW, Abdulmajeed WI, Lien CC. Hypothalamic Glutamate/Gaba cotransmission modulates hippocampal circuits and supports long-term potentiation. J Neurosci (2021) 41(39):8181–96. doi: 10.1523/JNEUROSCI.0410-21.2021
41. Chen S, He L, Huang AJY, Boehringer R, Robert V, Wintzer ME, et al. A hypothalamic novelty signal modulates hippocampal memory. Nature (2020) 586(7828):270–4. doi: 10.1038/s41586-020-2771-1
42. Matsukawa H, Shinoda M, Fujii M, Takahashi O, Murakata A, Yamamoto D, et al. Intraventricular hemorrhage on computed tomography and corpus callosum injury on magnetic resonance imaging in patients with isolated blunt traumatic brain injury. J Neurosurg (2012) 117(2):334–9. doi: 10.3171/2012.5.JNS112318
43. Chen Q, Zhang J, Guo J, Tang J, Tao Y, Li L, et al. Chronic hydrocephalus and perihematomal tissue injury developed in a rat model of intracerebral hemorrhage with ventricular extension. Transl Stroke Res (2015) 6(2):125–32. doi: 10.1007/s12975-014-0367-5
44. Chen Q, Tang J, Tan L, Guo J, Tao Y, Li L, et al. Intracerebral hematoma contributes to hydrocephalus after intraventricular hemorrhage Via aggravating iron accumulation. Stroke (2015) 46(10):2902–8. doi: 10.1161/STROKEAHA.115.009713
45. Liu DZ, Sharp FR, Van KC, Ander BP, Ghiasvand R, Zhan X, et al. Inhibition of src family kinases protects hippocampal neurons and improves cognitive function after traumatic brain injury. J Neurotrauma (2014) 31(14):1268–76. doi: 10.1089/neu.2013.3250
46. Liu DZ, Waldau B, Ander BP, Zhan X, Stamova B, Jickling GC, et al. Inhibition of src family kinases improves cognitive function after intraventricular hemorrhage or intraventricular thrombin. J Cereb Blood Flow Metab (2017) 37(7):2359–67. doi: 10.1177/0271678X16666291
Keywords: intraventricular haemorrhage, neural circuits, spatial transcriptome sequencing, bioinformatics analysis, secondary brain injury
Citation: Zhang L, Badai J, Wang G, Ru X, Song W, You Y, He J, Huang S, Feng H, Chen R, Zhao Y and Chen Y (2023) Discovering hematoma-stimulated circuits for secondary brain injury after intraventricular hemorrhage by spatial transcriptome analysis. Front. Immunol. 14:1123652. doi: 10.3389/fimmu.2023.1123652
Received: 14 December 2022; Accepted: 11 January 2023;
Published: 07 February 2023.
Edited by:
Yuanjian Fang, Zhejiang University, ChinaReviewed by:
Xiujuan Lei, Shaanxi Normal University, ChinaZhiguo Zhang, Harbin Institute of Technology, Shenzhen, China
Gelei Xiao, Department of Neurosurgery, Central South University, China
Copyright © 2023 Zhang, Badai, Wang, Ru, Song, You, He, Huang, Feng, Chen, Zhao and Chen. This is an open-access article distributed under the terms of the Creative Commons Attribution License (CC BY). The use, distribution or reproduction in other forums is permitted, provided the original author(s) and the copyright owner(s) are credited and that the original publication in this journal is cited, in accordance with accepted academic practice. No use, distribution or reproduction is permitted which does not comply with these terms.
*Correspondence: Runsheng Chen, Y3JzQGlicC5hYy5jbg==; Yi Zhao, YmlvenlAaWN0LmFjLmNu; Yujie Chen, Y2hlbnlqQGRpY3AuYWMuY24=; eXVqaWVjaGVuNjg4NkBmb3htYWlsLmNvbQ==
†These authors have contributed equally to this work
‡ORCID: Runsheng Chen, orcid.org/0000-0001-6049-8347
Yi Zhao, orcid.org/0000-0001-6046-8420
Yujie Chen, orcid.org/0000-0002-9905-9138