 Yu-Feng Huang1
 Wei-Ming Zhang2Zhi-Song Wei2Huan Huang2Qi-Yan Mo2Dan-Li Shi2Lu Han2Yu-Yuan Han2Si-Kai Nong2Guo-Xiang Lin2*
- 1The First Clinical College, Shanxi Medical University, Jinzhong, China
- 2Department of Oncology, Wuming Hospital of Guangxi Medical University, Nanning, China
Background: Multiple clinical studies have indicated that the gut microbiota influences the effects of immune checkpoint blockade (ICB) therapy comprising PD-1/PD-L1 inhibitors, but the causal relationship is unclear. Because of numerous confounders, many microbes related to PD-1/PD-L1 have not been identified. This study aimed to determine the causal relationship between the microbiota and PD-1/PD-L1 and identify possible biomarkers for ICB therapy.
Method: We used bidirectional two-sample Mendelian randomization with two different thresholds to explore the potential causal relationship between the microbiota and PD-1/PD-L1 and species-level microbiota GWAS to verify the result.
Result: In the primary forward analysis, genus_Holdemanella showed a negative correlation with PD-1 [βIVW = -0.25; 95% CI (-0.43 to -0.07); PFDR = 0.028] and genus_Prevotella9 showed a positive correlation with PD-1 [βIVW = 0.2; 95% CI (0.1 to 0.4); PFDR = 0.027]; order_Rhodospirillales [βIVW = 0.2; 95% CI (0.1 to 0.4); PFDR = 0.044], family_Rhodospirillaceae [βIVW = 0.2; 95% CI (0 to 0.4); PFDR = 0.032], genus_Ruminococcaceae_UCG005 [βIVW = 0.29; 95% CI (0.08 to 0.5); PFDR = 0.028], genus_Ruminococcus_gnavus_group [βIVW = 0.22; 95% CI (0.05 to 0.4); PFDR = 0.029], and genus_Coprococcus_2 [βIVW = 0.4; 95% CI (0.1 to 0.6); PFDR = 0.018] were positively correlated with PD-L1; and phylum_Firmicutes [βIVW = -0.3; 95% CI (-0.4 to -0.1); PFDR = 0.031], family_ClostridialesvadinBB60group [βIVW = -0.31; 95% CI (-0.5 to -0.11), PFDR = 0.008], family_Ruminococcaceae [βIVW = -0.33; 95% CI (-0.58 to -0.07); PFDR = 0.049], and genus_Ruminococcaceae_UCG014 [βIVW = -0.35; 95% CI (-0.57 to -0.13); PFDR = 0.006] were negatively correlated with PD-L1. The one significant species in further analysis was species_Parabacteroides_unclassified [βIVW = 0.2; 95% CI (0-0.4); PFDR = 0.029]. Heterogeneity (P > 0.05) and pleiotropy (P > 0.05) analyses confirmed the robustness of the MR results.
Introduction
Immune checkpoint blockade (ICB) therapy has been a significant breakthrough in cancer research discovery in recent years; it offers a highly effective method for enhancing anticancer effects against aggressive cancers (1). Programmed cell death protein 1 (PD-1)/programmed cell death ligand 1 (PD-L1) is one of the most high-profile target protein pairs in ICB. PD-1/PD-L1 can inhibit the proliferation and differentiation of effector T lymphocytes and prevent the presentation of neoantigens. PD-1 is mainly expressed by activated T cells, dendritic cells (DCs), B cells, and natural killer cells (NKs). However, many tumors have been shown to elevate PD-1 expression, which further helps the tumor escape from the immune system (2). Numerous cell types express PD-L1, but its expression is significantly elevated in most malignancies, which are the primary source of PD-L1 in the blood (3). PD-1/PD-L1 inhibitors can relieve the limitation of PD-1/PD-L1 and restore exhausted T cells to resume the antitumor immune reaction (4). In clinical practice, however, ICB has limited efficacy in many patients; thus, there is an urgent need to find an auxiliary treatment to promote the effect of ICB.
In recent years, numerous investigations have shown that the gut microbiota influences the efficacy of ICB (5, 6). The gut microbiota consists of approximately 4 × 10¹³ symbiotic bacteria, protozoa, fungi, archaea, and viruses. It can affect numerous physiological systems, such as metabolism, inflammatory processes, and immune responses (7, 8). Previous research links the microbiota to the toxicity and efficacy of cancer treatments and the processes of carcinogenesis with specific taxa of bacteria (9). Identifying microbial taxa that directly or indirectly produce anticancer activities is essential for developing a microbiome-based combinatory therapy that can enhance the overall rate of response to anti–PD-1/PD-L1 therapy. A few bacterial genera/species are enriched in patients with favorable clinical outcomes (6, 10). However, due to the influence of reverse causality and confounders, the causal association between PD-1/PD-L1 and the microbiota has not been verified and many potentially related microbes associated with PD-1/PD-L1 therapy have not been explored (8). Therefore, it is essential to initiate a relevant genetic-level study.
Mendelian randomization (MR) is a genetic epidemiology method that utilizes human genetic variation known to influence modifiable exposures as instrumental variables (IVs) to infer the causal effect of an exposure on an outcome; it can eliminate confounding bias and is advantageous for separating the causal pathways of phenotypically grouped risk variables that are hard to randomize or susceptible to measurement error (11).
Here, we conducted a two-sample bidirectional Mendelian randomization at two distinct thresholds to determine the causal relationship between PD-1/PD-L1 and the gut microbiota and explore potential biomarker microbes (Figure 1).
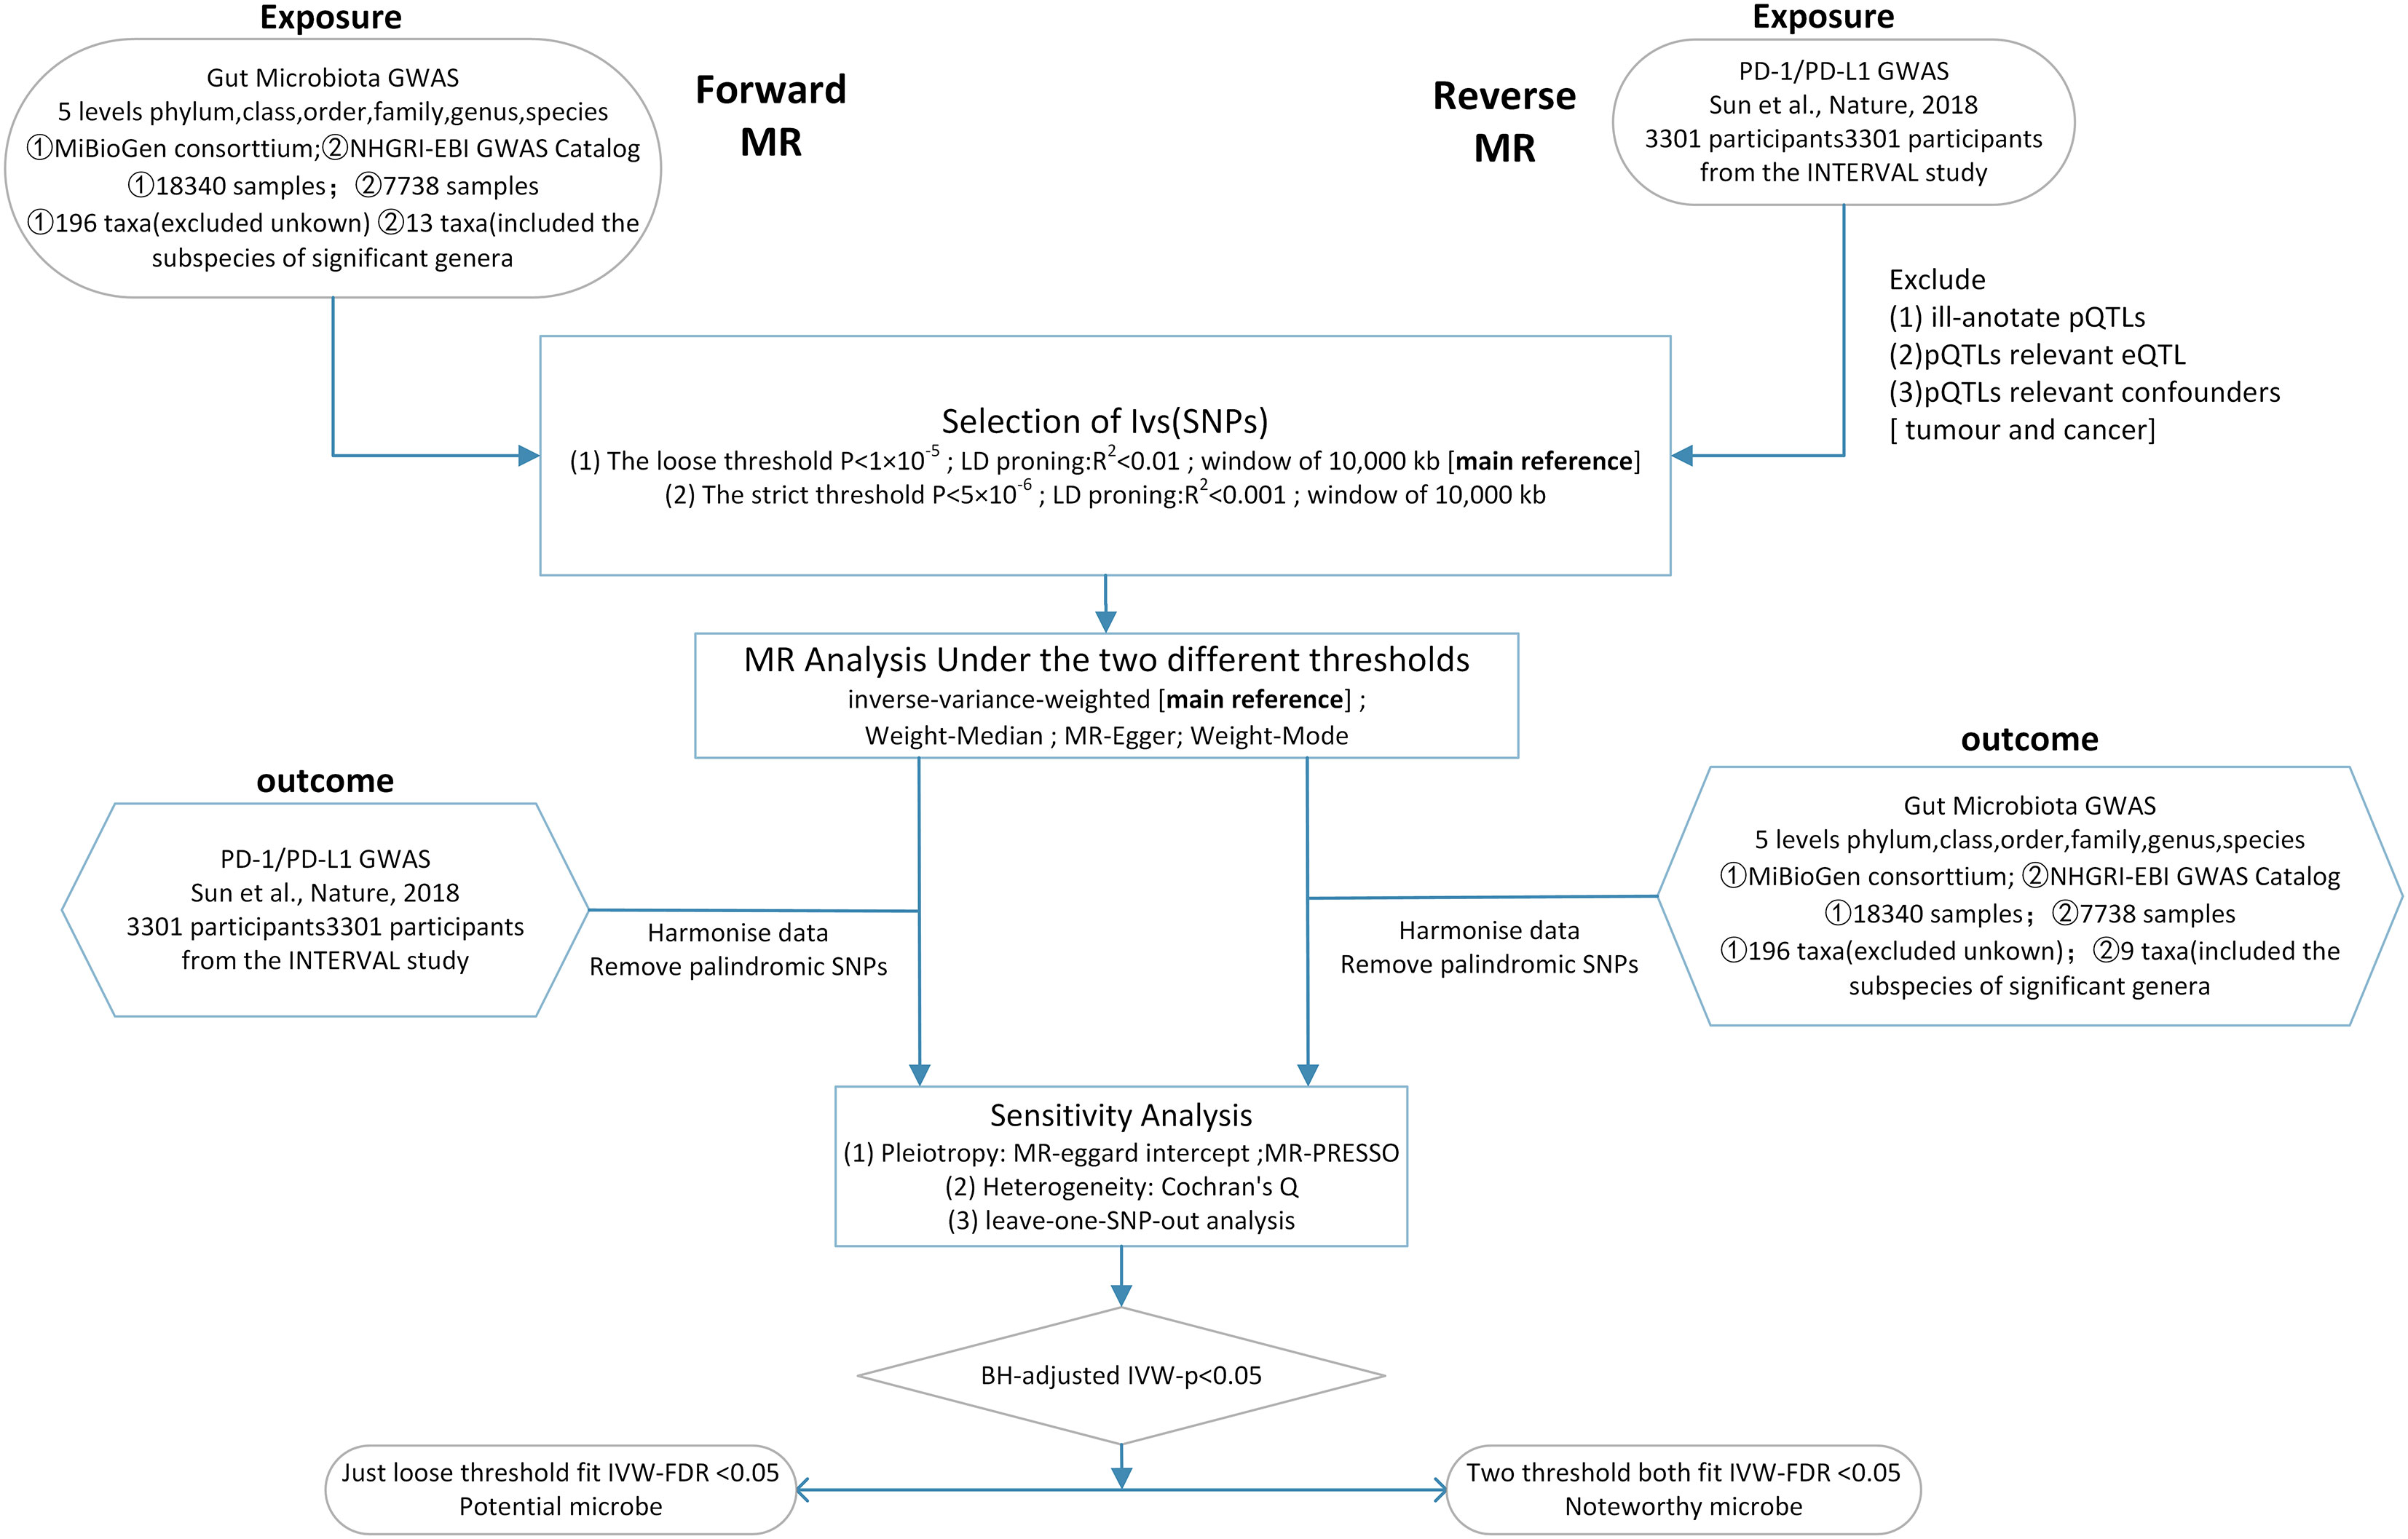
Figure 1 Workflow of this MR analysis. SNPs, single-nucleotide polymorphisms; MR, Mendelian randomization; LD, linkage disequilibrium; eQTL, expression quantitative trait loci; pQTL, protein quantitative trait loci.
Results
Univariable forward MR
We used the loose threshold as the primary reference to investigate further potential linkages.
The F statistic of any single genetic instrument that was used in the analysis was >10 to avoid weak instrument bias. In the forward MR with a relaxed threshold (P = 1 × 10⁻⁵, R2 = 0.01, LD = 10000), we discovered important microbes. For instance, genus_Holdemanella showed a negative correlation with PD-1 [βIVW = -0.25; 95% CI (-0.43 to -0.07); PFDR = 0.028] and genus_Prevotella9 showed a positive correlation with PD-1 [βIVW = 0.2; 95% CI (0.1 to 0.4); PFDR = 0.027]; order_Rhodospirillales [βIVW = 0.2; 95% CI (0.1 to 0.4); PFDR = 0.044], family_Rhodospirillaceae [βIVW = 0.2; 95% CI (0 to 0.4); PFDR = 0.032], genus_Ruminococcaceae_UCG005 [βIVW = 0.29; 95% CI (0.08 to 0.5); PFDR = 0.028], genus_Ruminococcus_gnavus_group [βIVW = 0.22; 95% CI (0.05 to 0.4); PFDR = 0.029], and genus_Coprococcus_2 [βIVW = 0.4; 95% CI (0.1 to 0.6); PFDR = 0.018] were positively correlated with PD-L1; and phylum_Firmicutes [βIVW = -0.3; 95% CI (-0.4 to -0.1); PFDR = 0.031], family_Clostridiales_vadin_BB60_group [βIVW = -0.31; 95% CI (-0.5 to -0.11), PFDR = 0.008], family_Ruminococcaceae [βIVW = -0.33; 95% CI (-0.58 to -0.07); PFDR = 0.049], and genus_Ruminococcaceae UCG014 [βIVW = -0.35; 95% CI (-0.57 to -0.13); PFDR = 0.006] were negatively correlated with PD-L1. MR-PRESSO detected no horizontal pleiotropy (P Presso Gable>0.05). The weighted median and the weighted mode yielded similar patterns of effects or directions except for MR-Egger in some exposures, and the difference possibly due to the power of the MR-Egger method was smaller (11). According to Cochran’s Q statistic, there was no evidence of pleiotropy across instrument effects (Cochran’s QIVW >0.05). Analysis of MR-Egger intercepts revealed no indication of directional pleiotropy (P Intercept >0.05). The leave-one-out analysis identified all taxonomic groups exhibiting robustness under the loose threshold, except for genus_Prevotella_9 (Figure 2). More information is available in Supplemental Table 1 (Table S1).
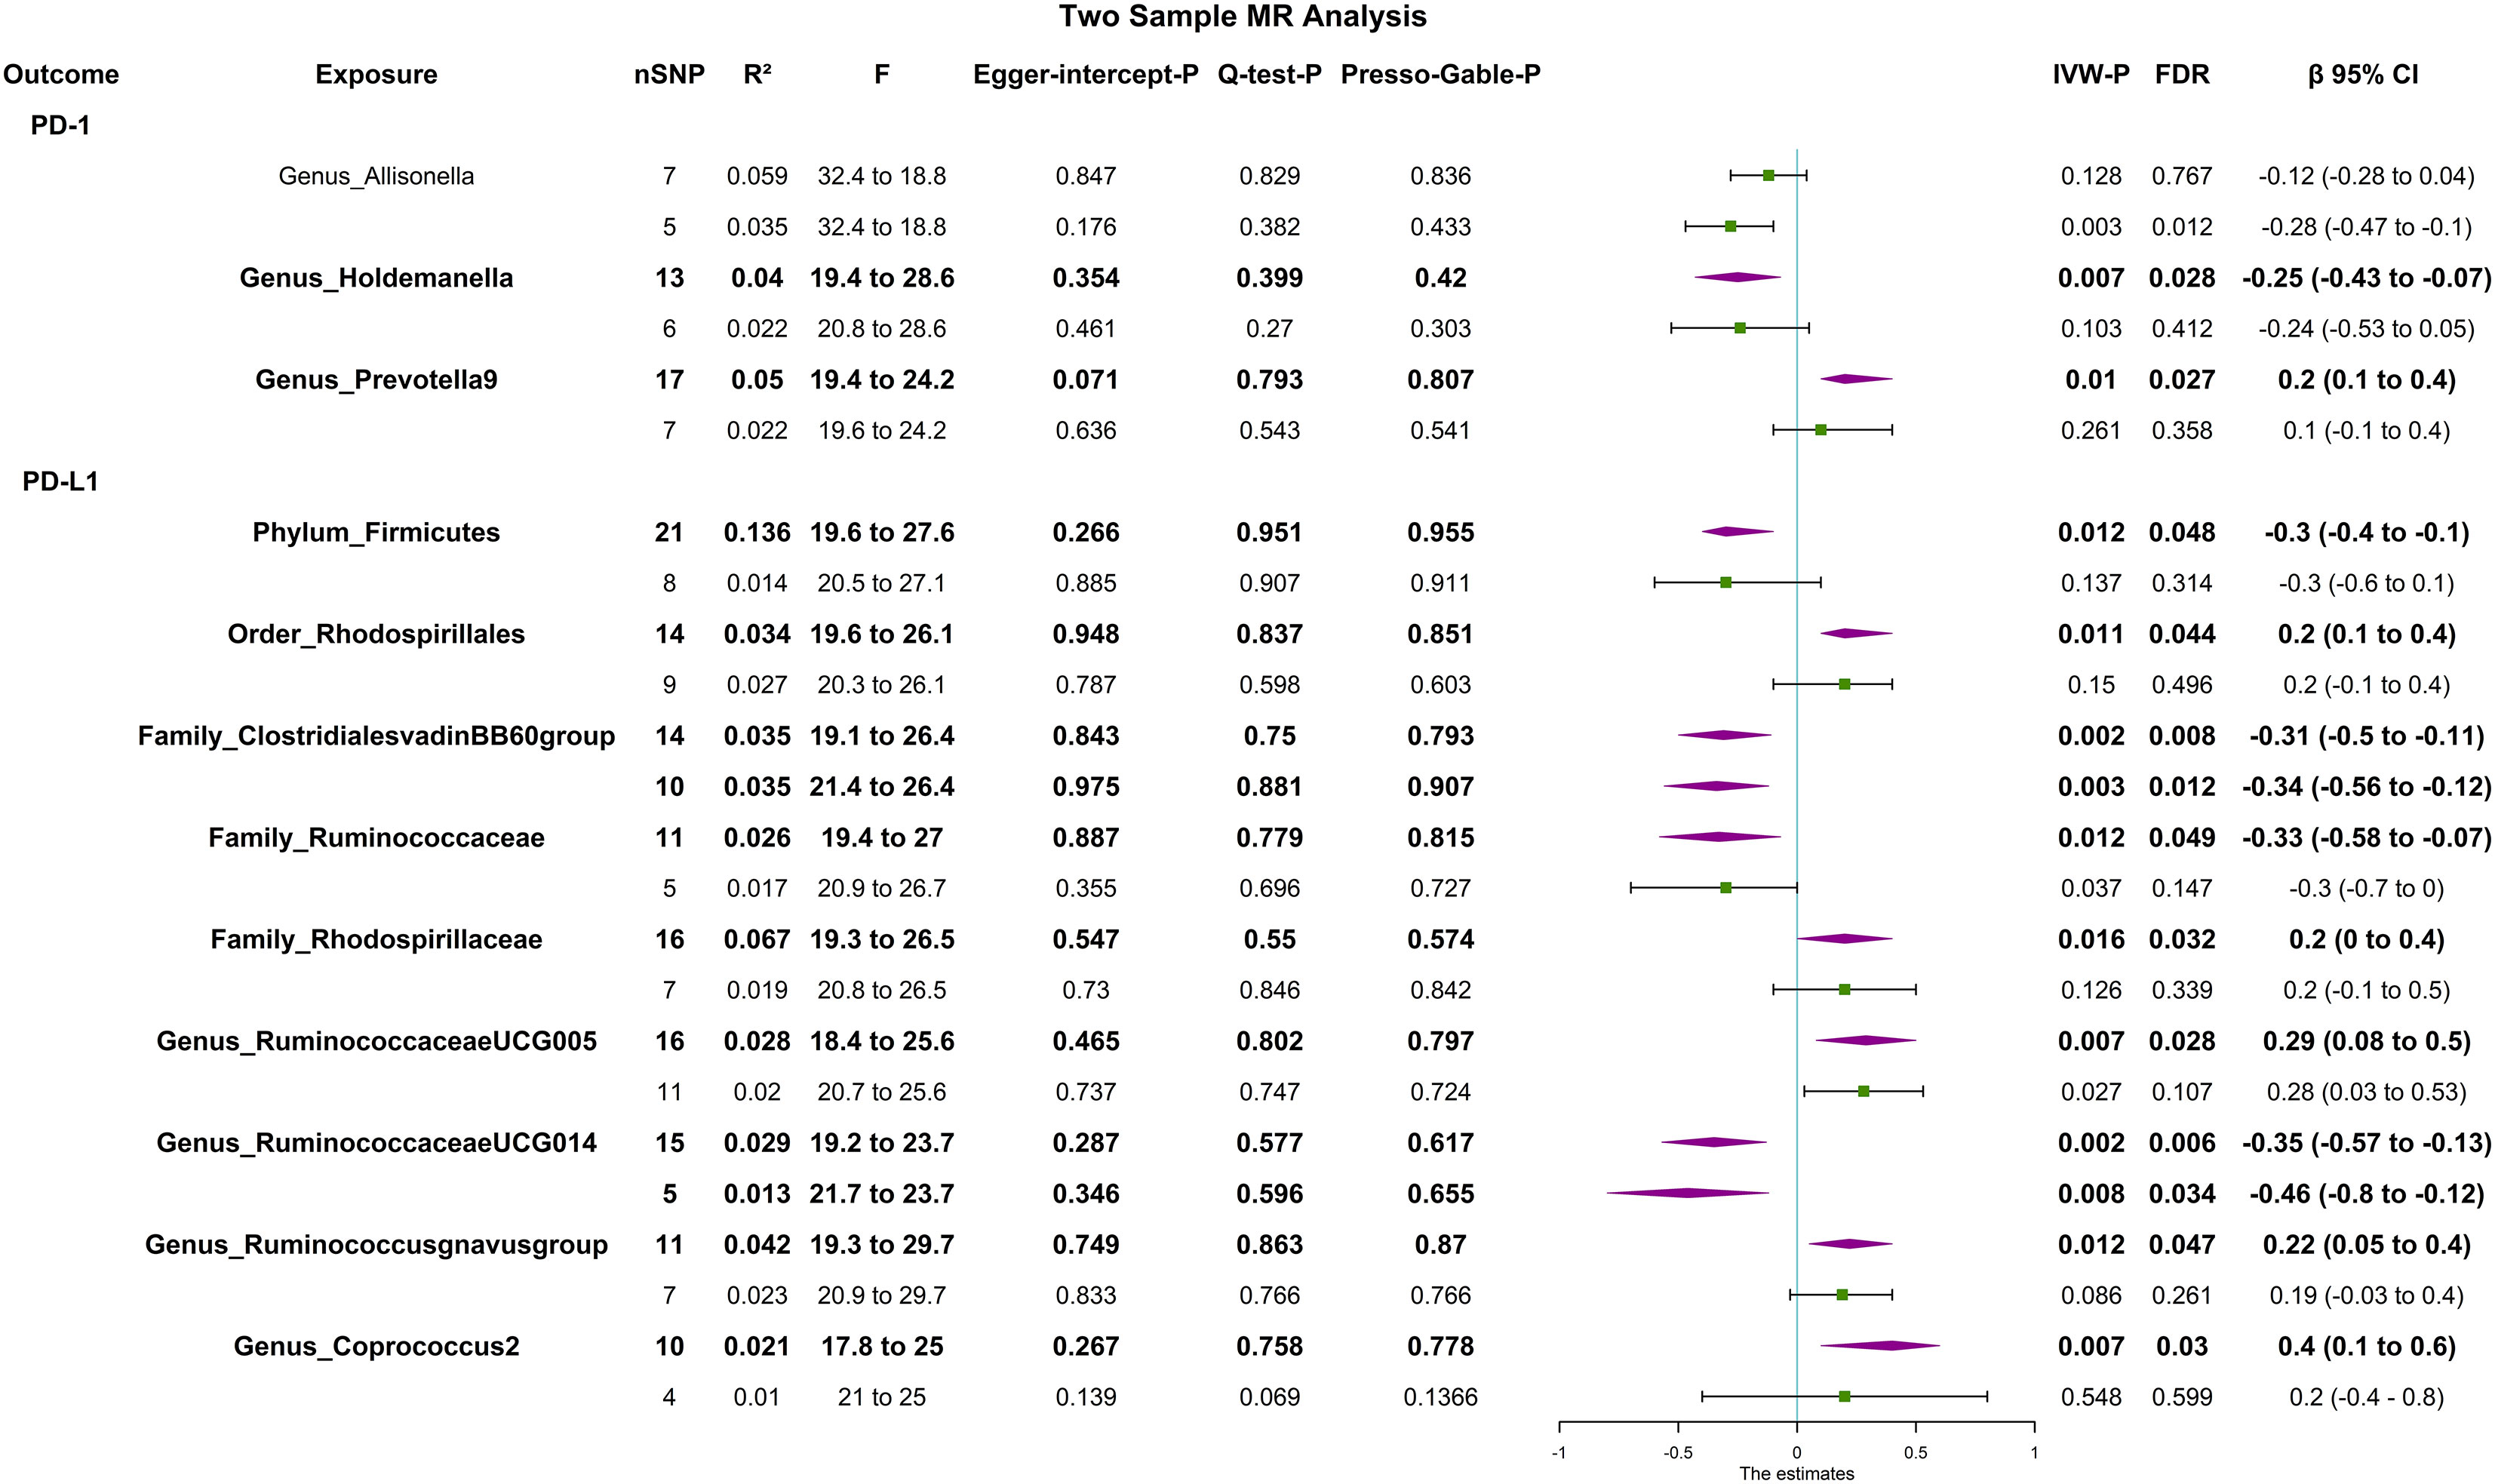
Figure 2 Forest plot of causal relationships estimated and sensitivity analysis for genus-level microbes and PD-1/PD-L1, the significant result (PFDR <0.05) by the IVW method in forward two-sample MR analysis (includes two thresholds). The words in bold type indicate significant results. CI, confidence interval; F, F-statistics; R2, the genetic variants for instrument; IVW, inverse variance weighted.
Univariable reverse MR
In the reverse two-sample MR with the loose threshold (P = 1 × 10⁻⁵, R² = 0.01, window = 10,000), PD-1 was negatively related to genus_Terrisporobacter [βIVW = 0.2; 95% CI (0 to 0.3); PFDR = 0.029], PD-L1 was positively related to family_Peptococcaceae [βIVW = 0.15; 95% CI (0.05 to 0.25); PFDR = 0.019], and PD-L1 was negatively correlated with family_Porphyromonadaceae [βIVW = -0.1; 95% CI (-0.2 to 0); PFDR = 0.017], genus_Odoribacter [βIVW = -0.1; 95% CI (-0.2 to 0); PFDR = 0.022], and genus_Parabacteroides [βIVW = -0.1; 95% CI (-0.18 to -0.02); PFDR = 0.042]. The sensitivity analysis showed no evidence of pleiotropy or heterogeneity. Other taxa in addition to the genera Parabacteroides and Odoribacter had robust results in the leave-one-out analysis (Table 1).
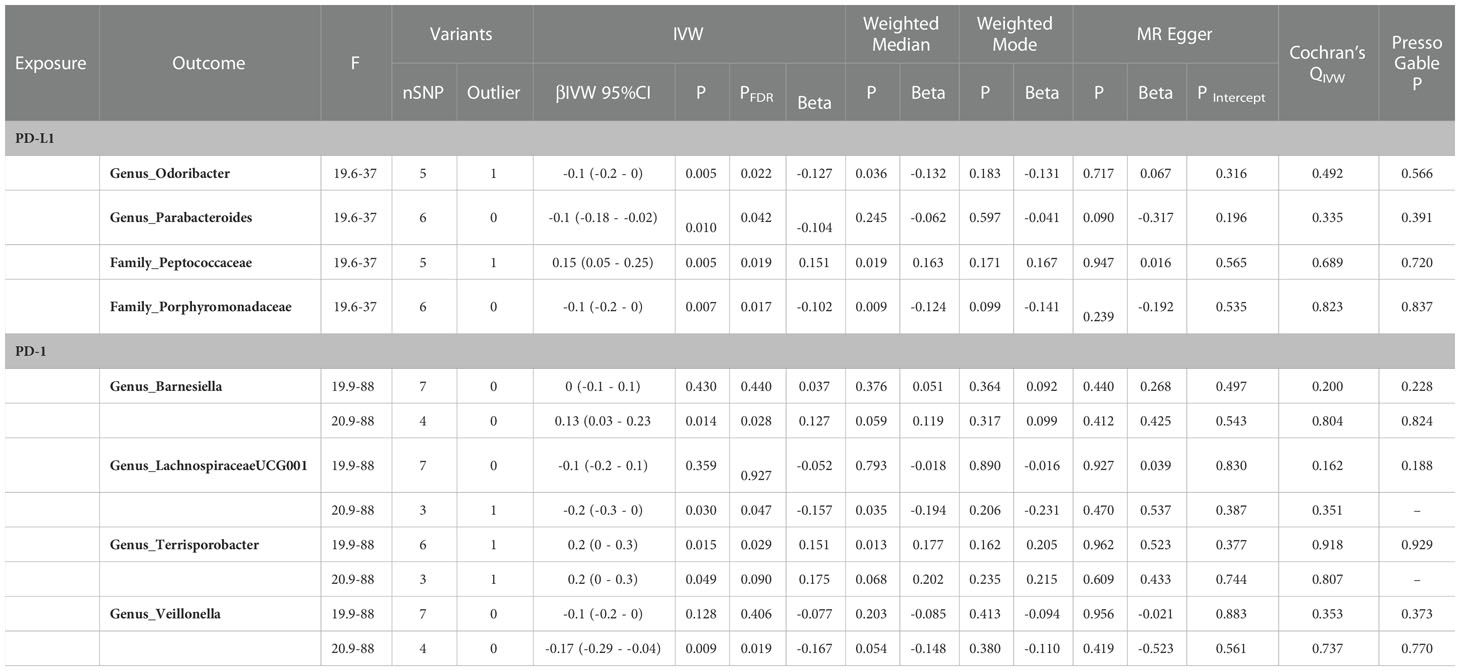
Table 1 Significant microbiota (IVWFDR<0.05) in reverse MR analysis.
The stability of validation MR
To confirm the resulting stability, we conducted strict threshold analyses using the threshold (P = 5 × 10⁻⁶, R² = 0.001, window = 10,000) in bidirectional MR analyses. In forward MR, the family_ClostridialesvadinBB60 group [βIVW = -0.34 95% CI (-0.56 to -0.12); PFDR = 0.012] and genus_RuminococcaceaeUCG014 [βIVW = -0.46; 95% CI (-0.8 to -0.12); PFDR = 0.034] were negatively correlated with PD-L1, through both sensitivity analysis and leave-one-out analysis (Figure 3).
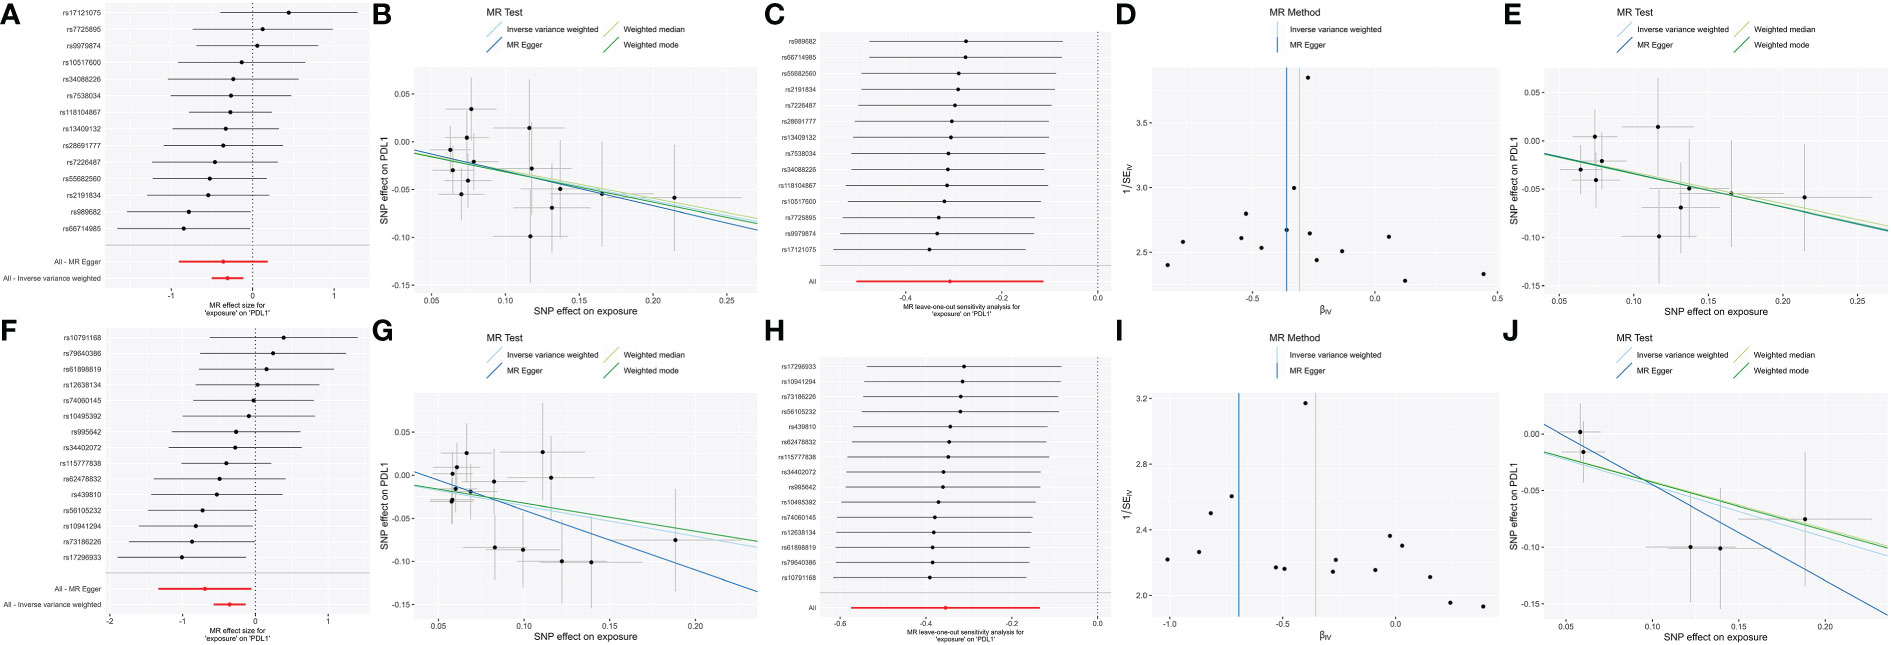
Figure 3 The significant (PFDR <0.05) and robust results (Family_ClostridialesvadinBB60group and Genus_RuminococcaceaeUCG014) in forward MR analysis with two different thresholds. Scatter plot of microbe-related SNP effects on PD-L1, with the slope of each line corresponding to the estimated MR effect per method. Vertical and horizontal black lines around each point show the 95% confidence interval for each polymorphism exposure association and polymorphism outcome association. Forest plot lists single and combined (IVW and MR egger) SNP MR-estimated effect sizes; the effect estimates represent the β for PD-L1 per one-s.d. increase in mean microbes. The one-sided leave-one-out and symmetric funnel plots meant that the results were stable without outliers. Family_Clostridiales_vadin_BB60_group: (A) Forest plot at the loose threshold. (B) MR scatter at the loose threshold. (C) Leave one out at the loose threshold. (D) Funnel plot at the loose threshold. (E) MR scatter at the strict threshold. Genus_Ruminococcaceae_UCG014: (F) Forest plot at the loose threshold. (G) MR scatter at the loose threshold. (H) Leave one out at the loose threshold. (I) Funnel plot at the loose threshold. (J) MR scatter at the strict threshold.
Species-level MR
Species_Parabacteroides_unclassified was positively related to PD-L1 [βIVW = 0.2; 95% CI (0-0.4); PFDR = 0.029], and no causal relationship was found between other genetically determined gut microbes. Species_Parabacteroides_unclassified was identified through sensitivity analysis but did not pass leave-one-out analysis (Figure 4).
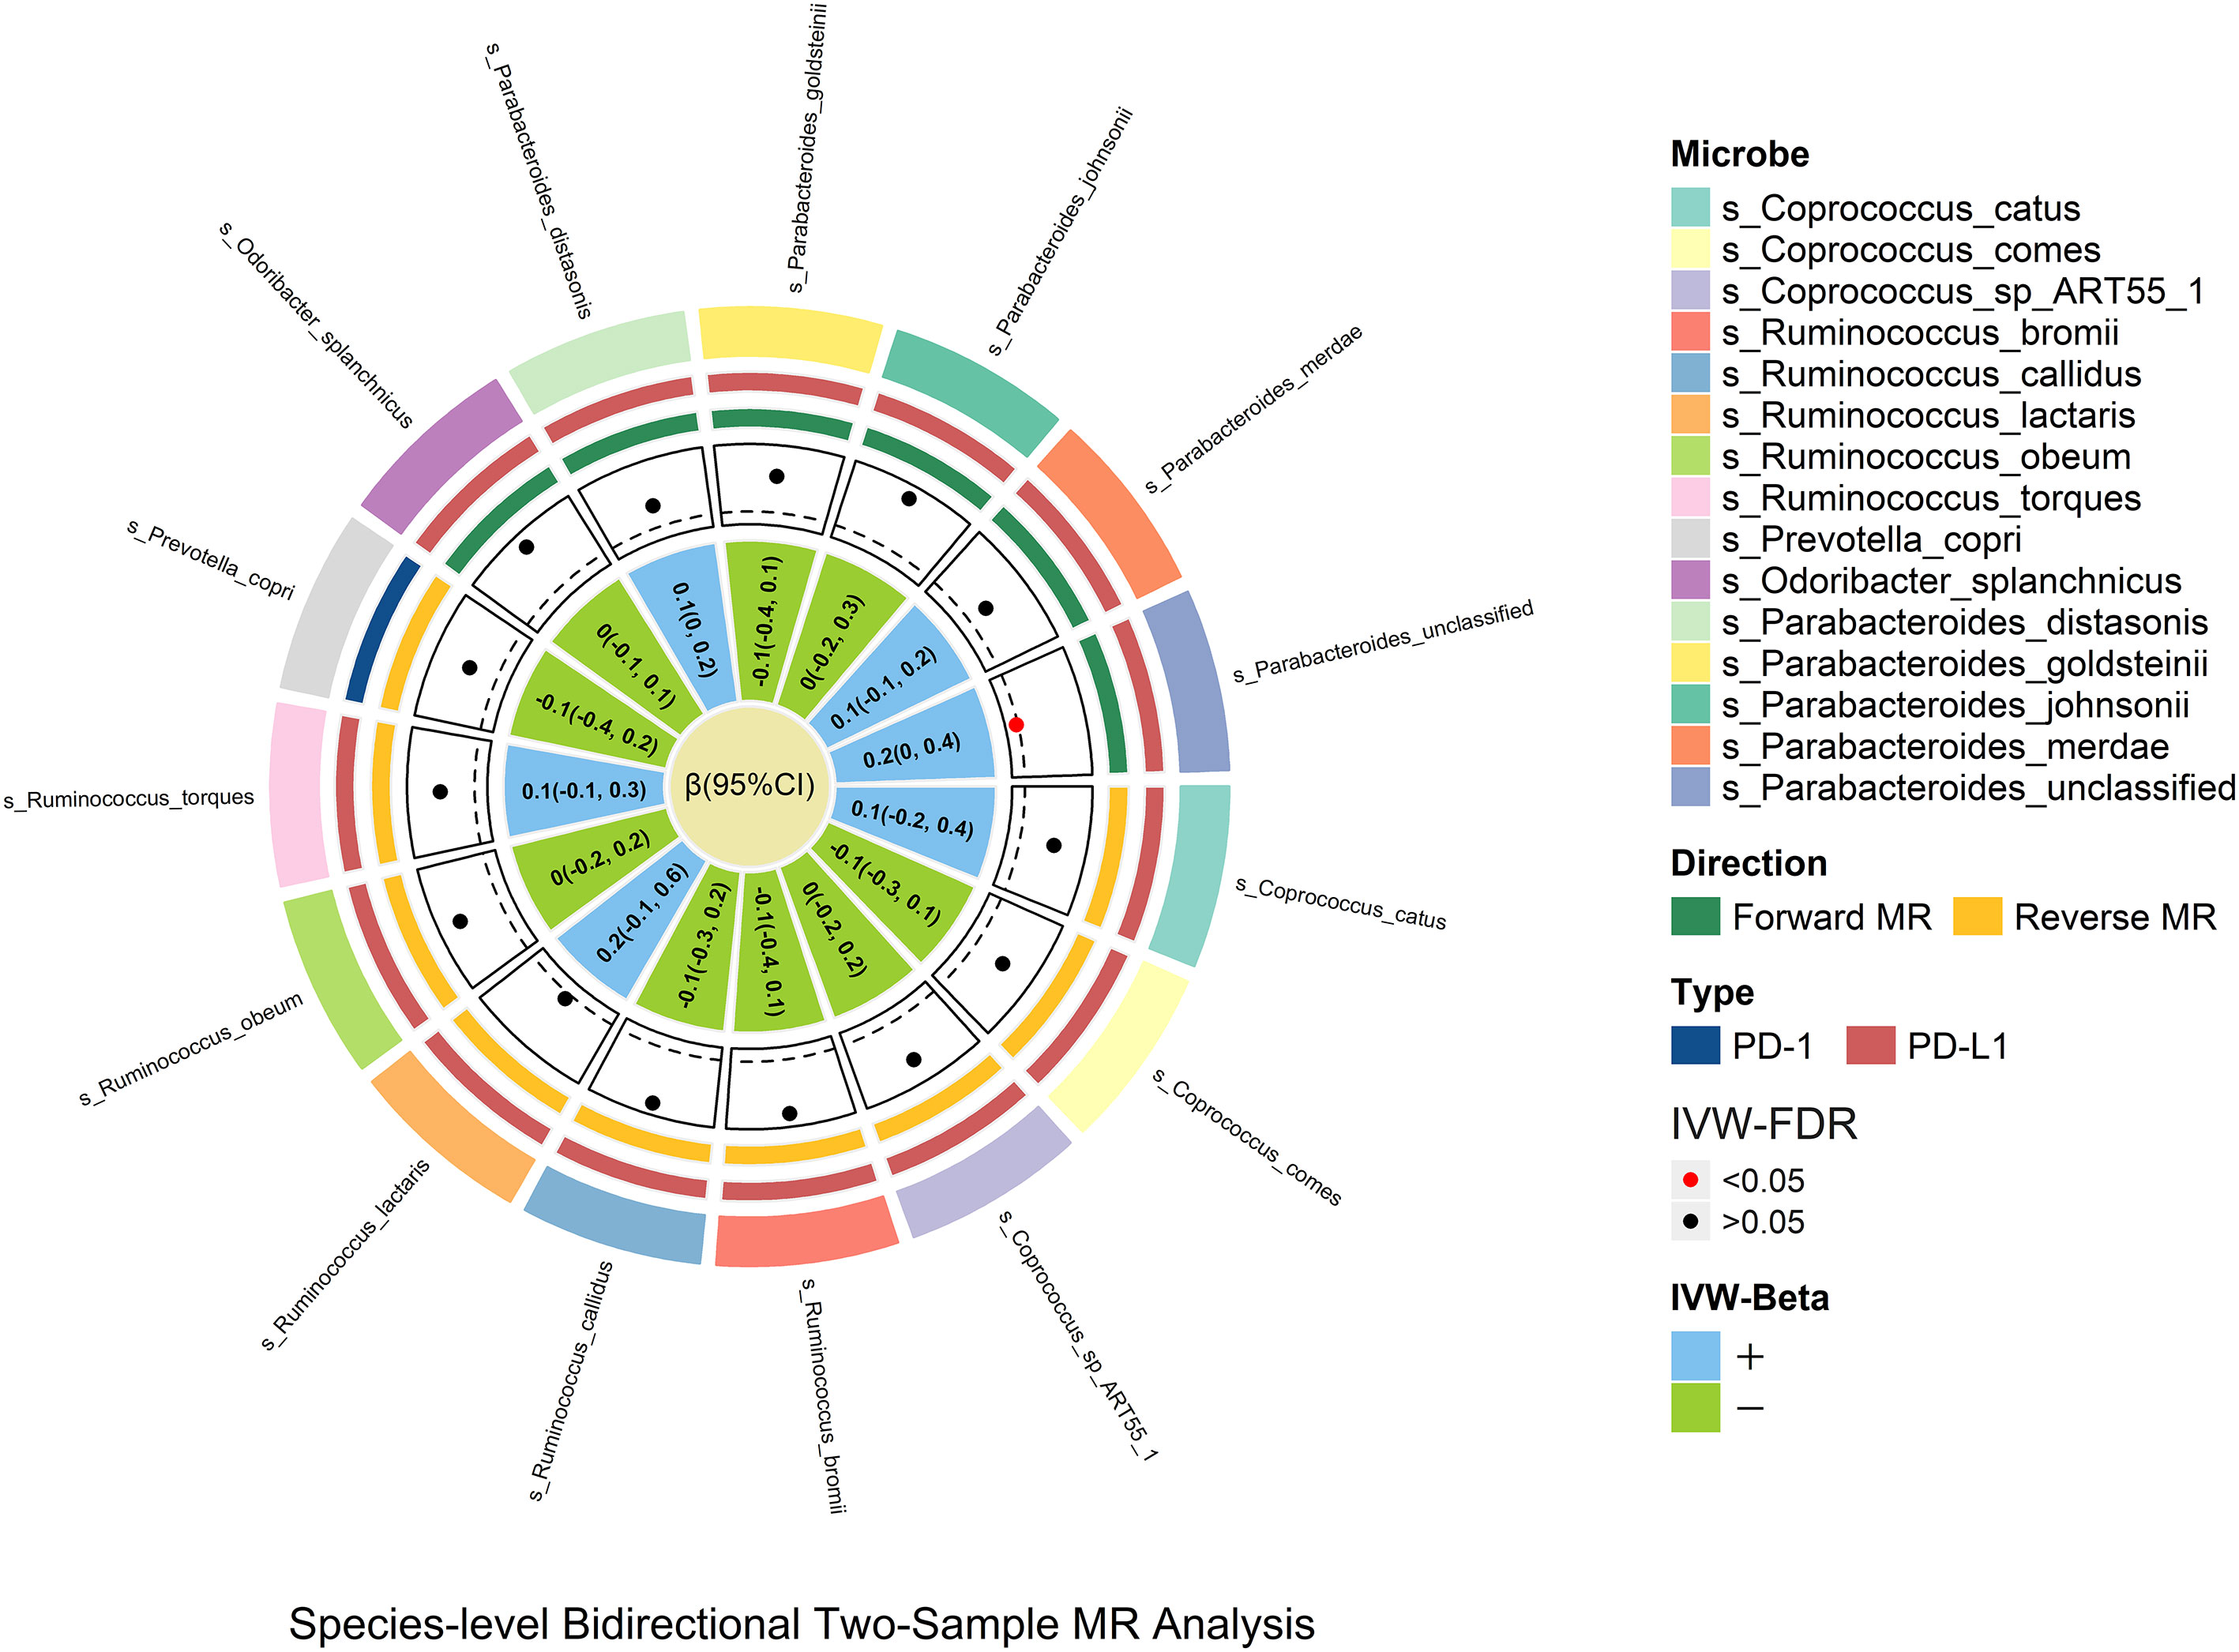
Figure 4 In the species-level bidirectional two-sample MR analysis, microbial features were prefixed with species(s). The selection of species-level microbes is based on the significant result of genus-level microbes. The MR estimates and 95% CI values are shown in the plot. The point of the plot indicates the P value of IVW, and red indicates significance (PFDR <0.05). The “+” and “-” in the legend indicate the direction of the estimate effect (beta).
Discussion
In this work, we revealed associations between the relative abundance of the gut microbiota and the concentration of PD-1/PD-L1 by employing genetic variations as unconfounded proxies. To examine more potential associations and verify the outcome’s dependability, we utilized two alternative thresholds in two-sample bidirectional Mendelian randomization. Moreover, we conducted an expanding MR analysis based on the species-level dataset from another GWAS to explore potential relationships.
Phylum_Firmicutes is the largest of the four bacterial phyla (12), making up approximately 90% of the human genome. We discovered that phylum_Firmicutes reduced the blood’s PD-L1 level at the loose threshold. In the context of ICB therapy, phylum_Firmicutes was identified in a prior study as response-associated (13). Our investigation supports this causal connection. In our work, the family_Ruminococcaceae and family_Clostridiales_Vadin_BB60 group, members of phylum_Firmicutes, both led to decreased PD-L1 levels. A prior study found that family_Ruminococcaceae increased SCFA production (14), CD8 T-cell infiltration into the tumor microenvironment, and effectiveness of anti-PD-L1 therapy against colon cancer in mice (15). It exhibits beneficial effects in various races, malignancies, and geographic areas and has received substantial clinical validation [China; HCC (16);/America; melanoma (12);/America; melanoma (10);]. SCFA production seems to activate T cells against malignant cells and further decrease PD-L1. Famliy_Ruminococcaceae includes genus_Ruminococcaceae_UCG005, genus_Ruminococcaceae_UCG014, and genus_Ruminococcus_gnavus_group. Interestingly, they have varying effects on the PD-L1 level. Although not depicted in the prior investigation, genus_Ruminococcaceae_UCG014 has a detrimental effect on PD-L1 and is confirmed at two distinct thresholds. Genus_Ruminococcus_gnavus_group and genus_Ruminococcaceae_UCG005 exhibited a trend of a positive influence on PD-L1. The genus_Ruminococcus_gnavus group includes iso-bile acid-producing organisms. The iso-bile acid route detoxifies deoxycholic acid, causes DNA damage by the formation of free radicals, and has been linked to multiple cancers (17). It also favors the growth of the important genus_Bacteroides (18). Bacteroides fragilis has a positive association with PD-L1 expression and the PD-1 checkpoint pathway (19). Genus_Ruminococcaceae_UCG005 is abundant and deemed a biomarker taxon in HCC patients with hepatitis B or C virus infection (20) and lung adenocarcinoma patients (21). Genus_Coprococcus_2 is a subspecies of phylum_Firmicutes, and a prior study found that it was enriched in a high-fat-induced liver cancer model in male rats; it produces butyrate (14). SCFAs, such as butyrate or propionate, impact intestinal immunological homeostasis, affecting Tregs, γδ T cells, and effector T cells and participating in immunomodulatory and anti-inflammatory properties (5). However, its use in cancer immunotherapy remains contentious. Both positive and negative impacts are possible (5). Intriguingly, our study also shows that the SCFA producer may have a different effect on cancer, and these effects require further research. Despite the lack of pertinent analysis of family_Clostridiales_Vadin_BB60_group, two different thresholds support it as a protective factor against PD-L1, making it a possible target gut microbe for subsequent investigation. Genus_Holdemanella is a member of the family Erysipelotrichaceae; it produces SCFAs that, in humans, modulate intestinal immune homeostasis (5). Considering that it also lowered the expression of PD-1 in our study, it is possible that it affects PD-1 expression and further prevents immune escape in cancer cells and against cancer. Genus_Prevotella_9 is enriched in patients with advanced, unresectable hepatocellular carcinoma, according to a study (22). Curiously, another study revealed that genus_Prevotella_9 is deficient in bladder cancer tissue (23). Since genus_Prevotella_9 promoted PD-1 in our study, it may have various effects on different tumors, and its function requires further study. Studies on the relevance of order_ Rhodospirillales and family_Rhodospirillaceae to the human body are lacking, and additional investigation is required to investigate their potential relationship with the human immune system.
Early research shows that genus_Parabacteroides in colorectal cancer (CRC) (24) and early HCC versus cirrhosis (25) has the potential to become a biomarker, and we found that PD-L1 has a negative correlation with it. Genus_Odoribacter, a butyrate producer, has been found at lower levels in patients with breast cancer and rectal carcinoma (26), and it is essential in several related taxonomic models of CRC (27). Bacteroidetes (phylum) includes genus_Odoribacter and genus_Parabacteroides. Genus_Odoribacter is positively involved in non-ribosomal peptide structures and negatively involved in the metabolism of phenylalanine and cyanoamino acids. Family_Porphyromonadaceae has been identified as a potential biomarker for CRC recurrence and patient prognosis (28); case-control study results showed that healthy controls had a higher relative abundance of family_Porphyromonadaceae than primary liver cancer patients (29), and combined analysis with our study confirmed its potential as a biomarker in cancer. Family_ Peptococcaceae and genus_Terrisporobacter have been lacking in studies of the human immune system, so it is possible that we found microbes that can be applied as new biomarkers for PD-1/PD-L1 therapy or precancerous diagnosis.
In the species-level study, only species_Parabacteroides_unclassified demonstrated significant species-level verification results; it is possible that this is due to the lack of complete related species-level GWAS data and the variability of different region samples.
Overall, we demonstrated the potential causal relationships between microbiomes and PD-1/PD-L1. We have not found any similar research that has been published previously. This study expands the possibility of antineoplastic therapy and immunotherapy. We expanded the study to the species level, which enhanced the comprehensiveness of this study. We used two different thresholds in the MR analysis. First, the loose threshold widely used in the previous study allowed more potential microbes to be analyzed. Its significant result included many microbes considered as impact factors in a relevant ICB therapy study, which improves the credibility of this analysis. The strict threshold is approximated with the traditional MR threshold setting. Combining its result with the result of loose thresholds, we found two microbes that were never identified as impact factors for ICB therapy in a prior study. The newly identified microbiota will require further study. In reverse MR analysis, we investigated several microbes that can potentially be biomarkers in cancer therapy. Our study has a few limitations. First, while utilizing the largest single-cohort multiethnic GWAS to date, the sample size was quite limited and requires expansion, similar to prior research on the heritability of the microbiome (7, 30). Traditional GWAS and MR research frequently employ cohorts with hundreds of thousands of people, thereby enhancing power and lowering false associations; because of the low power and small sample sizes, many legitimate signals were unlikely to reach statistical significance at the study-wide level. Second, the GWAS we used to conduct MR combines many races, although the majority of individuals were of European descent (>72.3%). However, mixed races inevitably introduce bias into the results. Third, the heterogeneity of the makeup of the gut microbiota also results in a loss of strength. Similar to all research on the human gut microbiota, the sample variation is substantial, so its effect on the predicted heritability should not be overestimated.
Method
In our study, two-sample bidirectional MR analysis was undertaken at two distinct thresholds to determine the causal relationship between PD-1/PD-L1 and the gut microbiota. We utilized two distinct thresholds: one to explore the possibility of a relation and the other to validate the precision of the test (Figure 5).
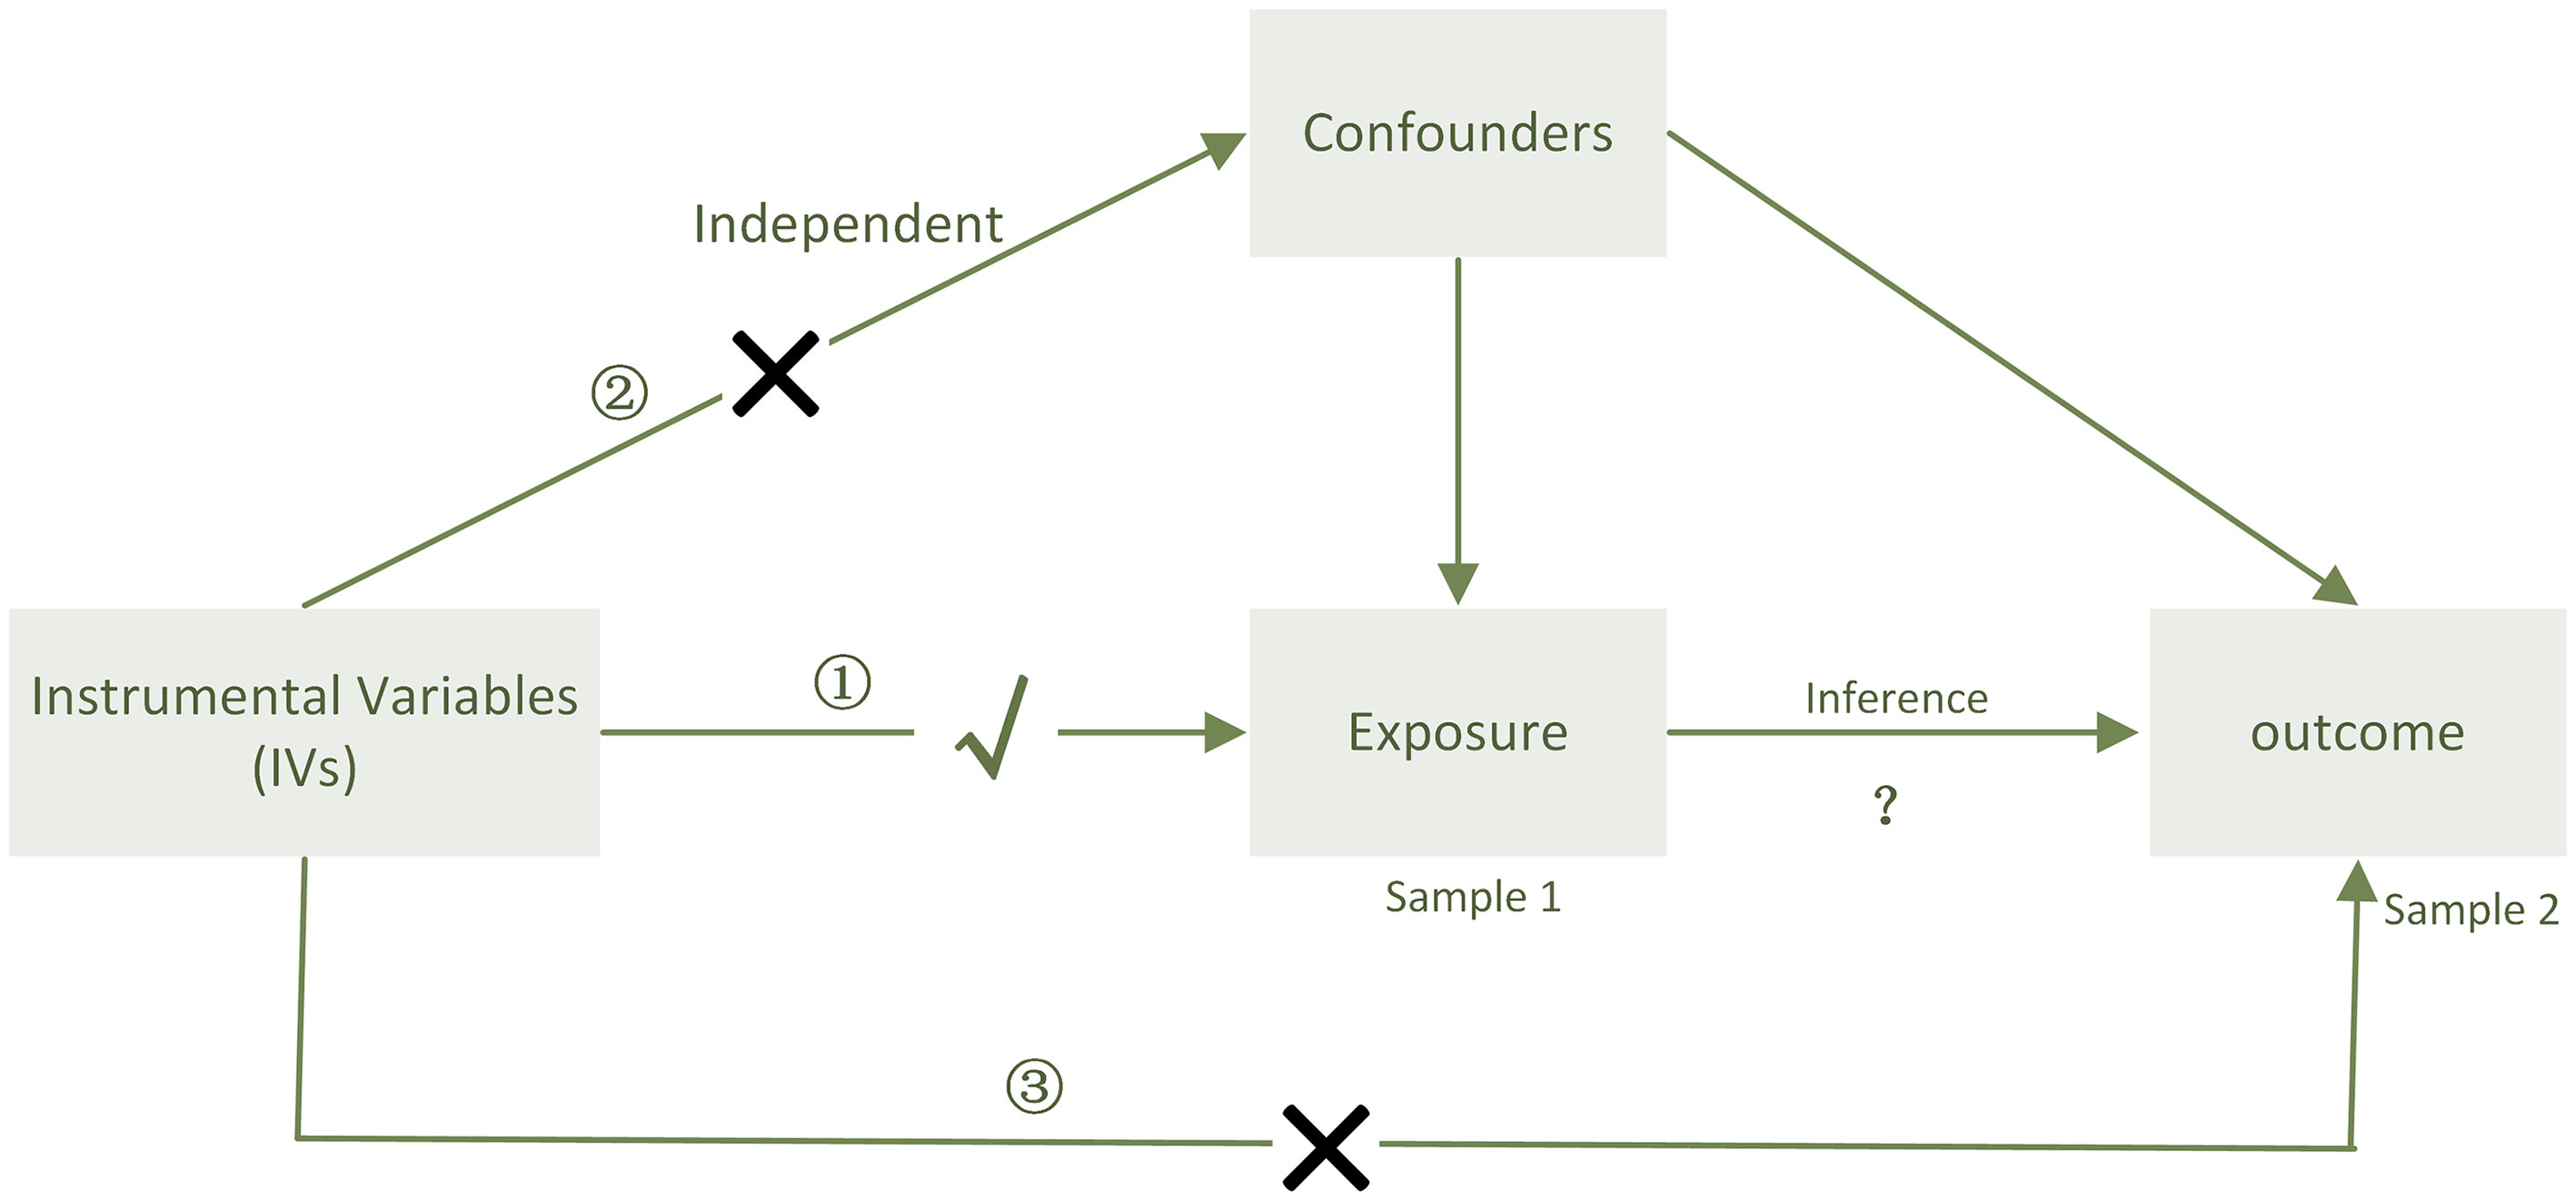
Figure 5 When sample 1(exposure) and sample 2(outcome) are used for causal estimates in MR inference, three assumptions must be satisfied (11). ① Relevance assumption: the genetic variations are highly related to the exposure, ② independence assumption: the genetic variants are not associated with any putative confounder of the association between exposure and result, and ③ exclusion restriction: the variants do not alter the outcome independently of exposure.
Data sources and methods
This study relied on publicly accessible summary-level data; ethical approval was acquired for all original investigations.
Gut microbiota
Genetic variants of the gut microbiota were found in a large-scale association study involving 24 cohorts (18,340 participants) (7). Populations from Canada, the USA, Israel, South Korea, Denmark, Germany, the Netherlands, Belgium, Sweden, the UK, Finland, and Denmark were included in the cohorts. Twenty cohorts had samples of single ancestry, and most subjects (16 cohorts, N = 13,266) were of European ancestry. In 17 (n = 13,804) of the 24 cohorts, the participants’ mean ages ranged between 50 and 62. The microbiome quantitative trait locus (mbQTL) mapping study for each cohort only included taxa present in >10% of the samples, totaling 211 taxa (131 genera, 35 families, 20 orders, 16 classes, and 9 phyla). The study of binary trait locus mapping (mbQTL) covered the taxa that comprised 10%–90% of the included samples. There were 196 taxa included in our analysis (excluding 15 taxa that cannot be definitively classified and named) Strain Categorization, the microbiota that we take into analysis (phylum-level to genus-level) listed in Supplemental Figure 5.
For species-level analysis, we used another GWAS dataset that included 7,738 Dutch Microbiome Project (DMP) participants whose microbiota data were quality-controlled with LifeLines (30). A total of 58.1% of its members were women, and their ages ranged from 8 to 84 years (mean, 48.5 years). Data from 15 subordinate species taxa, whose genera were confirmed as significant (IVWFDR <0.05) in the MiBioGen GWAS, were included in our study.
PD-1 and PD-L1
We identified genetic predictors of cis-protein quantitative trait loci [cis-pQTLs] of PD-L1 based on summary statistics from the INTERVAL study, which recruited 3,301 healthy participants of European descent with an average age of 44 years and 48.9% women (31). Concerning trans-pQTLs, the functional genetic variations influence protein abundance with little or no attenuated effect on messenger RNA or ribosome levels (31, 32).
Selection of the instrumental genetic factors
In the MR investigation of the link between the microbiota and PD1/PD-1, two thresholds were used to choose the IVs. For MR, the genetic variations that were representative of the microbiota trait were required to be sufficient; therefore, we decided on a locus-wide significance threshold P = 1 × 10⁻⁵ (7, 30), which was commonly utilized in prior microbe MR analyses, clustered for independence using PLINK in the two-sample MR tool (33) and the 1000 Genomes European data as the reference panel, using a looser cutoff of R2 < 0.01 and a window of 10,000-kb clumping. Another set of SNPs was fewer than the generally used threshold of 5 × 10⁻⁶ for emphasizing “suggestive” genetic variants (34) and clustering under the tighter cutoff of R2 < 0.001 and a 10,000-kb window. We supplemented the effect of allele frequency prior to clumping using data from the 3DSNP database (35). To avoid any confounding, we queried each SNP in the PhenoScanner database (36) for any past associations (P = 5 × 10⁻⁸) with probable confounders (that is, cancer and tumors).
In the MR investigation of the association between PD1/PD-1 and the microbiota, we selected pQTLs associated with genetically predicted PD-L1 or PD-1 from the INTERVAL study of the log-transformed relative fluorescence unit [log(RFU)] using the same threshold as described before. To limit random variability, only annotated pQTLs [i.e., those with proper identification and description (37)] from the RegulomeDB database were included. We selected cis-pQTLs by eliminating pQTLs that express quantitative trait loci (eQTLs) (32) from the RegulomeDB and VannoPortal databases (38, 39).
The effects of SNPs on exposure and outcome were then harmonized to ensure that the β values were signed for the identical alleles. After harmonizing the data, we eliminated SNPs with intermediate allele frequencies (>0.42). Radial-MR (40)and MR-PRSSO (41)were also performed to identify IVs with the best contribution to heterogeneity (alpha = 0.05/nSNP) and hence identify probable outliers. These outliers were removed from the IVs. Radial-MR was also utilized to determine whether the independence and exclusion restriction assumptions were violated. We eliminated the trait combination from the analysis for IVs < 3, and the MR analysis was conducted using the remaining SNPs.
Testing instrument robustness and statistical validity
In the initial proteomic GWAS, it was found that the sentinel cis-pQTL explained 2% of the variation in circulating programmed death-1-ligand 2 levels (31). Using the web MR power calculation tool (42)(https://sb452.shinyapps.io/power/), when the causal effect achieves 0.345, there is 80% power if all detected cis-pQTLs explain 2% of the variation in PD-L1. The individual SNP effect size was estimated as the explainable variance with the formula [2 f(1 − f)β2], where f is the allele frequency and β is the regression coefficient (43). The formula [F statistic = beta2/se2] was used to calculate the F statistic (44). If the F statistic was ≥ 10, it implied a low probability of instrument bias in MR analysis (45).
Statistical analysis
Cochran’s Q statistic was employed to assess the heterogeneity of the IVW meta-analysis; P < 0.10 indicates significant heterogeneity in the SNP effect estimates. When all IVs are valid instruments, the IVW method provides the most accurate estimate of the causal effect. However, because there are so few variants, the heterogeneity between the variant-specific estimates cannot be reliably estimated (11). Therefore, we conducted both random-effects IVW and fixed-effects IVW. When SNP >4 or without heterogeneity, we used random-effects IVW as the primary method; otherwise, we used fixed-effects IVW. The IVW method aggregated the Wald ratio estimates of each SNP into a single causal estimate for each risk factor, with each estimate derived by dividing the SNP–outcome association by the SNP–exposure association (46). The results of the IVW test with a P threshold corrected by FDR (PFDR) <0.05 are classified as significant. Considering that the FDR corrected by the number of microbes would be too stringent, we corrected the P threshold by the number of MR analysis methods. Since the IVW estimates can be biased if pleiotropic IVs are introduced, a series of sensitivity analyses were conducted to account for pleiotropy in the causal estimates. We examined the probable presence of horizontal pleiotropy using MR-Egger regression based on its intercept term, where the divergence from zero (P < 0.05) was interpreted as evidence of the presence of directional pleiotropic bias (47). In the presence of horizontal pleiotropy, the slope coefficient from MR-Egger regression provides a reliable estimate of the causal influence. As sensitivity analyses, we also conducted MR-Egger, weighted median, and weighted mode analyses based on varying hypotheses. Briefly, MR-Egger generally adheres to the Instrument Strength Independent of Direct Effect (InSIDE) and negligible measurement error (NOME) assumptions (47, 48). The weighted median method assumes that at least half of the instruments are valid (the weighted median method assumes the causal effect from the median of the weighted empirical density function of individual SNP effect estimates and permits up to 50% of information from variants to violate MR assumptions in the presence of horizontal pleiotropy) (49). The mode method is assumed to apply to the vast majority of genetic instruments (clusters the SNPs based on the similarity of causal effects and estimates the causal effect on the basis of the cluster with the most significant number of SNPs, thus providing an unbiased estimate if the SNPs contributing to the largest cluster are valid) (50). Leave-one-out analysis was performed to determine the impact of individual variations on the observed connections.
Data availability statement
The original contributions presented in the study are included in the article/Supplementary Materials. Further inquiries can be directed to the corresponding author.
Author contributions
Y-FH and G-XL conceived and designed the research. Y-FH analyzed the data and wrote the paper. W-MZ, Z-SW, HH, Q-YM, D-LS, LH, Y-YH and S-KN assisted in completing this research. All authors contributed to the article and approved the submitted version.
Funding
This work was sponsored by grants from the Guangxi Natural Science Foundation (No.2020GXNSFAA297109), Scientific Research and Technology Development plan project of Wuming District, Nanning (No. 20190405), Basic Ability Enhancement Project of Young Teachers in Guangxi Zhuang Autonomous Region (No. 2022KY0075), and Guangxi Health Commission’s self-financing project (No. Z20190748).
Acknowledgments
We thank all the consortium studies for making the summary association statistics data publicly available.
Conflict of interest
The authors declare that the research was conducted in the absence of any commercial or financial relationships that could be construed as a potential conflict of interest.
Publisher’s note
All claims expressed in this article are solely those of the authors and do not necessarily represent those of their affiliated organizations, or those of the publisher, the editors and the reviewers. Any product that may be evaluated in this article, or claim that may be made by its manufacturer, is not guaranteed or endorsed by the publisher.
Supplementary material
The Supplementary Material for this article can be found online at: https://www.frontiersin.org/articles/10.3389/fimmu.2023.1136169/full#supplementary-material
Abbreviations
ICB, immune checkpoint blockade; cis-pQTLs, cis protein quantitative trait loci; CI, confidence interval; eQTLs, expression quantitative trait loci; GWAS, genome-wide association study; MR, Mendelian randomization; PD-1, programmed death protein-1; PD-L1, programmed death-ligand 1; RFU, relative fluorescent unit; HCC, hepatocellular carcinoma; SCFA, short-chain fatty acids; CRC, colorectal cancer; DMP, Dutch Microbiome Project
References
1. Hodi FS, O'day SJ, Mcdermott DF, Weber RW, Sosman JA, Haanen JB, et al. Improved survival with ipilimumab in patients with metastatic melanoma. N Engl J Med (2010) 363(8):711–23. doi: 10.1056/NEJMoa1003466
2. Boussiotis VA. Molecular and biochemical aspects of the PD-1 checkpoint pathway. N Engl J Med (2016) 375(18):1767–78. doi: 10.1056/NEJMra1514296
3. Dong H, Strome SE, Salomao DR, Tamura H, Hirano F, Flies DB, et al. Tumor-associated B7-H1 promotes T-cell apoptosis: A potential mechanism of immune evasion. Nat Med (2002) 8(8):793–800. doi: 10.1038/nm730
4. Wherry EJ, Kurachi M. Molecular and cellular insights into T cell exhaustion. Nat Rev Immunol (2015) 15(8):486–99. doi: 10.1038/nri3862
5. Davar D, Zarour HM. Facts and hopes for gut microbiota interventions in cancer immunotherapy. Clin Cancer Res (2022) 28(20):4370–84. doi: 10.1158/1078-0432.CCR-21-1129
6. Matson V, Fessler J, Bao R, Chongsuwat T, Zha Y, Alegre M-L, et al. The commensal microbiome is associated with anti-PD-1 efficacy in metastatic melanoma patients. Science (2018) 359(6371):104–8. doi: 10.1126/science.aao3290
7. Kurilshikov A, Medina-Gomez C, Bacigalupe R, Radjabzadeh D, Wang J, Demirkan A, et al. Large-Scale association analyses identify host factors influencing human gut microbiome composition. Nat Genet (2021) 53(2):156–65. doi: 10.1038/s41588-020-00763-1
8. Metwaly A, Reitmeier S, Haller D. Microbiome risk profiles as biomarkers for inflammatory and metabolic disorders. Nat Rev Gastroenterol Hepatol (2022) 19(6):383–97. doi: 10.1038/s41575-022-00581-2
9. Kroemer G, Zitvogel L. Cancer immunotherapy in 2017: The breakthrough of the microbiota. Nat Rev Immunol (2018) 18(2):87–8. doi: 10.1038/nri.2018.4
10. Gopalakrishnan V, Spencer CN, Nezi L, Reuben A, Andrews MC, Karpinets TV, et al. Gut microbiome modulates response to anti-PD-1 immunotherapy in melanoma patients. Science (2018) 359(6371):97–103. doi: 10.1126/science.aan4236
11. Burgess S, Davey Smith G, Davies NM, Dudbridge F, Gill D, Glymour MM, et al. Guidelines for performing mendelian randomization investigations. Wellcome Open Res (2019) 4:186. doi: 10.12688/wellcomeopenres.15555.1
12. Matsuoka K, Kanai T. The gut microbiota and inflammatory bowel disease. Semin Immunopathol (2015) 37(1):47–55. doi: 10.1007/s00281-014-0454-4
13. Routy B, Le Chatelier E, Derosa L, Duong CPM, Alou MT, Daillère R, et al. Gut microbiome influences efficacy of PD-1-based immunotherapy against epithelial tumors. Science (2018) 359(6371):91–7. doi: 10.1126/science.aan3706
14. Vital M, Karch A, Pieper DH. Colonic butyrate-producing communities in humans: an overview using omics data. Msystems (2017) 2(6). doi: 10.1128/mSystems.00130-17
15. Jing N, Wang L, Zhuang H, Jiang G, Liu Z. Ultrafine jujube powder enhances the infiltration of immune cells during anti-PD-L1 treatment against murine colon adenocarcinoma. Cancers (Basel) (2021) 13(16):3987. doi: 10.3390/cancers13163987
16. Mao J, Wang D, Long J, Yang X, Lin J, Song Y, et al. Gut microbiome affects the response to anti-PD-1 immunotherapy in patients with hepatocellular carcinoma. J Immunother Cancer (2019) 7(1):193. doi: 10.1186/s40425-019-0650-9
17. Yoshimoto S, Loo TM, Atarashi K, Kanda H, Sato S, Oyadomari S, et al. Obesity-induced gut microbial metabolite promotes liver cancer through senescence secretome. Nature (2013) 499(7456):97–101. doi: 10.1038/nature12347
18. Devlin AS, Fischbach MA. A biosynthetic pathway for a prominent class of microbiota-derived bile acids. Nat Chem Biol (2015) 11(9):685–90. doi: 10.1038/nchembio.1864
19. Zhang J, He Y, Xia L, Yi J, Wang Z, Zhao Y, et al. Expansion of colorectal cancer biomarkers based on gut bacteria and viruses. Cancers (Basel) (2022) 14(19):4662. doi: 10.3390/cancers14194662
20. Komiyama S, Yamada T, Takemura N, Kokudo N, Hase K, Kawamura YI, et al. Profiling of tumour-associated microbiota in human hepatocellular carcinoma. Sci Rep (2021) 11(1):10589. doi: 10.1038/s41598-021-89963-1
21. Wang S, Chen H, Yang H, Zhou K, Bai F, Wu X, et al. Gut microbiome was highly related to the regulation of metabolism in lung adenocarcinoma patients. Front Oncol (2022) 12:790467. doi: 10.3389/fonc.2022.790467
22. Lee PC, Wu CJ, Hung YW, Lee CJ, Chi C-T, Lee I-C, et al. Gut microbiota and metabolites associate with outcomes of immune checkpoint inhibitor-treated unresectable hepatocellular carcinoma. J Immunother Cancer (2022) 10(6). doi: 10.1136/jitc-2022-004779
23. Liu F, Liu A, Lu X, Zhang Z, Xue Y, Xu J, et al. Dysbiosis signatures of the microbial profile in tissue from bladder cancer. Cancer Med (2019) 8(16):6904–14. doi: 10.1002/cam4.2419
24. Yang M, Yang H, Ji L, Hu X, Tian G, Wang B, et al. A multi-omics machine learning framework in predicting the survival of colorectal cancer patients. Comput Biol Med (2022) 146:105516. doi: 10.1016/j.compbiomed.2022.105516
25. Ren Z, Li A, Jiang J, Zhou L, Yu Z, Lu H, et al. Gut microbiome analysis as a tool towards targeted non-invasive biomarkers for early hepatocellular carcinoma. Gut (2019) 68(6):1014–23. doi: 10.1136/gutjnl-2017-315084
26. Bobin-Dubigeon C, Luu HT, Leuillet S, Lavergne SN, Carton T, Le Vacon F, et al. Faecal microbiota composition varies between patients with breast cancer and healthy women: A comparative case-control study. Nutrients (2021) 13(8):2705. doi: 10.3390/nu13082705
27. Young C, Wood HM, Seshadri RA, Van Nang P, Vaccaro C, Melendez LC, et al. The colorectal cancer-associated faecal microbiome of developing countries resembles that of developed countries. Genome Med (2021) 13(1):27. doi: 10.1186/s13073-021-00844-8
28. Huo RX, Wang YJ, Hou SB, Wang W, Zhang C-Z, Wan X-H, et al. Gut mucosal microbiota profiles linked to colorectal cancer recurrence. World J Gastroenterol (2022) 28(18):1946–64. doi: 10.3748/wjg.v28.i18.1946
29. Ma J, Li J, Jin C, Yang J, Zheng C, Chen K, et al. Association of gut microbiome and primary liver cancer: A two-sample mendelian randomization and case-control study. Liver Int (2022) 43(1):221–233. doi: 10.1111/liv.15466
30. Lopera-Maya EA, Kurilshikov A, Van Der Graaf A, Hu S, Andreu-Sánchez S, Chen L, et al. Effect of host genetics on the gut microbiome in 7,738 participants of the Dutch microbiome project. Nat Genet (2022) 54(2):143–51. doi: 10.1038/s41588-021-00992-y
31. Sun BB, Maranville JC, Peters JE, Stacey D, Staley JR, Blackshaw J, et al. Genomic atlas of the human plasma proteome. Nature (2018) 558(7708):73–9. doi: 10.1038/s41586-018-0175-2
32. Battle A, Khan Z, Wang SH, Mitrano A, Ford MJ, Pritchard JK, et al. Genomic variation. impact of regulatory variation from RNA to protein. Science (2015) 347(6222):664–7. doi: 10.1126/science.1260793
33. Purcell S, Neale B, Todd-Brown K, Thomas L, Ferreira MAR, Bender D, et al. PLINK: a tool set for whole-genome association and population-based linkage analyses. Am J Hum Genet (2007) 81(3):559–75. doi: 10.1086/519795
34. Manolio TA. Genomewide association studies and assessment of the risk of disease. N Engl J Med (2010) 363(2):166–76. doi: 10.1056/NEJMra0905980
35. Quan C, Ping J, Lu H, Zhou G, Lu Y. 3DSNP 2.0: update and expansion of the noncoding genomic variant annotation database. Nucleic Acids Res (2022) 50(D1):D950–d5. doi: 10.1093/nar/gkab1008
36. Kamat MA, Blackshaw JA, Young R, Surendran P, Burgess S, Danesh J, et al. Phenoscanner V2: an expanded tool for searching human genotype-phenotype associations. Bioinformatics (2019) 35(22):4851–3. doi: 10.1093/bioinformatics/btz469
37. Frankish A, Carbonell-Sala S, Diekhans M, Jungreis I, Loveland JE, Mudge JM, et al. GENCODE reference annotation for the human and mouse genomes. Nucleic Acids Res (2019) 47(D1):D766–d73. doi: 10.1093/nar/gky955
38. Huang D, Zhou Y, Yi X, Fan X, Wang J, Yao H, et al. Vannoportal: multiscale functional annotation of human genetic variants for interrogating molecular mechanism of traits and diseases. Nucleic Acids Res (2022) 50(D1):D1408–d16. doi: 10.1093/nar/gkab853
39. Boyle AP, Hong EL, Hariharan M, Cheng Y, Schaub MA, Kasowski M, et al. Annotation of functional variation in personal genomes using regulomedb. Genome Res (2012) 22(9):1790–7. doi: 10.1101/gr.137323.112
40. Bowden J, Spiller W, Del Greco MF, Sheehan N, Thompson J, Minelli C, et al. Improving the visualization, interpretation and analysis of two-sample summary data mendelian randomization via the radial plot and radial regression. Int J Epidemiol (2018) 47(4):1264–78. doi: 10.1093/ije/dyy101
41. Verbanck M, Chen CY, Neale B, Do R. Detection of widespread horizontal pleiotropy in causal relationships inferred from mendelian randomization between complex traits and diseases. Nat Genet (2018) 50(5):693–8. doi: 10.1038/s41588-018-0099-7
42. Burgess S. Sample size and power calculations in mendelian randomization with a single instrumental variable and a binary outcome. Int J Epidemiol (2014) 43(3):922–9. doi: 10.1093/ije/dyu005
43. Meddens SFW, De Vlaming R, Bowers P, Burik CAP, Linnér RK, Lee C, et al. Genomic analysis of diet composition finds novel loci and associations with health and lifestyle. Mol Psychiatry (2021) 26(6):2056–69. doi: 10.1038/s41380-020-0697-5
44. Boulund U, Bastos DM, Ferwerda B, van den Born B-J, Pinto-Sietsma S-J, Galenkamp H, et al. Gut microbiome associations with host genotype vary across ethnicities and potentially influence cardiometabolic traits. Cell Host Microbe (2022) 30(10):1464–80.e6. doi: 10.1016/j.chom.2022.08.013
45. Palmer TM, Lawlor DA, Harbord RM, Sheehan NA, Tobias JH, Timpson NJ, et al. Using multiple genetic variants as instrumental variables for modifiable risk factors. Stat Methods Med Res (2012) 21(3):223–42. doi: 10.1177/0962280210394459
46. Palmer TM, Sterne JA, Harbord RM, Lawlor DA, Sheehan NA, Meng S, et al. Instrumental variable estimation of causal risk ratios and causal odds ratios in mendelian randomization analyses. Am J Epidemiol (2011) 173(12):1392–403. doi: 10.1093/aje/kwr026
47. Bowden J, Davey Smith G, Burgess S. Mendelian randomization with invalid instruments: effect estimation and bias detection through egger regression. Int J Epidemiol (2015) 44(2):512–25. doi: 10.1093/ije/dyv080
48. Bowden J, Del Greco MF, Minelli C, Smith GD, Sheehan NA, Thompson JR, et al. Assessing the suitability of summary data for two-sample mendelian randomization analyses using MR-egger regression: The role of the I2 statistic. Int J Epidemiol (2016) 45(6):1961–74. doi: 10.1093/ije/dyw220
49. Bowden J, Davey Smith G, Haycock PC, Burgess S. Consistent estimation in mendelian randomization with some invalid instruments using a weighted median estimator. Genet Epidemiol (2016) 40(4):304–14. doi: 10.1002/gepi.21965
50. Hartwig FP, Davey Smith G, Bowden J. Robust inference in summary data mendelian randomization via the zero modal pleiotropy assumption. Int J Epidemiol (2017) 46(6):1985–98. doi: 10.1093/ije/dyx102
51. Gu Z, Gu L, Eils R, Schlesner M, Brors B. Circlize implements and enhances circular visualization in r. Bioinformatics (2014) 30(19):2811–2. doi: 10.1093/bioinformatics/btu393
Keywords: PD-1/PD-L1, gut microbiota, bidirectional Mendelian randomization, pQTL, causality
Citation: Huang Y-F, Zhang W-M, Wei Z-S, Huang H, Mo Q-Y, Shi D-L, Han L, Han Y-Y, Nong S-K and Lin G-X (2023) Causal relationships between gut microbiota and programmed cell death protein 1/programmed cell death-ligand 1: A bidirectional Mendelian randomization study. Front. Immunol. 14:1136169. doi: 10.3389/fimmu.2023.1136169
Received: 02 January 2023; Accepted: 21 February 2023;
Published: 09 March 2023.
Edited by:
Manish Tripathi, The University of Texas Rio Grande Valley, United StatesReviewed by:
Puneet Vij, Michigan Public Health Institute, United StatesManish Kumar, Texas State University, United States
Copyright © 2023 Huang, Zhang, Wei, Huang, Mo, Shi, Han, Han, Nong and Lin. This is an open-access article distributed under the terms of the Creative Commons Attribution License (CC BY). The use, distribution or reproduction in other forums is permitted, provided the original author(s) and the copyright owner(s) are credited and that the original publication in this journal is cited, in accordance with accepted academic practice. No use, distribution or reproduction is permitted which does not comply with these terms.
*Correspondence: Guo-Xiang Lin, bGluZ3VveGlhbmc5MTM5QDE2My5jb20=