 Yejun Tan1,2,3†
 Jin Kang4†
 Hongli Li1,5
 Aifang Zhong6
 Yaqiong Liu7
 Zheyu Zhang1,5
 Roujie Huang8Xin Cheng1,5
 Weijun Peng1,5*‡
- 1Department of Integrated Traditional Chinese & Western Medicine, The Second Xiangya Hospital, Central South University, Changsha, China
- 2School of Mathematics, University of Minnesota Twin Cities, Minneapolis, MN, United States
- 3Department of Experimental and Clinical Pharmacology, University of Minnesota, Minneapolis, MN, United States
- 4Department of Rheumatology and Immunology, the Second Xiangya Hospital of Central South University, Changsha, China
- 5National Clinical Research Center for Metabolic Diseases, The Second Xiangya Hospital, Central South University, Changsha, China
- 6Department of Emergency Medicine, The Second Xiangya Hospital, Central South University, Changsha, Hunan, China
- 7Centre for Research in Medical Devices, National University of Ireland Galway, Galway, Ireland
- 8Department of Obstetrics and Gynecology, Peking Union Medical College Hospital, Peking Union Medical College & Chinese Academy of Medical Science, Beijing, China
Background: Patients with diabetes mellitus (DM) have a higher incidence of malignant tumors than people without diabetes, but the underlying molecular mechanisms are still unclear.
Methods: To investigate the link between DM and cancer, we screened publicly available databases for diabetes and cancer-related genes (DCRGs) and constructed a diabetes-based cancer-associated inflammation network (DCIN). We integrated seven DCRGs into the DCIN and analyzed their role in different tumors from various perspectives. We also investigated drug sensitivity and single-cell sequencing data in colon adenocarcinoma as an example. In addition, we performed in vitro experiments to verify the expression of DCRGs and the arachidonic acid metabolic pathway.
Results: Seven identified DCRGs, including PPARG, MMP9, CTNNB1, TNF, TGFB1, PTGS2, and HIF1A, were integrated to construct a DCIN. The bioinformatics analysis showed that the expression of the seven DCRGs in different tumors was significantly different, which had varied effects on diverse perspectives. Single-cell sequencing analyzed in colon cancer showed that the activity of the DCRGs was highest in Macrophage and the lowest in B cells among all cell types in adenoma and carcinoma tissue. In vitro experiments showed that the DCRGs verified by western bolt and PEG2 verified by ELISA were all highly expressed in COAD epithelial cells stimulated by high glucose.
Conclusion: This study, for the first time, constructed a DCIN, which provides novel insights into the underlying mechanism of how DM increases tumor occurrence and development. Although further research is required, our results offer clues for new potential therapeutic strategies to prevent and treat malignant tumors.
Introduction
Cancer is one of the major diseases threatening people’s health worldwide (1), and 8-18% of patients with cancer also have diabetes as a coexisting illness (2). Diabetes Mellitus (DM) is associated with higher cancer risk, peaking approximately eight years after diagnosis (3). Epidemiological findings have shown up to a two-fold increase in the risks of colorectum, liver, and pancreas cancers among patients with DM (4). In addition, the incidence of oral cancer in patients with DM is also significantly increased (5, 6). Between 1988-1994 and 2010-2015, cancer mortality rates dropped in the United States but remained about 30% higher in adults with DM compared to those without DM (7), suggesting that effective control of DM could decrease the healthcare burden and improve the quality of life (8). Additionally, it has been reported that managing hyperglycemia and insulin resistance in patients with DM who are also suffering from cancer may improve their overall quality of life. Given the substantial medical burden of these diseases worldwide, understanding the association between cancer and DM might be essential to public health (9, 10).
Preliminary investigations to understand the mechanisms underlying the relationship between DM and cancer demonstrated the involvement of apoptotic and proliferation pathways (10, 11). They showed the involvement of factors such as hyperglycemia, hyperinsulinemia, insulin-like growth factor 1 (IGF-1), oxidative stress, and sex hormones. The association between DM and cancer may be causal (resulting from hyperinsulinemia or hyperglycemia) or confounding (resulting from common risk factors such as obesity) (12). Despite the prevalence of cancer and DM, the extent to which DM affects cancer remains unclear. Investigating the correlation between DM and cancer will contribute to a better understanding of cancer’s pathogenesis, as well as provide a better reference for individualized treatment of diabetic tumors.
Emerging evidence suggests that chronic inflammation is a crucial link between DM and cancer (13). Diabetes mellitus is associated with inflammation-related insulin secretory defects (14). Chronic inflammation, characterized by high levels of oxidative stress and reactive oxygen species (ROS), activation of pro-inflammatory pathways, and abnormal adipokine production, may develop a microenvironment that promotes tumor cell growth, facilitates metastasis, increases angiogenesis, and impairs natural killer cells and macrophages (15). Cross-talk between cancer and DM is also influenced by oxidative stress. Hyperglycemia could increase the production of superoxides (16). Additionally, insulin could stimulate the production of ROS (17). Strong evidence suggests that oxidative stress influences the expression of several genes and signal transduction pathways that play an essential role in tumorigenesis (18). As a result of cytokine-dependent activation of nuclear factor (NF)-kB pathways, ROS interferes with cell proliferation and apoptosis (19).
Studies show that NF-kB is hyperactivated in colorectal cancer, breast cancer, blood neoplasms, and pancreatic cancer cell lines. Inflammation facilitates tumor development, progression, and treatment resistance. In contrast, acute inflammatory responses often stimulate dendritic cells (DCs) to mature and present antigens, resulting in anti-tumor immune responses (20) (21).
To explore the interaction between DM and cancer, we screened seven diabetes and cancer-related genes (DCRGs) using public databases and constructed a diabetes-based cancer-associated inflammation network (DCIN). We analyzed the role of the seven DCRGs in cancer from different perspectives. Drug sensitivity and single-cell sequencing data were analyzed using colon adenocarcinoma (COAD). The expression of DCRGs and the arachidonic acid metabolic pathway was further verified in vitro. Therefore, for the first time, our study constructed a diabetes-based cancer-associated inflammation network, offering novel insights into the underlying mechanism of DM increasing tumor occurrence and development. Although further research is still required, our results hint toward potential therapeutic strategies in preventing and treating malignant tumors.
Materials and methods
Screening for genes associated with DM and various cancers
Epidemiological findings have shown a two-fold increase in the risks of colorectum, liver, and pancreas cancers among patients with DM (4). Therefore, DisGeNET (https://www.disgenet.org/) was used to explore genes related to DM, as well as pancreatic, liver, and colon cancers (22). These genes were filtered using a correlation score greater than 0.1 (r > 0.1). The intersection of genes related to these four diseases was taken from DisGeNET. Similarly, GeneCards (https://www.genecards.org/) was also used to search for genes associated with DM, pancreatic cancer, liver cancer, and colon cancer. These genes were filtered using a correlation score greater than 1 (r > 1). The intersection of genes related to these four diseases was taken from GeneCards. The “ggplot2” software package was used to visualize the intersection in Venn diagrams.
Data downloading and preprocessing
Gene expression profiles, phenotypic information, and survival data of 33 TCGA tumor samples and adjacent tissues (11057 samples in total) were downloaded from the UCSC Xena database (http://xena.ucsc.edu/). The gene expression profiles were set in Fragments Per Kilobase Per Million (FPKM) and HTseq-counts format. Demographic, tumor information, and follow-up data were also extracted from the database for all patients. Subsequently, the expression profiles of PPARG, MMP9, CTNNB1, TNF, TGFB1, PTGS2, and HIF1A were extracted from 33 types of TCGA tumor and adjacent tissue samples for further analysis.
Differential and co-expression analysis
The expression of the seven DCRGs between tumor and normal tissues was assessed using the Wilcox test and visualized using “ggplot2” for all the TCGA tumor types analyzed. The differential expression of the seven DCRGs between tumor and normal tissues across cancers was presented as a log2 fold change in the heatmap. Co-expression between these seven DGRGs at the transcriptional level was analyzed by the “corrplot” software package. In addition, the STRING database (https://string-db.org/) was used to construct a protein-protein interaction (PPI) network among these genes. The interactions between DCRGs were obtained from the string database, and a medium confidence level (0.40) was chosen to construct the protein-protein interaction network.
Clinical correlation analysis
Kaplan-Meier plots of DCRGs were generated using the R package to analyze the differences in overall survival outcomes between patients with high and low expression of the seven DCRGs. The phenotype and survival data of 33 TCGA cancer types obtained from the UCSC Xena database were analyzed. These DCRGs were divided into high and low-expression groups according to the median expression level for survival analysis. The software packages “Survival” and “SurvMiner” were used to plot survival curves. The “ggplot2” software package created a heatmap to represent clinical correlations; the heatmap of clinical correlations (overall survival) for DCRGs displayed only the statistically significant tumor types (∗∗ P<0.001; ∗∗ P<0.01; ∗ P<0.05). Red squares indicate high gene expression associated with poor prognosis, while blue squares indicate low gene expression associated with poor prognosis. In addition, the hazard ratios of DCRGs in each TCGA tumor type were obtained using the Cox proportional hazards regression. The Cox proportional hazards model was constructed using “survival” and “Forestplot” software packages to determine the pan-cancer relationship of the seven DCRGs with overall survival. Furthermore, the expression of these seven DCRGs was evaluated in patients with COAD with different stages. P < 0.05 were considered significant.
Gene set variation analysis of DCRGs
In order to investigate the potential pathways of these DCRGs, we performed GSVA analysis on the pathways of the seven DCRGs across cancers. Gene sets for GSVA were obtained from the MSigDB database (c2. Cp. Kegg. V7.1. Symbols. gmt). Firstly, the “GSVA” software package was used to generate GSVA scores for pan-cancer expression profiles of all seven genes. Then, the “limma” software package was used to analyze the differences between pan-cancer tumors and paracancerous tissues. The pathways with | t-value of GSVA score | > 2 were considered significant. Finally, the “ggplot2” software package was used to visualize the differences, and R software was used to count the significant pathways across various types of cancers.
Relationship between DCRGs expression and tumor immune cell infiltration
To better understand the relationship between DCRGs and immune cells, the association between the gene expression levels of the seven DCRGs and the infiltration levels of 22 immune-related cells was estimated. CIBERSORT (https://cibersort.stanford.edu/) was used to estimate the extent of immune cell infiltration across cancer samples. Finally, “ggplot2”, “ggpubr”, and “ggExtra” software packages were used to assess the correlation between the levels of the seven DCRGs and each immune cell infiltration in cancer (P < 0.05 was considered significant).
Immune subtype analysis
Tumor immune microenvironment (TIME) has therapeutic and prognostic significance in anti-tumor therapy. Studies have identified six immune subtypes of tumor types based on five representative immune signatures, which include wound healing (C1), IFN-γ dominant (C2), inflammatory (C3), lymphocyte depleted (C4), immunologically quiet (C5), and TGF-β dominant (C6) (22). Differential expression analysis was performed using the Kruskal test to understand the mRNA expression levels of DCRGs in the six different immune subtypes of tumor types. Furthermore, the mRNA expression levels of the seven DCRGs were analyzed in COAD.
Stemness indices and TIME across cancers
We assessed Stemness indices and ESTIMATE scores (Estimation of STormal and Immune cells in MAlignant Tumor tissues using Expression data) in pan-cancer (23). The ESTIMATE score is calculated based on gene expression characteristics and can reflect tumor purity with good prediction accuracy. Therefore, Spearman correlation analysis was performed between the expression levels of the seven DCRGs genes and matrix scores by “Estimate” and “limma” packages.
In order to further analyze the association between DCRGs and pan-cancer stemness features, the stemness index of tumor samples was calculated using a one-class logistic regression (OCLR) algorithm. Subsequently, the Spearman correlation analysis was performed based on gene expression and stemness score (24). Here, two types of dryness indices were obtained: DNA methylation-based stemness score (DNAss) and mRNA expression-based stemness score (RNAss).
Mutations in the seven DCRGs across cancers
The samples for pan-cancer analysis of whole genomes (ICGC/TCGA, Nature 2020) were obtained from cBioPortal (http://www.cbioportal.org/). Based on previous studies, a CNV value of 2 was considered as amplification and a value of -2 was considered as deep deletion. The CNV ratios of DCRGs for each tumor type were calculated for each tumor type (25). In addition, the overall cellular landscape of changes in the OncoPrint plot was generated using the R software package “ComplexHeatmap”.
Correlation of the expression levels of the seven DCRGs with TMB and MSI
Tumor mutation burden (TMB) is a quantifiable biomarker of immune response that reflects the number of mutations in tumor cells (26). Microsatellite instability (MSI) is caused by major molecular response (MMR) deficiency and is associated with the prognosis of patients (27). TMB and MSI are intrinsically related to immune checkpoint inhibitor sensitivity. The correlation between the expression levels of the seven DCRGs with TMB and MSI was investigated. A Perl script was used to calculate the TMB score, corrected by the total length of exons. MSI scores were determined for all samples based on somatic mutation data downloaded from TCGA. Spearman correlation coefficients were used to analyze the relationship of DCRGs expression with TMB and MSI. The result was displayed as a heatmap generated by the “ggplot2” software package.
Correlation analysis between the seven DCRGs and immune checkpoint-related genes in COAD
Due to the high frequency of mutations of the seven genes in COAD, it was selected for further analysis. R software was used to analyze the correlation between the seven DCRGs and 46 immune checkpoint-related genes in COAD. The result was also visualized as a heatmap by the “ggplot2” software package.
Pan-cancer drug sensitivity analysis
CellMiner is a web-based tool containing genomic and pharmacological information for investigators to utilize transcript and drug response data from the NCI-60 cell line set compiled by the National Cancer Institute. RNA-seq spectrum data of the seven DCRGs and their pharmacological activity were collected from the CellMiner database (https://discover.nci.nih.gov/cellminer/). The “Impute” software package was used to preprocess the raw data. The correlation between the transcriptional expression of the seven DCRGs and compound sensitivity was investigated using Pearson correlation analysis. When the P was less than 0.05 and the correlation coefficient was greater than 0.3, the relevant DCRGs were considered sensitive to the corresponding chemotherapeutic drugs.
Validation of DCRGs in single-cell transcriptome sequencing data
To validate the function of the seven DCRGs in colon cancer, single-cell sequencing data of colon cancer were analyzed. The GSE161277 dataset was downloaded from the Gene Expression Omnibus (GEO) database, and the raw data for each sample was processed using the “Seurat” software package in R (28). Genes expressed by fewer than three cells in the sample, genes with fewer than 200 expressed genes, and mitochondrial gene content that exceeded 25% of the total unique molecular identifier (UMI) count were excluded. The data were standardized using the default method, and the most variable genes were identified and selected using the FindVariableFeatures method. These genes were then centered and scaled before performing a principal component analysis to identify clusters of cells. Stromal and immune cells were annotated based on specific markers from previous studies.
The activity of DCRGs was calculated in the single-cell dataset using the AUCell software package, and the scores were visualized using ggplot2 to create UMAP plots and boxplots. Additionally, Kruskal-Wallis tests were conducted between the adenoma, blood, carcinoma, normal, and para-cancer groups using the ggpur software package. The AUCell scores were considered to be different between groups when the P-value was less than 0.05. “Gene set variation analysis was performed using the GSVA software” package on the cell type with the highest activity of DCRGs to investigate differentially activated metabolic pathways. The subpopulation of cells with the highest AUC values for all DCRGs was also analyzed using a pseudo-time sequence, and cells were sorted based on subpopulation markers obtained from the previous analysis. The relationship between overall cellular expression changes was evaluated, and a single-cell pseudo-time trajectory was generated using the monocle software package in R. Finally, the mean expression of the seven DCRGs was calculated, and the expression values of the DCRGs for each developmental stage were obtained.
Cell culture
The SW480 cells were grown in Dulbecco’s modified Eagle’s medium (DMEM, GENVIEW, GD3103) supplemented with 10% fetal bovine serum (FBS) and 1% penicillin/streptomycin (PS). The NCM460 cells were grown in 1640 medium (GENVIEW, GR3101) with 10% FBS and 1% PS (NCM Biotech, C100C5). Cells were grown at 37 °C in an atmosphere of 5% CO2 and 95% relative humidity, and the medium was changed every 2 days. The NCM460 cells were grown in 1640 medium (GENVIEW, GR3101) with 10% FBS and 1% PS (NCM Biotech, C100C5). Cells were grown at 37 °C in an atmosphere of 5% CO2 and 95% relative humidity, and the medium was changed every 2 days. When cells reached approximately 90% confluency, they were detached using 0.1% trypsin-ethylenediaminetetraacetic acid (NCM Biotech, C100C1) and seeded in a 6-well plate. Subsequently, the cells were cultured with high glucose (HG, 50 mmol/l) or normal glucose (NG, 5.5 mmol/l) for 2 days at 37°C.
Western blot analysis
The total proteins of SW480 and NCM460 cells were prepared using RIPA buffer containing protease and phosphatase inhibitors. A BCA protein assay kit was used to measure protein concentrations. 20 µg proteins were loaded per lane, separated by electrophoresis, and then transferred to polyvinylidene fluoride (PVDF) membranes (C3117, Millipore). The membrane was blocked and then incubated for 1 h with β-actin (1:100000; ABclonal, AC026), PPAR gamma (1:5000; Proteintech, 16643-1-AP), MMP9 (1:1000; Proteintech, 10375-2-AP), TNF alpha (1:3000; Proteintech, 60291-1-IG), TGF beta1 (1:2000; Proteintech, 21898-1-AP), COX2 (1: 500; Proteintech, 27308-1-AP), HIF1A (1:2500; Proteintech, 20960-1-AP) and Beta-catenin (1:10000; Proteintech, 51067-2-AP). Immunoblot analysis was performed with horseradish peroxidase (HRP)-conjugated anti-mouse antibodies or anti-rabbit antibodies (1:5000; ZSGB-BIO, ZB-5301, and ZB-5305) and developed with the ECL kit (Beyotime Biotechnology, P0018FM). The level of β-actin was used as a loading control, and the ratios of the gray value of the target protein bands to the gray value of the corresponding internal control bands were defined as the expression level of the target protein.
Enzyme-linked immunosorbent assay
After treatment in accordance with the conditions described above, the concentration of Leukotriene B4 (LT-B4), Leukotriene C4 (LT-C4), and Prostaglandin E2 (PG-E2) was tested using an enzyme-linked immunosorbent assay (ELISA) kit. These ELISA kits included Human Leukotriene B4, LT-B4 ELISA Kit (CSB-E08033h), Human Prostaglandin E2, PG-E2 ELISA Kit (CSB-E07965h), and Leukotriene C4 Assay Kit (H556-1). In brief, cells were seeded into 6-well plates, followed by incubation for 2 days at 37°C. Then, the cultivating supernatant was collected, and the presence of these factors was determined by ELISA following the manufacturer’s protocols.
Results
Differential expression analysis and co-expression analysis of DCRGs
First, we used DisGeNET to identify gene sets related to DM, pancreatic cancer, liver cancer, and colon cancer (r > 0.1) and obtained nine intersection genes. Then we used GeneCards to search for DM, pancreatic cancer, liver cancer, and colon cancer-related genes (r > 1) and obtained 59 intersection genes. Finally, by taking the intersection of the nine genes from DisGeNET and 59 genes from GeneCards, we identified seven DCRGs: PPARG, MMP9, CTNNB1, TNF, TGFB1, PTGS2, HIF1A (Figures 1A–C). The expression of DCRGs varied among different tumors. MMP9 showed high expression in all tumors except THYM, TNF displayed high expression in most tumors, and PTGS2 exhibited low expression in most tumors. Meanwhile, the DCRGs exhibited no statistical differences in MESO and UVEM (Figures 2A–H, Supplementary Figure S1). Interestingly, the correlation analysis revealed a correlation between HIF1A and PTGS2 (r=0.36), TGFB1 and HIF1A (r=0.3), MMP9 and TGFB1 (r=0.38), TNF and MMP9 (r=0.3, Figure 2I). Meanwhile, the seven DCRGs were used to constitute a protein-protein interaction network (Figure 2J). As each DCRG was associated with inflammation, we defined the network as DCIN.
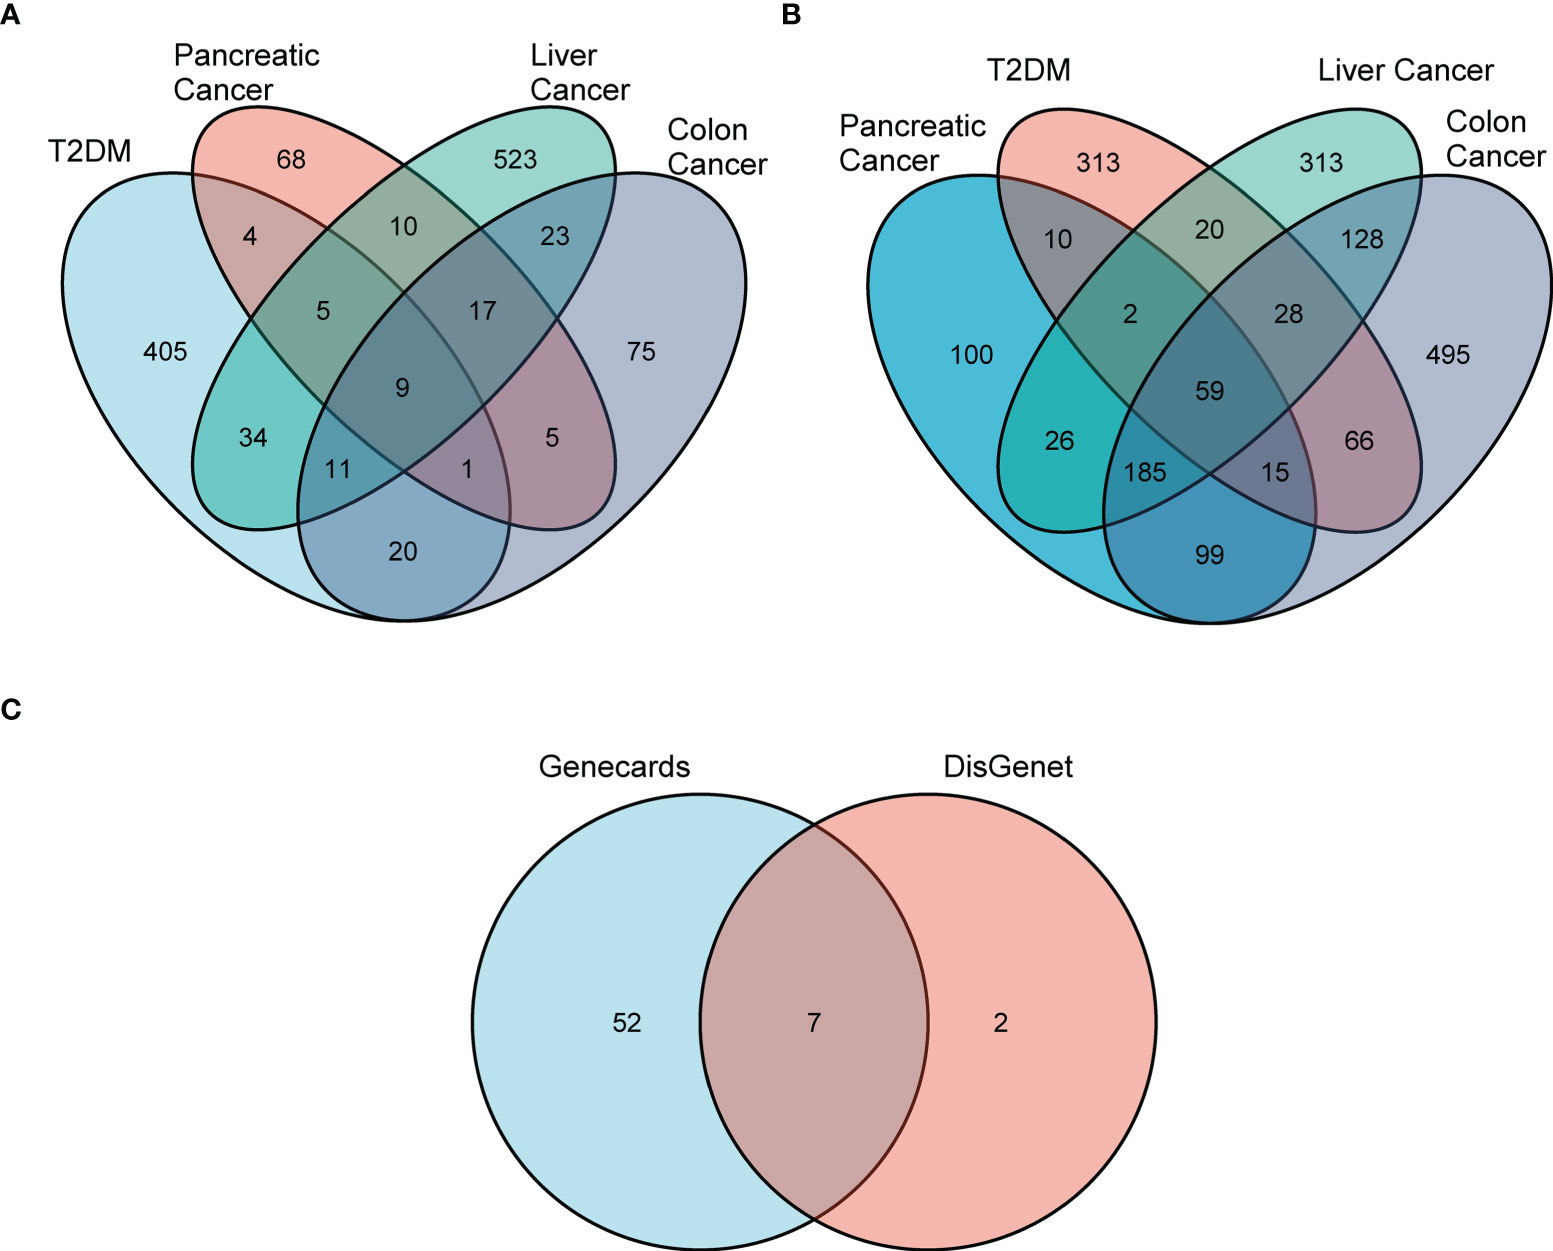
Figure 1 Screening for differential DCRGs. (A) Venn diagram showing nine intersection genes of five diseases, T2DM, pancreatic cancer, liver cancer, and colon cancer, based on DisGeNET (r > 0.1). (B) The 59 intersection genes of the five diseases based on GeneCards (r > 0.1). (C) The seven DCRGs obtained by the intersection of DisGeNET and GeneCards.
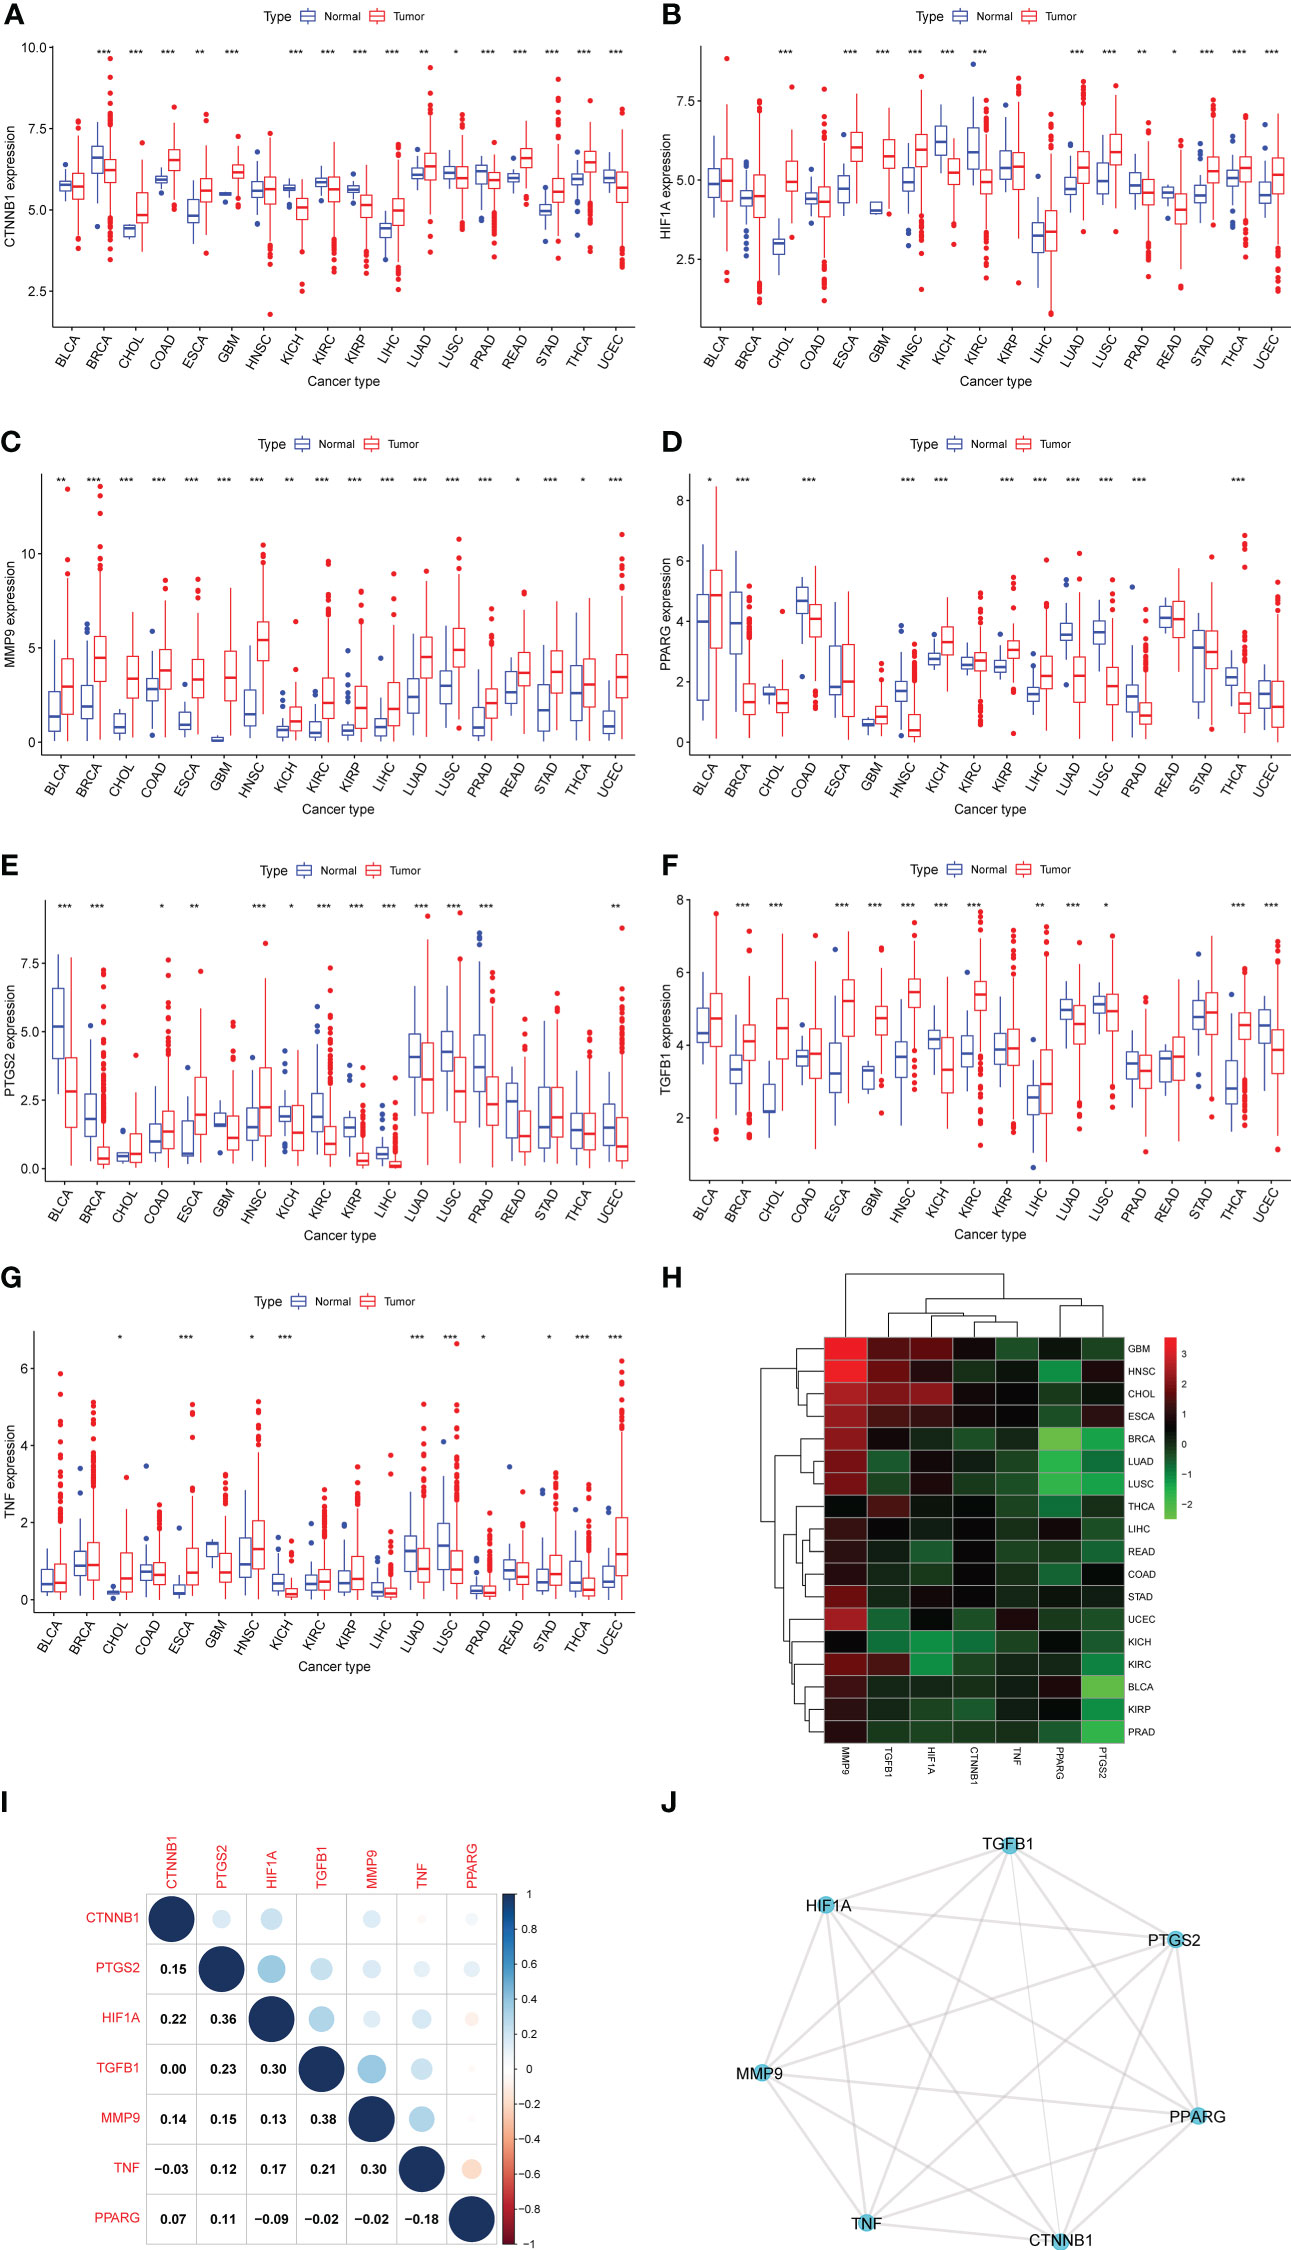
Figure 2 Differential expression analysis. (A–G) The box plots showing differential expression of the seven DCRGs in normal and tumor tissues (∗∗∗ P < 0:001; ∗∗ P < 0.01; ∗ P < 0.05). (H) The heatmap showing the transcriptional level of the seven DCRGs between normal and tumor tissues in various cancers. The gradient colors represent the log Fold Change (logFC) value. (I) The heatmap shows the pairwise correlation of the seven DCRGs. (J) The protein-protein interaction network of the seven DCRGs.
Clinical correlation analysis
To investigate the association between expression levels and the prognosis of the seven DCRGs, we performed an overall survival analysis of 33 cancers. Patients were divided into high-expressing and low-expressing groups according to the median gene expression levels. High and low expressions of the seven DCRGs were associated with overall survival in multiple cancers (Supplementary Figure S2, Figure 3). The Kaplan-Meier survival analysis revealed that patients with KIRC, READ, and UVM who had high CTNNB1 levels had better overall survival (OS) rates (P<0.001, P=0.024, and P=0.002, respectively). However, patients with ACC, HNSC, and LGG who had high CTNNB1 were associated with poor OS (P=0.004, P=0.046, and P=0.0179, respectively). Similarly, patients with SKCM who had high HIF1A levels had better survival rates (P=0.026), but patients with LIHC, MESO, and PCPG who had high HIF1A were associated with poor OS (P=0.004, P=0.03, and P=0.045, respectively). Additionally, patients with DLBC who had high levels of MMP9 had better survival rates (P=0.017), while high MMP9 in patients with ACC, BLCA, KIRC, and LIHC was associated with poor OS (P=0.003, p=0.03, P=0.001, and P=0.009, respectively). Furthermore, patients with BLAC, BRCA, KIRC, READ, and UVM who had high PPARG levels had longer OS rates (P=0.001, P=0.04, P<0.001, P=0.003, and P=0.003, respectively). However, high PPARG in patients with HNSC, LGG, LIHC, PAAD, and PCPG were associated with poor OS (P=0.043, P=0.041, P=0.014, P=0.023, and P=0.004, respectively). Patients with COAD and PCPG who had high PTGS2 expression had longer OS rates (P=0.028 and P=0.003, respectively), whereas high PTGS2 expression in patients with TGCT and UVM was associated with poor OS (P=0.043 and P=0.004 respectively). Similarly, patients with SKCM who had high levels of TGFB1 had longer survival rates (P=0.008), while high TGFB1 in patients with LAML, LGG, MESO, and STAD was associated with poor OS (P=0.003, P=0.03, P< 0.001, and P=0.027 respectively). Lastly, patients with SKCM and SARC who had high TNF expression had longer OS rates (P=0.003 and P=0.013, respectively), whereas high TNF expression in THYM patients was associated with poor OS (P=0.018).
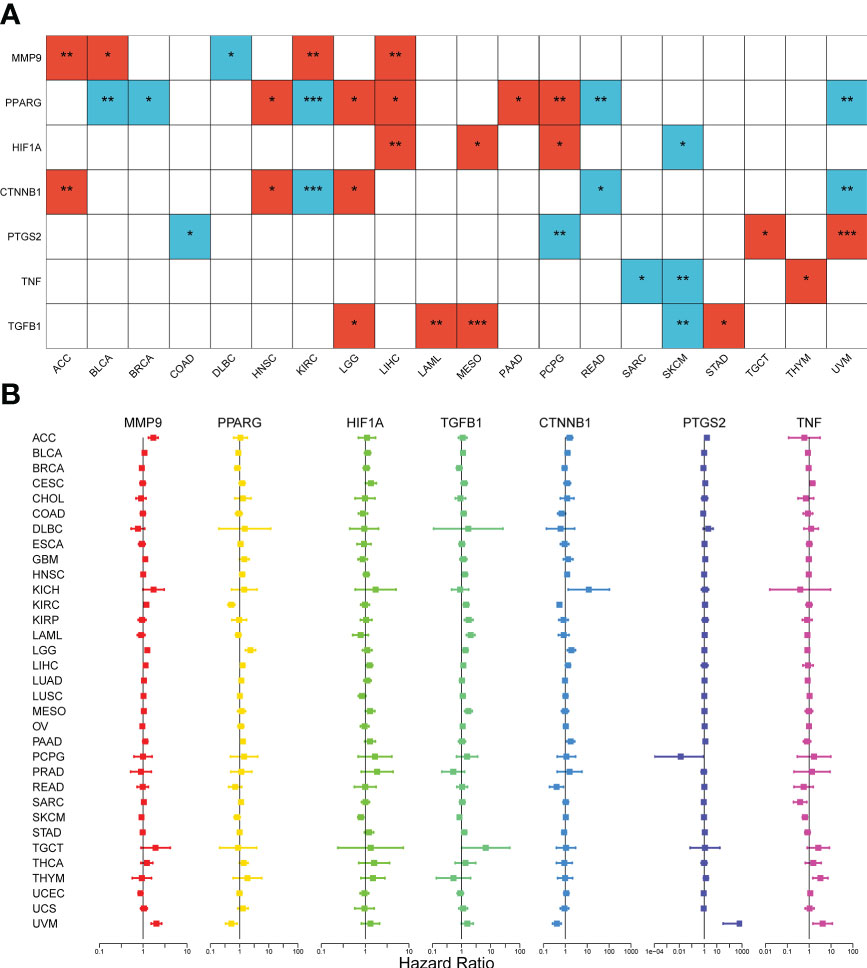
Figure 3 Survival analysis of the seven DCRGs across cancers. (A) The heatmap of clinical correlation analysis (overall survival) of DCRGs (∗∗∗ P < 0:001; ∗∗ P < 0.01; ∗ P < 0.05). Only tumor types with statistical significance are shown. The red square indicates high gene expression is associated with a worse prognosis; the blue square indicates low gene expression is associated with a worse prognosis. (B) Cox proportional hazard analyses illustrate the hazard ratios (HRs) of the seven DCRGs in 33 TCGA tumors. DCRGs with HR > 1 were regarded as risk factors, while DCRGs with HR < 1 were regarded as protective factors.
Moreover, we used Cox proportional hazard regression to examine the prognostic effects of the DCRGs across 33 TCGA tumors (Figure 3). The results showed that CTNNB1 was a protective factor for KIRC (P<0.001), READ (P=0.014), and UVM (P<0.001) and a risk factor for ACC (P=0.007), and LGG (P=0.003). HIF1A was a protective factor for SKCM (P=0.003) and a risk factor for LIHC (P=0.006) and MESO (p=0.04). MMP9 was a protective factor for SKCM (P=0.009), UCEC (P=0.04) and a risk factor for ACC (P<0.001), BICA (P=0.048), KIRC (P<0.001), LGG (P<0.001), UVM (P<0.001), GBM (P=0.03) and LIHC (P=0.01). PPARG was a protective factor for BLCA (P=0.01), KIRC (P<0.001), and UVM (P=0.005) and a risk factor for HNSC (P=0.004), LGG (P<0.001), LIHC (P=0.009), and PAAD (P=0.003). PTGS2 was a protective factor for PCPG (P=0.04) and a risk factor for ACC (P<0.001), CESC (P=0.01), PAAD (P=0.007), and UVM (P<0.001). TGFB1 was a protective factor for SKCM (P=0.009) and a risk factor for HNSC (P=0.03), KIRC (P=0.001), KIRP (P<0.001), LAML (P<0.001), LIHC (P=0.03), LGG (P=0.003), MESO (P<0.001), SKCM (P=0.01), TGCT (P=0.047), and STAD (P=0.03). TNF was a protective factor for SARC (P=0.007) and SKCM (P<0.001) and a risk factor for CESC (P=0.004), UVM (P=0.006), and THYM (P=0.003). Notably, the prognostic effects of DCRGs varied across different tumors, with high expression levels of the same DCRG being associated with either a protective or a risk factor for OS in different cancer types.
Gene set variation analysis of DCRGs across cancers
To investigate the involvement of these seven DCRGs in cancer-related pathways and the pathways related to DM and carcinogenesis, we performed gene set variation analysis (GSVA) on the DCRGs across cancers. We considered pathways with | t value of GSVA score | > 2 between tumor and control samples as significant. Among them, the metabolism-related pathways, such as PPAR, mTOR, VEGF, and arachidonic acid signaling pathways, appeared multiple times in various cancers. Additionally, type I and type II DM also appeared in various cancer pathways (Supplementary Figure S2), indicating that these seven DCRGs are closely related to DM and metabolism.
Immune cell infiltration analyses of DCRGs across cancers
We next examined the association between the seven DCRGs and the infiltration levels of 22 immune-related cells. Our data showed that in most cancers, the level of immune cell infiltration was significantly correlated with the expression of the DCRGs (|r| ≥ 0.5, P < 0.01). Among them, MMP9 was associated with macrophage M0 in 12 tumor types, PTGS2 was associated with six immune cell types among six tumor types, and TNF with seven immune cell types in five tumor types (Supplementary Figure S3).
Immune subtype analysis
The mRNA expression of the seven DCRGs were analyzed using the Kruskal test in six immune subtypes across 33 TCGA tumor types. Results showed that the expression of these seven DCRGs varied significantly across C1-C6 subtypes in different cancer types (P<0.001). Specifically, CTNNB1 exhibited the highest expression level in the C1-C6 immune subtypes (Figure 4A). Similarly, the seven DCRGs were differentially expressed in the C1-C6 immune subtypes of COAD (P<0.05), with CTNNB1 exhibiting the highest expression compared to the other six DCRGs. (Figure 4B). Moreover, we found that C6 was the immune isoform with the highest expression level in the remaining DCRGs, except for CTNNB1.
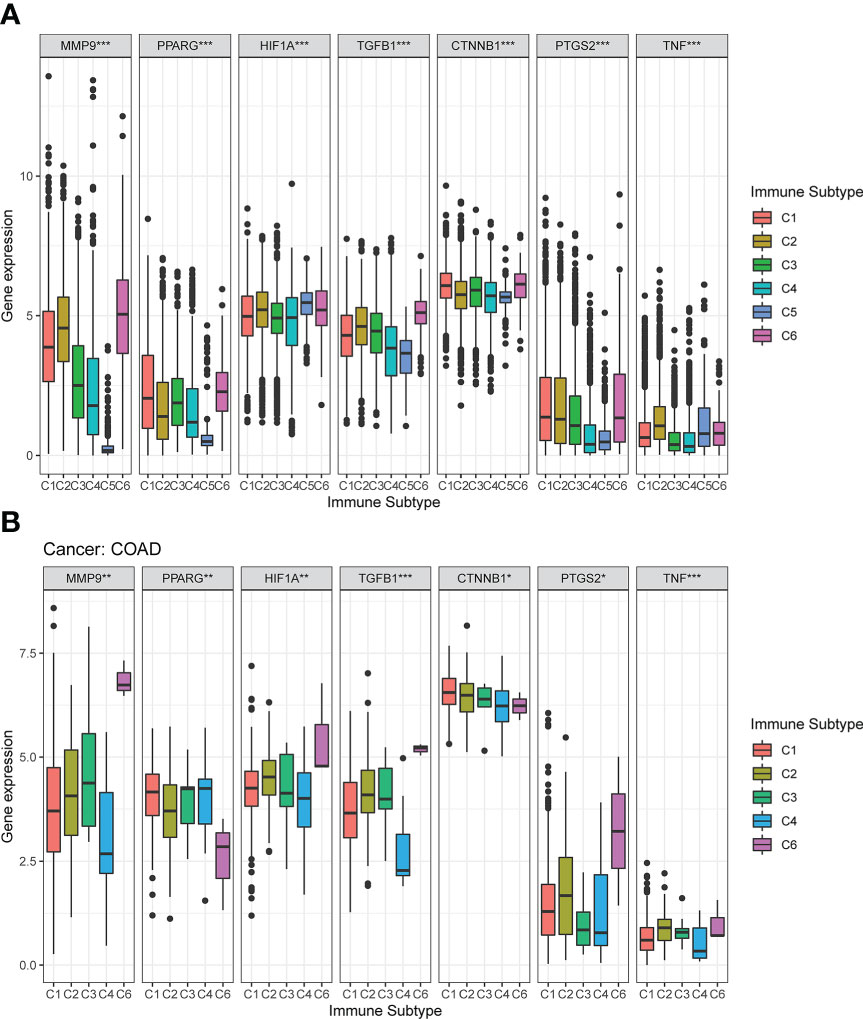
Figure 4 Expression pattern of the seven DCRGs in six different immune subtypes. (A) Transcriptional expression of the seven DCRGs in C1-C6 immune subtypes across all TCGA cancers. (B) Box plots showing the expression level of the DCRGs in the immune subtypes in COAD (∗∗∗ P < 0.001; ∗∗ P < 0.01; ∗ P < 0.05).
Stemness indices and tumor microenvironment
The matrix fraction of the TCGA cancer samples was calculated by applying the ESTIMATE algorithm. Spearman correlation analysis was used to describe the correlation between the expression levels of the DCRGs and the pan-cancer matrix score. We found that the expression of MMP9, TGFB1, and TNF was positively correlated with immune and stromal scores (P < 0.05, r > 0.5, Supplementary Figures S4A, B). To analyze the correlation between the DCRGs and pan-cancer stemness characteristics, we calculated the stemness index of the TCGA tumor samples using a Class I logistic regression (OCLR) algorithm. Subsequently, spearman correlation analysis was performed based on gene expression and stemness score. Two types of dryness indices were calculated: DNA methylation-based stemness score (DNAss) and mRNA expression-based stemness score (RNAss). The correlation between the two stemness indexes and the expression levels of the seven DCRGs varied in the TCGA tumors. DNAss exhibited a strong correlation between OV and TGFB1, THYM and PTGS2, and TCGT and CTNNB1. RNAss demonstrated that TGFB1 was negatively correlated with many cancer types, while CTNNB1 was negatively correlated with THYM (Supplementary Figures S4C, D).
Mutations in the seven DCRGs across cancers
To better understand the genomic alterations of DCRGs in tumors, we analyzed copy number variation (CNV) data of 2,922 samples from the Pan-cancer analysis of whole genomes (ICGC/TCGA, Nature 2020) and depicted the resulting CNV landscape. Our findings indicated that PTGS2 and MMP9 had a higher CNV frequency at 10%, followed by TNF and TGFB1 at 6% and 5%, respectively (Figure 5A). Amplifications were the most common CNV types observed for DCRGs. We then described the somatic changes in each DCRG for each tumor to determine the situation across different tumor types with varying mutation patterns. Notably, DCRGs showed a high mutation frequency in colorectal cancer and melanoma, with CTNNB1 having the highest mutation frequency in hepatobiliary cancer (23.7%) and uterine endometrioid carcinoma (20.8%) (Figure 5B). In colorectal cancer, HIF1A, MMP9, and PTGS2 had the highest mutation frequency at 5.8%, 7.7%, and 5.8%, respectively, while in melanoma, PPARG and TGFB1 had the highest mutation frequency at 4.7% and 1.9%, respectively. Additionally, CTNNB1 had the highest deep deletion rate across pan-cancer at 5%, followed by TGFB1 at 3.6% in head and neck cancer and 2.2% in non-small cell lung cancer, and TNF and PPARG in pancreatic cancer with rates of 3.6% and 1.3%, respectively, (Figure 5C). The deep deletion rate of other DCRGs in cancers was less than 1%. PTGS2 and MMP9 had the highest amplification rates, with DCRGs amplified in bladder cancer, esophagogastric cancer, ovarian cancer, head and neck cancer, and breast cancer (Figure 5D). Notably, MMP9 had a staggering amplification frequency of 40.4% in colorectal cancer and 33.7% in esophagogastric cancer, while PTGS2 had an amplification rate of 34.1% in breast cancer.
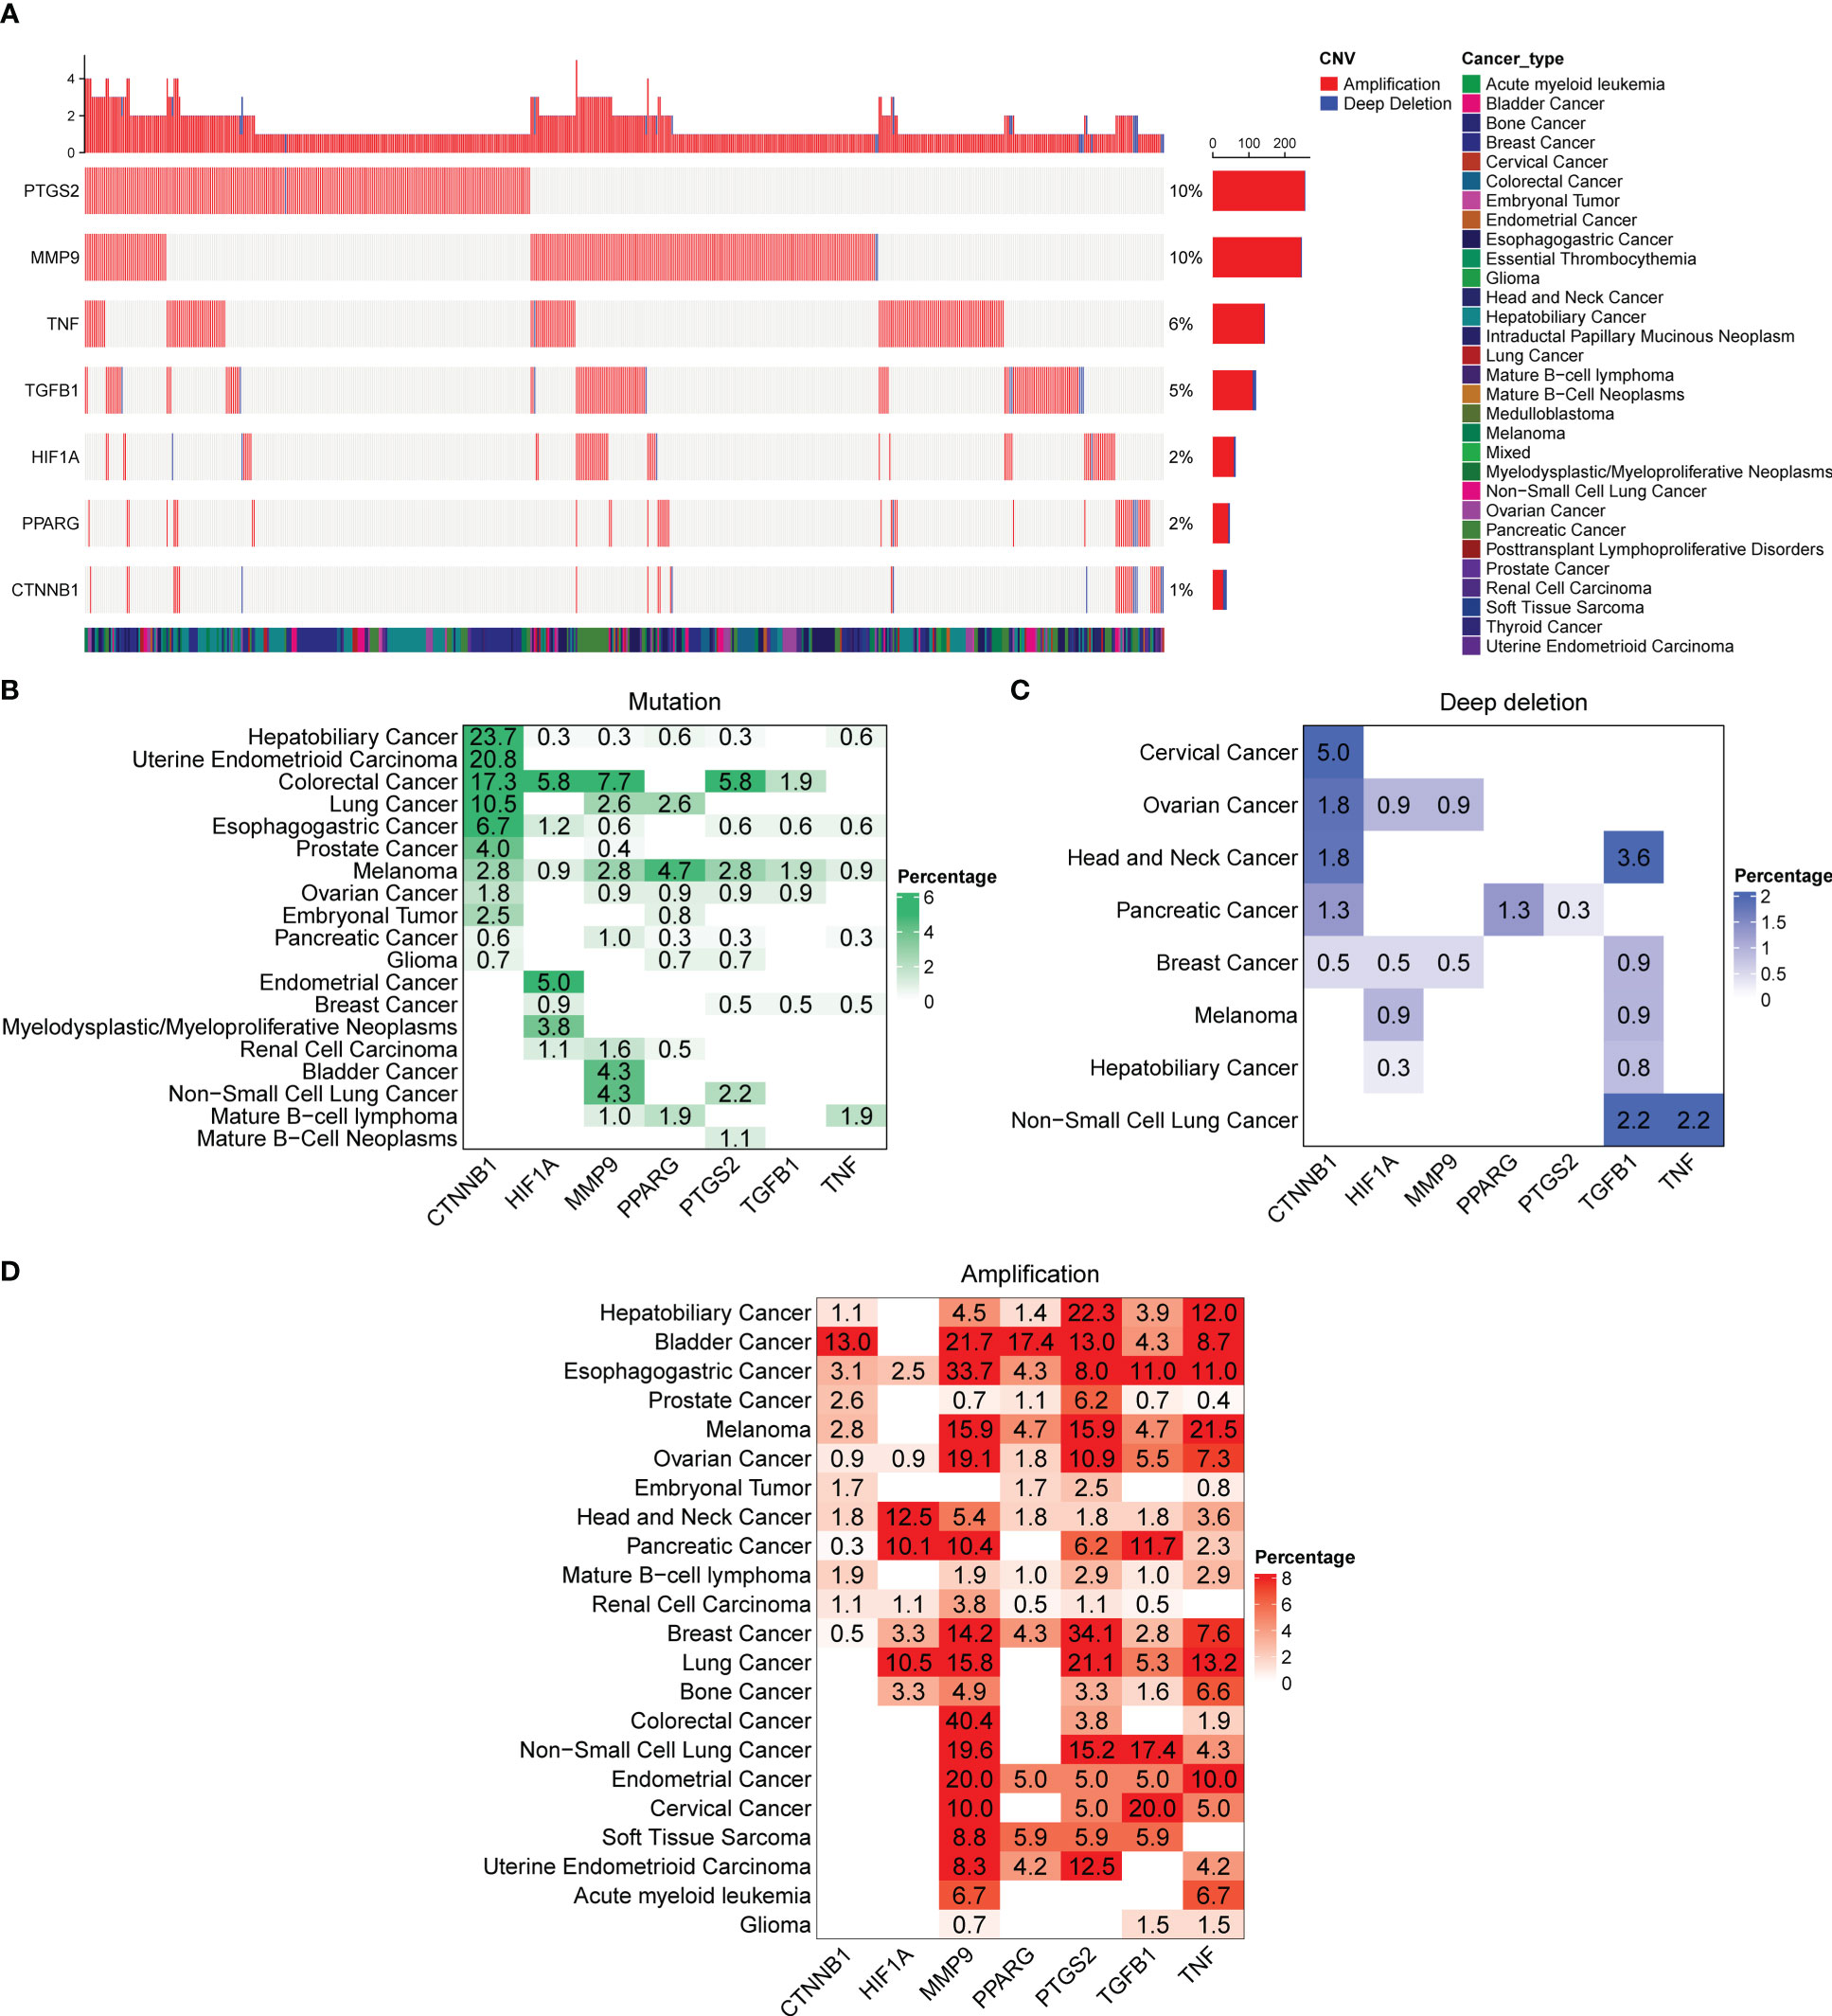
Figure 5 Alterations in the DCRGs in cancer based on pan-cancer analysis of whole genomes. (A) Copy number variation (CNV) landscape of DCRGs in various tumors. Each row represents a gene, and each column represents a patient. The CNV frequency of DCRGs is shown. The figure only represents patients with DCRG alterations. The mutation rate of each gene is shown in the labels on the right. (B–D) Frequency distribution of mutation (B), deep deletion (C), and amplification (D) in different cancer types. The numbers in the figure represent the specific mutation rate, and the color intensity is proportional to the frequency.
Association of the DRCGs with the immunomodulators, TMB and MSI
We then investigated whether the expression levels of the seven DCRGs correlated with TMB and MSI, both of which are intrinsically related to immune checkpoint inhibitor sensitivity. The results showed that, except for KICH, READ, CHOL, TGCT, and LAML, the TMB of the remaining 28 tumors was correlated with the expression of at least one of the seven DCRGs (Supplementary Figure S5A). Meanwhile, except for CHOL, OV, UCS, and LAML, the MSI of the other 29 cancers was correlated with the expression of at least one of the seven DCRGs (Supplementary Figure S5B).
Seven DCRGs predict the response to cancer immunotherapy
Due to the high frequency of mutations of the seven DCRGs in COAD, they were selected for further analysis. We analyzed the association of the seven DCRGs with multiple cancers and 46 immune checkpoint-related genes in COAD. All 46 immune checkpoint-related genes were associated with at least one of the seven DCRGs. Among them, CD274 (PD-L1) was correlated with six genes except for MMP9 (Supplementary Figure S5C).
Drug sensitivity analysis across cancers
To analyze the potential effect of the DCRGs on drug response, we performed a Pearson correlation analysis between the transcriptional expression of the seven DCRGs in the NCI-60 cell line and the drug activity of 263 anti-tumor drugs retrieved from the CellMiner database. Scatterplots (Supplementary Figure S6) sorted by value exhibited significant correlations between drug sensitivity and gene expression. Notably, Nelarabine and TNF showed a high correlation (|r|=0.747). Together, our results showed that multiple drugs were sensitive to the seven DCRGs (p<0.001, |r|>0.4).
Validation of DCRGs in single-cell data set of colon cancer
For the evaluation of DCRG activity in single cells of colon cancer, 12 single-cell samples were included, consisting of four adenoma, one blood, four carcinoma, one para-cancer, and three normal tissues (28). Six cell types were identified according to the previous studies (Figure 6A). Figure 6B shows the top 10 marker genes for each cell type (Figure 6B). The AUCell analysis showed that macrophages had the highest AUC values for the DCRGs in carcinoma and adenoma, while the lowest values were observed in epithelial cells in para-cancer tissues (Figure 6C, Supplementary Figure S7C). In fact, the AUC values of DCRGs differed between adenoma, blood, carcinoma, normal, and para-cancer groups in B cells, epithelial cells, fibroblasts, and macrophages (P<0.05). Moreover, GSVA results indicated that the arachidonic acid metabolism pathway was upregulated (t > 2) in the adenoma and carcinoma tissues compared to the normal tissue. (Supplementary Figures S7A, 6B). Furthermore, pseudo-time sequence analysis was performed to confirm the developmental stages of the macrophage subpopulations. Figure 6D illustrates the cell differentiation timeline, where deeper colors represent earlier developmental stages. The results show that the seven clusters can be roughly divided into seven differentiation states (Figures 6E–G). Among these, clusters 4, 1, and 6 were in the early developmental stage, while cluster 2 was in the late developmental stage. The mean expression of DCRGs was higher in cluster 1 and highest in cluster 2, indicating that DCRGs have higher average expression values in the early and late stages of macrophage development, potentially linked to macrophage differentiation.
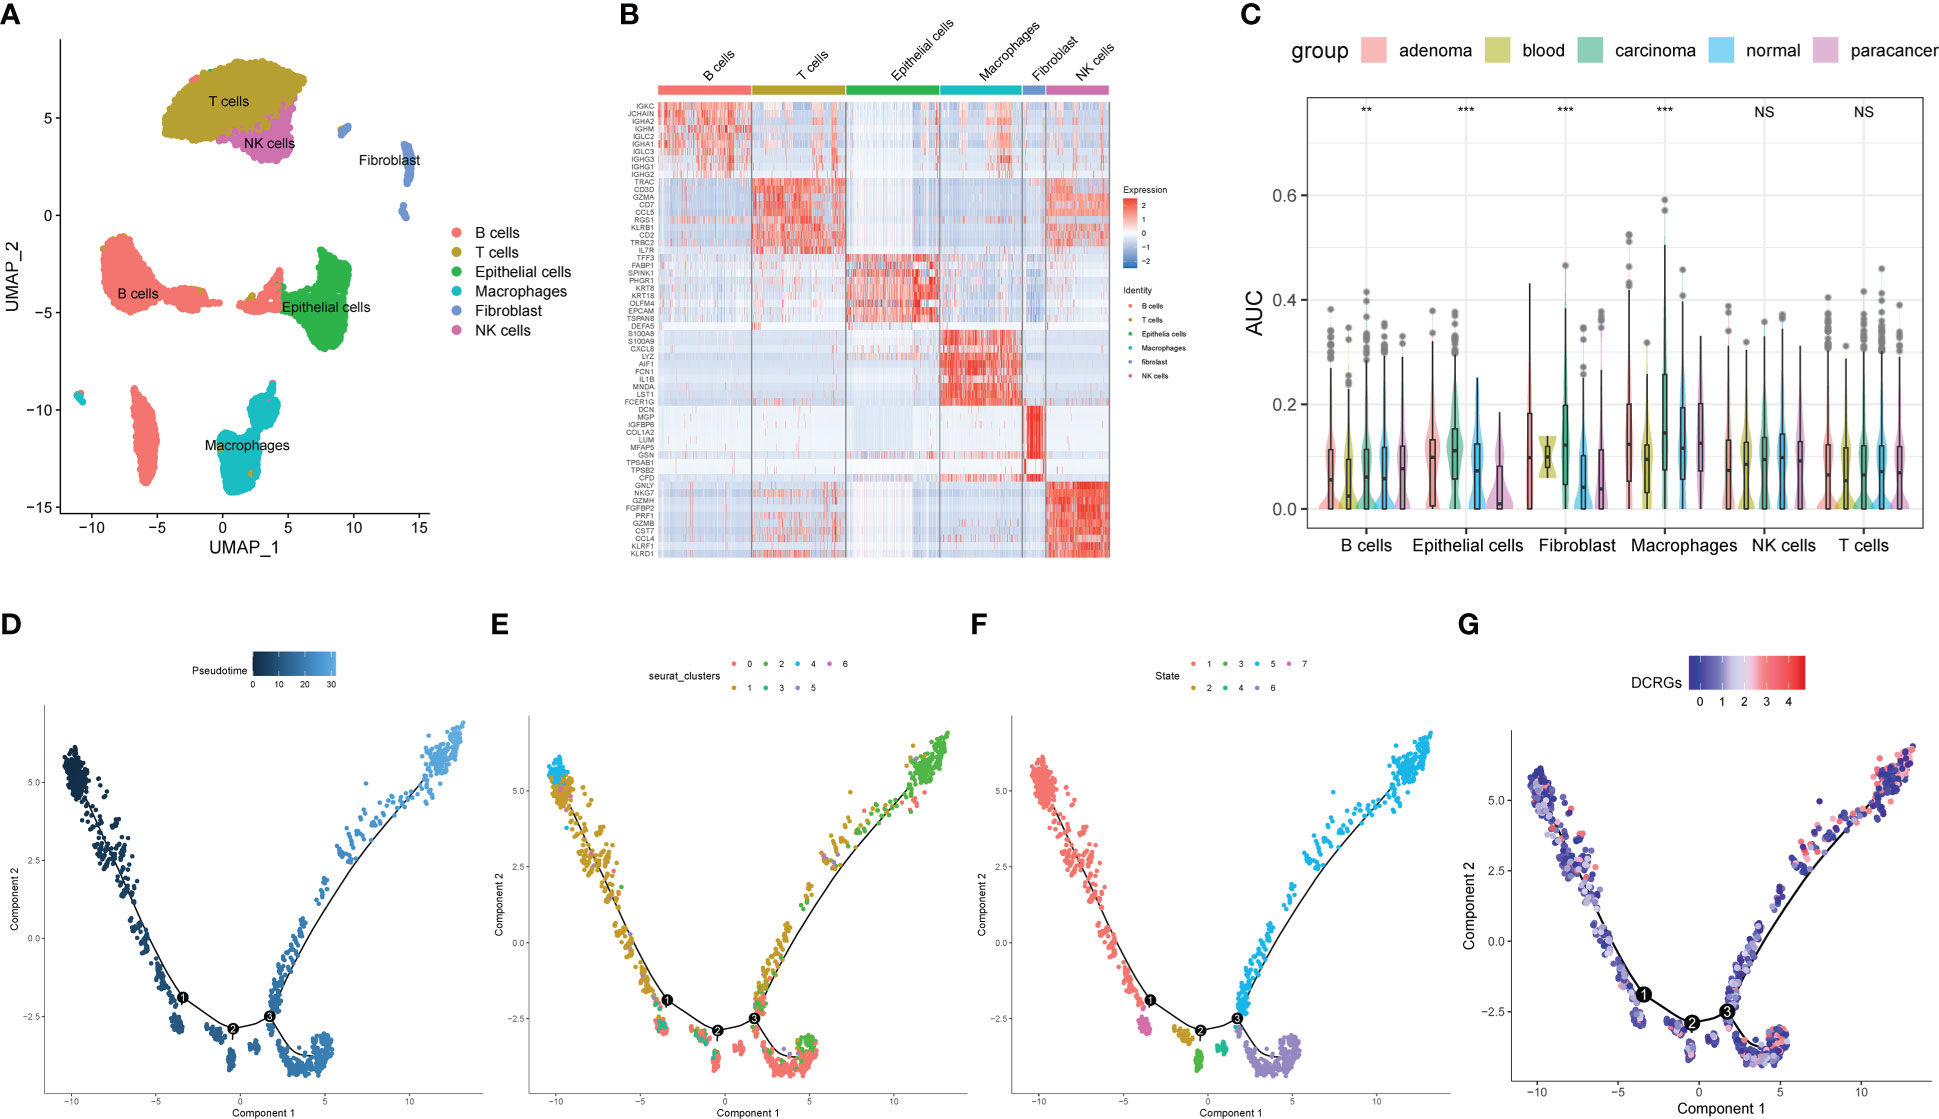
Figure 6 Analysis of single-cell RNA sequencing of COAD. (A) UMAP plot of the cell clusters of GSE161277. (B) Top 10 marker genes among the eight cell clusters. (C) AUC scores of the DCRGs among each cell type. (D) The cell differentiation timeline, where deeper colors represent earlier developmental stages. (E) The distribution of different clusters of macrophages in the cell trajectory curve. (F) The distribution of different states of macrophages on the cell trajectory curve. (G) Distribution of the average expression of DCRGs on the cell trajectory curve. ** P < 0.01,*** P < 0.001.
Verification of the seven DCRGs and arachidonic acid pathway in vitro
To verify the expression of the DCRGs and arachidonic acid metabolic pathways in tumors, we stimulated colon cancer and normal intestinal epithelial cells with high glucose and physiological glucose levels, respectively. All seven DCRGs were significantly elevated in the colon cancer epithelial cells under a high glucose environment (Figures 7A–H). However, in normal intestinal epithelial cells, there was no significant difference in the expression of the DCRGs under a normal or high glucose environment (Figures 7I–P). These results suggest that high glucose stimulation can lead to increased expression of the seven DCRGs in colon cancer epithelium, while it does not affect their expression in normal colon epithelial cells.
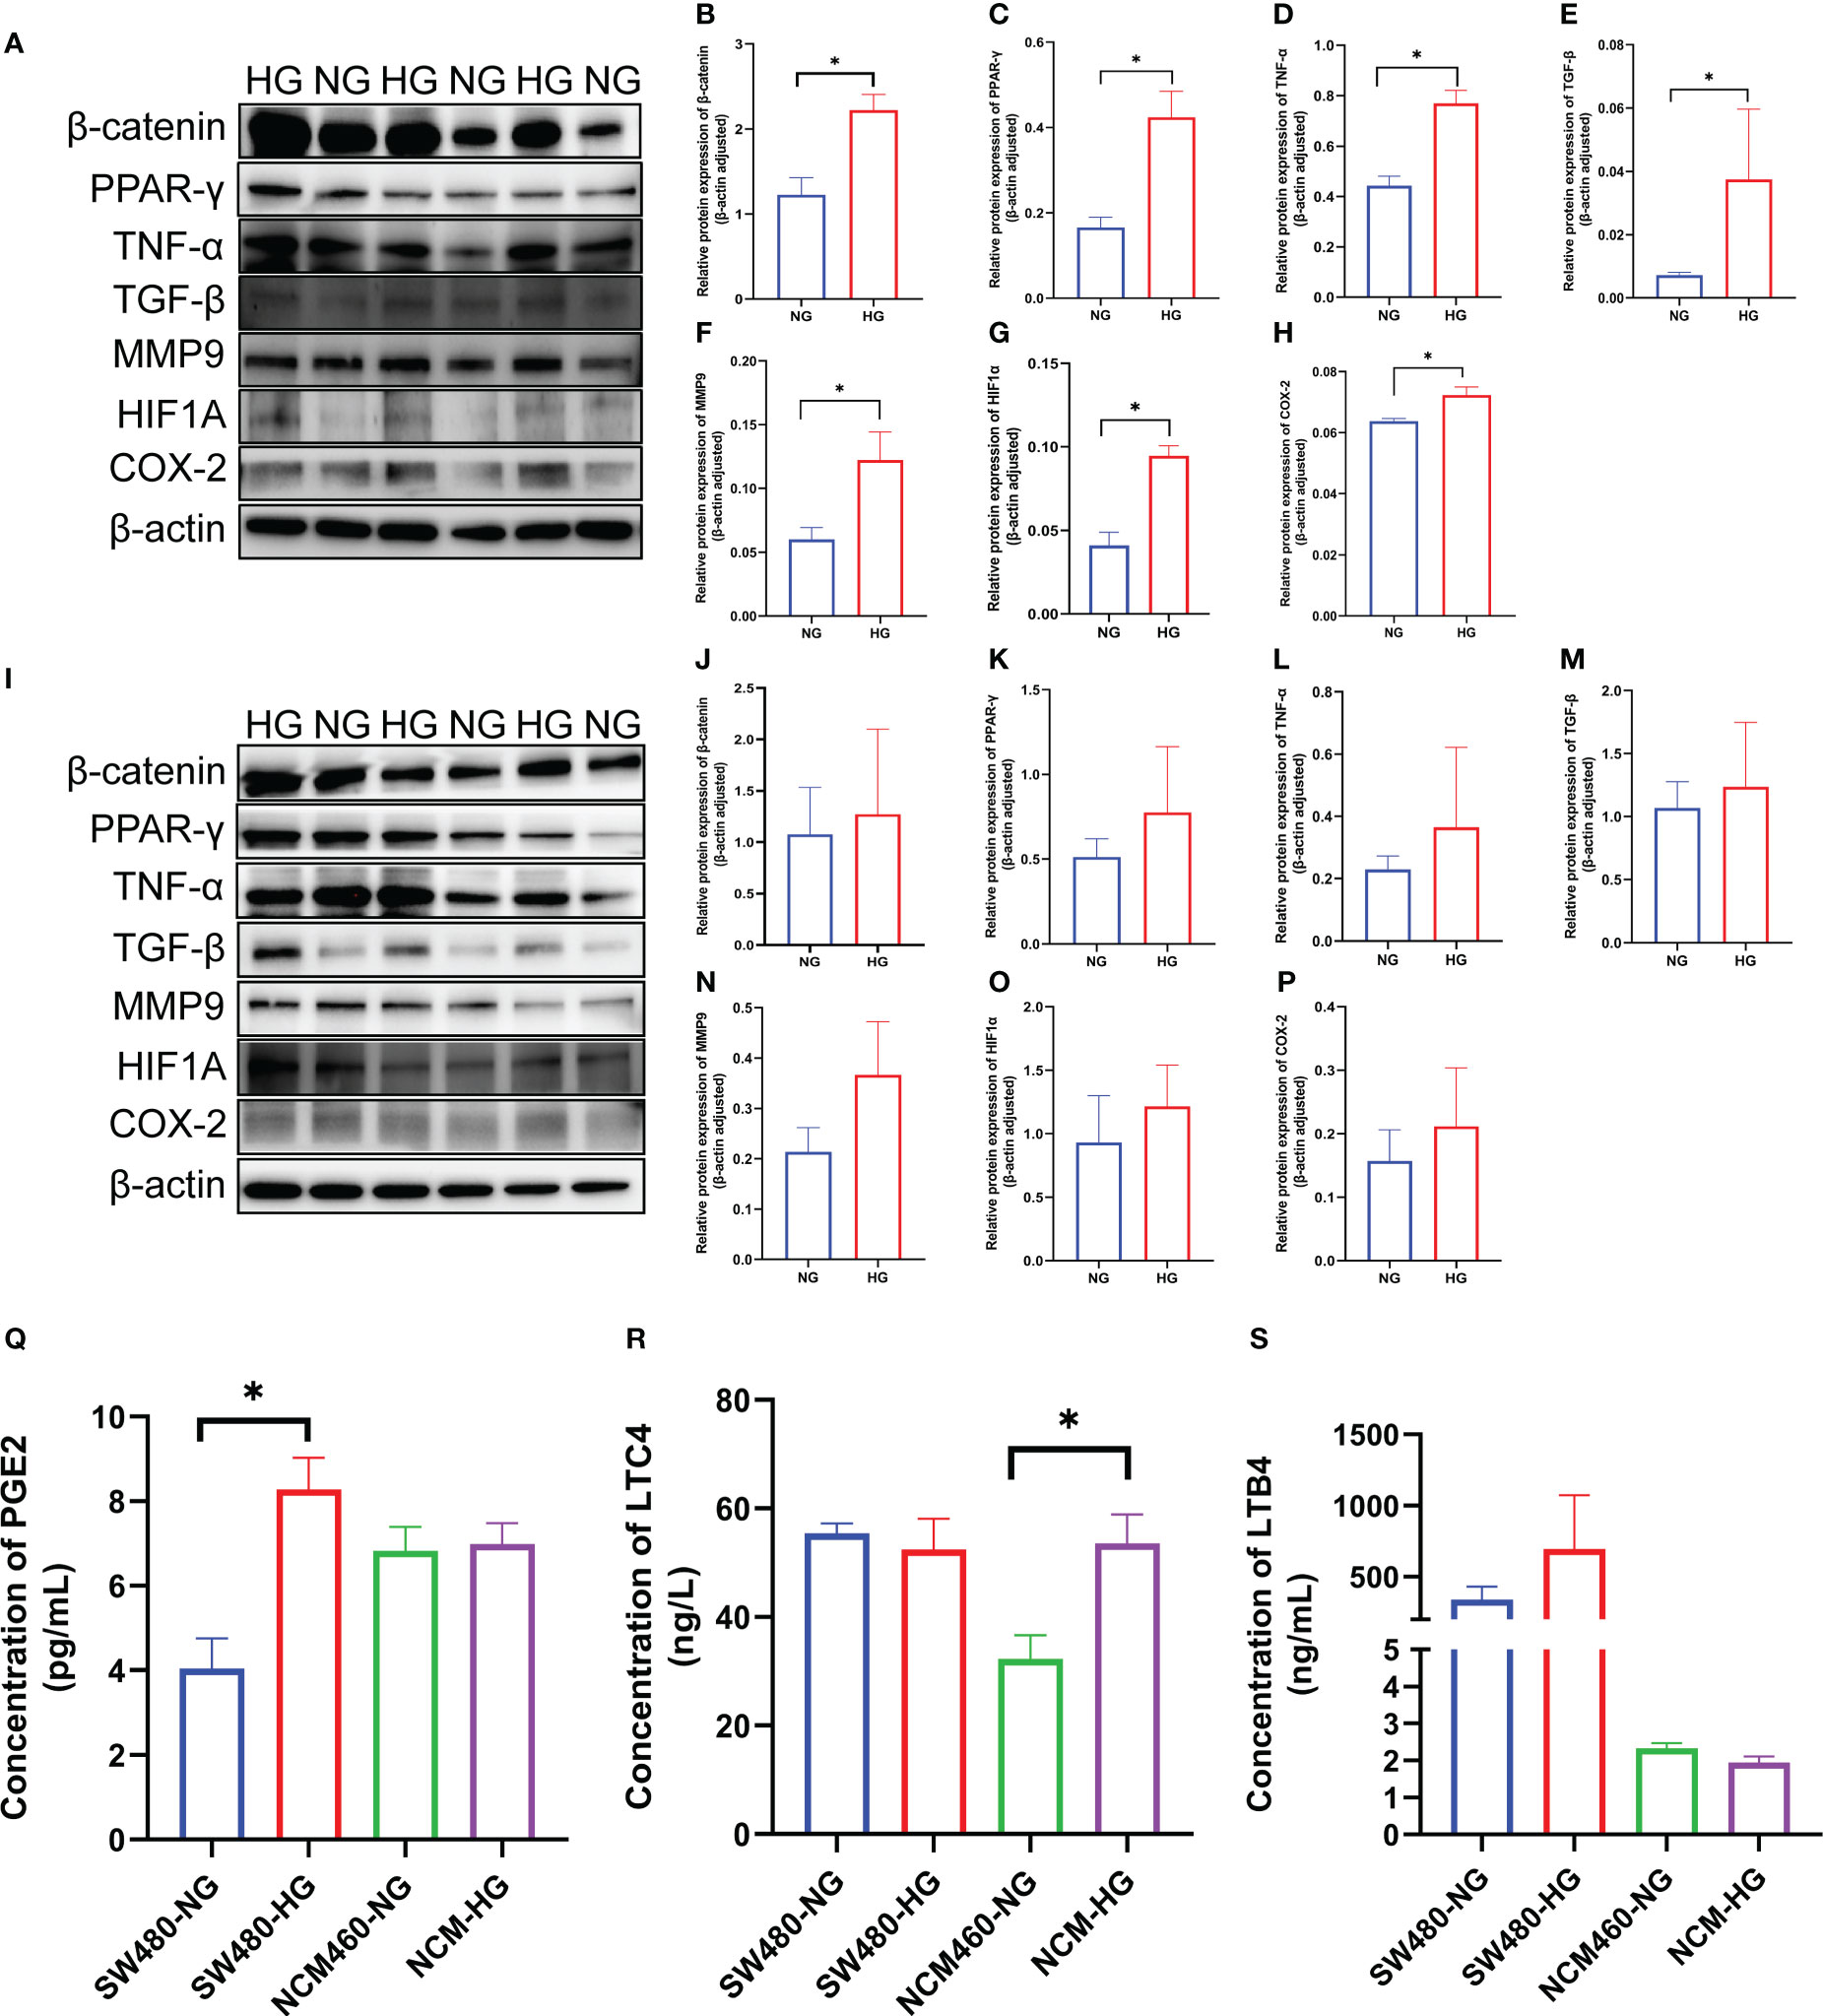
Figure 7 Verification of the seven DCRGs and arachidonic acid pathway in COAD. (A–H) Western blots of the seven DCRGs in the SW480 cells treated with NG or HG. (I–P) Western blots of the seven DCRGs in the NCM460 cells treated with NG or HG. (Q–S) ELISA of PCGE2, LTC4, and LTB4 in the SW480 and NCM460 cells treated with NG or HG. * P < 0.05 compared to controls. HG, high glucose; NG, normal glucose.
For the arachidonic acid pathway, the expression of PEG2 in colon cancer epithelial cells was significantly increased under high glucose, while LTC4 levels were unaltered compared to the controls. PEG2 was not significantly different in normal intestinal epithelial cells, while LTC4 expression was significantly higher under high glucose stimulation. Moreover, LTB4 did not exhibit significant differences in either colon cancer or normal intestinal epithelial cells (Figures 7Q–S).
Discussion
Numerous studies have shown that DM can promote the occurrence and development of tumors through inflammation. In this study, through bioinformatics analysis, we screened seven DCRGs, including PPARG, MMP9, CTNNB1, TNF, TGFB1, PTGS2, and HIF1A, and established a DCIN to comprehensively understand the diabetes-inflammation-cancer interaction (Figure 8). In addition, we found that the level of immune infiltration, immune subtypes, tumor microenvironment, mutation, the correlation with TMB and MSI, and the sensitivity of immune checkpoint-related drugs differed in this DCIN. Furthermore, the expression of DCRGs and the arachidonic acid metabolic pathway was verified in vitro. Together, we defined a DCIN and illustrated the potential mechanism through which diabetes may influence cancer.
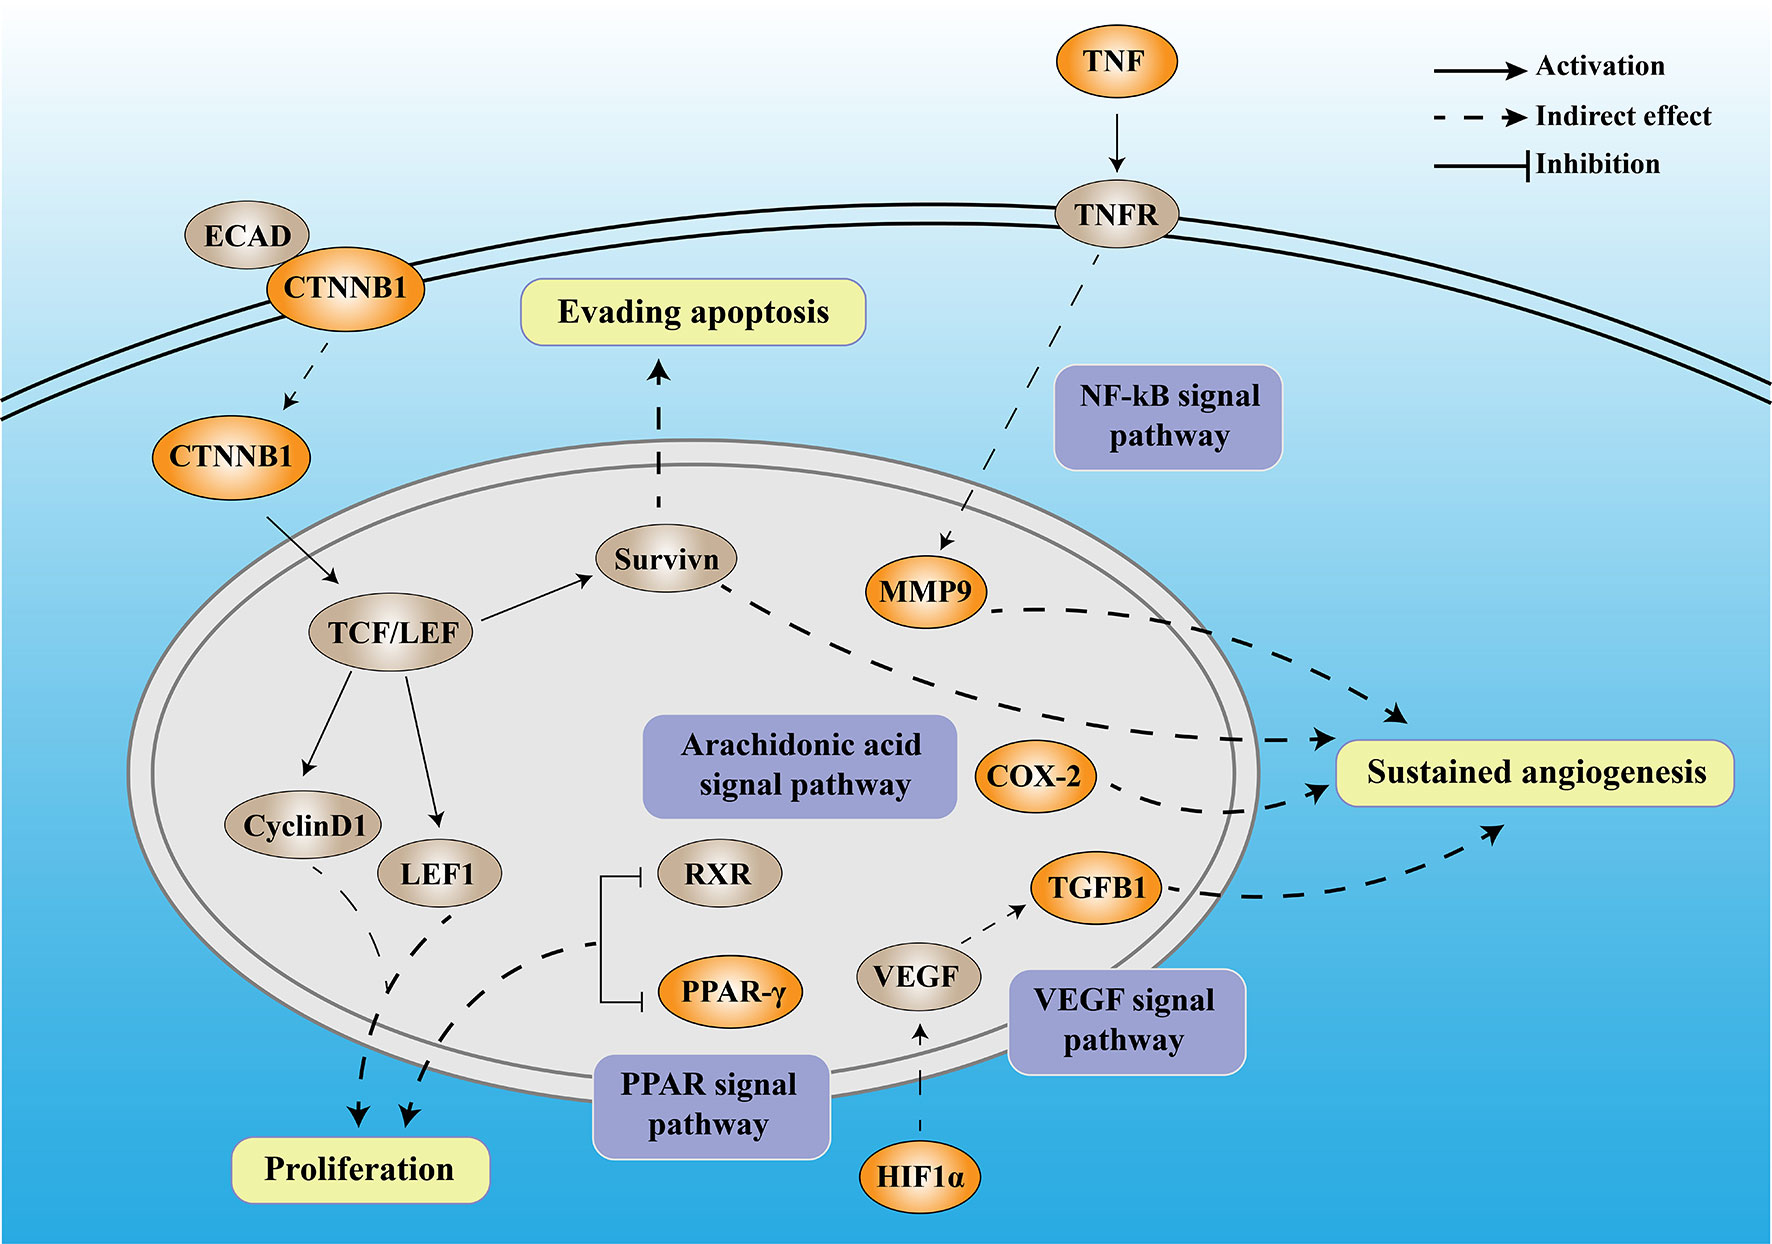
Figure 8 The mechanistic diagram of diabetes-based cancer-associated inflammation network (DCIN). The legend is included in the upper right corner of the image. The double-framed line in the upper part of the picture represents the cell membrane, and the double-framed line in the middle circle represents the nucleus. The orange gene represents the DCRGS screened out in this study, while the gray gene represents an important biological factor.
The DCIN is composed of seven DCRGs with established internal connections, supporting the notion of its existence. Among DCIN, tumor necrosis factor (TNF) is a pro-inflammatory cytokine produced and secreted by cytotoxic lymphocytes upon tumor target recognition. Matrix metalloproteinases 9 (MMP9), a member of the MMP family, has been widely studied in various cancers due to its critical role in the breakdown and reconstruction of the extracellular matrix during colorectal cancer (CRC) invasion and metastasis (29, 30). Both the tumor cells and surrounding stromal cells can synthesize MMPs (31). TNF-α upregulates MMP9 expression via c-Src, MAPKs, and NF-κB pathways (32). Moreover, MMP9 regulates the vascular endothelial growth factor (VEGF) signaling axis by cleaving membrane-bound VEGF, resulting in increased bioavailability of its receptor, VEGFR2 (33). Our results showed that TNF was highly expressed in almost all tumors, confirming its carcinogenicity, whereas MMP9 was highly expressed in all tumors except THYM, suggesting its potential utility as a therapeutic target for various tumors.
β-Catenin (CTNNB1) is a multifunctional protein involved in transcription and cell adhesion (34) that affects tumors in two ways. On the one hand, CTNNB1 promotes tumor development and progression through Survivin, which inhibits apoptosis, promotes cell cycle progression, and enhances angiogenesis (35). On the other hand, CTNNB1 knockdown inhibits the Wnt/β-catenin signaling pathway and downregulates the expression of downstream genes, including axin 2, lymphoid enhancer-binding factor 1 (LEF1), and cyclin D1, thereby inhibiting tumor proliferation (36). In our study, CTNNB1 was highly expressed in all the tumors except CESC, OV, UCEC, and UCS, confirming its carcinogenicity.
HIF-1α is part of the Hypoxia-inducible factor-1 (HIF-1) family (37), which is a key factor regulating cell adaptation to hypoxia (38). HIF1 can induce the expression of several pro-angiogenic factors, including vascular endothelial growth factor (VEGF) and VEGF receptors, FLT-1 and FLK-1. Among all these pro-angiogenic factors, VEGF-A, a potent endothelial mitogen, is a notable protein since it is highly expressed in many human tumors (39, 40). However, during the later stages of tumor development, TGFβ1 functions as a tumor promoter by inducing the epithelial-mesenchymal transition (EMT) in cancer cells, resulting in increased invasion and metastasis (41). Meanwhile, PTGS2, also known as COX-2, contributes to angiogenesis (42). COX-2 overexpression in colon cancer cells leads to the production of prostaglandins and the induction of pro-angiogenic factors such as vascular endothelial growth factor (VEGF) and basic fibroblast growth factor (bFGF), stimulating endothelial cell migration and tube formation (43, 44). In our study, the high and low expression levels of TGFβ1 in different tumors exhibited significant differences, which also reflected the dual role of TGFβ1. Peroxisome proliferator-activated receptors (PPARs) comprise three isotypes: PPARα, PPARγ, and PPARδ. The PPARG gene encodes PPARγ (45). The anti-tumor functions of PPARα and PPARγ are currently inconclusive and controversial (46). Downregulation of PPARγ could inhibit the proliferation of T24 cells, which might be caused by cell cycle arrest in the G0/G1 phase (47). PPARG has been demonstrated to have anti-neoplastic effects by arresting the cell cycle, causing terminal differentiation, and inhibiting inflammation (48). Here, over-expression of PPARG was a protective factor for five tumors and a risk factor for another five. It also confirmed that the role of PPARG varies in the different cancer types. Moreover, we found that high glucose stimulation can lead to increased expression of the seven DCRGs in colon cancer epithelium in vitro, while it does not affect their expression in normal colon epithelial cells. These results suggest that DM may promote the occurrence and development of tumors through DCIN. Together with the previous studies, our established DCIN revealed the internal relationship of each DCRG. We also verified the expression of DCRGs in vitro.
Meanwhile, to further verify the interaction between DCRGs, we analyzed them from different perspectives. The GSVA analysis showed that DCRGs were closely related to the arachidonic acid metabolic pathway. Arachidonic acid, specifically its metabolites, has attracted much attention in cancer biology, especially in inflammation (49). The importance of arachidonic acid in biology lies in the fact that it can be metabolized by three different enzyme systems, cyclooxygenases (COXs, also referred to as PGG/H synthases), lipoxygenases (LOXs), and cytochrome P450 (CYP) enzymes (ω-hydroxylases and epoxygenases) to generate an impressive spectrum of biologically active fatty acid mediators (50). The signaling of cyclooxygenase 2-prostaglandin E2-prostaglandin E2 receptors (COX-2-PGE2-EPs) is the central inflammatory pathway involved in carcinogenesis (51). COX is the primary enzyme in the synthesis of eicosanoids and exists in two isoforms: COX-1, which is ubiquitously expressed (52), and COX-2, which is expressed predominantly in inflammatory cells and upregulated in chronic and acute inflammations (53). Prostaglandins derived from COX-2 contribute to cancer progression and metastasis (54). The COX-2 expression is stimulated by different growth factors, cytokines, and prostaglandins, which are associated with inflammatory responses and have been shown as prognostic factors for malignancy (55). Furthermore, upregulation of COX-2 and PGE2 has been identified in many human cancers and precancerous lesions, and COX-inhibitory drugs have shown protective effects in colorectal cancer (56, 57). In addition to colorectal cancer, nonsteroidal anti-inflammatory drugs (NSAIDs) have also been associated with a reduced risk of breast, esophageal, stomach, bladder, ovary, and lung cancers (58, 59). We showed that the expression of PEG2 in colon cancer epithelial cells was significantly increased under high glucose compared to the control. In contrast, PEG2 had no significant difference in normal intestinal epithelial cells. These results suggest that DM may promote cancer occurrence and development through the arachidonic acid metabolic pathway.
In the immune infiltration analysis of the seven DCRGs and 26 immune cells, we found that MMP9 was associated with 12 tumors, PTGS2 was associated with 7 tumors, and TNF was associated with 5 tumors. There was a positive correlation between MMP9 and all the immune cells. These results suggest that DCRGs may influence tumor development and prognosis through the immune cells. Our genetic analysis showed a high frequency of copy number variations of DCRGs, and the prognosis of the mutational group was lower than the non-alterative group, indicating that mutations could affect the occurrence and development of tumors. According to research, breast cancer has been linked to mutations in MMP9 (60). Additionally, it may promote the invasion and metastasis of bladder cancer (61). PPARG mutations are closely associated with digestive tract cancers (colon, stomach, esophagus, and pancreas), melanoma, breast cancer, prostate cancer, and bladder cancer (62). The role of these seven DCRGs mutations in different tumors needs further investigation. Moreover, our analysis suggested that the TMB and MSI are correlated with the expression of the seven DCRGs in most tumors. In TNYM, a positive correlation was observed between the expression of all DCRGs and both TMB and MSI. However, in all DCRGs except THYM, a negative correlation was observed between TMB/MSI and TNF expression, indicating that the treatment strategies for TNYM may differ from other cancers at the level of immune checkpoints. In addition, drug sensitivity analysis suggested that the seven DCRGs potentially affected tumor drug response. Among them, Nelarabine was highly correlated with TNF, which has guiding clinical significance for the selection of anti-tumor therapy. Our analysis of immune subtypes revealed that DCRGs, in addition to CTNNB1, exhibited a strong association with the C6 immune subtype. The C6 is the immune subtype characterized by TGF-β dominance, which suggests that DCRs might be closely associated with the B-transforming growth factor. This finding is consistent with our previous results.
To further investigate the role of the seven DCRGs in colon cancer cells, single-cell sequencing data of colon cancer were analyzed. As a result, the activity of the seven DCRGs, estimated by the AUC value of each cell, was highest in macrophages. A previous study has reported that macrophages can promote pro-tumor inflammation by secreting pro-inflammatory cytokines. Macrophages can induce immune responses and support tumor growth and survival of malignant cells (63). Macrophages also play diverse roles in cancer development, ranging from anti-tumor activity at early stages of progression to tumor promotion in the most commonly established cancers (64). For DM, it has previously been suggested that hyperglycemia could enhance cancer immune evasion by increasing O-GlcNAcylation to induce alternative macrophage polarization (65). Thus, macrophages play a crucial role in the development of DM and cancer. MMP9 is secreted by macrophages and acts on PAR1 of PDAC cells to induce epithelial-to-mesenchymal transition. This macrophage-induced mesenchymal transition supports the tumor-promoting effect of macrophage influx, explaining the dual contribution of these immune cells to tumor growth (66). Studies have shown that TNF-α regulates diabetic macrophage function through the histone acetyltransferase MOF (67). Therefore, based on the single-cell and our experimental validation results, we concluded that the seven DCRGs were associated with immune inflammation, especially macrophages.
This study proposes the novel concept of DCIN, but it still has some limitations that need to be addressed. Firstly, the study only includes samples from China, which may limit the generalizability of the prediction model to other populations. Secondly, the results of this study have not been verified by other independent databases. However, we have followed up the results with our molecular biology experiments to make the results more convincing. Finally, the analysis in this study focused on the correlation between the DCRGs; however, biostatistical correlations alone cannot elucidate direct interactions and regulatory mechanisms. Therefore, our future experiments aim to verify the interaction of various molecules in the DCIN and elucidate the potential mechanisms of molecular action on tumors.
Conclusion
In this study, we constructed a DCIN for the first time (see Figure 8), which has provided valuable insights into the potential mechanisms by which T2DM may contribute to tumor occurrence and development. While additional research is needed to confirm our findings, our study results have also offered promising leads for the development of new therapeutic strategies aimed at preventing and treating malignant tumors.
Data availability statement
The raw data supporting the conclusions of this article will be made available by the authors, without undue reservation.
Author contributions
WP designed this study and revised the manuscript. YT and JK collected the data and performed the bioinformatic and statistical analysis, figure visualization, and manuscript writing. HL conducted WB and ELISA experiments. YL, AZ, RH, ZZ, and XC revised the manuscript. All authors contributed to the article and approved the submitted version.
Funding
This work was financially supported by the National Natural Science Foundation of China (No. 81873169), Hunan Youth Science and Technology Innovation Talent Project (No.2022RC1220), Hunan Provincial Natural Science Foundation of China (No.2020JJ4803), and Hunan Flagship Department of Integrated Traditional Chinese and Western Medicine.
Acknowledgments
We also thank Bullet Edits Limited for the linguistic editing and proofreading of the manuscript.
Conflict of interest
The authors declare that the research was conducted in the absence of any commercial or financial relationships that could be construed as a potential conflict of interest.
Publisher’s note
All claims expressed in this article are solely those of the authors and do not necessarily represent those of their affiliated organizations, or those of the publisher, the editors and the reviewers. Any product that may be evaluated in this article, or claim that may be made by its manufacturer, is not guaranteed or endorsed by the publisher.
Supplementary material
The Supplementary Material for this article can be found online at: https://www.frontiersin.org/articles/10.3389/fimmu.2023.1149810/full#supplementary-material
Supplementary Figure 1 | The gene set variation analysis (GSVA) pathways of the seven DCRGs. The length of the bar represents the t value, the blue bar represents t > 2, and the green bar represents t< -2
Supplementary Figure 2 | The survival analysis of the seven DCRGs across cancers. Kaplan-Meier plots of DCRGs across cancers show the differential survival outcomes of high- and low-expressing DCRGs (P < 0.05).
Supplementary Figure 3 | The correlation between immune cell infiltration and the seven DCRGs across cancers. The correlation coefficient R and the P-values are presented in the upper left corner of each panel. Only results for P<0.5 are shown.
Supplementary Figure 4 | Correlation analysis of the DCRGs with the stemness indices and microenvironment scores. (A, B) Heatmap showing the correlation of the seven DCGRs’ expression with immune and stromal scores. (C, D) Heatmaps showing the correlation of the DCRGs’ expression with stemness indices (DNAss and RNAss) in diabetes-inflammation-cancer-network TCGA cancer types. DNAss: DNA methylation-based stemness score, RNAss: RNA-based stemness score. Red points represent a positive correlation, while blue points represent a negative correlation.
Supplementary Figure 5 | Correlations of the seven DCRGs with the immunomodulators, TMB and MSI. (A) Correlations between expression of the seven DCRGs and tumor mutation burden (TMB) across cancers. (B) Correlations between expression of the seven DCRGs and microsatellite instability (MSI) across cancers. (C) Correlations between expression of the seven DCRGs and the immunomodulators in COAD.
Supplementary Figure 6 | Drug response analysis. The correlation between drug sensitivity and the DCRGs across different cancers from the TCGA database. The scatter plots are ranked by p-values.
Supplementary Figure 7 | (A) Gene set variation analysis of metabolic pathway in macrophages between normal and adenoma tissues. (B) Gene set variation analysis of metabolic pathway in macrophages between normal and carcinoma tissues. (C) UMAP plot of the AUC score of each cell type.
References
1. Risch HA. Diabetes and pancreatic cancer: Both cause and effect. J Natl Cancer Inst (2019) 111(1):1–2. doi: 10.1093/jnci/djy093
2. Shahid RK, Ahmed S, Le D, Yadav S. Diabetes and cancer: Risk, challenges, management and outcomes. Cancers (Basel). (2021) 13(22):5737. doi: 10.3390/cancers13225735
3. Hu Y, Zhang X, Ma Y, Yuan C, Wang M, Wu K, et al. Incident type 2 diabetes duration and cancer risk: A prospective study in two US cohorts. J Natl Cancer Inst (2021) 113(4):381–9. doi: 10.1093/jnci/djaa141
4. Grote VA, Becker S, Kaaks R. Diabetes mellitus type 2 - an independent risk factor for cancer, exp. Clin Endocrinol Diabetes (2010) 118:4–8. doi: 10.1055/s-0029-1243193
5. Végh D, Bányai D, Hermann P, Németh Z, Ujpál M. Type-2 diabetes mellitus and oral tumors in Hungary: A long-term comparative epidemiological study. Anticancer Res (2017) 37(4):1853–7. doi: 10.21873/anticanres.11521
6. Remschmidt B, Pau M, Gaessler J, Zemann W, Jakse N, Payer M, et al. Diabetes mellitus and oral cancer: A retrospective study from Austria. Anticancer Res (2022) 42(4):1899–903. doi: 10.21873/anticanres.15666
7. Harding JL, Andes LJ, Gregg EW, Cheng YJ, Weir HK, Bullard KM, et al. Trends in cancer mortality among people with vs without diabetes in the USA, 1988-2015. Diabetologia. (2020) 63(1):75–84. doi: 10.1007/s00125-019-04991-x
8. Suh S, Kim KW. Diabetes and cancer: Cancer should be screened in routine diabetes assessment. Diabetes Metab J (2019) 43(6):733–43. doi: 10.4093/dmj.2019.0177
9. Egan AM, Dow ML, Vella A. A review of the pathophysiology and management of diabetes in pregnancy. Mayo Clin Proc (2020) 95(12):2734–46. doi: 10.1016/j.mayocp.2020.02.019
10. Xiao Y, Wang H, Tang Y, Yan J, Cao L, Chen Z, et al. Increased risk of diabetes in cancer survivors: a pooled analysis of 13 population-based cohort studies. ESMO Open (2021) 6(4):100218. doi: 10.1016/j.esmoop.2021.100218
11. Huo Q, Wang J, Zhang N, Xie L, Yu H, Li T. Editorial: The relationship between diabetes and cancers and its underlying mechanisms. Front Endocrinol (Lausanne). (2022) 13:992569. doi: 10.3389/fendo.2022.992569
12. Tsilidis KK, Kasimis JC, Lopez DS, Ntzani EE, Ioannidis JP. Type 2 diabetes and cancer: umbrella review of meta-analyses of observational studies. BMJ (2015) ;350:g7607. doi: 10.1136/bmj.g7607
13. Balkwill F, Mantovani A. Inflammation and cancer: back to virchow. Lancet (2001) 357(9255):539–45. doi: 10.1016/S0140-6736(00)04046-0
14. American Diabetes Association. 2. classification and diagnosis of diabetes: Standards of medical care in diabetes-2021. Diabetes Care (2021) 44(Suppl 1):S15–15S33.
15. Lin WW, Karin M. A cytokine-mediated link between innate immunity, inflammation, and cancer. J Clin Invest. (2007) 117(5):1175–83. doi: 10.1172/JCI31537
16. Yu T, Robotham JL, Yoon Y. Increased production of reactive oxygen species in hyperglycemic conditions requires dynamic change of mitochondrial morphology. Proc Natl Acad Sci U S A. (2006) 103(8):2653–8. doi: 10.1073/pnas.0511154103
17. Aggeli IK, Theofilatos D, Beis I, Gaitanaki C. Insulin-induced oxidative stress up-regulates heme oxygenase-1 via diverse signaling cascades in the C2 skeletal myoblast cell line. Endocrinology. (2011) 152(4):1274–83. doi: 10.1210/en.2010-1319
18. Valko M, Rhodes CJ, Moncol J, Izakovic M, Mazur M. Free radicals, metals and antioxidants in oxidative stress-induced cancer. Chem Biol Interact (2006) 160(1):1–40. doi: 10.1016/j.cbi.2005.12.009
19. Valko M, Leibfritz D, Moncol J, Cronin MT, Mazur M, Telser J. Free radicals and antioxidants in normal physiological functions and human disease. Int J Biochem Cell Biol (2007) 39(1):44–84. doi: 10.1016/j.biocel.2006.07.001
20. Lee KC, Wong M. Functional heterogeneity of culture-grown bone marrow-derived macrophages. II. lymphokine stimulation of antigen-presenting function. J Immunol (1982) 128(6):2487–92.
21. Zhao H, Wu L, Yan G, Chen Y, Zhou M, Wu Y, et al. Inflammation and tumor progression: signaling pathways and targeted intervention. Signal Transduct Target Ther (2021) 6(1):263. doi: 10.1038/s41392-021-00658-5
22. Piñero J, Ramírez-Anguita JM, Saüch-Pitarch J, Ronzano F, Centeno E, Sanz F, et al. The DisGeNET knowledge platform for disease genomics: 2019 update. Nucleic Acids Res (2020) 48(D1):D845–845D855. doi: 10.1093/nar/gkz1021
23. Yoshihara K, Shahmoradgoli M, Martínez E, Vegesna R, Kim H, Torres-Garcia W, et al. Inferring tumour purity and stromal and immune cell admixture from expression data. Nat Commun (2013) 4:2612. doi: 10.1038/ncomms3612
24. Malta TM, Sokolov A, Gentles AJ, Burzykowski T, Poisson L, Weinstein JN, et al. Machine learning identifies stemness features associated with oncogenic dedifferentiation. Cell. (2018) 173(2):338–54.e15. doi: 10.1016/j.cell.2018.03.034
25. Wu C, Tan J, Wang X, Qin C, Long W, Pan Y, et al. Pan-cancer analyses reveal molecular and clinical characteristics of cuproptosis regulators. (2022). doi: 10.1002/imt2.68
26. Choucair K, Morand S, Stanbery L, Edelman G, Dworkin L, Nemunaitis J. TMB: a promising immune-response biomarker, and potential spearhead in advancing targeted therapy trials. Cancer Gene Ther (2020) 27(12):841–53. doi: 10.1038/s41417-020-0174-y
27. van Velzen M, Derks S, van Grieken N, Haj Mohammad N, van Laarhoven H. MSI as a predictive factor for treatment outcome of gastroesophageal adenocarcinoma. Cancer Treat Rev (2020) 86:102024. doi: 10.1016/j.ctrv.2020.102024
28. Zheng X, Song J, Yu C, Zhou Z, Liu X, Yu J, et al. Single-cell transcriptomic profiling unravels the adenoma-initiation role of protein tyrosine kinases during colorectal tumorigenesis. Signal Transduct Target Ther (2022) 7(1):60. doi: 10.1038/s41392-022-00881-8
29. Kushlinskii NE, Gershtein ES, Korotkova EA, Prorokov VV. Prognostic role of tumor-associated proteases in colorectal cancer. Bull Exp Biol Med (2013) 154(3):365–9. doi: 10.1007/s10517-013-1952-4
30. Langenskiöld M, Ivarsson ML, Holmdahl L, Falk P, Kåbjörn-Gustafsson C, Angenete E. Intestinal mucosal MMP-1 - a prognostic factor in colon cancer. Scand J Gastroenterol (2013) 48(5):563–9. doi: 10.3109/00365521.2012.708939
31. Mroczko B, Groblewska M, Okulczyk B, Kedra B, Szmitkowski M. The diagnostic value of matrix metalloproteinase 9 (MMP-9) and tissue inhibitor of matrix metalloproteinases 1 (TIMP-1) determination in the sera of colorectal adenoma and cancer patients. Int J Colorectal Dis (2010) 25(10):1177–84. doi: 10.1007/s00384-010-0991-9
32. Tsai CL, Chen WC, Hsieh HL, Chi PL, Hsiao LD, Yang CM. TNF-α induces matrix metalloproteinase-9-dependent soluble intercellular adhesion molecule-1 release via TRAF2-mediated MAPKs and NF-κB activation in osteoblast-like MC3T3-E1 cells. J BioMed Sci (2014) 21:12. doi: 10.1186/1423-0127-21-12
33. Aalinkeel R, Nair BB, Reynolds JL, Sykes DE, Mahajan SD, Chadha KC, et al. Overexpression of MMP-9 contributes to invasiveness of prostate cancer cell line LNCaP. Immunol Invest. (2011) 40(5):447–64. doi: 10.3109/08820139.2011.557795
34. Kurnit KC, Kim GN, Fellman BM, Urbauer DL, Mills GB, Zhang W, et al. CTNNB1 (beta-catenin) mutation identifies low grade, early stage endometrial cancer patients at increased risk of recurrence. Mod Pathol (2017) 30(7):1032–41. doi: 10.1038/modpathol.2017.15
35. Altieri DC. Survivin, cancer networks and pathway-directed drug discovery. Nat Rev Cancer. (2008) 8(1):61–70. doi: 10.1038/nrc2293
36. Zhou T, Luo P, Wang L, Yang S, Qin S, Wei Z, et al. CTNNB1 knockdown inhibits cell proliferation and aldosterone secretion through inhibiting wnt/β-catenin signaling in H295R cells. Technol Cancer Res Treat (2020) 19:1533033820979685. doi: 10.1177/1533033820979685
37. Harris AL. Hypoxia–a key regulatory factor in tumour growth. Nat Rev Cancer. (2002) 2(1):38–47. doi: 10.1038/nrc704
38. Freedman SJ, Sun ZY, Poy F, Kung AL, Livingston DM, Wagner G, et al. Structural basis for recruitment of CBP/p300 by hypoxia-inducible factor-1 alpha. Proc Natl Acad Sci U S A. (2002) 99(8):5367–72. doi: 10.1073/pnas.082117899
39. Prager GW, Poettler M, Unseld M, Zielinski CC. Angiogenesis in cancer: Anti-VEGF escape mechanisms. Transl Lung Cancer Res (2012) 1(1):14–25. doi: 10.3978/j.issn.2218-6751.2011.11.02
40. Zhao Y, Adjei AA. Targeting angiogenesis in cancer therapy: Moving beyond vascular endothelial growth factor. Oncologist. (2015) 20(6):660–73. doi: 10.1634/theoncologist.2014-0465
41. Santos JI, Teixeira AL, Dias F, Gomes M, Nogueira A, Assis J, et al. Restoring TGFβ1 pathway-related microRNAs: possible impact in metastatic prostate cancer development. Tumour Biol (2014) 35(7):6245–53. doi: 10.1007/s13277-014-1887-z
42. Cheng G, Gao J, Wang L, Ding Y, Wu Q, Wang Q, et al. The TGF-β1/COX-2-dependant pathway serves a key role in the generation of OKC-induced M2-polarized macrophage-like cells and angiogenesis. Oncol Lett (2020) 20(4):39. doi: 10.3892/ol.2020.11900
43. Vieira TC, Oliveira EA, Dos Santos BJ, Souza FR, Veloso ES, Nunes CB, et al. COX-2 expression in mammary invasive micropapillary carcinoma is associated with prognostic factors and acts as a potential therapeutic target in comparative oncology. Front Vet Sci (2022) 9:983110. doi: 10.3389/fvets.2022.983110
44. Vimalraj S. A concise review of VEGF, PDGF, FGF, notch, angiopoietin, and HGF signalling in tumor angiogenesis with a focus on alternative approaches and future directions. Int J Biol Macromol. (2022) 221:1428–38. doi: 10.1016/j.ijbiomac.2022.09.129
45. Gross B, Pawlak M, Lefebvre P, Staels B. PPARs in obesity-induced T2DM, dyslipidaemia and NAFLD. Nat Rev Endocrinol (2017) 13(1):36–49. doi: 10.1038/nrendo.2016.135
46. Mirza AZ, Althagafi II, Shamshad H. Role of PPAR receptor in different diseases and their ligands: Physiological importance and clinical implications. Eur J Med Chem (2019) 166:502–13. doi: 10.1016/j.ejmech.2019.01.067
47. Cheng S, Qian K, Wang Y, Wang G, Liu X, Xiao Y, et al. PPARγ inhibition regulates the cell cycle, proliferation and motility of bladder cancer cells. J Cell Mol Med (2019) 23(5):3724–36. doi: 10.1111/jcmm.14280
48. Bandera Merchan B, Tinahones FJ, Macías-González M. Commonalities in the association between PPARG and vitamin d related with obesity and carcinogenesis. PPAR Res (2016) 2016:2308249. doi: 10.1155/2016/2308249
49. Patrignani P, Patrono C. Aspirin and cancer. J Am Coll Cardiol (2016) 68(9):967–76. doi: 10.1016/j.jacc.2016.05.083
50. Wang B, Wu L, Chen J, Dong L, Chen C, Wen Z, et al. Metabolism pathways of arachidonic acids: mechanisms and potential therapeutic targets. Signal Transduct Target Ther (2021) 6(1):94. doi: 10.1038/s41392-020-00443-w
51. Ye Y, Wang X, Jeschke U, von Schönfeldt V. COX-2-PGE2-EPs in gynecological cancers. Arch Gynecol Obstet. (2020) 301(6):1365–75. doi: 10.1007/s00404-020-05559-6
52. Wang D, Wang H, Brown J, Daikoku T, Ning W, Shi Q, et al. CXCL1 induced by prostaglandin E2 promotes angiogenesis in colorectal cancer. J Exp Med (2006) 203(4):941–51. doi: 10.1084/jem.20052124
53. Ferrer MD, Busquets-Cortés C, Capó X, Tejada S, Tur JA, Pons A, et al. Cyclooxygenase-2 inhibitors as a therapeutic target in inflammatory diseases. Curr Med Chem (2019) 26(18):3225–41. doi: 10.2174/0929867325666180514112124
54. Kim HS, Kim T, Kim MK, Suh DH, Chung HH, Song YS. Cyclooxygenase-1 and -2: molecular targets for cervical neoplasia. J Cancer Prev (2013) 18(2):123–34. doi: 10.15430/JCP.2013.18.2.123
55. Williams CS, DuBois RN. Prostaglandin endoperoxide synthase: why two isoforms. Am J Physiol (1996) 270(3 Pt 1):G393–400. doi: 10.1152/ajpgi.1996.270.3.G393
56. Guo CG, Ma W, Drew DA, Cao Y, Nguyen LH, Joshi AD, et al. Aspirin use and risk of colorectal cancer among older adults. JAMA Oncol (2021) 7(3):428–35. doi: 10.1001/jamaoncol.2020.7338
57. Zhang Y, Chan AT, Meyerhardt JA, Giovannucci EL. Timing of aspirin use in colorectal cancer chemoprevention: A prospective cohort study. J Natl Cancer Inst (2021) 113(7):841–51. doi: 10.1093/jnci/djab009
58. Song Y, Zhong X, Gao P, Zhou C, Shi J, Wu Z, et al. Aspirin and its potential preventive role in cancer: An umbrella review. Front Endocrinol (Lausanne). (2020) 11:3. doi: 10.3389/fendo.2020.00003
59. Santucci C, Gallus S, Martinetti M, La Vecchia C, Bosetti C. Aspirin and the risk of nondigestive tract cancers: An updated meta-analysis to 2019. Int J Cancer. (2021) 148(6):1372–82. doi: 10.1002/ijc.33311
60. Yan C, Sun C, Lu D, Zhao T, Ding X, Zamir I, et al. Estimation of associations between MMP9 gene polymorphisms and breast cancer: Evidence from a meta-analysis. Int J Biol Markers (2022) 37:13–20. doi: 10.1177/17246008221076145
61. Liu F, Zhang H, Xie F, Tao D, Xiao X, Huang C, et al. Hsa_circ_0001361 promotes bladder cancer invasion and metastasis through miR-491-5p/MMP9 axis. Oncogene (2020) 39:1696–709. doi: 10.1038/s41388-019-1092-z
62. Hernandez-Quiles M, Broekema MF, Kalkhoven E. PPARgamma in metabolism, immunity, and cancer: Unified and diverse mechanisms of action. Front Endocrinol (Lausanne) (2021) 12:624112. doi: 10.3389/fendo.2021.624112
63. Cendrowicz E, Sas Z, Bremer E, Rygiel TP. The role of macrophages in cancer development and therapy. Cancers (Basel). (2021) 13(8):1946. doi: 10.3390/cancers13081946
64. Noy R, Pollard JW. Tumor-associated macrophages: from mechanisms to therapy. Immunity. (2014) 41(1):49–61. doi: 10.1016/j.immuni.2014.06.010
65. Rodrigues Mantuano N, Stanczak MA, Oliveira IA, Kirchhammer N, Filardy AA, Monaco G, et al. Hyperglycemia enhances cancer immune evasion by inducing alternative macrophage polarization through increased O-GlcNAcylation. Cancer Immunol Res (2020) 8(10):1262–72. doi: 10.1158/2326-6066.CIR-19-0904
66. Tekin C, Aberson HL, Waasdorp C, Hooijer G, de Boer OJ, Dijk F, et al. Macrophage-secreted MMP9 induces mesenchymal transition in pancreatic cancer cells via PAR1 activation. Cell Oncol (Dordr). (2020) 43(6):1161–74. doi: 10.1007/s13402-020-00549-x
67. denDekker AD, Davis FM, Joshi AD, Wolf SJ, Allen R, Lipinski J, et al. TNF-α regulates diabetic macrophage function through the histone acetyltransferase MOF. JCI Insight (2020) 5(5):132306. doi: 10.1172/jci.insight.132306
Glossary
Keywords: diabetes and cancer-related genes (DCRG), diabetes-based cancer-associated inflammation network (DCIN), diabetes mellitus, inflammation, cancer
Citation: Tan Y, Kang J, Li H, Zhong A, Liu Y, Zhang Z, Huang R, Cheng X and Peng W (2023) Diabetes mellitus induces a novel inflammatory network involving cancer progression: Insights from bioinformatic analysis and in vitro validation. Front. Immunol. 14:1149810. doi: 10.3389/fimmu.2023.1149810
Received: 23 January 2023; Accepted: 14 March 2023;
Published: 23 March 2023.
Edited by:
Yufeng Yao, Huazhong University of Science and Technology, ChinaReviewed by:
Daniel Vegh, Semmelweis University, HungaryHuang Chuiguo, The Chinese University of Hong Kong, China
Subhash Kumar Tripathi, Seattle Children’s Research Institute, United States
Copyright © 2023 Tan, Kang, Li, Zhong, Liu, Zhang, Huang, Cheng and Peng. This is an open-access article distributed under the terms of the Creative Commons Attribution License (CC BY). The use, distribution or reproduction in other forums is permitted, provided the original author(s) and the copyright owner(s) are credited and that the original publication in this journal is cited, in accordance with accepted academic practice. No use, distribution or reproduction is permitted which does not comply with these terms.
*Correspondence: Weijun Peng, cGVuZ3dlaWp1bjg3QGNzdS5lZHUuY24=
†These authors have contributed equally to this work
‡ORCID: Weijun Peng, orcid.org/0000-0002-4506-0942