 Yoshiro Yamashita1,2*
 Ikkoh Yasuda1,3
 Takeshi Tanaka4Toru Ikeda5Mayumi Terada6Masahiro Takaki2Yoshiko Tsuchihashi7Norichika Asoh7Yukiko Ohara8Shymaa Enany9,10Haruka Kobayashi8
 Sohkichi Matsumoto8
 Konosuke Morimoto6,11
- 1Department of Clinical Medicine, Institute of Tropical Medicine, Nagasaki University, Nagasaki, Nagasaki, Japan
- 2Department of Respiratory Medicine, Shunkaikai Inoue Hospital, Nagasaki, Nagasaki, Japan
- 3Department of General Internal Medicine and Clinical Infectious Diseases, Fukushima Medical University, Fukushima, Fukushima, Japan
- 4Infection Control and Education Center, Nagasaki University Hospital, Nagasaki, Nagasaki, Japan
- 5Department of Respiratory Medicine, Nagasaki Rosai Hospital, Sasebo, Nagasaki, Japan
- 6Department of Internal Medicine, Koseikai Nijigaoka Hospital, Nagasaki, Nagasaki, Japan
- 7Department of Respiratory Medicine, Juzenkai Hospital, Nagasaki, Nagasaki, Japan
- 8Department of Bacteriology, Niigata University Graduate School of Medicine, Niigata, Niigata, Japan
- 9Department of Microbiology and Immunology, Faculty of Pharmacy, Suez Canal University, Ismailia, Egypt
- 10Biomedical Research Department, Armed Force College of Medicine, Cairo, Egypt
- 11Department of Respiratory Infectious Disease, Institute of Tropical Medicine, Nagasaki University, Nagasaki, Nagasaki, Japan
Introduction: Controlling pulmonary Mycobacterium avium complex (MAC) disease is difficult because there is no way to know the clinical stage accurately. There have been few attempts to use cell-mediated immunity for diagnosing the stage. The objective of this study was to characterize cytokine profiles of CD4+T and CD19+B cells that recognize various Mycobacterium avium-associated antigens in different clinical stages of MAC.
Methods: A total of 47 MAC patients at different stages based on clinical information (14 before-treatment, 16 on-treatment, and 17 after-treatment) and 17 healthy controls were recruited. Peripheral blood mononuclear cells were cultured with specific antigens (MAV0968, 1160, 1276, and 4925), and the cytokine profiles (IFN-γ, TNF-α, IL-2, IL-10, IL-13, and IL-17) of CD4+/CD3+ and CD19+ cells were analyzed by flow cytometry.
Results: The response of Th1 cytokines such as IFN-γ and TNF-α against various antigens was significantly higher in both the on-treatment and after-treatment groups than in the before-treatment group and control (P < 0.01–0.0001 and P < 0.05–0.0001). An analysis of polyfunctional T cells suggested that the presence of IL-2 is closely related to the stage after the start of treatment (P = 0.0309-P < 0.0001) and is involved in memory function. Non-Th1 cytokines, such as IL-10 and IL-17, showed significantly higher responses in the before-treatment group (P < 0.0001 and P < 0.01–0.0001). These responses were not observed with purified protein derivative (PPD). CD19+B cells showed a response similar to that of CD4+T cells.
Conclusion: There is a characteristic cytokine profile at each clinical stage of MAC.
1 Introduction
Pulmonary non-tuberculosis mycobacterial disease (pNTM) is a major form of the non-tuberculosis mycobacterial disease (NTM), and Mycobacterium avium complex (MAC) is the most common pathogen (1). NTM is thought to have a comparatively high prevalence in North America and East Asia (2). In Japan, the incidence of pNTM is 14.7 per 100,000 person-years (3), seven times the incidence in the 1990s. In the United States, the incidence in 2015 was 4.73 per 100,000 person-years, and the annual change in incidence was +5.2% (4). The incidence of pNTM in England also rose from 5.6 per 100,000 person-years in 2007 to 7.6 per 100,000 person-years in 2012 (5). Thus, its incidence and associated prevalence are increasing worldwide. Considering that the annual economic burden per patient is estimated to exceed $10,000 (6, 7), the burden of pNTM is getting heavier.
A clinical strategy for controlling pNTM has not yet been established. Because the clinical course of pNTM varies (8, 9), clinicians cannot determine its clinical stage accurately and tend to miss the appropriate timing for starting or finishing antimicrobial therapy. To establish a treatment strategy, the clinical stage of pNTM must be determined accurately.
CD4+T cells, the main casts of cell-mediated immunity, are known to change their properties according to antigen load, specifically, T-helper (Th) 1 (10, 11). Due to their ability to change properties, Th1-CD4+T cells can produce cytokines, such as IFN-γ, TNF-α, and IL-2, either simultaneously or separately. Similar changes have been observed for tuberculosis (TB)-specific Th1-CD4+T cells (12, 13). Antigen load reflects the severity of infection; therefore, the Th1 cytokine profile can vary according to the clinical stage. In addition to Th1, CD4+T cells have subsets such as Th2, Th17, and regulatory T cells (Treg) (14). Because these subsets are thought to cooperate or interfere with each other throughout an infection, they are also expected to show various cytokine production reactions depending on the severity of an infection. Characteristic cytokine profiles for each stage are known in TB (15), but not in MAC disease.
Furthermore, other lymphocytes, such as B cells, assist in CD4+T cell function. Some B cells have memory functions (16). Some B cells produce cytokines (17); however, it is not known whether memory (MAC-specific) B cells produce cytokines.
We postulate that a comprehensive evaluation of CD4+T cell function is needed to determine the clinical stages of MAC. Moreover, information on B cell function complements our understanding of the environment of CD4+T cells in MAC. This study aims to characterize the cytokine profile of CD4+T cells against Mycobacterium avium (MA)-associated antigens at different clinical stages of MAC.
2 Methods
2.1 Study participants
MAC pulmonary disease cases were defined as participants with pulmonary shadows that were consistent with those of pNTM (nodular or cavitary opacities on chest radiograph or a high-resolution computed tomography scan that shows bronchiectasis with multiple small nodules) and with more than one positive finding of culture or PCR analyses from sputum or bronchoalveolar lavage fluid or more than one positive finding of blood IgA antibody against glycopeptidolipid-core antigen (18, 19). Treatment was performed according to the guidelines of the Japanese Society for Tuberculosis and Non-tuberculous Mycobacteriosis, and there were no retreatment cases. Healthy controls were defined as participants with no history of MAC and no suspicions of pNTM.
Participants were recruited from Nagasaki University Hospital, Nagasaki Rosai Hospital, Shunkaikai Inoue Hospital, Kosei-kai Nijigaoka Hospital, and Juzenkai Hospital. All blood samples included in this study were drawn after obtaining informed consent from participants and ethical approval from the Institute of Tropical Medicine and Nagasaki University Joint Ethics Committee (number: 191003222).
The participants were divided into three study groups (before-treatment, on-treatment, and after-treatment) based on the clinical information. Before-treatment cases were defined as those who had never been treated with drugs (before initiation of drug treatment). On-treatment cases were defined as those who were undergoing drug treatment when the blood samples were collected, and after-treatment cases were defined as those who had completed drug treatment. Finally, we compared outcomes between the three study groups and the control group.
2.2 Reagents
MAV0986, MAV1160, MAV1276, and MAV4925 are recombinant protein products of MA. MAV1160 is a diaminopimelic acid decarboxylase. MAV1276 is an acetyl-CoA acetyltransferase. MAV4925 is a glucose-methanol-choline oxidoreductase. However, the function of MAV0986 remains unclear. The synthesis of these proteins was carried out as described in the online supplement.
The fluorescently labeled monoclonal antibodies used in this study are also shown in the online supplement.
2.3 In vitro peripheral blood mononuclear cell culture and antigen stimulation
Peripheral blood mononuclear cell isolation and culture were performed as described previously (20). Cells were isolated within 8 h of obtaining heparinized blood samples. Each MA-associated antigen concentration was 2.1 µg/ml. Staphylococcus endotoxin b (15 μg/ml) and Purified Protein Derivative (25 μg/ml) were used as positive controls. Cultures without antigens (as negative control) were also included. All antigen stimulations were performed in the presence of CD28/CD49d co-stimulator (0.5 µg/ml) and Golgi blocker: brefeldin-A (1 µg/ml) and monensin (0.5 µM). Cell incubation was overnight at 37 °C in a 5% CO2 incubator.
2.4 Cell staining and flow cytometry analyses
Cell surface staining, permeabilization, and intracellular cytokine staining were performed as described previously (20). For surface staining, 30% goat serum containing anti-CD3, anti-CD4, anti-CD19, FcR blocking reagent, and LIVE/DEAD reagent was added. For intracellular cytokine staining, an anti-cytokine monoclonal antibody cocktail and FcR-blocking reagent were added. Cells were acquired using Gallios (Beckman Coulter). Flow cytometry data were analyzed using FlowJo software, version 10 (TreeStar, San Carlos, CA, USA). The gating strategy for flow cytometric analysis is shown in Supplementary Figure 2.
2.5 Statistical analysis
Group medians and distributions were analyzed using the Kruskal-Wallis test with post-hoc Dunn’s comparison test. The medians and distributions of the two groups were analyzed using the Mann-Whitney U test. The group ratios were analyzed using the chi-square test. Correlations were analyzed using the Spearman correlation test. Analyses were performed using GraphPad Prism software version 7 (GraphPad Software, San Diego, CA, USA). The threshold for significance was set at P < 0.05.
3 Results
3.1 Study participants
A total of 47 MAC cases and 18 healthy controls were recruited for this study. One control was excluded due to impaired blood sample quality. Subsequently, 14 before-treatment, 16 on-treatment (median duration of treatment —13 months), 17 after-treatment cases (median duration after completion of treatment — 62 months), and 17 healthy controls were evaluated.
None of the participants were diagnosed with HIV or other immunodeficiencies. The characteristics of the participants are presented in Table 1. There were no significant differences in median age and BMI between the groups. In addition, there were no significant differences in the percentages of men and selected clinical histories (diabetes, malignancy, chronic respiratory disease, immunosuppressant use, and smoking) between the groups.
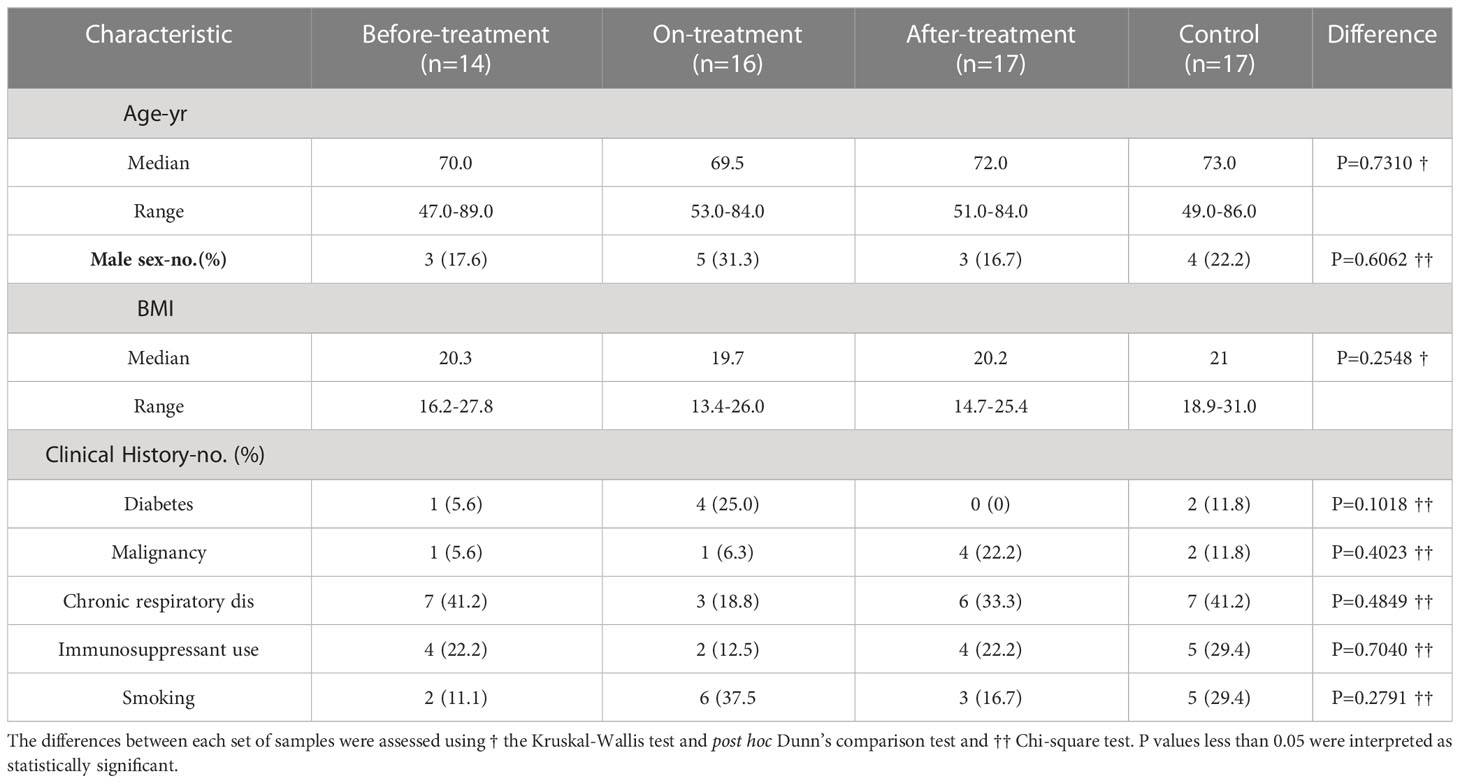
Table 1 Characteristics of the participants.
3.2 Cytokine response of CD4+T cells to a range of MA-associated antigens
Figure 1 shows the Th1 cytokine (IFN-γ, TNF-α, and IL-2) responses of CD4+T cells to a range of MA-associated antigens in before-treatment, on-treatment, and after-treatment groups compared to that of the control group. When stimulated with MA-associated antigen instead of purified protein derivative (PPD), the groups exposed to the treatment (on-treatment and after-treatment) showed significantly higher Th1 cytokine responses than the controls. These groups also showed higher Th1 cytokine responses than the before-treatment group. Although no significant differences were observed, IL-2 responses to MAV1276 and MAV4925 tended to increase in the after-treatment group.
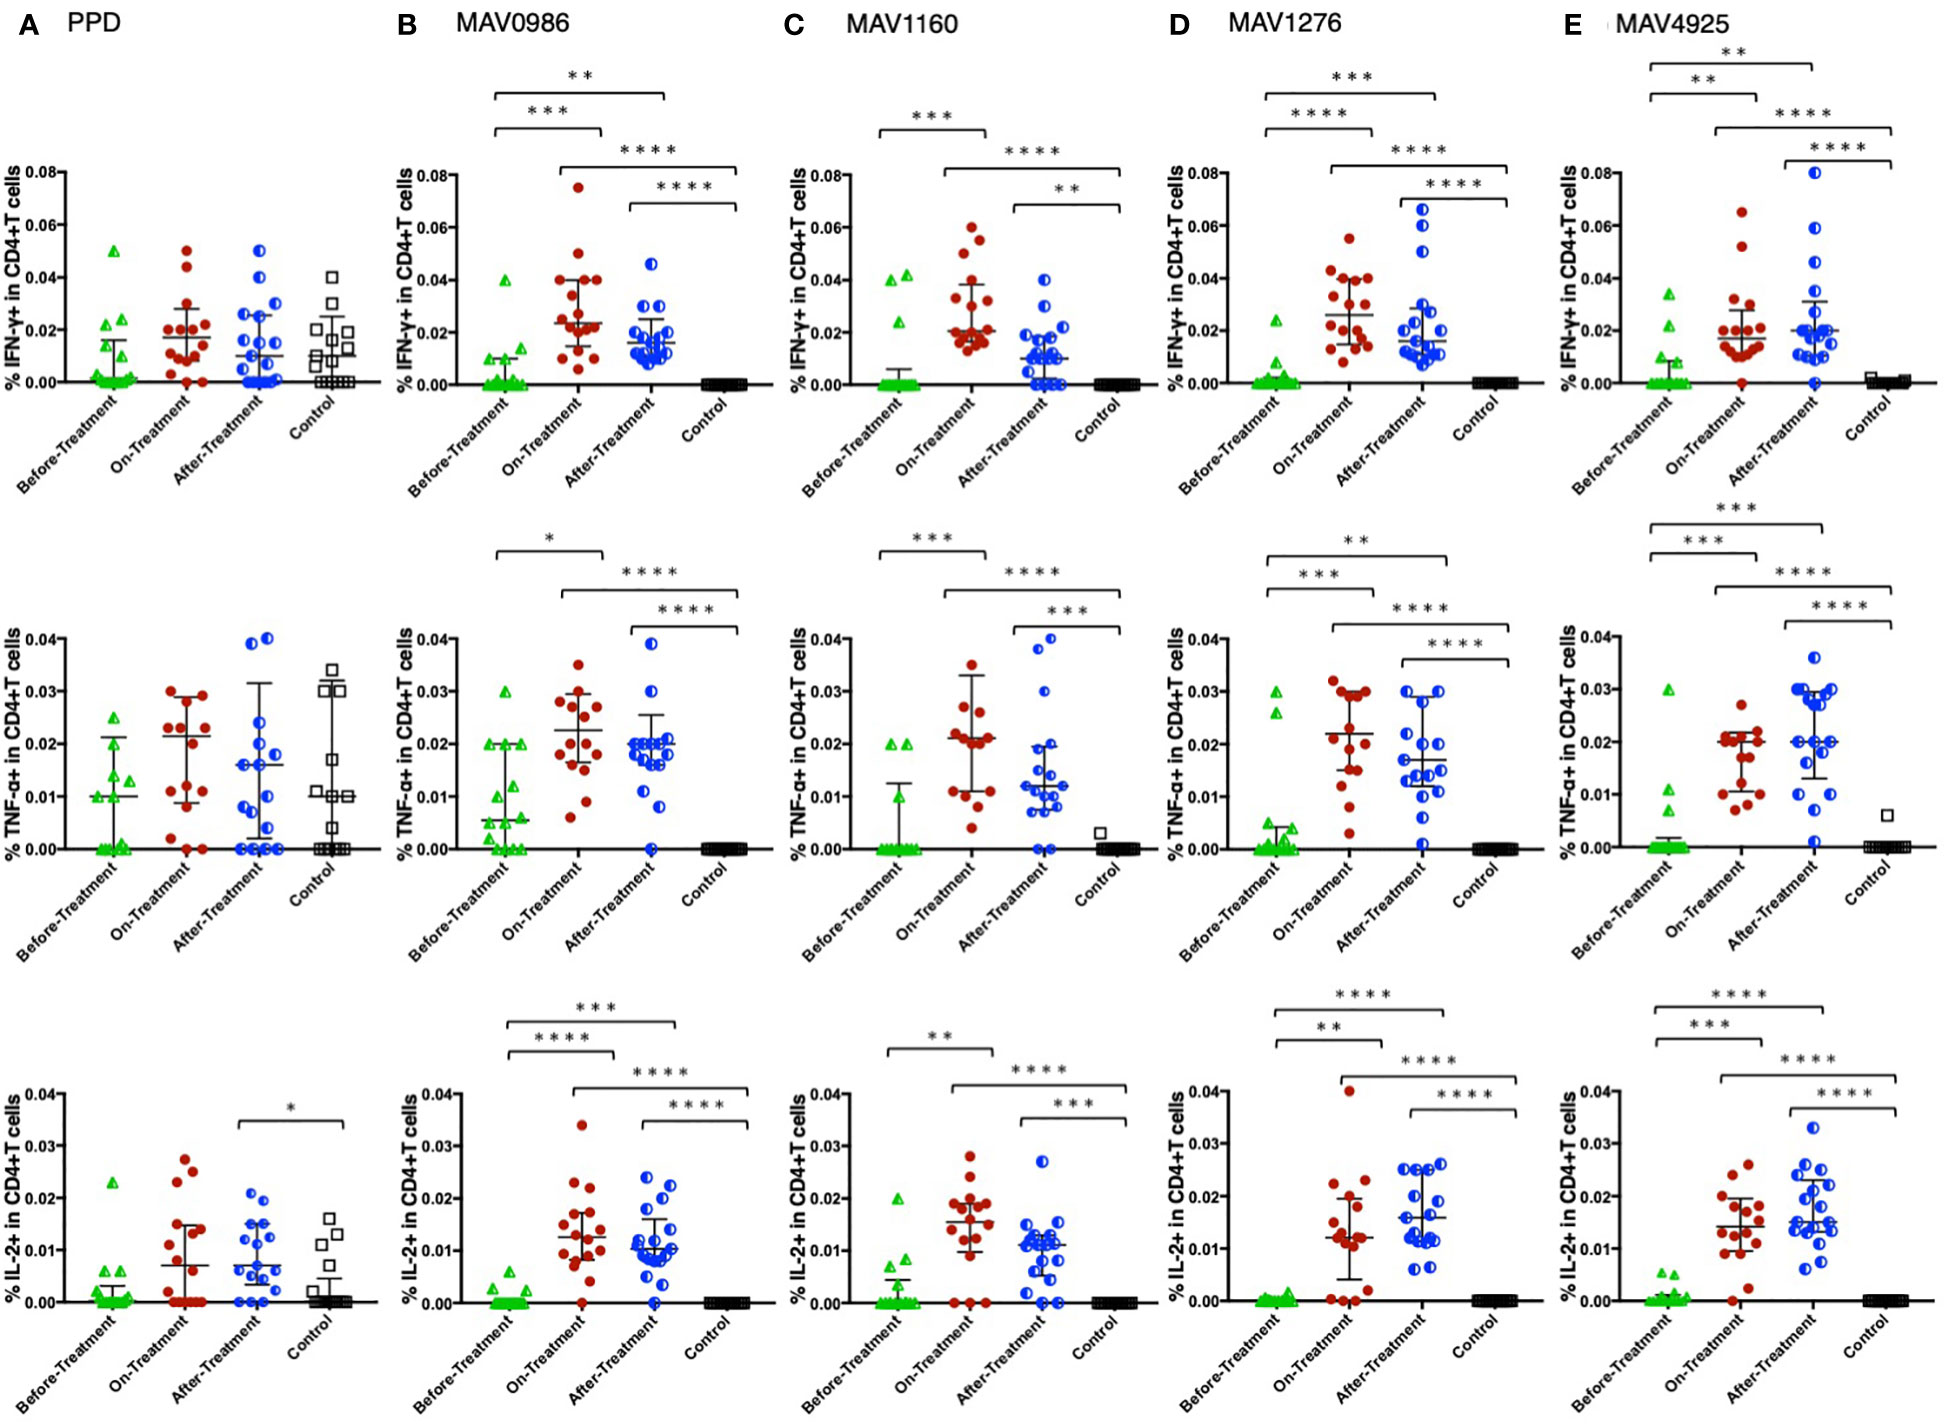
Figure 1 Th1 cytokine (IFN-γ, TNF-α, and IL-2) response of CD4+T cells to MA-associated antigens. Th1 cytokine responses of CD4+T cells in MAC cases grouped according to disease stage as before-treatment MAC cases (n=14), on-treatment MAC cases (n=16), and after-treatment MAC cases (n=17). The responses of the control group (n=17) are also shown. The differences in each set of samples were assessed using the Kruskal-Wallis test and post hocDunn’s comparison test (*P<0.05, **P<0.01, ***P<0.001, and ****P<0.0001). The long horizontal line represents the median and the vertical line represents the interquartile range. (A) Cytokine responses to PPD. Three data points are outside the limits in IFN-γ, nine data points in TNF-α, and one data point in IL-2. (B) Cytokine responses to the MA-associated antigen: MAV0986. One data point in IFN-γ and four data points in TNF-α are outside the limits. (C) Cytokine responses to the MA-associated antigen: MAV1160. Four data points are outside the limit in TNF-α. (D) Cytokine responses to the MA-associated antigen: MAV1276. Four data points in TNF-α and one data point in IL-2 are outside the limits. (E) Cytokine responses to the MA-associated antigen: MAV4925. Two data points in TNF-α and one data point in IL-2 are outside the limits.
Figure 2 shows the non-Th1 cytokine (IL-10, IL-13, and IL-17) responses of CD4+T cells to a range of MA-associated antigens in the before-treatment, on-treatment, and after-treatment groups compared to that of the control group. IL-10 and IL-17 responses were significantly higher in the before-treatment group than in the other three groups although high IL-17 responses were observed in some participants in the on-treatment group. The tendency of the IL-17 response was similar to that of the IL-10 response. The tendency of the IL-13 response was quite different from that of the other two cytokine responses. IL-13 responses were significantly higher in the before-treatment group.
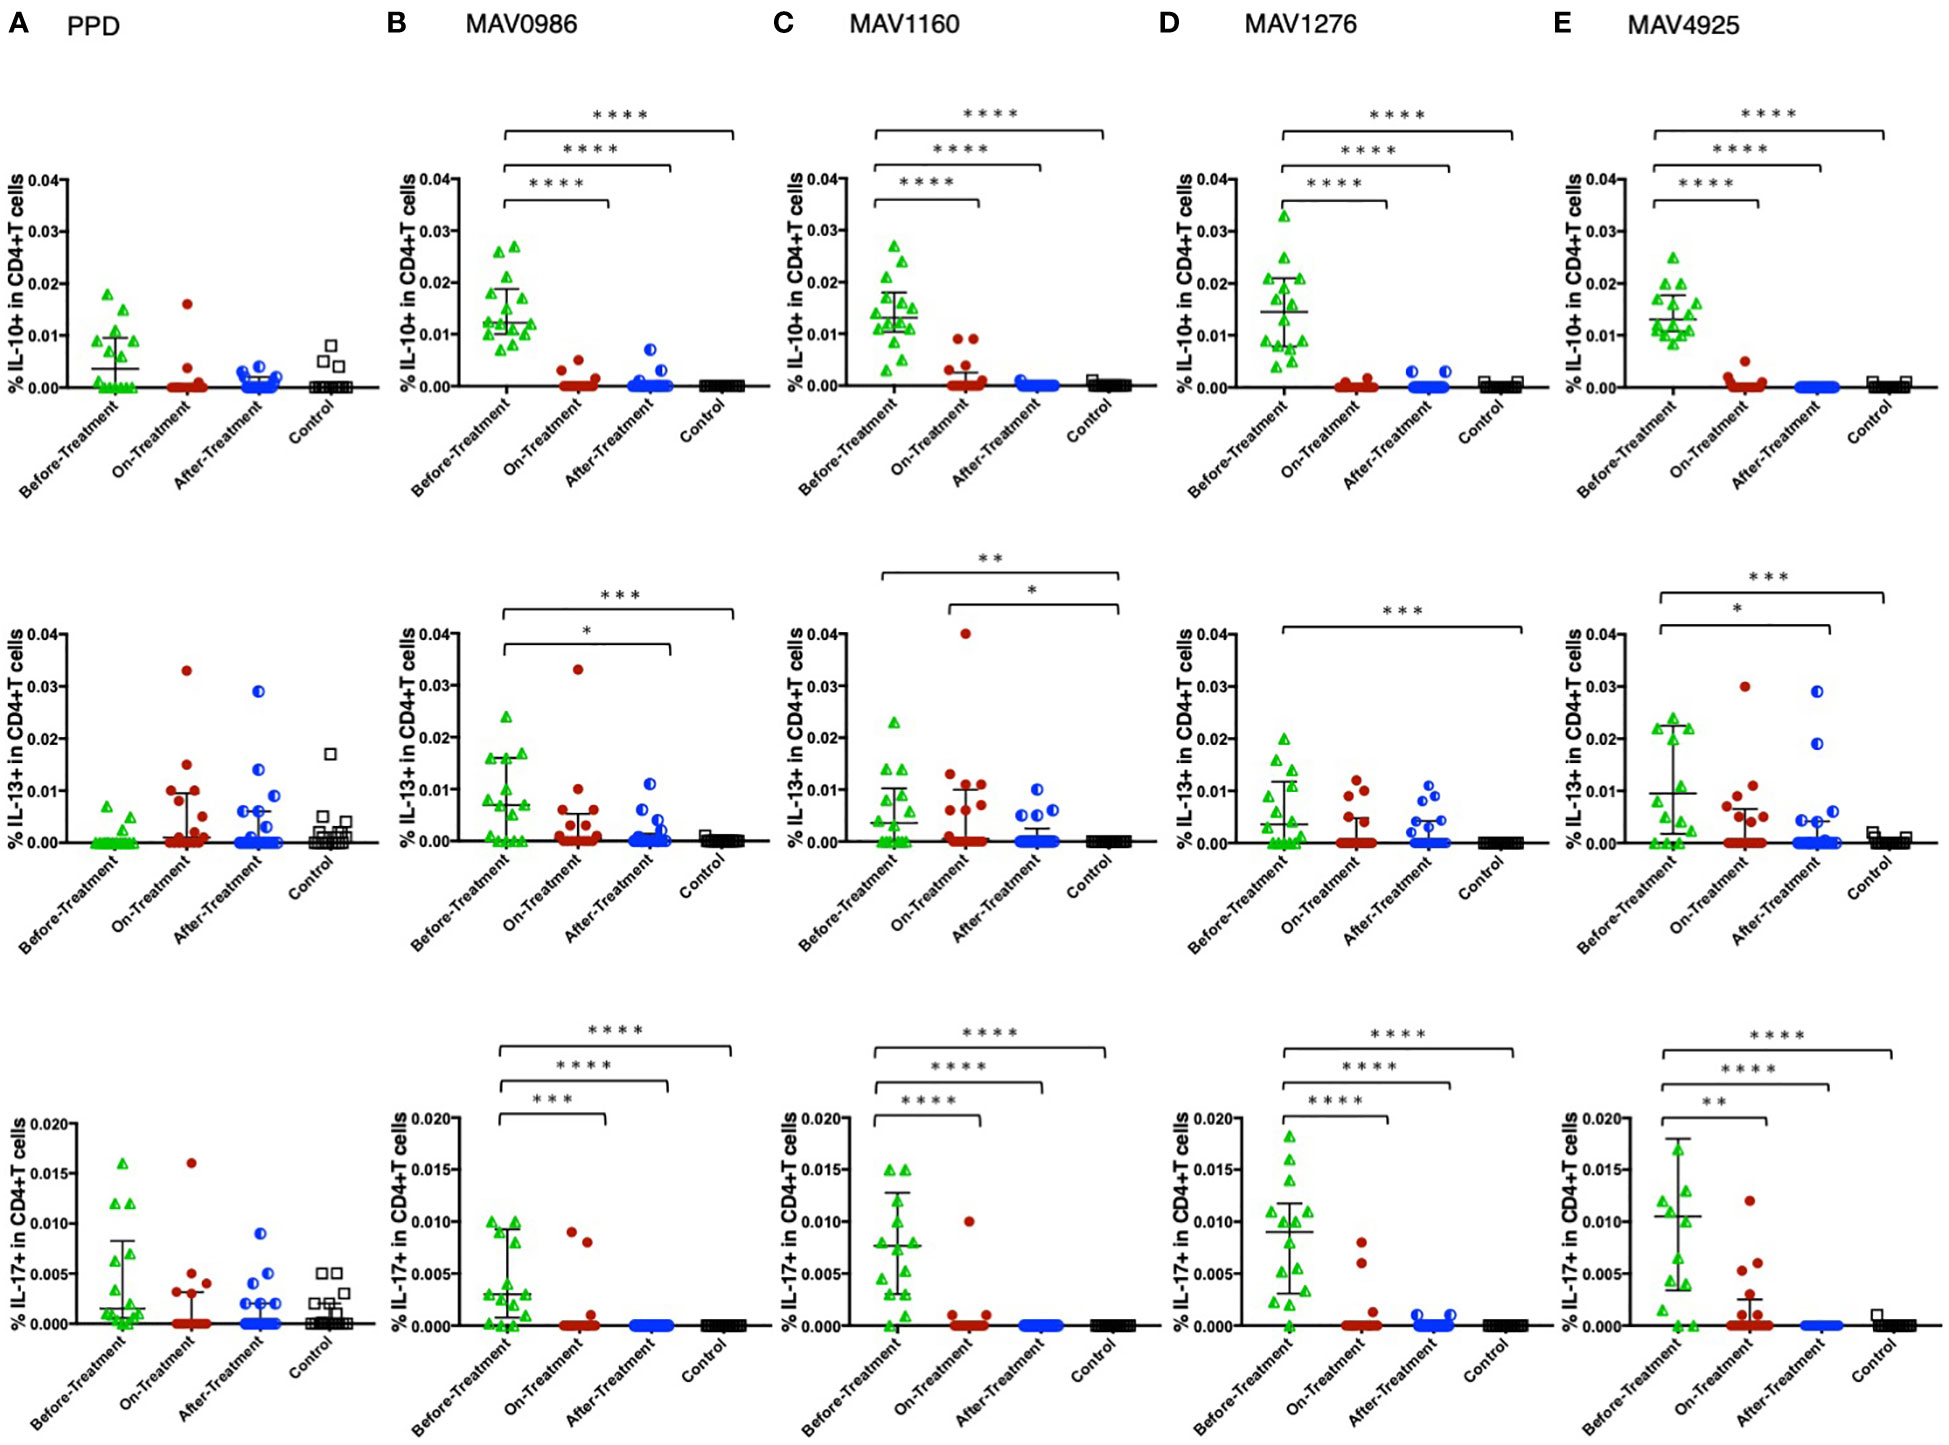
Figure 2 Non-Th1 cytokine (IL-10, IL-13, and IL-17) responses of CD4+T cells to MA-associated antigens. Non-Th1 cytokine responses of CD4+T cells in MAC cases, grouped according to disease stage as before-treatment MAC cases (n=14), on-treatment MAC cases (n=16), and after-treatment MAC cases (n=17). The responses of the control group (n=17) are also shown. The differences in each set of samples were assessed using the Kruskal-Wallis test and post hocDunn’s comparison test (*P<0.05, **P<0.01, ***P<0.001, and ****P<0.0001). The long horizontal line represents the median and the vertical line represents the interquartile range. (A) Cytokine responses to PPD. One data point is outside the limits of IL-10. (B) Cytokine responses to the MA-associated antigen: MAV0986. One data point is outside the limits in IL-17. (C) Cytokine responses to the MA-associated antigen: MAV1160. One data point is outside the limits in IL-17. (D) Cytokine responses to the MA-associated antigen: MAV1276. (E) Cytokine responses to the MA-associated antigen: MAV4925. Two data points in IL-13 and three data points in IL-17 are outside the limits.
3.3 Interaction between cytokines in response to MA-associated antigens
Next, we analyzed the correlation between diverse cytokine responses upon stimulation with different MA-associated antigens among MAC cases (Figures 3A–D). Th1 cytokines positively correlated with other Th1 cytokines and non-Th1 cytokines positively correlated with other non-Th1 cytokines: IFN-γ and TNF-α showed relatively strong correlations (r = 0.5908–0.7663), and IL-10 and IL-17 generally showed strong correlations (r = 0.6728–0.7895). Furthermore, inverse correlations were observed between Th1 and non-Th1 cytokines; in particular, relatively strong inverse correlations were observed between IL-10 and Th1 cytokines (r = -0.3135 – -0.7609). However, IL-13 was often noted to weakly correlate with Th1 cytokines (r = -0.2889 – -0.3886). The results showed that non-Th1 cytokines, especially IL-10, tended to respond separately from Th1 cytokines. Therefore, clinical stages of MAC in which Th1 or non-Th1 cytokine profile is predominant were suggested.
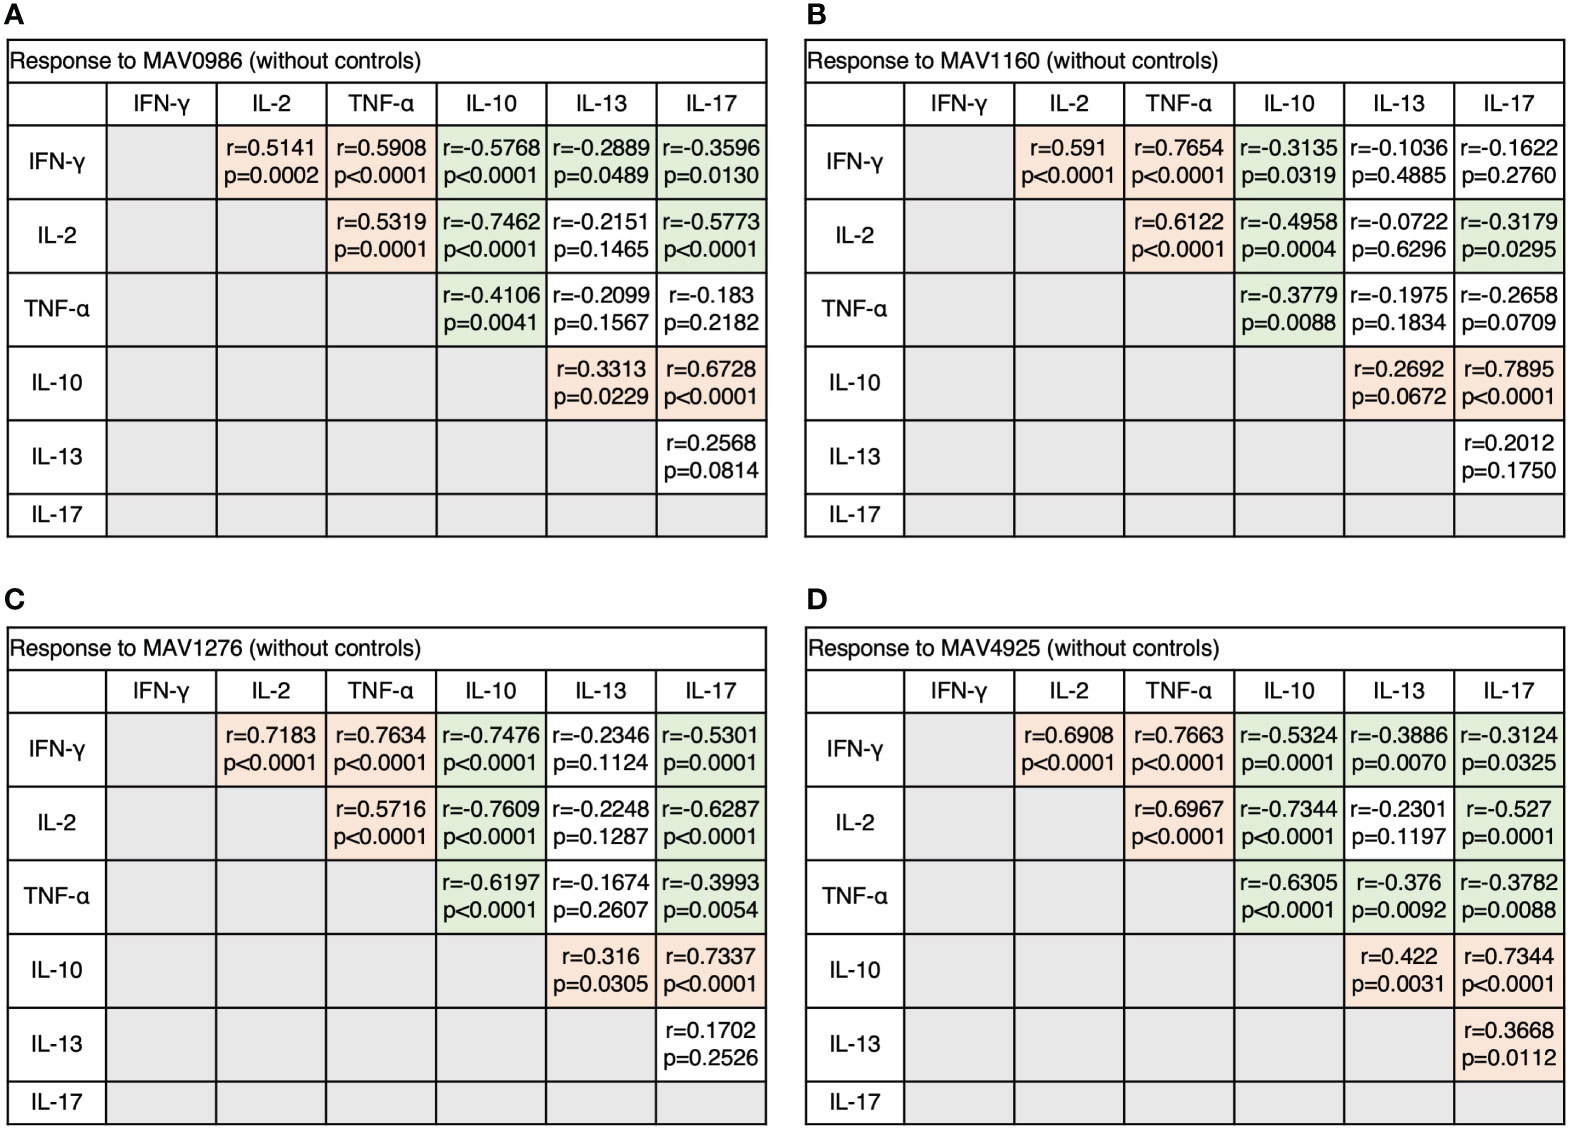
Figure 3 The correlations between cytokines of CD4+T cells in response to MA-associated antigens among MAC cases. The correlations between each cytokine were assessed using the Spearman correlation test. (A) Against MAV0986. (B) Against MAV1160. (C) Against MAV1276. (D) Against MAV4925.
3.4 Polyfunctionality of CD4+T cells
We extracted polyfunctional cells using flow cytometry and calculated the mean of these cells. Furthermore, the total of the means was taken as 100% and the percentage of each polyfunctional cell was investigated. Figure 4 shows the percentages of polyfunctional Th1 cytokine-producing CD4+T cells. Polyfunctional cells were mainly composed of four types of cells: TNF-α and IFN-γ double-positive (TNF-α+IFN-γ+), TNF-α single-positive (TNF-α+), IFN-γ single-positive (IFN-γ+), and IL-2 single-positive (IL-2+). Considering the combination of TNF-α+IFN-γ+ and TNF-α+ as a whole, TNF-α-positive cells and TNF-α+IFN-γ+ tended to account for a large proportion of the before-treatment group. IFN-γ+ tended to account for large proportions of the on-treatment group, and IL-2+ tended to account for a large proportion of groups after treatment initiation.
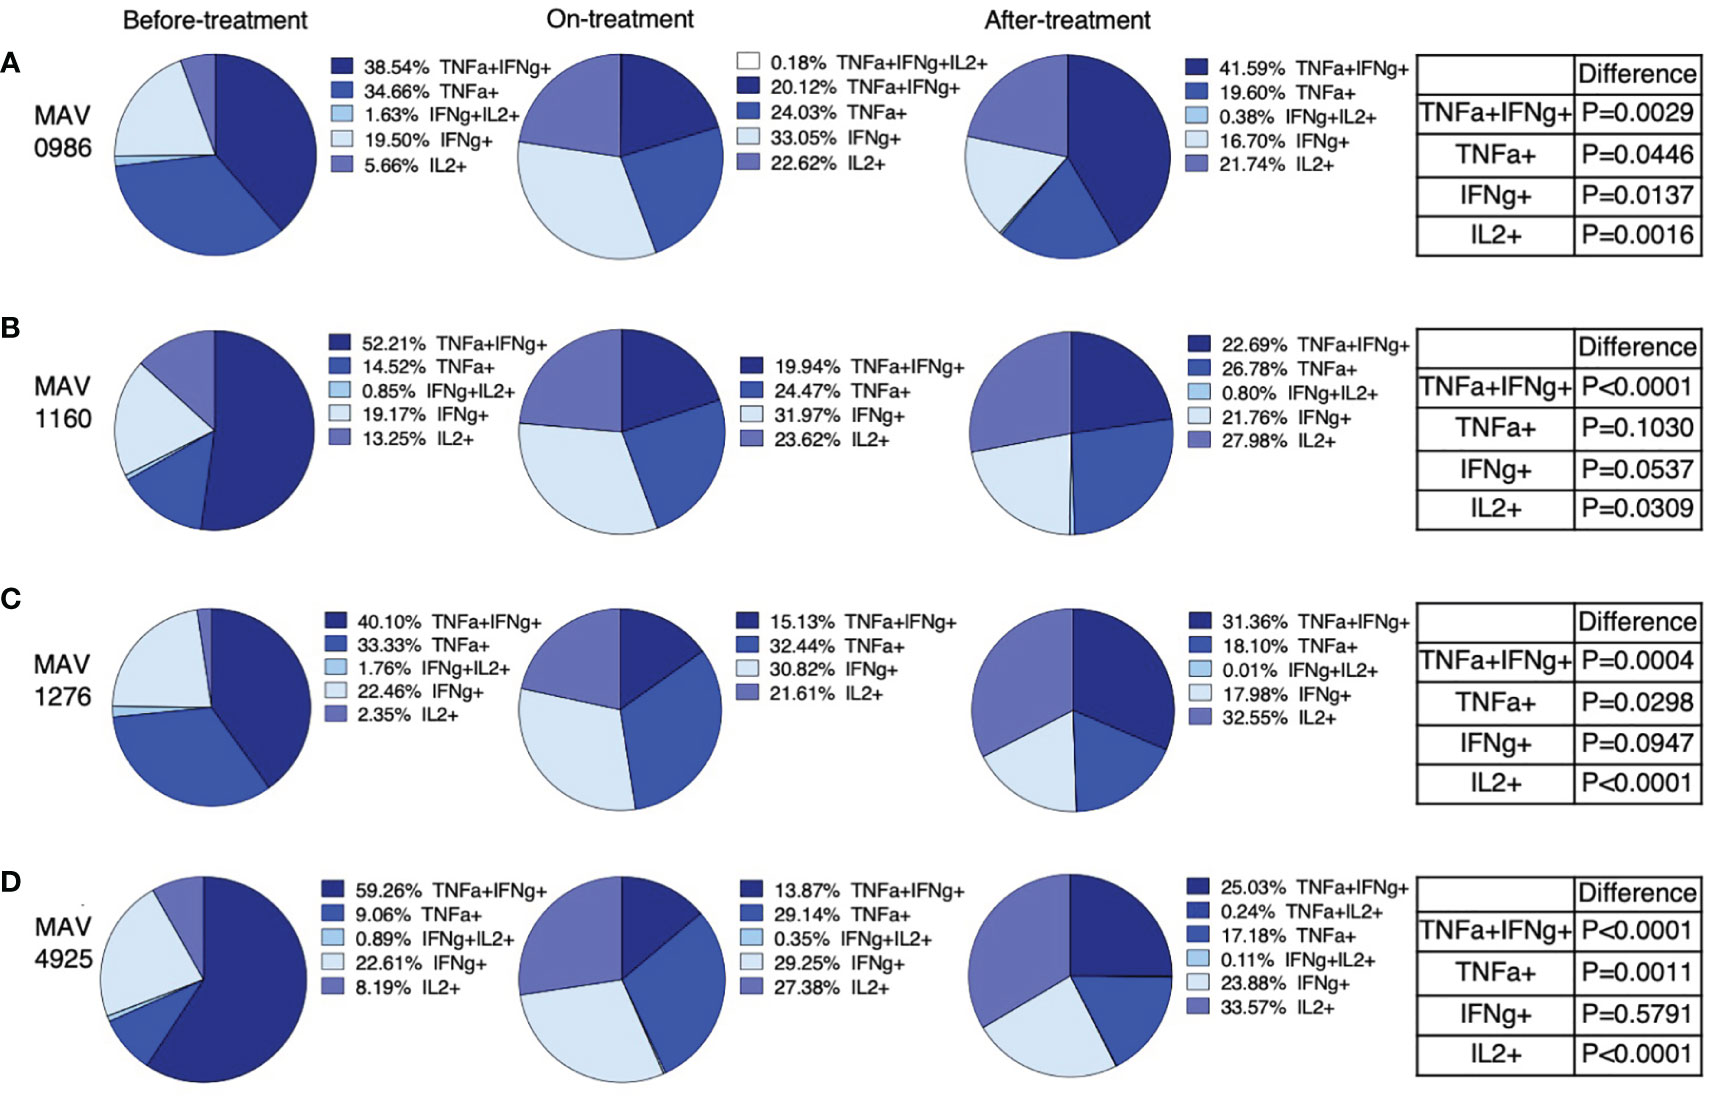
Figure 4 Polyfunctionality analysis of Th1 cytokine (IFN-γ, TNF-α, and IL-2) producing CD4+T cells in MAC cases, grouped according to disease stage as before-treatment cases, on-treatment cases, and after-treatment cases. Triple cytokine (IFN-γ, TNF-α, and IL-2) positive cells, double cytokine (two kinds of IFN-γ, TNF-α, and IL-2) positive cells, and single-cytokine positive cells were detected by using FlowJo® software. Then percentages of these cells in whole cytokine (IFN-γ, TNF-α, and IL-2) positive cells were calculated and shown in the pie chart. Differences in the percentage of cytokine-positive cells in each set of samples were assessed using the Chi-square test. The threshold for significance was P < 0.05. (A) MAV0986. (B) MAV1160. (C) MAV1276. (D) MAV4925.
Figure 5 shows the percentage of polyfunctional cells in non-Th1 cytokine-producing CD4+T cells. Although small proportions of IL-13 and IL-10 double positive (IL-13+IL-10+) were observed, most of the non-Th1 cytokine-producing CD4+T cells were composed of single cytokine-positive cells. IL-10 single-positive (IL-10+) cells were predominantly observed in the before-treatment group. IL-10+ proportion was reduced after the start of treatment; however, IL-10+ was maintained at a certain proportion in the after-treatment group. The proportion of IL-17 single-positive (IL-17+) cells also tended to resemble the proportion of IL-10+ cells where almost no IL-17+ cells were found in the after-treatment group. IL-13 single-positive (IL-13+) cells were found at a certain proportion before treatment, but the proportion of IL-13+ cells increased after the start of treatment. It was also found that the composition of cytokine-producing cells differed depending on the clinical stage.
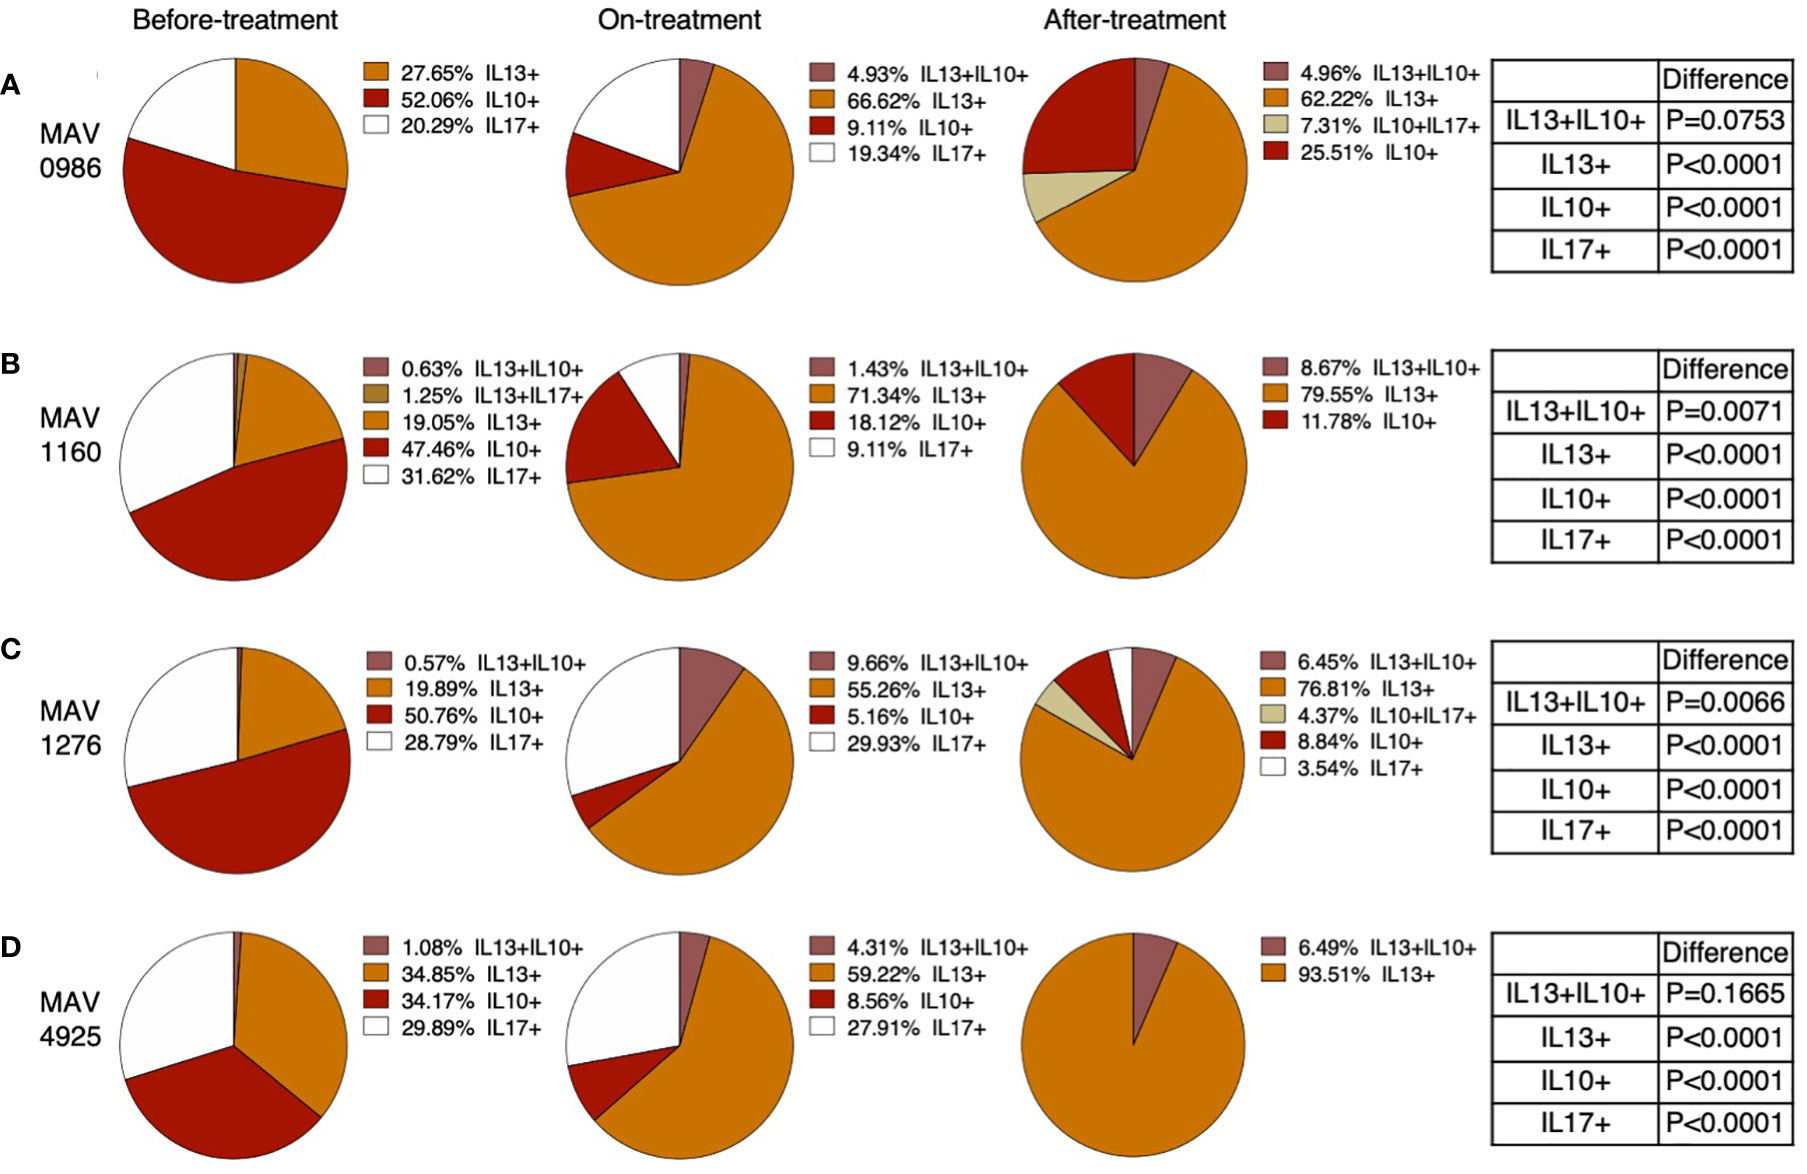
Figure 5 Polyfunctionality analysis of non-Th1 cytokine (IL-10, IL-13, and IL-17) producing CD4+T cells in MAC cases, grouped according to disease stage as before-treatment cases, on-treatment cases, and after-treatment cases. Triple cytokine (IL-10, IL-13, and IL-17) positive cells, double cytokine (two kinds of IL-10, IL-13, and IL-17) positive cells, and single cytokine-positive cells were detected by using FlowJo® software. Then percentages of these cells in whole cytokine (IL-10, IL-13, and IL-17) positive cells were calculated and shown in a pie chart. Differences in the percentage of cytokine-positive cells in each set of samples were assessed using the Chi-square test. The threshold for significance was P < 0.05. (A) MAV0986. (B) MAV1160. (C) MAV1276. (D) MAV4925.
3.5 Cytokine-producing CD19+B cells against MA-associated antigens
Figure 6 shows the Th1 cytokine responses of CD19+B cells to a range of MA-associated antigens in the before-treatment, on-treatment, after-treatment, and healthy control groups. CD19+B cells also produce cytokines against MA-associated antigens. Higher Th1 cytokine responses were observed in groups after treatment initiation. Figure 7 shows the non-Th1 cytokine response of CD19+B cells to a range of MA-associated antigens. Higher non-Th1 response rates were observed in the before-treatment group. Notably, the cytokine production pattern exhibited by CD19+B cells at each clinical stage was similar to that exhibited by the CD4+T cells. Correlation analysis also showed results similar to those for CD4+T cells (Figure 8). Through the analysis of CD19+B cells, we found that there are MAC-specific CD19+B cells that produce cytokines, like CD4+T cells, and the cytokine profile of MAC-specific CD19+B cells is also different at each clinical stage.
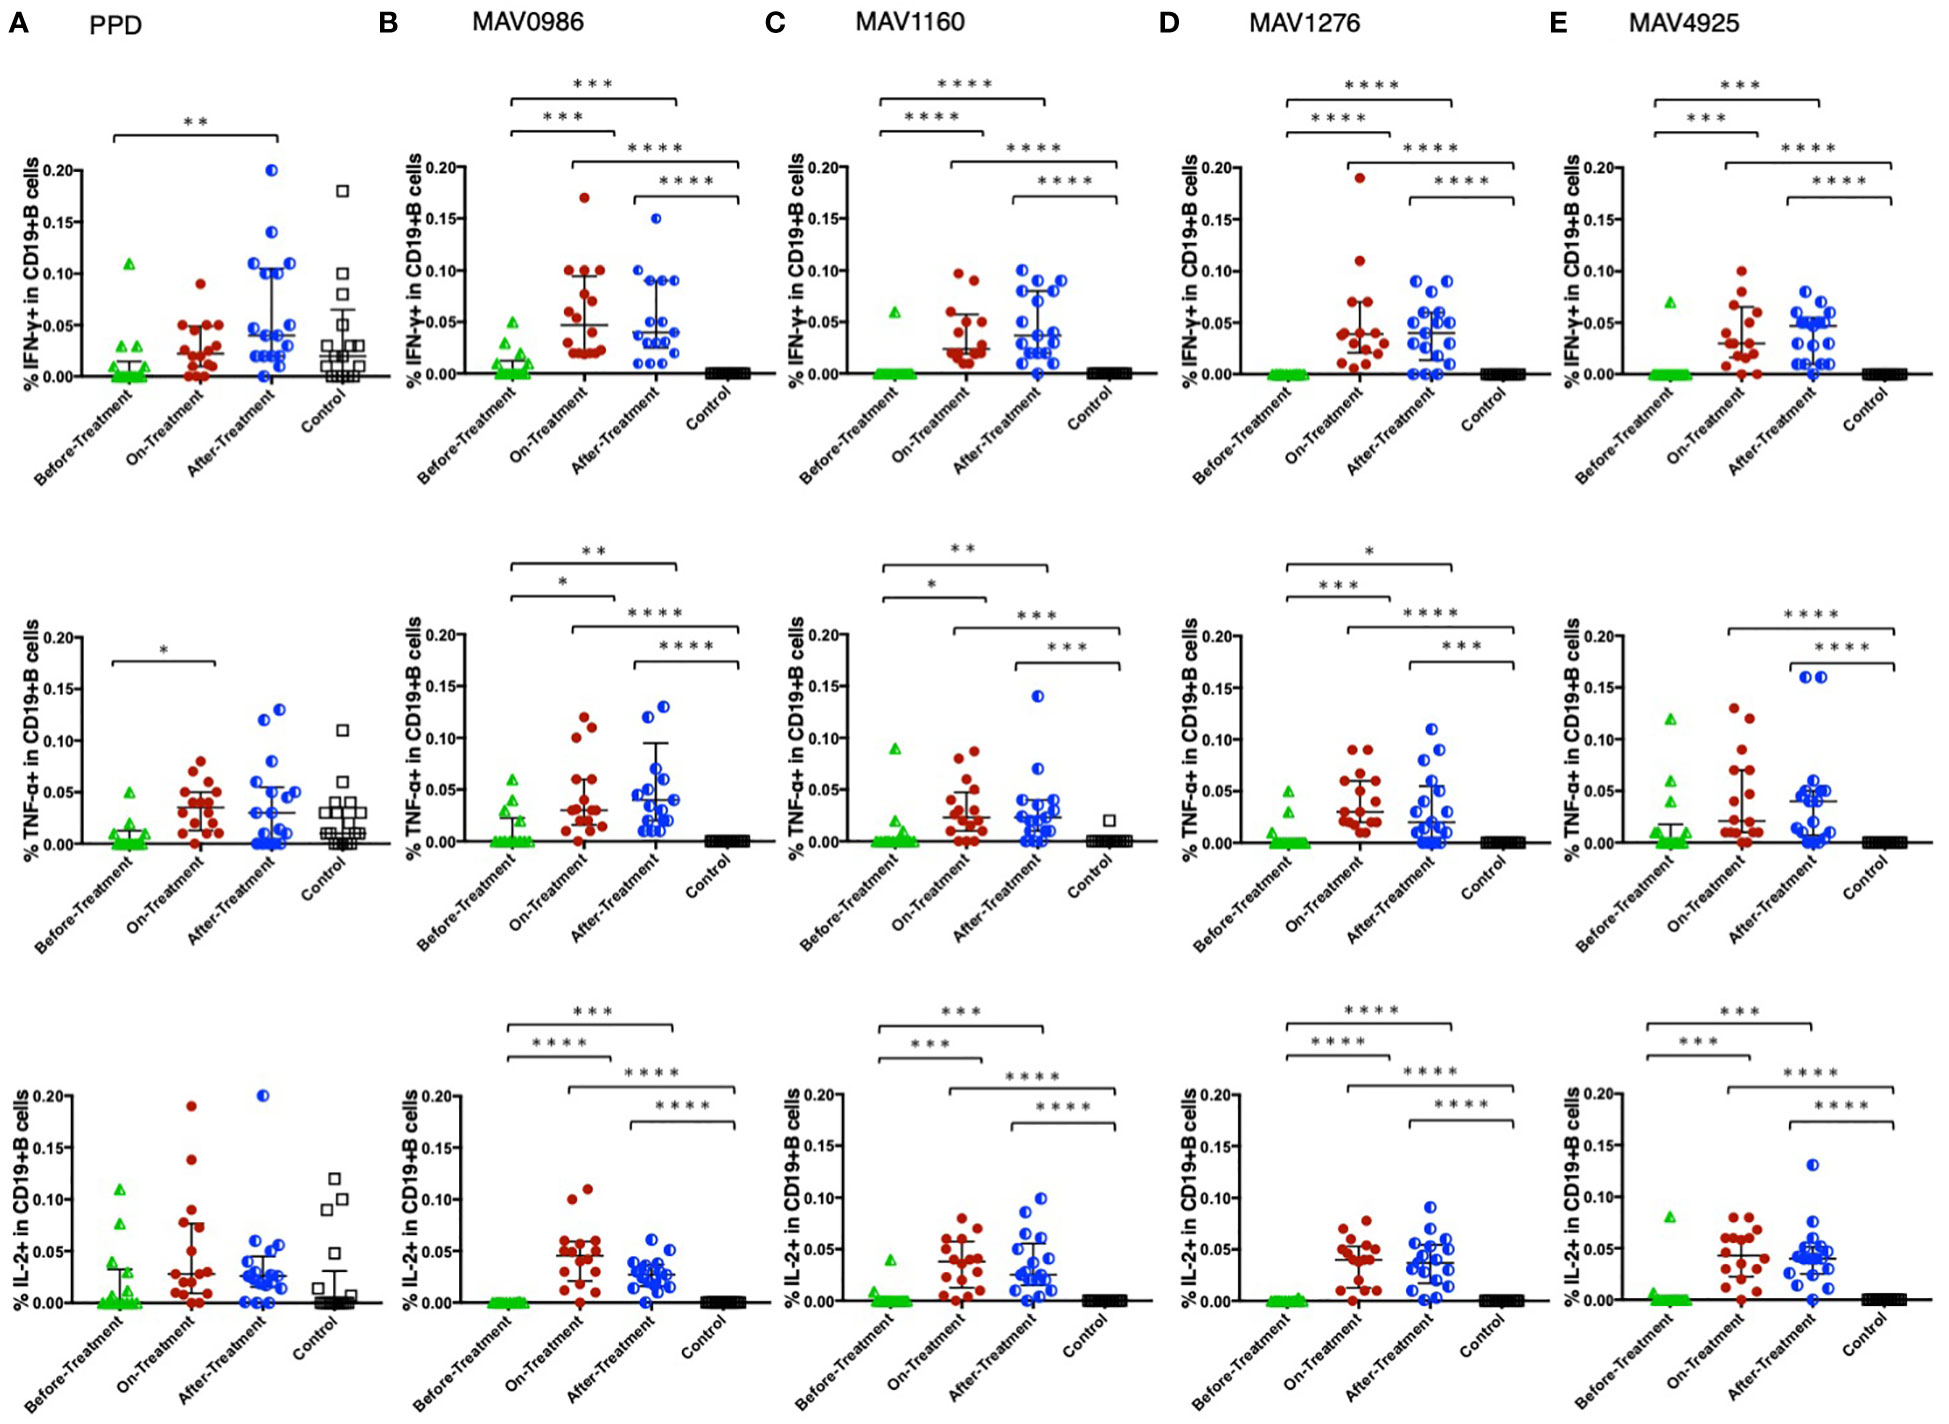
Figure 6 Th1 cytokine (IFN-γ, TNF-α, and IL-2) responses of CD19+B cells to MA-associated antigens. Th1 cytokine responses of CD19+B cells in MAC cases, grouped according to disease stage as before-treatment MAC cases (n=14), on-treatment MAC cases (n=16), and after-treatment MAC cases (n=17). The responses of the control group (n=17) are also shown. The differences in each set of samples were assessed using the Kruskal-Wallis test and post hocDunn’s comparison test (*P<0.05, **P<0.01, ***P<0.001, and ****P<0.0001). The long horizontal line represents the median and the vertical line represents the interquartile range. (A) Cytokine responses to PPD. One data point in IFN-γ and one data point in TNF-α are outside the limits. (B) Cytokine responses to the MA-associated antigen: MAV0986. One data point in IFN-γ and two data points in TNF-α are outside the limits. (C) Cytokine responses to the MA-associated antigen: MAV1160. One data point in IFN-γ and one data point in TNF-α are outside the limits. (D) Cytokine responses to the MA-associated antigen: MAV1276. One data point is outside the limits in IFN-γ. (E) Cytokine responses to the MA-associated antigen: MAV4925. One data point is outside the limits in IFN-γ.
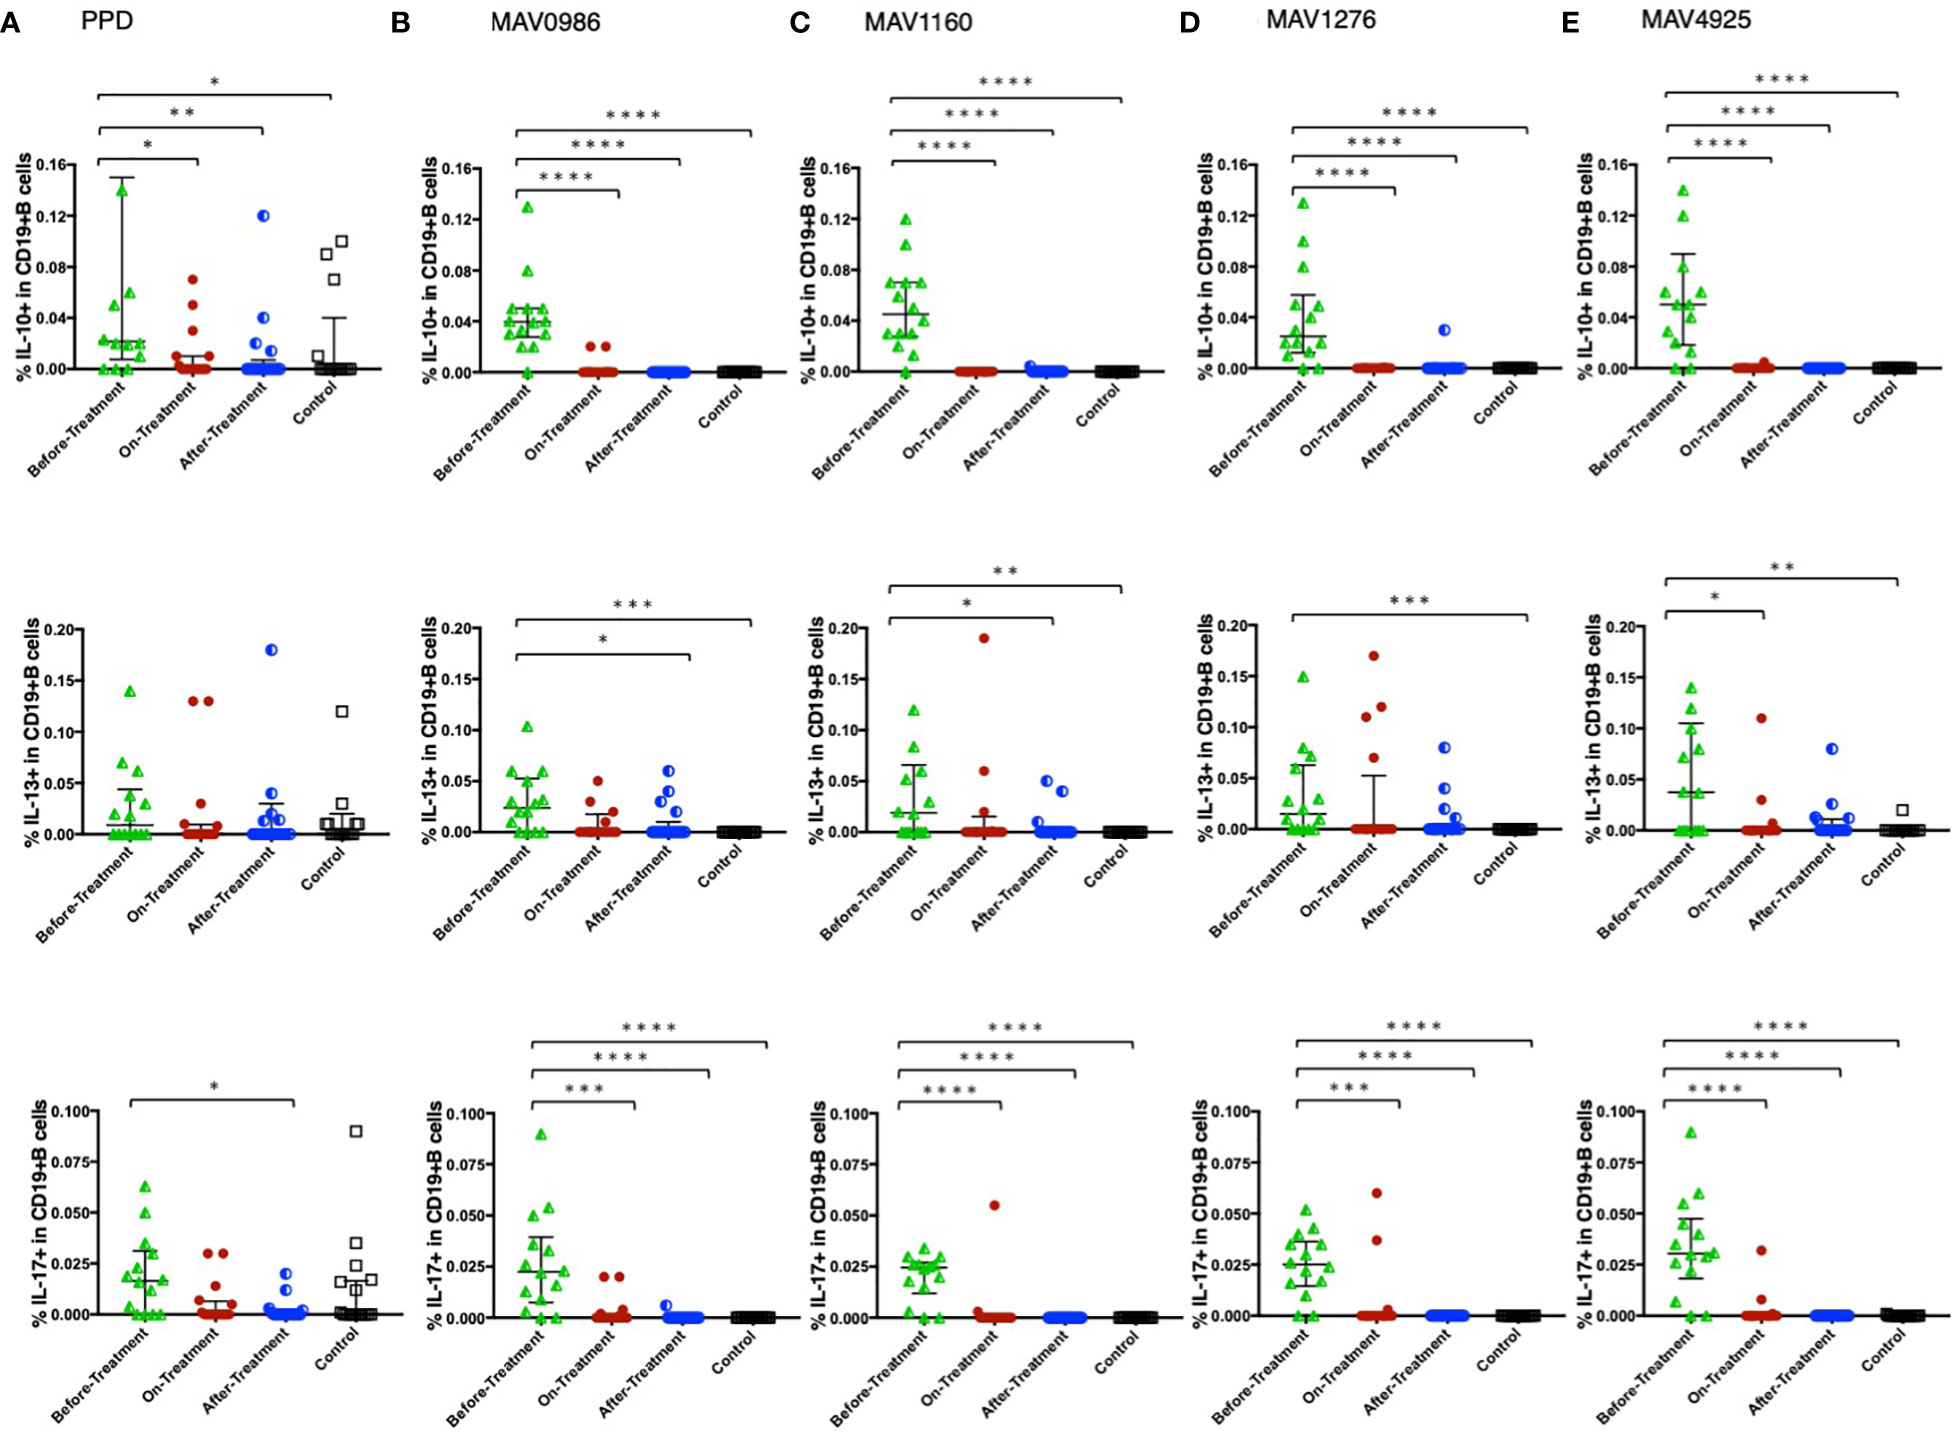
Figure 7 Non-Th1 cytokine (IL-10, IL-13, and IL-17) responses of CD19+B cells to MA-associated antigens. Non-Th1 cytokine responses of CD19+B cells in MAC cases, grouped according to disease stage as before-treatment MAC cases (n=14), on-treatment MAC cases (n=16), and after-treatment MAC cases (n=17). Responses of the control group (n=17) are also shown. The differences in each set of samples were assessed using the Kruskal-Wallis test and post hocDunn’s comparison test (*P<0.05, **P<0.01, ***P<0.001, and ****P<0.0001). The long horizontal line represents the median and the vertical line represents the interquartile range. (A) Cytokine responses to PPD. Four data points in IL-10 and four data points in IL-13 are outside the limits. (B) Cytokine responses to the MA-associated antigen: MAV0986. One data point is outside the limits of IL-13. (C) Cytokine responses to the MA-associated antigen: MAV1160. Two data points are outside the limits in IL-13. (D) Cytokine responses to the MA-associated antigen: MAV1276. (E) Cytokine responses to the MA-associated antigen: MAV4925. One data point in IL-10 and one data point in IL-13 are outside the limits.
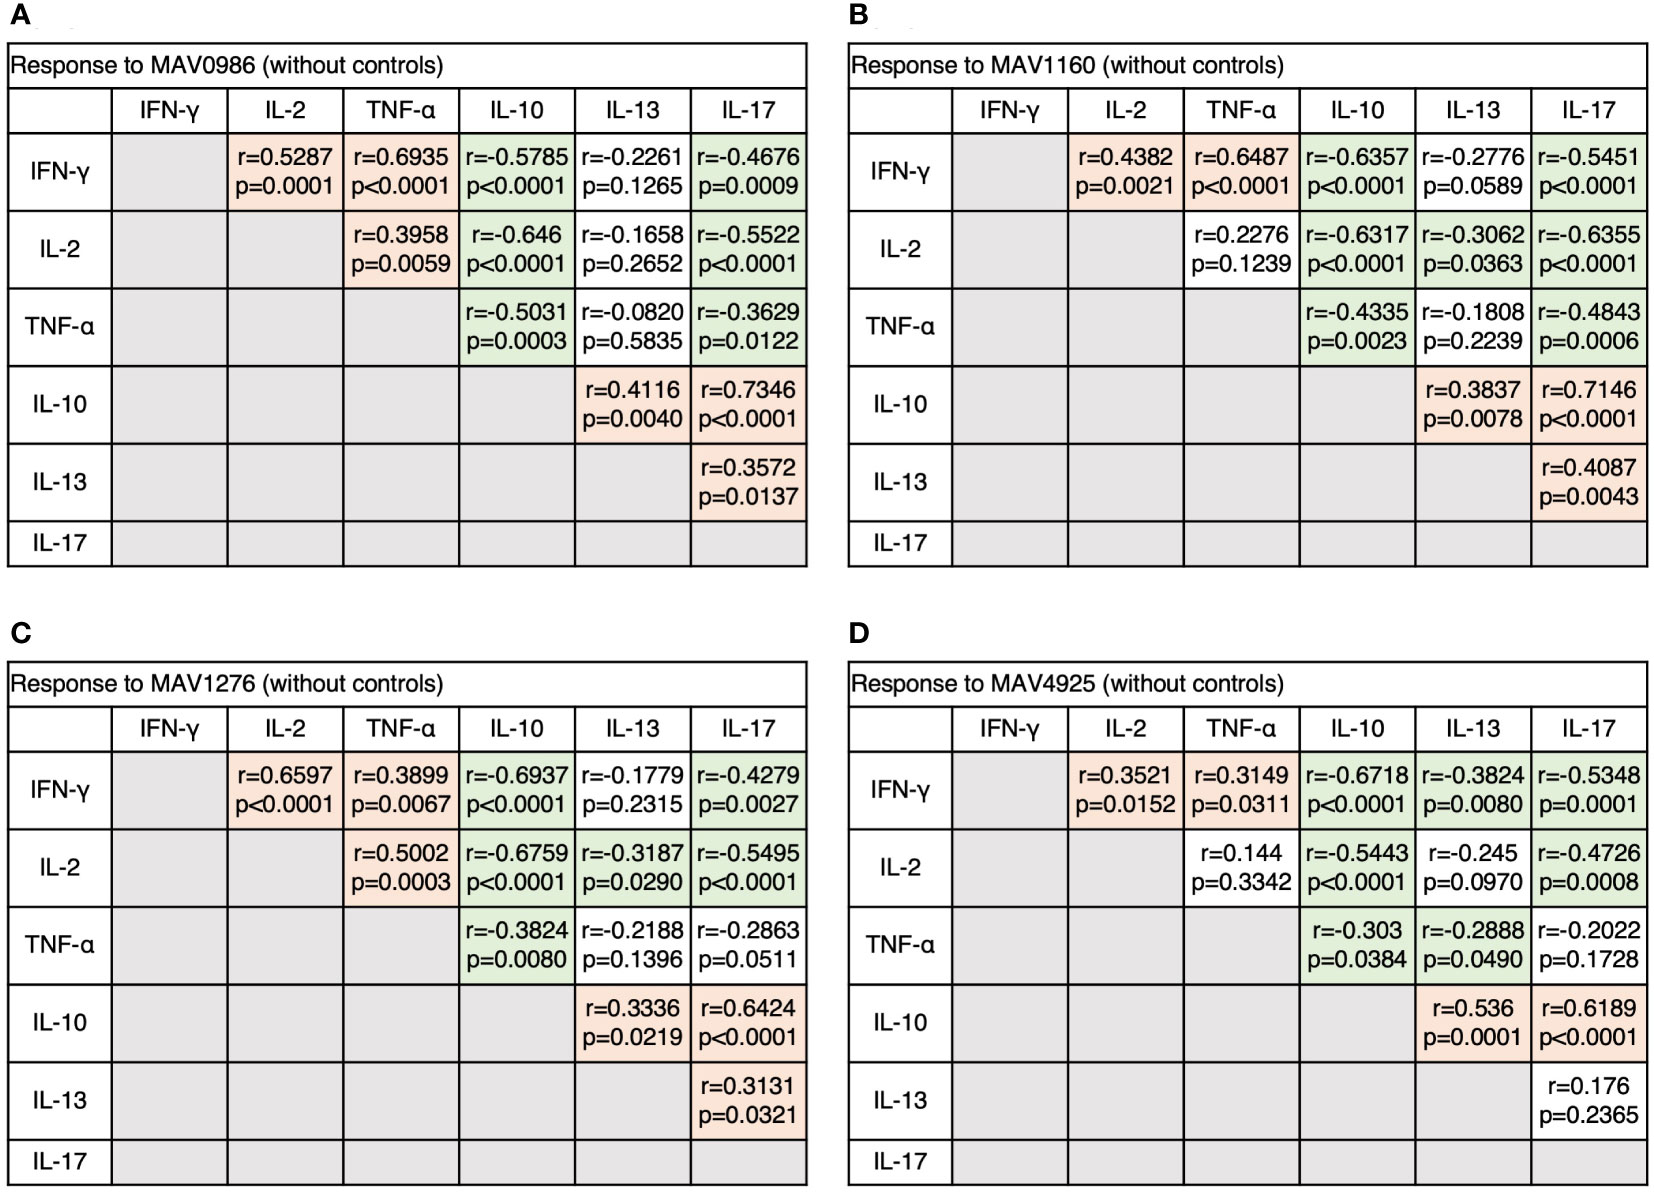
Figure 8 The correlations between cytokines of CD19+B cells in response to MA-associated antigens among MAC cases. The correlations between each cytokine were assessed using the Spearman correlation test. (A) Against MAV0986. (B) Against MAV1160. (C) Against MAV1276. (D) Against MAV4925.
3.6 Detailed changes at each clinical stage
To determine the state of the disease in more detail, we analyzed cytokine differences at each clinical stage. Figure 9 shows the cytokine production differences in the before-treatment group. We divided the before-treatment group into stable and active groups according to clinical information, i.e., whether there have been any changes in imaging findings within the last six months from the sample collection date, and we then compared these two groups. Th1 cytokines such as TNF-α in CD4+T cells stimulated with MAV0986 and IFN-γ in CD19+B cells stimulated with MAV0986 showed significant differences (P = 0.0016 and P = 0.0337, respectively). We expected that under stimulation with some MA-associated antigens, Th1 cytokines would be associated with their production and elapsed time. For the on-treatment group, we attempted a linear regression between the cytokine production response and the elapsed time from the start of treatment. Figure 10 shows that IFN-γ in CD4+T cells stimulated with MAV0986 had a significantly non-zero slope (y = -0.0002637x + 0.0344; P = 0.0464). Figure 11 shows the results of the linear regression analysis in the after-treatment group. We also attempted a linear regression between the cytokine production response and the elapsed time from the end of treatment. Similar to on-treatment, IFN-γ levels in CD4+T cells stimulated with MAV1160 tended to decrease over time after treatment (y = -0.0001034x + 0.01909; P = 0.0484). However, changes in IL-2 were noticeable after treatment (IL-2 in CD4+T cells stimulated with MAV0986: y = -0.00006137x + 0.01529; P = 0.0477, and IL-2 in CD4+T cells stimulated with MAV1160: y = -0.0000774x + 0.01472; P = 0.0093).
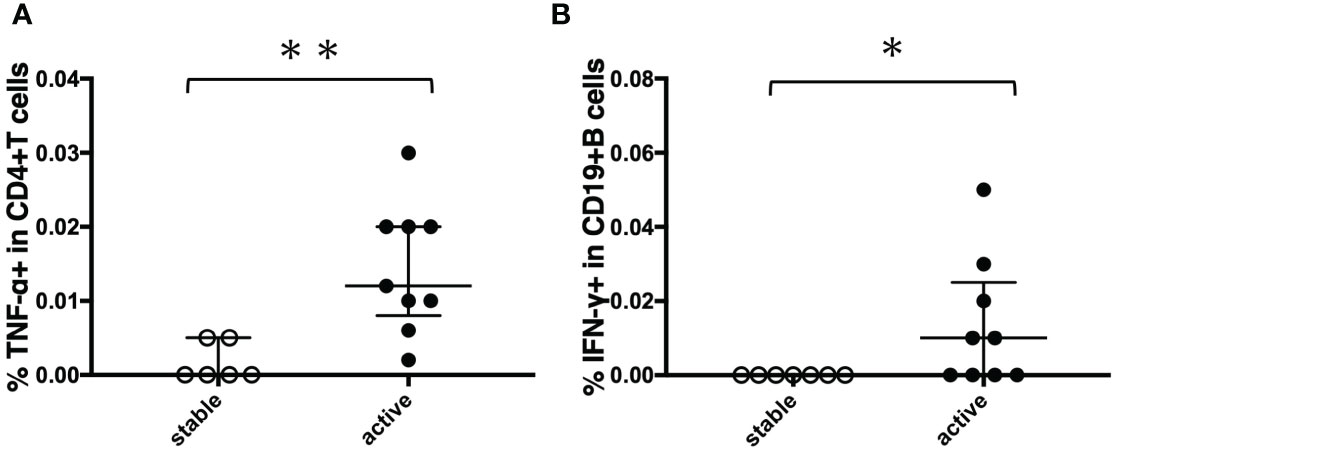
Figure 9 Comparison of cytokine responses between stable cases and unstable cases in before-treatment MAC cases. Before-treatment MAC cases were divided into stable cases and active cases according to clinical information. The difference between the two sets of samples was assessed using the Mann-Whitney test (*P<0.05 and **P<0.01). The long horizontal line represents the median and the vertical line represents the interquartile range. (A) TNF-α responses of CD4+T cells against MA-associated antigen: MAV0986. (B) IFN-γ responses of CD19+B cells against MA-associated antigen: MAV0986.
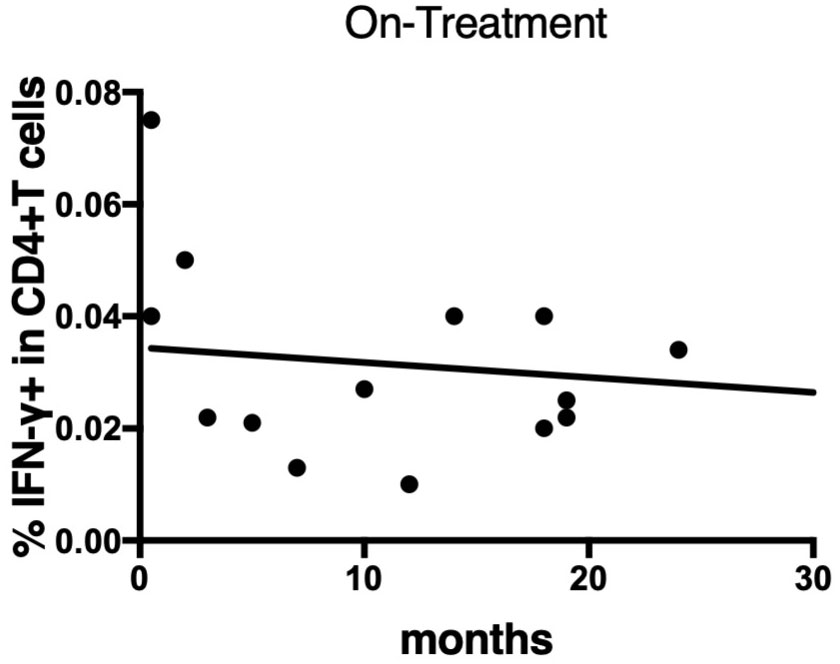
Figure 10 Linear regression between IFN-γ responses of CD4+T cells against MA-associated antigen, MAV0986, and elapsed time from the start of treatment in on-treatment MAC cases. The slope is significantly non-zero (y = -0.0002637x + 0.0344; P = 0.0464).
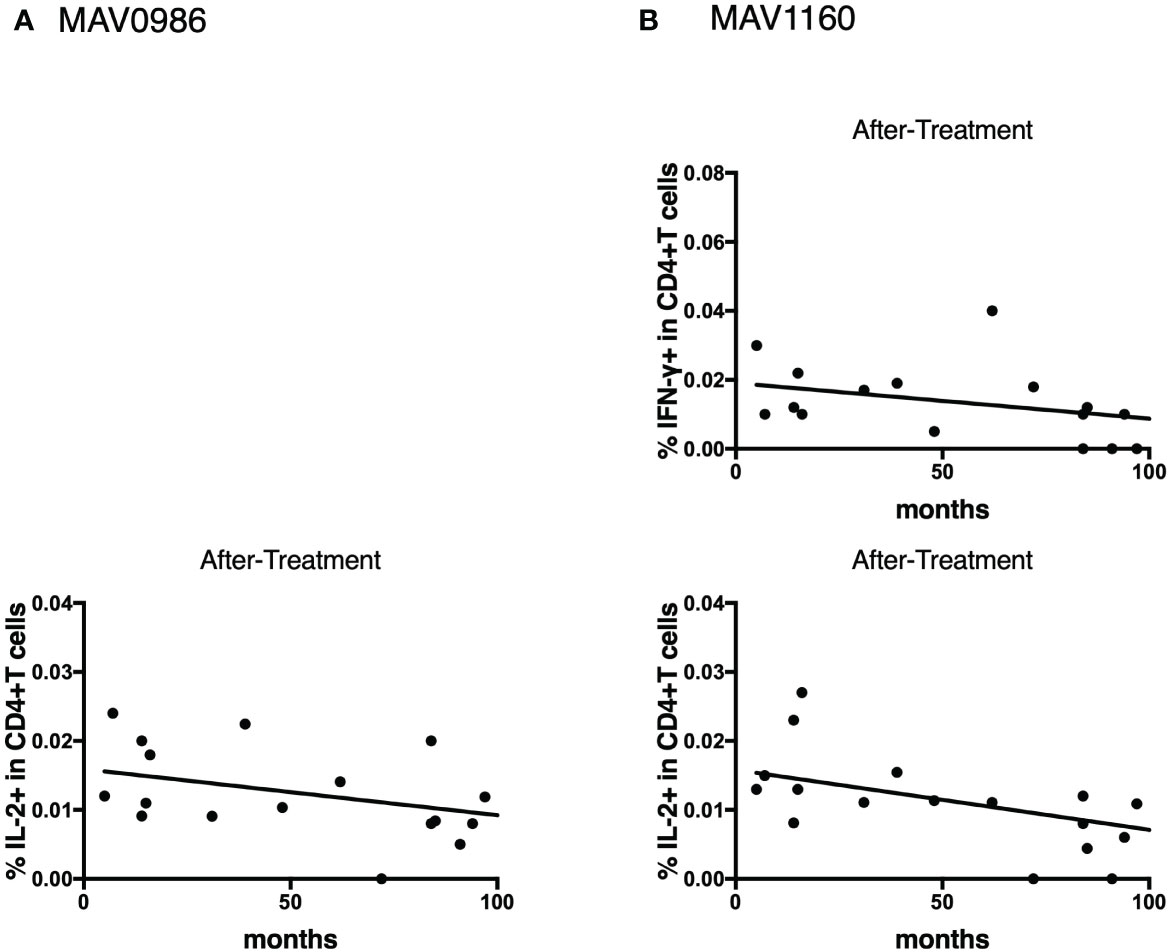
Figure 11 Linear regression between cytokine responses of CD4+T cells against MA-associated antigens and elapsed time from the end of treatment in after-treatment MAC cases. (A) against MAV0986. (B) against MAV1160. These slopes are significantly non-zero (IL-2 against MAV0986: y = -0.00006137x + 0.01529; P = 0.0477, IFN-γ against MAV1160: y = -0.0001034x + 0.01909; P = 0.0484, and IL-2 against MAV1160: y = -0.0000774x + 0.01472; P = 0.0093).
4 Discussion
In the current study, we showed that the cytokine profile of CD4+T cells against a wide range of pNTM-associated antigens is different at each clinical stage of MAC. Th1 cytokine levels were elevated after the start of treatment; whereas, non-Th1 cytokine levels were elevated before treatment. Additionally, CD19+B cells showed cytokine profiles similar to those of CD4+T cells at each stage.
Among Th1 cytokines, IFN-γ and TNF-α showed a tendency to show high responses in the on-treatment group and the active group (a subgroup of the before-treatment group); these groups were expected to have high mycobacterial activity. A case of disseminated MAC positive for anti-IFN-γ autoantibodies has been reported (21). In addition, IFN-γ gene expression has been reported to be reduced in pNTM patients compared to that in uninfected patients (22). Furthermore, anti-TNF-α therapy was reported to be associated with an increased risk of NTM (23). These studies suggest that IFN-γ and TNF-α play important roles in protection against MAC, and the results of the current study are consistent with this. IFN-γ signals from CD4+T cells led to the activation of CD8+T cells and reduced the burden of Mycobacterium tuberculosis (MTB) in macrophages (24). TNF-α signaling was required for nitric oxide production in macrophages, and nitric oxide was useful for digesting phagocytic mycobacteria (25). Thus, their role is to activate immune cells such as macrophages and cytotoxic T cells. Paradoxically, high responses to these cytokines would mean that the amount of MAC is high. Because of the large amounts of MAC and the high exposure of T cells to all the antigens that make up MAC, the tendency of these cytokine responses was similar for all four antigens.
IL-2 response increased in the groups after the start of treatment. IL-2 production by undifferentiated T cells with antigens suggests a very early stage of infection (26). Upon further stimulation with IL-2, these T cells differentiate into CCR7+ effector memory T cells (27). T cells can be stimulated by IL-2 in both an autocrine and paracrine manner (28). Thus, T cells may become one of the major sources of IL-2 during late infection, as shown by the aforementioned results. MAV1276 and MAV 4925 are considered proteins necessary for survival in the host. A small number of mycobacteria are expected to remain hidden in the host even after treatment. The reason why the response of IL-2 against these antigens increased in the after-treatment group is thought to be that memory T cells reacted to these antigens, which may work quietly to survive. In addition, the results of this study showed that the IL-2 response decreased with the passage of time from the end of treatment. A decrease in IL-2 signaling results in a decrease in the number of memory T cells (29–31).
Polyfunctional T cells are considered excellent in terms of both the quality and quantity of cytokine secretion (32). When the requirement for IFN-γ and TNF-α increases, these polyfunctional T cells are expected to play an active role. However, in this study, the proportion of polyfunctional T cells was reduced in the on-treatment group. This result suggests that polyfunctional T cells play a role as a reserve rather than acting directly as a defense mechanism. It is expected that single-positive cells for IFN-γ or TNF-α, which increase the proportion of polyfunctional T cells, are terminally differentiated cells (33) and directly involved in protection.
Few studies have described the association between IL-13 and MAC and NTM infections (34, 35). IL-13 has been suggested to protect against infection by promoting cell turnover and excreting infected epithelial cells (36). Some mycobacteria, such as Mycobacterium leprae are thought to invade alveolar epithelial cells through adhesion molecules (37). Because MAC is also expected to invade epithelial cells through adhesion molecules (38, 39), IL-13 production continues as long as the invasion continues. This was shown in the aforementioned results, in the before-treatment group to the on-treatment group.
The production of IL-10 in MAC infection occurred before treatment, like in TB cases (15). IL-10 has been shown to suppress host immunity even in mycobacteria infections (40). It has been suggested that proteins that make up the cell wall of mycobacteria may promote the production of IL-10 from antigen-presenting cells and T lymphocytes (41). In MTB-infected cells, the MTB gene stimulates the production of type I IFN, such as IFN-β, resulting in increased IL-10 production from neighboring cells (42). Prostaglandin E2 is a bioactive substance included within the arachidonic acid cascade and is known to stimulate IL-10 (43) when mycobacteria invade the epithelial cells. It is possible that mycobacteria create a favorable environment for their own survival through the action of IL-10 immediately after invading the host body.
IL-17 production in MAC infection was also observed in before-treatment cases, as in TB (15). The growth of mycobacteria in the host purely increases TCR stimulation, which leads to increased T-bet, a master regulator of Th1 expression (44, 45). Low T-bet expression appears to create an environment in which Th17 cells are dominant (46). The environment in which Th17 is dominant often seems to work disadvantageously in defense against intracellular pathogens (47). In contrast, IL-17-producing CD4+T cells, regarded as Th17 cells, are reported to recruit IFN-γ-producing CD4+T cells, regarded as Th1 (48). Therefore, the role of IL-17 in mycobacterial infections may be to prime Th1 cell establishment rather than protection.
The responses of non-Th1 cytokines did not differ greatly between the antigens in the aforementioned results. Thus, the four peptides examined in this study may have similar functions. In TB, the presence of antigens that strongly stimulate non-Th1 cytokine responses has been observed in before-treatment cases (15). MTB may contain specific peptides that can be adapted to humans. If such peptides exist in MAC and can be added, a cytokine profile different from the aforementioned results may be observed.
The dynamics of antigen-specific cytokine-producing B cells resemble those of T cells, suggesting a relationship between the two. The long-known function of B cells—antigen presentation—is the function that connects B cells and T cells (49). Considering this function, B cells may be activated during an earlier stage than T cells. Antigen-specific B cell involvement has also been shown in mycobacterial infections, and these B cells are suggested to produce various cytokines by signals from T cells (50). If so, B cells may be activated later than T cells. However, because memory B cells may be activated via pattern recognition molecules (49), the exchange of signals between B cells and T cells is not one-way but may be mutual.
The following cell-mediated immune dynamics can be inferred based on the results of this study. Shortly after MAC invasion, the non-Th1 subsets of CD4+T cells will be in harmony. At local areas such as the airway epithelium, differentiation into Th2 or Th17 will start. MAC may induce IL-10-producing T cells for survival. When MAC proliferates and the momentum of the disease becomes active, the Th1 subset becomes dominant for protection against MAC. Th1 cells then establish an immune memory for MAC by producing IL-2. If a decrease in IL-2 levels is observed, the risk of relapse might increase. Paradoxically, by monitoring the response of immune cells or alternatively, by analyzing the cytokine profile, we would be able to identify the clinical stage of MAC disease. This will also lead to the early diagnosis of MAC and the evaluation of therapeutic effects.
This study had some limitations. First, we collected all samples within a defined period, but the number of participants was still not large enough to set up a group like in a previous study (15). It may have been possible to analyze the transition of the cytokine profile in more detail if we could set up a group before and immediately after the start of treatment. Second, this study was a cross-sectional study. The ability to follow the cytokine profile longitudinally would have produced more robust results. Finally, fresh samples were used because of the past verification (20). To keep the samples fresh, the range of transfer was limited; as a result, it is possible that the sample was taken only from a population with similar characteristics. In addition, because the number of samples that could be processed at once was limited, the different conditions depending on the day, such as temperature, might have affected the sample processing.
In conclusion, it has become clear that there are different cytokine profiles specific to each clinical stage of MAC, demonstrated using MAC-specific antigens. The results of this study can be applied to the development of diagnostic tools which will greatly benefit the management of MAC.
Data availability statement
The datasets generated for this study are available on reasonable request to the corresponding author.
Ethics statement
The studies involving human participants were reviewed and approved by the Institute of Tropical Medicine and Nagasaki University Joint Ethics Committee (number: 191003222). The patients/participants provided their written informed consent to participate in this study.
Author contributions
YY performed laboratory investigations, designed the study, analyzed the data, and prepared the manuscript. IY and TT helped with laboratory investigations and revised the manuscript. TI, MTe, MTa, YT, and NA helped design the study and aided in sample collection. YO, SE, HK, and SM helped design the methodology of the study and were engaged in the production of antigens. KM helped with the laboratory investigations and edited the manuscript. All authors have reviewed and approved the final manuscript.
Funding
This study was supported by the Tenure track funds provided by Nagasaki University and Research Program on Emerging and Re-emerging Infectious Diseases under the Japan Agency for Medical Research and Development, AMED (number: JP23fk0108673).
Acknowledgments
We would like to thank Dr. Kensuke Minami, Dr. Tomoko Hiraoka, and Dr. Eiichiro Sando, who were members of the same laboratory at the time the study was conducted, and Dr. Koji Yamada and Dr. Masahiko Mori from Seiaikai Sasebo Memorial Hospital for their research tips and encouragement.
Conflict of interest
The authors declare that the research was conducted in the absence of any commercial or financial relationships that could be construed as a potential conflict of interest.
Publisher’s note
All claims expressed in this article are solely those of the authors and do not necessarily represent those of their affiliated organizations, or those of the publisher, the editors and the reviewers. Any product that may be evaluated in this article, or claim that may be made by its manufacturer, is not guaranteed or endorsed by the publisher.
Supplementary material
The Supplementary Material for this article can be found online at: https://www.frontiersin.org/articles/10.3389/fimmu.2023.1222428/full#supplementary-material
Abbreviations
pNTM, Pulmonary non-tuberculosis mycobacterial disease; NTM, non-tuberculosis mycobacterial disease; MAC, Mycobacterium avium complex; Th, T-helper; TB, Tuberculosis; Treg, regulatory T cells; MA-associated antigens, Mycobacterium avium-associated antigens; PPD, purified protein derivative; MTB, Mycobacterium tuberculosis.
References
1. Hoefsloot W, van Ingen J, Andrejak C, Angeby K, Bauriaud R, Bemer P, et al. The geographic diversity of nontuberculous mycobacteria isolated from pulmonary samples: an NTM-NET collaborative study. Eur Respir J (2013) 42:1604–13. doi: 10.1183/09031936.00149212
2. Prevots DR, Marras TK. Epidemiology of human pulmonary infection with nontuberculous mycobacteria: a review. Clin Chest Med (2015) 36:13–34. doi: 10.1016/j.ccm.2014.10.002
3. Namkoong H, Kurashima A, Morimoto K, Hoshino Y, Hasegawa N, Ato M, et al. Epidemiology of pulmonary nontuberculous mycobacterial disease, Japan. Emerg Infect Dis (2016) 22:1116–7. doi: 10.3201/eid2206.151086
4. Winthrop KL, Marras TK, Adjemian J, Zhang H, Wang P, Zhang Q. Incidence and prevalence of nontuberculous mycobacterial lung disease in a Large U.S. managed care health plan, 2008-2015. Ann Am Thorac Soc (2020) 17:178–85. doi: 10.1513/AnnalsATS.201804-236OC
5. Shah NM, Davidson JA, Anderson LF, Lalor MK, Kim J, Thomas HL, et al. Pulmonary mycobacterium avium-intracellulare is the main driver of the rise in non-tuberculous mycobacteria incidence in England, Wales and northern Ireland, 2007-2012. BMC Infect Dis (2016) 16:195. doi: 10.1186/s12879-016-1521-3
6. Strollo SE, Adjemian J, Adjemian MK, Prevots DR. The burden of pulmonary nontuberculous mycobacterial disease in the united states. Ann Am Thorac Soc (2015) 12:1458–64. doi: 10.1513/AnnalsATS.201503-173OC
7. Diel R, Jacob J, Lampenius N, Loebinger M, Nienhaus A, Rabe KF, et al. Burden of non-tuberculous mycobacterial pulmonary disease in Germany. Eur Respir J (2017) 49:1602109. doi: 10.1183/13993003.02109-2016
8. Henkle E, Novosad SA, Shafer S, Hedberg K, Siegel SAR, Ku J, et al. Long-term outcomes in a population-based cohort with respiratory nontuberculous mycobacteria isolation. Ann Am Thorac Soc (2017) 14:1120–8. doi: 10.1513/AnnalsATS.201610-801OC
9. Gochi M, Takayanagi N, Kanauchi T, Ishiguro T, Yanagisawa T, Sugita Y. Retrospective study of the predictors of mortality and radiographic deterioration in 782 patients with nodular/bronchiectatic mycobacterium avium complex lung disease. BMJ Open (2015) 5:e008058. doi: 10.1136/bmjopen-2015-008058
10. Ristola MA, von Reyn CF, Arbeit RD, Soini H, Lumio J, Ranki A, et al. High rates of disseminated infection due to non-tuberculous mycobacteria among AIDS patients in Finland. J Infect (1999) 39:61–7. doi: 10.1016/S0163-4453(99)90104-4
11. Harari A, Petitpierre S, Vallelian F, Pantaleo G. Skewed representation of functionally distinct populations of virus-specific CD4 T cells in HIV-1-infected subjects with progressive disease: changes after antiretroviral therapy. Blood. (2004) 103:966–72. doi: 10.1182/blood-2003-04-1203
12. Millington KA, Innes JA, Hackforth S, Hinks TS, Deeks JJ, Dosanjh DP, et al. Dynamic relationship between IFN-gamma and IL-2 profile of mycobacterium tuberculosis-specific T cells and antigen load. J Immunol (2007) 178:5217–26. doi: 10.4049/jimmunol.178.8.5217
13. Petruccioli E, Petrone L, Vanini V, Sampaolesi A, Gualano G, Girardi E, et al. IFNγ/TNFα specific-cells and effector memory phenotype associate with active tuberculosis. J Infect (2013) 66:475–86. doi: 10.1016/j.jinf.2013.02.004
14. Loo TT, Gao Y, Lazarevic V. Transcriptional regulation of CD4(+) T(H) cells that mediate tissue inflammation. J Leukoc Biol (2018) 104:1069–85. doi: 10.1002/JLB.1RI0418-152RR
15. Yamashita Y, Oe T, Kawakami K, Osada-Oka M, Ozeki Y, Terahara K, et al. CD4(+) T responses other than Th1 type are preferentially induced by latency-associated antigens in the state of latent mycobacterium tuberculosis infection. Front Immunol (2019) 10:2807. doi: 10.3389/fimmu.2019.02807
16. du Plessis WJ, Keyser A, Walzl G, Loxton AG. Phenotypic analysis of peripheral b cell populations during mycobacterium tuberculosis infection and disease. J Inflammation (Lond) (2016) 13:23. doi: 10.1186/s12950-016-0133-4
17. Leech JM, Lacey KA, Mulcahy ME, Medina E, McLoughlin RM. IL-10 plays opposing roles during staphylococcus aureus systemic and localized infections. J Immunol (2017) 198:2352–65. doi: 10.4049/jimmunol.1601018
18. Griffith DE, Aksamit T, Brown-Elliott BA, Catanzaro A, Daley C, Gordin F, et al. An official ATS/IDSA statement: diagnosis, treatment, and prevention of nontuberculous mycobacterial diseases. Am J Respir Crit Care Med (2007) 175:367–416. doi: 10.1164/rccm.200604-571ST
19. Shibata Y, Horita N, Yamamoto M, Tsukahara T, Nagakura H, Tashiro K, et al. Diagnostic test accuracy of anti-glycopeptidolipid-core IgA antibodies for mycobacterium avium complex pulmonary disease: systematic review and meta-analysis. Sci Rep (2016) 6:29325. doi: 10.1038/srep29325
20. Yamashita Y, Hoshino Y, Oka M, Matsumoto S, Ariga H, Nagai H, et al. Multicolor flow cytometric analyses of CD4+ T cell responses to mycobacterium tuberculosis-related latent antigens. Jpn J Infect Dis (2013) 66:207–15. doi: 10.7883/yoken.66.207
21. Yeh YK, Ding JY, Ku CL, Chen WC. Disseminated mycobacterium avium complex infection mimicking malignancy in a patient with anti-IFN-γ autoantibodies: a case report. BMC Infect Dis (2019) 19:909. doi: 10.1186/s12879-019-4564-4
22. Cowman SA, Jacob J, Hansell DM, Kelleher P, Wilson R, Cookson WOC, et al. Whole-blood gene expression in pulmonary nontuberculous mycobacterial infection. Am J Respir Cell Mol Biol (2018) 58:510–8. doi: 10.1165/rcmb.2017-0230OC
23. Brode SK, Jamieson FB, Ng R, Campitelli MA, Kwong JC, Paterson JM, et al. Increased risk of mycobacterial infections associated with anti-rheumatic medications. Thorax. (2015) 70:677–82. doi: 10.1136/thoraxjnl-2014-206470
24. Green AM, Difazio R, Flynn JL. IFN-γ from CD4 T cells is essential for host survival and enhances CD8 T cell function during mycobacterium tuberculosis infection. J Immunol (2013) 190:270–7. doi: 10.4049/jimmunol.1200061
25. Bekker LG, Freeman S, Murray PJ, Ryffel B, Kaplan G. TNF-alpha controls intracellular mycobacterial growth by both inducible nitric oxide synthase-dependent and inducible nitric oxide synthase-independent pathways. J Immunol (2001) 166:6728–34. doi: 10.4049/jimmunol.166.11.6728
26. Blachère NE, Morris HK, Braun D, Saklani H, Di Santo JP, Darnell RB, et al. IL-2 is required for the activation of memory CD8+ T cells via antigen cross-presentation. J Immunol (2006) 176:7288–300. doi: 10.4049/jimmunol.176.12.7288
27. Pepper M, Pagán AJ, Igyártó BZ, Taylor JJ, Jenkins MK. Opposing signals from the Bcl6 transcription factor and the interleukin-2 receptor generate T helper 1 central and effector memory cells. Immunity. (2011) 35:583–95. doi: 10.1016/j.immuni.2011.09.009
28. McKinstry KK, Strutt TM, Bautista B, Zhang W, Kuang Y, Cooper AM, et al. Effector CD4 T-cell transition to memory requires late cognate interactions that induce autocrine IL-2. Nat Commun (2014) 5:5377. doi: 10.1038/ncomms6377
29. Hondowicz BD, An D, Schenkel JM, Kim KS, Steach HR, Krishnamurty AT, et al. Interleukin-2-dependent allergen-specific tissue-resident memory cells drive asthma. Immunity. (2016) 44:155–66. doi: 10.1016/j.immuni.2015.11.004
30. Hondowicz BD, Kim KS, Ruterbusch MJ, Keitany GJ, Pepper M. IL-2 is required for the generation of viral-specific CD4(+) Th1 tissue-resident memory cells and b cells are essential for maintenance in the lung. Eur J Immunol (2018) 48:80–6. doi: 10.1002/eji.201746928
31. Dagenais-Lussier X, Aounallah M, Mehraj V, El-Far M, Tremblay C, Sekaly RP, et al. Kynurenine reduces memory CD4 T-cell survival by interfering with interleukin-2 signaling early during HIV-1 infection. J Virol (2016) 90:7967–79. doi: 10.1128/JVI.00994-16
32. Darrah PA, Patel DT, De Luca PM, Lindsay RW, Davey DF, Flynn BJ, et al. Multifunctional TH1 cells define a correlate of vaccine-mediated protection against leishmania major. Nat Med (2007) 13:843–50. doi: 10.1038/nm1592
33. Pantaleo G, Harari A. Functional signatures in antiviral T-cell immunity for monitoring virus-associated diseases. Nat Rev Immunol (2006) 6:417–23. doi: 10.1038/nri1840
34. Prévot G, Bourreau E, Pascalis H, Pradinaud R, Tanghe A, Huygen K, et al. Differential production of systemic and intralesional gamma interferon and interleukin-10 in nodular and ulcerative forms of buruli disease. Infect Immun (2004) 72:958–65. doi: 10.1128/IAI.72.2.958-965.2004
35. Hur YG, Kang YA, Jang SH, Hong JY, Kim A, Lee SA, et al. Adjunctive biomarkers for improving diagnosis of tuberculosis and monitoring therapeutic effects. J Infect (2015) 70:346–55. doi: 10.1016/j.jinf.2014.10.019
36. Cliffe LJ, Humphreys NE, Lane TE, Potten CS, Booth C, Grencis RK. Accelerated intestinal epithelial cell turnover: a new mechanism of parasite expulsion. Science. (2005) 308:1463–5. doi: 10.1126/science.1108661
37. Silva CA, Danelishvili L, McNamara M, Berredo-Pinho M, Bildfell R, Biet F, et al. Interaction of mycobacterium leprae with human airway epithelial cells: adherence, entry, survival, and identification of potential adhesins by surface proteome analysis. Infect Immun (2013) 81:2645–59. doi: 10.1128/IAI.00147-13
38. Reddy VM, Kumar B. Interaction of mycobacterium avium complex with human respiratory epithelial cells. J Infect Dis (2000) 181:1189–93. doi: 10.1086/315327
39. Rao SP, Gehlsen KR, Catanzaro A. Identification of a beta 1 integrin on mycobacterium avium-mycobacterium intracellulare. Infect Immun (1992) 60:3652–7. doi: 10.1128/iai.60.9.3652-3657.1992
40. Feng CG, Kullberg MC, Jankovic D, Cheever AW, Caspar P, Coffman RL, et al. Transgenic mice expressing human interleukin-10 in the antigen-presenting cell compartment show increased susceptibility to infection with mycobacterium avium associated with decreased macrophage effector function and apoptosis. Infect Immun (2002) 70:6672–9. doi: 10.1128/IAI.70.12.6672-6679.2002
41. Park HS, Back YW, Son YJ, Kim HJ. Mycobacterium avium subsp. paratuberculosis MAP1889c protein induces maturation of dendritic cells and drives Th2-biased immune responses. Cells (2020) 9:944. doi: 10.3390/cells9040944
42. Banks DA, Ahlbrand SE, Hughitt VK, Shah S, Mayer-Barber KD, Vogel SN, et al. Mycobacterium tuberculosis inhibits autocrine type I IFN signaling to increase intracellular survival. J Immunol (2019) 202:2348–59. doi: 10.4049/jimmunol.1801303
43. Gopal R, Lin Y, Obermajer N, Slight S, Nuthalapati N, Ahmed M, et al. IL-23-dependent IL-17 drives Th1-cell responses following mycobacterium bovis BCG vaccination. Eur J Immunol (2012) 42:364–73. doi: 10.1002/eji.201141569
44. Matsuoka K, Inoue N, Sato T, Okamoto S, Hisamatsu T, Kishi Y, et al. T-Bet upregulation and subsequent interleukin 12 stimulation are essential for induction of Th1 mediated immunopathology in crohn's disease. Gut. (2004) 53:1303–8. doi: 10.1136/gut.2003.024190
45. Ravindran R, Foley J, Stoklasek T, Glimcher LH, McSorley SJ. Expression of T-bet by CD4 T cells is essential for resistance to salmonella infection. J Immunol (2005) 175:4603–10. doi: 10.4049/jimmunol.175.7.4603
46. Matsuyama M, Ishii Y, Yageta Y, Ohtsuka S, Ano S, Matsuno Y, et al. Role of Th1/Th17 balance regulated by T-bet in a mouse model of mycobacterium avium complex disease. J Immunol (2014) 192:1707–17. doi: 10.4049/jimmunol.1302258
47. Cobb D, Smeltz RB. Regulation of proinflammatory Th17 responses during trypanosoma cruzi infection by IL-12 family cytokines. J Immunol (2012) 188:3766–73. doi: 10.4049/jimmunol.1103478
48. Khader SA, Bell GK, Pearl JE, Fountain JJ, Rangel-Moreno J, Cilley GE, et al. IL-23 and IL-17 in the establishment of protective pulmonary CD4+ T cell responses after vaccination and during mycobacterium tuberculosis challenge. Nat Immunol (2007) 8:369–77. doi: 10.1038/ni1449
49. Dubois Cauwelaert N, Baldwin SL, Orr MT, Desbien AL, Gage E, Hofmeyer KA, et al. Antigen presentation by b cells guides programing of memory CD4(+) T-cell responses to a TLR4-agonist containing vaccine in mice. Eur J Immunol (2016) 46:2719–29. doi: 10.1002/eji.201646399
Keywords: Mycobacterium avium complex disease, clinical stage, Mycobacterium avium-associated antigens, cell-mediated immunity, CD4+T cells, CD19+B cells, cytokine profile
Citation: Yamashita Y, Yasuda I, Tanaka T, Ikeda T, Terada M, Takaki M, Tsuchihashi Y, Asoh N, Ohara Y, Enany S, Kobayashi H, Matsumoto S and Morimoto K (2023) Antigen-specific cytokine profiles for pulmonary Mycobacterium avium complex disease stage diagnosis. Front. Immunol. 14:1222428. doi: 10.3389/fimmu.2023.1222428
Received: 14 May 2023; Accepted: 23 June 2023;
Published: 14 July 2023.
Edited by:
Buka Samten, The University of Texas Health Science Center at Tyler, United StatesReviewed by:
Delia Goletti, National Institute for Infectious Diseases Lazzaro Spallanzani (IRCCS), ItalyZissis C. Chroneos, The Pennsylvania State University, United States
Copyright © 2023 Yamashita, Yasuda, Tanaka, Ikeda, Terada, Takaki, Tsuchihashi, Asoh, Ohara, Enany, Kobayashi, Matsumoto and Morimoto. This is an open-access article distributed under the terms of the Creative Commons Attribution License (CC BY). The use, distribution or reproduction in other forums is permitted, provided the original author(s) and the copyright owner(s) are credited and that the original publication in this journal is cited, in accordance with accepted academic practice. No use, distribution or reproduction is permitted which does not comply with these terms.
*Correspondence: Yoshiro Yamashita, eW9zaGlyb0BkZzcuc28tbmV0Lm5lLmpw