 Jiaoyan Lv1†
 Haoxiang Gao2†Jie Ma3†
 Jiachen Liu1†Yujie Tian1Chunyuan Yang3
 Mansheng Li3Yue Zhao4Zhimin Li4
 Xuegong Zhang2,5*
 Yunping Zhu3*
 Jianhong Zhang1,6*
 Li Wu1,6*
- 1Institute for Immunology, Tsinghua-Peking Joint Centre for Life Sciences, School of Medicine, Tsinghua University, Beijing, China
- 2Department of Automation, Ministry of Education (MOE) Key Laboratory of Bioinformatics, Bioinformatics Division and Centre for Synthetic & Systems Biology, BNRist, Tsinghua University, Beijing, China
- 3State Key Laboratory of Proteomics, Beijing Proteome Research Center, National Center for Protein Sciences (Beijing), Beijing Institute of Lifeomics, Beijing, China
- 4Annoroad Gene Technology (Beijing) Co., Ltd., Beijing, China
- 5School of Life Sciences, Tsinghua University, Beijing, China
- 6Beijing Key Laboratory for Immunological Research on Chronic Diseases, Beijing, China
Idiopathic pulmonary fibrosis (IPF) is a chronic interstitial lung disease with a high mortality rate and unclarified aetiology. Immune response is elaborately regulated during the progression of IPF, but immune cells subsets are complicated which has not been detailed described during IPF progression. Therefore, in the current study, we sought to investigate the role of immune regulation by elaborately characterize the heterogeneous of immune cells during the progression of IPF. To this end, we performed single-cell profiling of lung immune cells isolated from four stages of bleomycin-induced pulmonary fibrosis—a classical mouse model that mimics human IPF. The results revealed distinct components of immune cells in different phases of pulmonary fibrosis and close communication between macrophages and other immune cells along with pulmonary fibrosis progression. Enriched signals of SPP1, CCL5 and CXCL2 were found between macrophages and other immune cells. The more detailed definition of the subpopulations of macrophages defined alveolar macrophages (AMs) and monocyte-derived macrophages (mo-Macs)—the two major types of primary lung macrophages—exhibited the highest heterogeneity and dynamic changes in expression of profibrotic genes during disease progression. Our analysis suggested that Gpnmb and Trem2 were both upregulated in macrophages and may play important roles in pulmonary fibrosis progression. Additionally, the metabolic status of AMs and mo-Macs varied with disease progression. In line with the published data on human IPF, macrophages in the mouse model shared some features regarding gene expression and metabolic status with that of macrophages in IPF patients. Our study provides new insights into the pathological features of profibrotic macrophages in the lung that will facilitate the identification of new targets for disease intervention and treatment of IPF.
1 Introduction
Idiopathic pulmonary fibrosis (IPF) is the most common form of interstitial lung disease, and its prevalence is increasing worldwide (1). The pathological characteristics of IPF include abnormal activation of myofibroblasts and excess deposition of collagen in the lung, subsequently leading to respiratory failure. However, due to the complexity of the pathogenetic process of IPF and the uncertainty of patient aetiology, IPF is clinically refractory (2). Although two drugs, pirfenidone and nintedanib, have shown the ability to slow down disease progression, neither medication improves or stabilizes lung function (3). A more comprehensive understanding of the molecular and cellular mechanisms of pulmonary fibrosis is required to develop new therapeutic strategies.
Immune cells actively participate in pulmonary fibrosis progression. In particular, lung macrophages, which typically comprise alveolar macrophages (AMs), monocyte-derived macrophages (mo-Macs), and interstitial macrophages (IMs), are crucial for tissue damage, repair, and fibrosis (4). Indeed, several studies have reported the specialised roles of macrophages in tissue repair and fibrosis (5–7). It is believed that macrophages produce large amounts of growth factors to promote myofibroblast proliferation and subsequent tissue repair and remodelling (8, 9). The emergence of single-cell RNA sequencing enables the profiling of thousands of individual cells and further helps to elucidate the disease mechanism. Also, understanding the heterogeneity of macrophages could reveal the potential therapeutic biotarget. Reyfman et al. applied single-cell RNA sequencing (scRNA-seq) and highlighted the primary profibrotic functional population of macrophages in human fibrotic lungs (10). Nevertheless, macrophage subpopulations remain poorly characterised. The unavailability of human samples at different time points also limits the understanding of the dynamic changes in macrophages during IPF. Systematic research is needed to understand macrophage heterogeneity and their various roles.
Several studies have reported metabolic disturbances in lung tissues under fibrotic conditions (11–13). Hence, metabolism-based therapies are emerging owing in part to the disappointing outcomes of several inflammation-based pulmonary fibrosis therapies (14). Metabolic reprogramming directs macrophage activation in various inflammatory conditions. In fact, metabolic changes in macrophages have also been confirmed in cystic fibrosis (15, 16). These results highlight the necessity of systematic investigations into the dynamic metabolic function of macrophages during pulmonary fibrosis progression.
In this study, we constructed a dynamic single-cell landscape of lung immune cells from four different stages of bleomycin-induced pulmonary fibrosis. By systematic comparison, we revealed the diverse roles of macrophages. Analysis of interacting ligands and receptors revealed a highly dynamic signal connection network and highlighted the distinctive role of CCL5-CCR5/CCR1 signalling in the late fibrotic stage. We then re-clustered and analysed subsets of AM and mo-Mac, revealing several profibrotic populations with differential trajectories. Importantly, we identified the different metabolic functions of macrophages at different stages of pulmonary fibrosis. Finally, we reanalysed a human IPF single-cell dataset, detected numerous similarities with our dataset, and identified a potential therapeutic target for future treatment. Taken together, our data provide novel insights regarding the function of macrophages and their subpopulations at different fibrotic stages, facilitating future treatment exploration.
2 Materials and methods
2.1 Establishment of fibrosis mouse model and single-cell preparation
Male wild-type C57BL/6 mice were purchased from Tsinghua University and housed in the Tsinghua University animal facility under specific pathogen-free barrier conditions. The animal experiments were approved by the Institutional Animal Care and Use Committee of Tsinghua University (approval number: 19-WL4). Mice aged 8 weeks were administered 1.5 mg/kg of bleomycin (Selleck, China) in 40 µL of saline or saline alone via an intratracheal injection. The mice were euthanised by CO2 inhalation; subsequently, cardiac puncture was performed and the mice were perfused with 20 mL of phosphate-buffered saline to remove blood cells. Saline-treated mice served as the control group (day 0), other mice were sacrificed 7, 14, and 21 days after BLM administration, each time point had 3 mice (n=3). The lungs were harvested and digested with collagenase A (0.4 mg/mL) and DNase (0.4 mg/mL) to generate single-cell suspensions. Cells generated from same time point were mixed. All cells were blocked with anti-CD16/32 and labelled by anti-CD45 antibody (Biolegend). CD45+ immune cells were then isolated using fluorescence-activated cell sorting (FACS) for downstream analysis.
2.2 Crosstalk analysis and statistics
Potential cellular crosstalk was inferred from ligand–receptor expression. The ligand–receptor pair dataset for mice was derived from iTALK (17). The interaction score between the two cell types of each ligand–receptor pair was calculated as previously reported (17). The overall interaction scores were log2-transformed to the overall number of ligand–receptor interactions between each cell type pair and calculated separately for each day. The matrices were visualised as a heat map using the Python matplotlib package. Ligand–receptor interactions were visualised as circus plots and bubble plots using the Python Pycircos package and matplotlib, respectively.
After identifying highly expressed or differentially expressed genes, these were matched and paired using our ligand–receptor database to identify significant interactions. To identify alterations in singling interactions, the expression levels of both ligands and receptors were evaluated.
2.3 Metabolic pathway analysis
Metabolic pathways analysis was established following previously reported methodologies (18). To be specific, gene set variation analysis (GSVA) was used to calculate the enrichment scores of each metabolic pathway in each cell. The pathway score of a cell group was defined as the mean of the pathway scores for all cells in the group.
The statistical significance of the metabolism score was calculated as follows:
where is the P-value; is the metabolic pathway; is the cell type; is the sampling time point; is a single cell; is the GSVA score of pathways of cell ; and is the sampling time point of cell . P-values were adjusted using the false discovery rate (FDR) method, and pathways with FDR ≤ 0.05 were considered significantly higher or lower at a given time point than at other time points.
2.4 Trajectory analysis and RNA velocity
Trajectory analysis was performed using the ‘Monocle’ package. Highly variable genes were selected by fitting a curve to the mean gene expression and empirical dispersion (dispersion table). Genes with mean expression >0.1 and empirical dispersion larger than the fitting result were retained. Dimensionality reduction and trajectory reconstruction were then performed (reduceDimension, max_components = 2, method = ‘DDRTree’). The pseudotime of the cells was calculated by setting the branch with the greatest number of D0 cells as the root state and then ordering the cells.
For RNA velocity analysis, we loaded our single-cell RNA sequencing data of all mice macrophages, into an AnnData object which is the data structure used by scvelo. Then, we preprocess our scRNA-seq data using scvelo’s preprocessing functions. This step typically involves quality control, normalization, and dimensionality reduction. After preprocessing the data, we estimated RNA velocity using scvelo’s tl.recover_dynamics function. This function infers the unspliced and spliced mRNA counts for each cell, which are used to compute RNA velocity vectors. Once the dynamics are recovered, we compute RNA velocity using scvelo’s tl.velocity function. Finally, we use velocity_embedding_stream function to generate a plot showing the RNA velocity vectors as arrows overlaid on a UMAP projection of the cells. All steps were processed with default parameters.
2.5 Human and mouse data analysis and comparison
Single-cell data sampled from patients with IPF were obtained from a publicly available dataset (10). We selected data sampled from individuals who were labelled as either ‘IPF’ or ‘donor’. The data underwent standard scRNA-seq data processing steps such as cell filtering, normalisation, scaling, principal Components Analysis (PCA), harmony, clustering, and uniform manifold approximation and projection (UMAP) visualisation. Clusters that expressed protein tyrosine phosphatase receptor type C (PTPRC) with mean normalised counts >1 were identified as immune cells. Immune cells were then assigned rough cell types by manual annotation using the markers listed in Supplementary Table 5. Marker genes of human immune cell types were calculated using the Wilcoxon test. We retained the orthologous gene pairs if the human gene was a significant marker in a human cell type, and if the mouse gene was also a significant marker in the same mouse cell type. The results are presented in Supplementary Table 6.
2.6 Gene set enrichment analysis
We used GSEA (19) to identify whether genes highly expressed in the IPF sample of human macrophages were also highly expressed in mouse macrophages from the day 21 sample. We first calculated the log2 fold change of genes (D21 versus D0), sorted the genes in descending order, and used these genes as the background gene set. GSEA (20) was then applied to identify whether the highly expressed genes in the macrophages of IPF patients were enriched.
2.7 Alignment, quantification, and quality control of scRNA-seq data; data integration, normalisation, clustering, and annotation; detection of doublets and dead cells; and enrichment analysis
Procedures are detailed in Supplementary Methods.
3 Results
3.1 scRNA-Seq profiling defines the immune landscape during pulmonary fibrosis progression
To evaluate the contribution of immune cells to pulmonary fibrosis progression, we utilized a murine model of bleomycin-induced idiopathic pulmonary fibrosis (BIPF) to mimic human IPF (Figure 1A; Supplementary Figure 1). Lung CD45+ immune cells were isolated using fluorescence-activated cell sorting from naïve mice (day 0 [D0]), and at the following stages after bleomycin administration: acute inflammatory phase (D7), profibrotic phase (D14), and later fibrotic phase (D21; Figure 1A). In total, we obtained 15,596 cells using 10× Genomics Chromium droplet single-cell RNA sequencing (scRNA-seq; Figure 1A). These cells were normalised and clustered; the clusters were then annotated based on their specific gene expression markers: macrophages (CD68+C5ar1+), dendritic cells (CD11c+MHC-II+Dpp4+), T and natural killer T (NKT) cells (CD3e+), B cells (CD19+CD79a/b+), neutrophils (CXCR2+C5ar1+), and NK cells (NKg7+NCR1+Gzma+) (Figures 1B–D). When compared with the naïve control (D0), the proportion of macrophages in CD45+ immune cells initially reduced on day 7, but rapidly recovered by days 14 and 21 (Figure 1E). The proportions of DCs, B cells, and T&NKT cells increased, while those of neutrophils and NK cells decreased (Figure 1E). Although the frequency of each immune cell did not markedly change during BIPF progression, projection data showed that the composition of each immune cell population, especially macrophages, varied at different stages (Figure 1F). These data indicate that immune cells, particularly macrophages, have different subpopulations or different activated statuses at different BIPF stages.
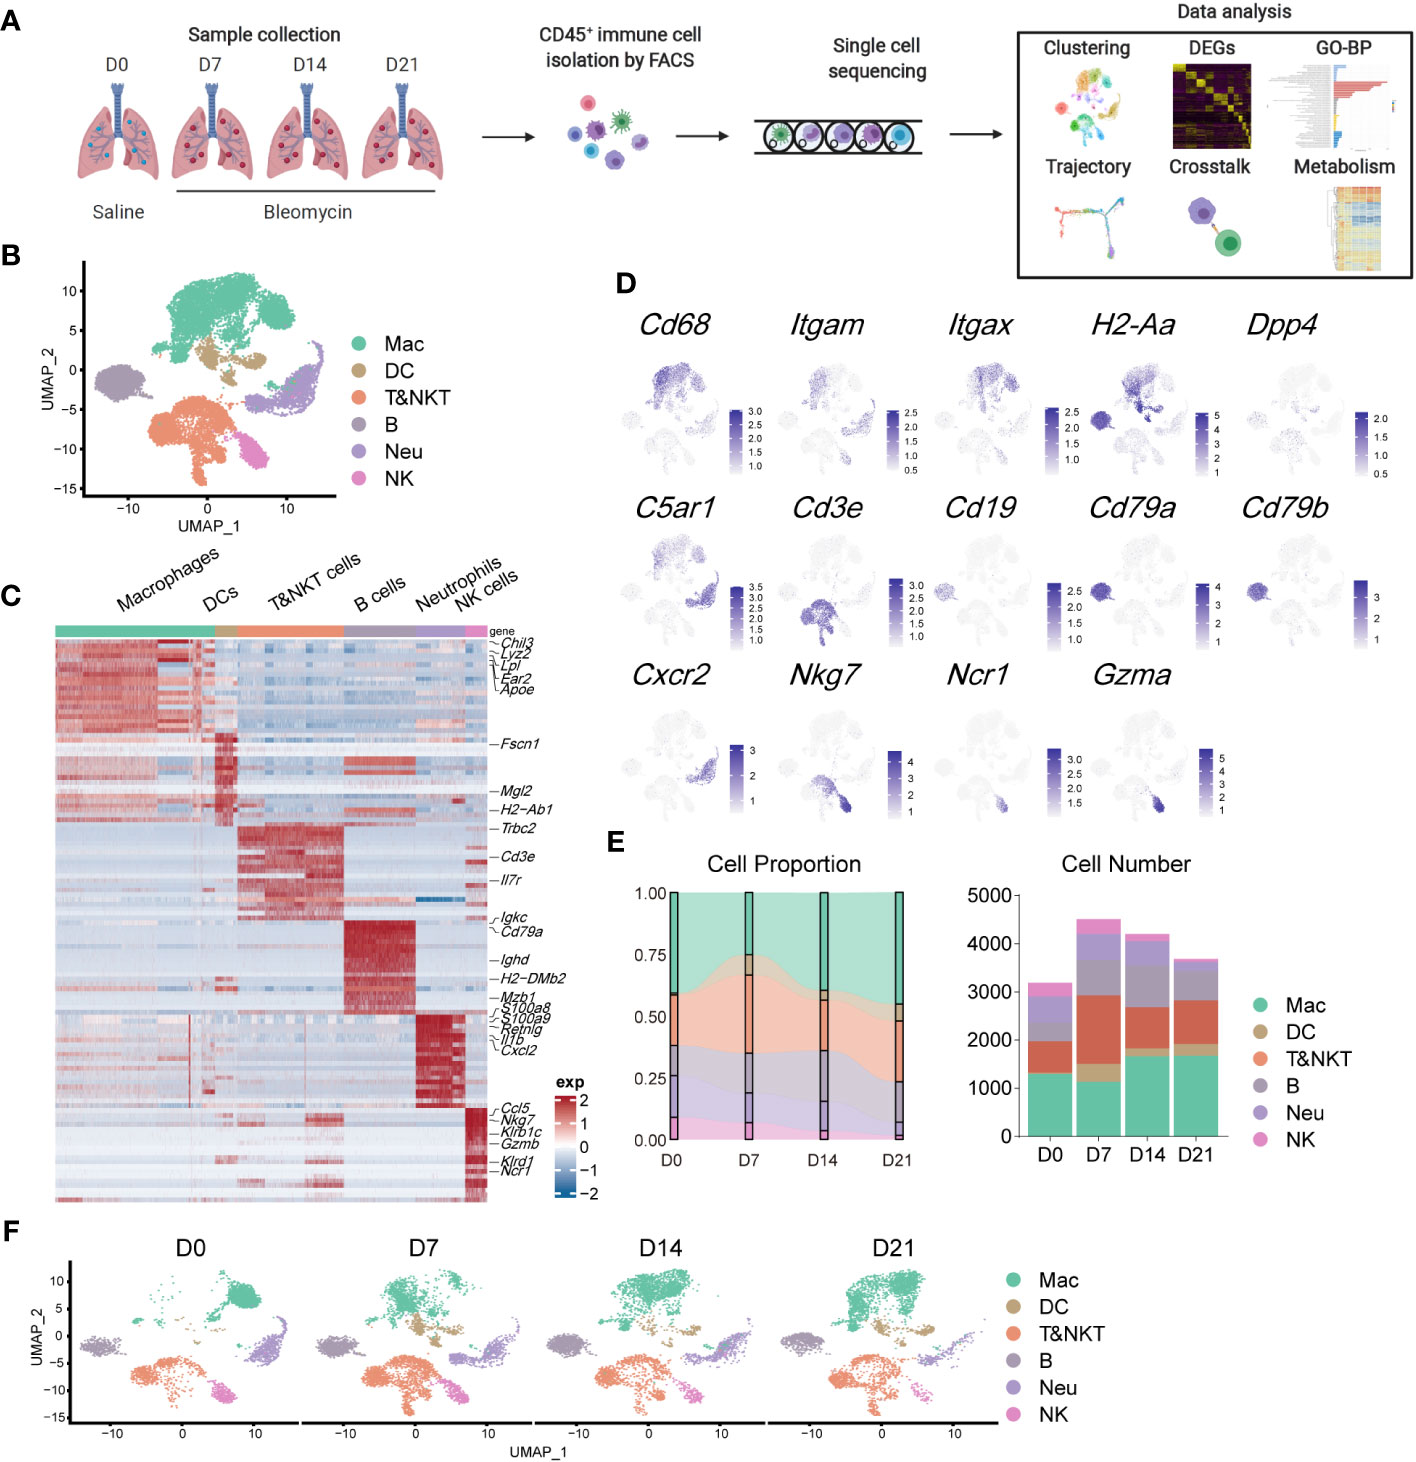
Figure 1 Overview of the immune landscape during the progression of bleomycin-induced pulmonary fibrosis (BIPF). (A) Schematic of the experimental design. (B) Uniform manifold approximation and projection (UMAP) analysis of immune cells in the IPF lung; coloured by unsupervised clustering results with cell type annotations on the right. (C) Heatmap of the top 20 highly expressed genes for each immune cell type; representative marker genes are labelled. (D) Canonical cell markers were used to label different cell clusters as represented in the UMAP plot. (E) Bar plots deciphering the percent of different types of immune cells in total immune cells at different stages of bleomycin-induced pulmonary fibrosis. (F) UMAP plots depicting the projection of cells from various stages of pulmonary fibrosis on a 2D map.
3.2 Ligand–receptor analysis reveals the central role of macrophages in interaction networks of immune cells during pulmonary fibrosis progression
Cell-cell interactions constitute a significant component of cellular function, mediated by ligand-receptor interactions (21). The progression of IPF is intricately linked to the functioning of immune cell, with interactions among these immune cells constituting a crucial component. However, these interactions have not been extensively explored to date. To elucidate the role of macrophages in communication networks during BIPF progression, we used a well-established pipeline, iTALK, to identify potential cell–cell interactions (17). The Network circle plots showed key interaction through different cell types. The interaction link start from a ligand and end in a receptor, and the thickness represents the interaction strength. Myeloid immune cells, including macrophages, dendritic cells, and neutrophils, were the major transmitters noted to have strong interactions with each other in the steady state (D0) (Figure 2A). However, with pulmonary fibrosis progression, macrophages exhibited a significantly increased strength of interactions with other immune cells (Figures 2B–D). Conversely, few interactions were found involving T&NKT, B and NK cells (Figures 2A–D). We then calculated the communication scores in each cell pair during fibrosis progression. Moreover, macrophages derived more ligands in inflammatory and fibrotic lungs, where they interacted with receptors expressed on T and NKT cells, neutrophils, and other macrophages (Figure 2E). By contrast, the predicted interactions between neutrophils and other immune cells were the strongest during the acute inflammatory phase, but declined later (Figures 2A–E). Meanwhile, the strength of the interaction between dendritic cells and other immune cells was relatively lower than that of macrophages (Figures 2A–E).
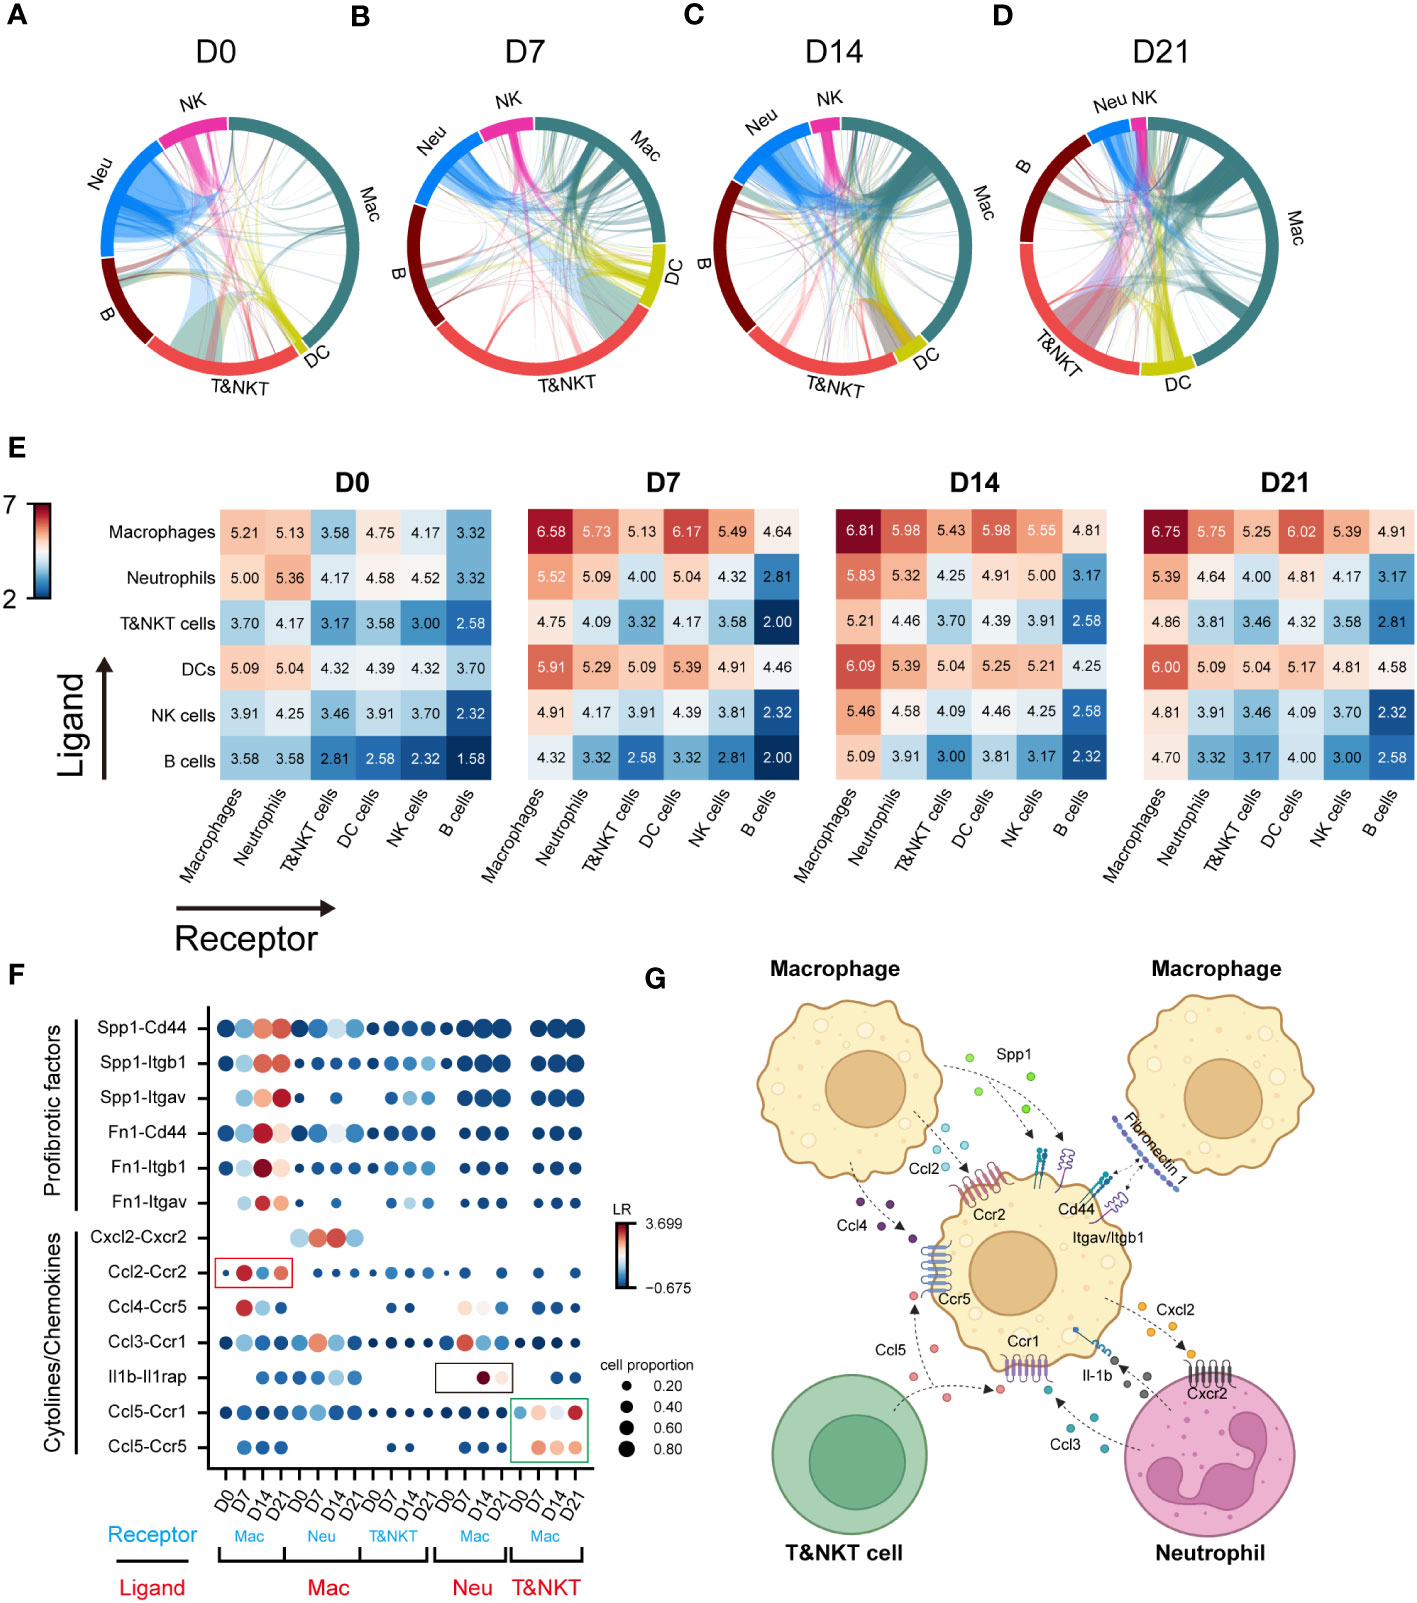
Figure 2 Communication networks between lung immune cells during the progression of pulmonary fibrosis. (A–D) Network plots showing the interaction strength among immune cell subtypes. Cell types and interactions are depicted as nodes and edges, respectively. Nodes are coloured by cell identity and sized by the number of interactions. Edge thickness indicates the number of interactions between the connecting cells. Edges are coloured red if they are ranked in the top 15% of all edges in the plot. (E) Heatmap showing the interaction score (Log2LR-pairs) among different immune cell subtypes. For each heatmap, rows indicate transmitters, and columns indicate responders. Red indicates a high interaction score. (F) Expression of cell-type-specific ligand-receptor interactions inferred by iTALK. Shown are predicted interactions between macrophages, neutrophils and T&NKT cells at different stages. Circle size indicates the proportion of ligand-receptor expression in interacting cells and circle colour indicates mean expression of ligand and receptor genes for interacting pairs. (G) Predicted regulatory network between macrophages, neutrophils and T&NKT cells. Created with BioRender.com.
We further predicted the functional interactions between macrophages and other immune cells, and classified them as macrophages as ligand and macrophages as receptor. The result showed that macrophages expressed high levels of profibrotic factors, including FN1 and SPP1 during fibrosis. These factors bound to ITGAV/ITGB1 and CD44 within macrophages (Figure 2F), which was consist with previous reports (22, 23). Significant changes were also detected in other interactions involving cytokines and chemokines, such as CCL2, CCL4, and CXCL2 (all expressed by macrophages), CCL5 (expressed by T and NKT cells), CCL3, and IL-1β (expressed by neutrophils; Figures 2F, G). Notably, a large proportion of interactions involving cytokines and chemokines were highly active in the inflammatory phase (D7), and declined in the later phase (D14–D21), such as CCL2-CCR2 (Mac-Mac, red frame, Figure 2F). We also observed similar pattern for IL1β-IL1RAP interactions (Neu-Mac, black frame), which reached peak at D14 (Figure 2F). However, CCL5-CCR5/CCR1 (T&NKT-Mac, green frame) signalling was continuously active, which might suggest that this signal have a distinctive role in late fibrotic stages of IPF, consistent with the observed late activation of CCL5 (24, 25). Taken together, these data reveal the major regulatory role of macrophages in immune cells and predict that CCL5-CCR5/CCR1 may serve as a potential therapeutic target for lung fibrosis (Figures 2G).
3.3 Dynamic changes occur in tissue-resident and infiltrating macrophage clusters during pulmonary fibrosis progression
Further compartmental analysis using higher-resolution clustering identified four subclusters (Figure 3A), mainly according to the expression of Itgam, Itgax, Ly6c2, and Siglecf. They were annotated as follows: IMs (Itgam+Itgax-), monocyte-derived macrophages (mo-Macs; ItgamhighItgax+SiglecflowC1qa,b,chigh), Ams (Pparg+ItgamlowItgax+Siglecfmid/high), and monocytes (ItgamhighItgax-Ly6c2high) (Figures 3A–D). Ams and mo-Macs were the two major populations; their proportions and that of their subclusters, changed according to pulmonary fibrosis progression (Figures 3E, F). AMs comprise a special group of macrophages that have relatively unique gene expression profiles, functions and origin (26). Mo-Macs originate from infiltrating monocytes, both of which migrated into the lungs during inflammatory responses (Figures 3E, F), as previous reported (27). To further understand the differentiation trajectory of macrophage subsets, we applied RNA-velocity analysis on total macrophages to predict the path. Our results suggested that after fibrosis onset, monocytes could differentiate into mo-Mac, while AMs had an internal transition trajectory and IMs showed no obvious differentiation trajectory from other cells (Figure 3G). This result suggested that mo-Mac exhibited migration characteristics, while AM clusters had the potential to transform within AMs.
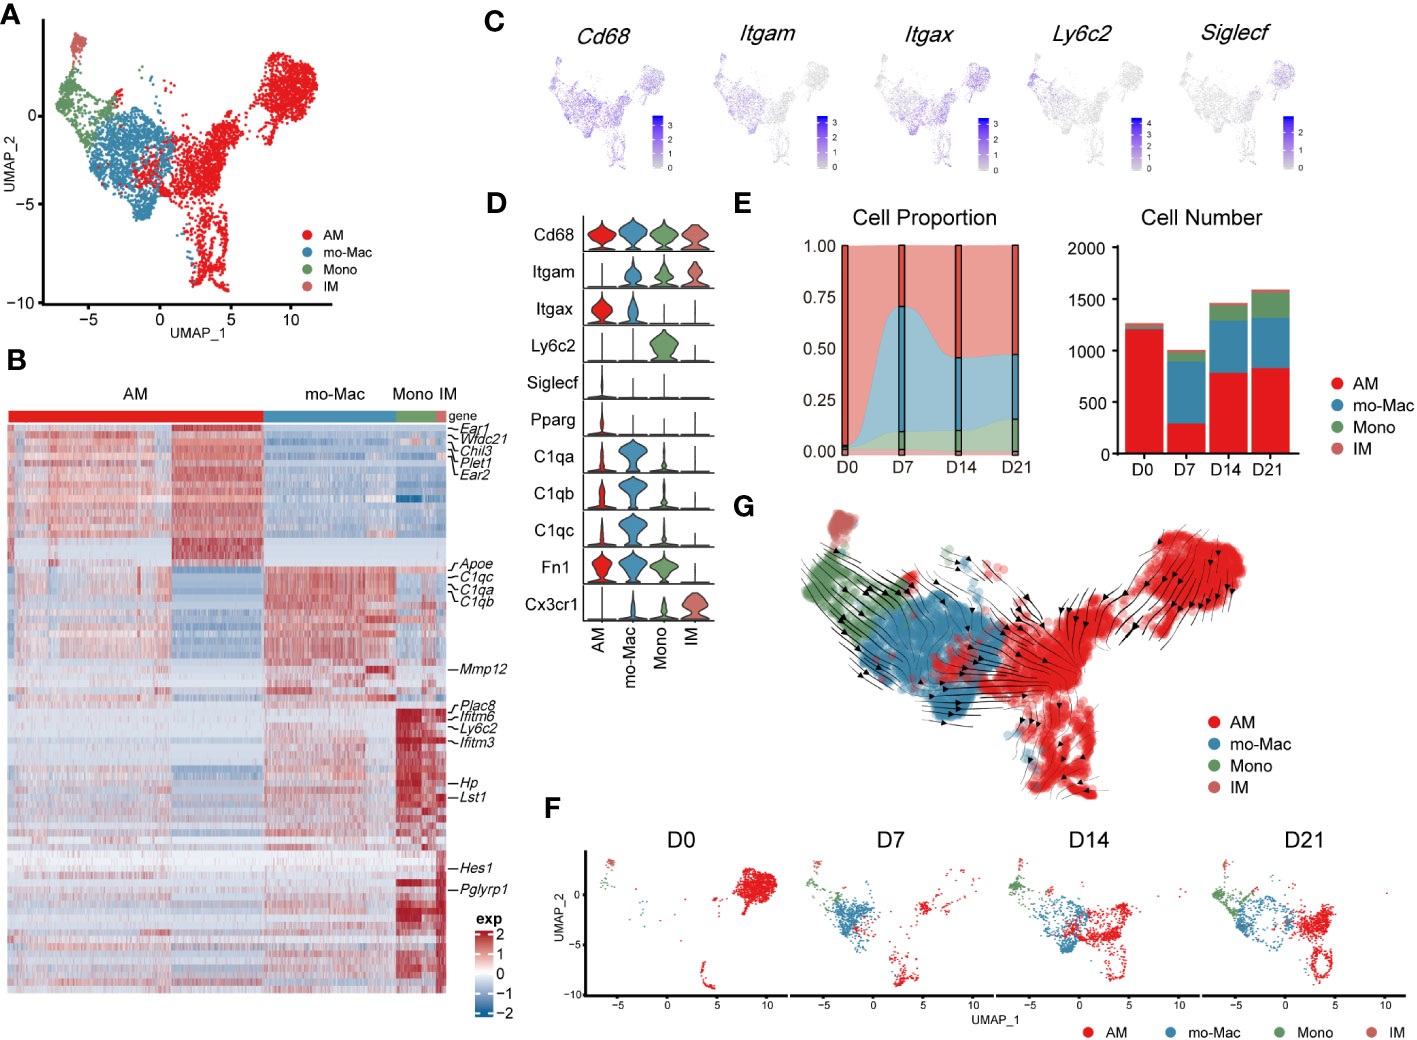
Figure 3 Transcriptomic characteristics of macrophages from different cell origins in the lung during the progression of pulmonary fibrosis. (A) UMAP plot depicting the subcluster of macrophages in the lung of bleomycin-induced pulmonary fibrosis. (B) Heatmap of the top 20 highly expressed genes for each subcluster of macrophages; representative markers genes are labelled. (C) UMAP plot showing the specific marker gene expression in the subcluster of macrophages. (D) Violin plots comparing the expression level of selected genes in each cluster of mouse macrophages. (E) Bar plots depicting the composition of different subclusters of macrophages at various stages of bleomycin-induced pulmonary fibrosis. (F) UMAP plots depicting the projection of macrophages from various stages of pulmonary fibrosis on a 2D map. (G) Trajectory of differentiation within all macrophages f predicted by RNA velocity.
We also analysed the gene expression profiles of AMs, mo-Macs, and IMs at different stages. In the steady state (D0), AMs expressed high levels of signature genes, such as Fabp1, Ear1, and Krt19. However, in the acute inflammatory stage they exhibited a different gene expression profile, with upregulated expression of profibrotic genes, including Fn1, Spp1, and Cd63 (D7). Notably, expression of these genes remained high in the later stages (D14–D21; Supplementary Figure 2A). mo-Macs infiltrated the lungs from D7 and expressed high levels of Ccl4, Cxcl10, and Nfkbia, reflecting an activated inflammatory phenotype (28) (Figure 3E; Supplementary Figure 2A). mo-Macs potentially manifested a profibrotic phenotype, substantiated by the high expression of profibrotic genes, notably including Mmp12, Lpl, Mmp19, and Ecm1 (Supplementary Figure 2A).
Moreover, the scRNA-seq data showed that IMs existed in the patient’s lungs at all time points; their populations were small and rarely changed during pulmonary fibrosis progression (Figure 3E). In a healthy state, IMs express high levels of Ptger4 and Ifi27l2a and are involved in the regulation of the innate immune response (29). In the acute inflammatory stage, their ability to recruit monocytes is enhanced by the expression of Ccl2 (30). Like AMs, Spp1 and Apoe were also expressed by IMs on D14 and D21 (Supplementary Figure 2A). This finding shows that IMs may have the potential to promote IPF at the level of gene expression, aligning with contemporary perspectives that IMs are associated with IPF progression (31, 32)
3.4 Analysis of alveolar macrophage identifies specific clusters associated with disease state and their developmental trajectories
To precisely identify the primary functional population of AMs during pulmonary fibrosis progression, we further divided AMs into seven clusters (Figures 4A, B). The projection data showed that clusters 1, 4, and 5 were lung-resident cells only found at steady state (D0, Figure 4C). These cells expressed high levels of AM-specific markers, including Fabp1, Cidec, and Krt79 (Figure 4C, Supplementary Figure 3A). After D7, AMs were replenished by clusters 0, 2, and 3 (Figure 4C; Supplementary Figure 3B). These clusters shared similar profibrotic gene expression profiles, including Spp1 and Fn1 (Supplementary Figure 3A). Notably, cluster 0, characterised by high Gpnmb expression, was continuously augmented as the primary AM population in fibrotic lungs (D21). Meanwhile, cluster 2 expressed proliferation genes, including Pclaf, Stmn1, and Top2a (33), and cluster 3 harboured a proinflammatory phenotype with Jun and S100a4 expression (Supplementary Figure 3A). Since the populations of cluster 2 and 3 peaked on D7 and D14, respectively, our data indicate different populations involved in maintaining inflammatory and fibrotic phenotypes. Furthermore, we identified a rare population in cluster 6, which expressed Ifi211, Isg15, and Trim30a; these genes are associated with defence against viral infection (34); however, their role in pulmonary fibrosis is unknown (Figure 4B; Supplementary Figure 3A).
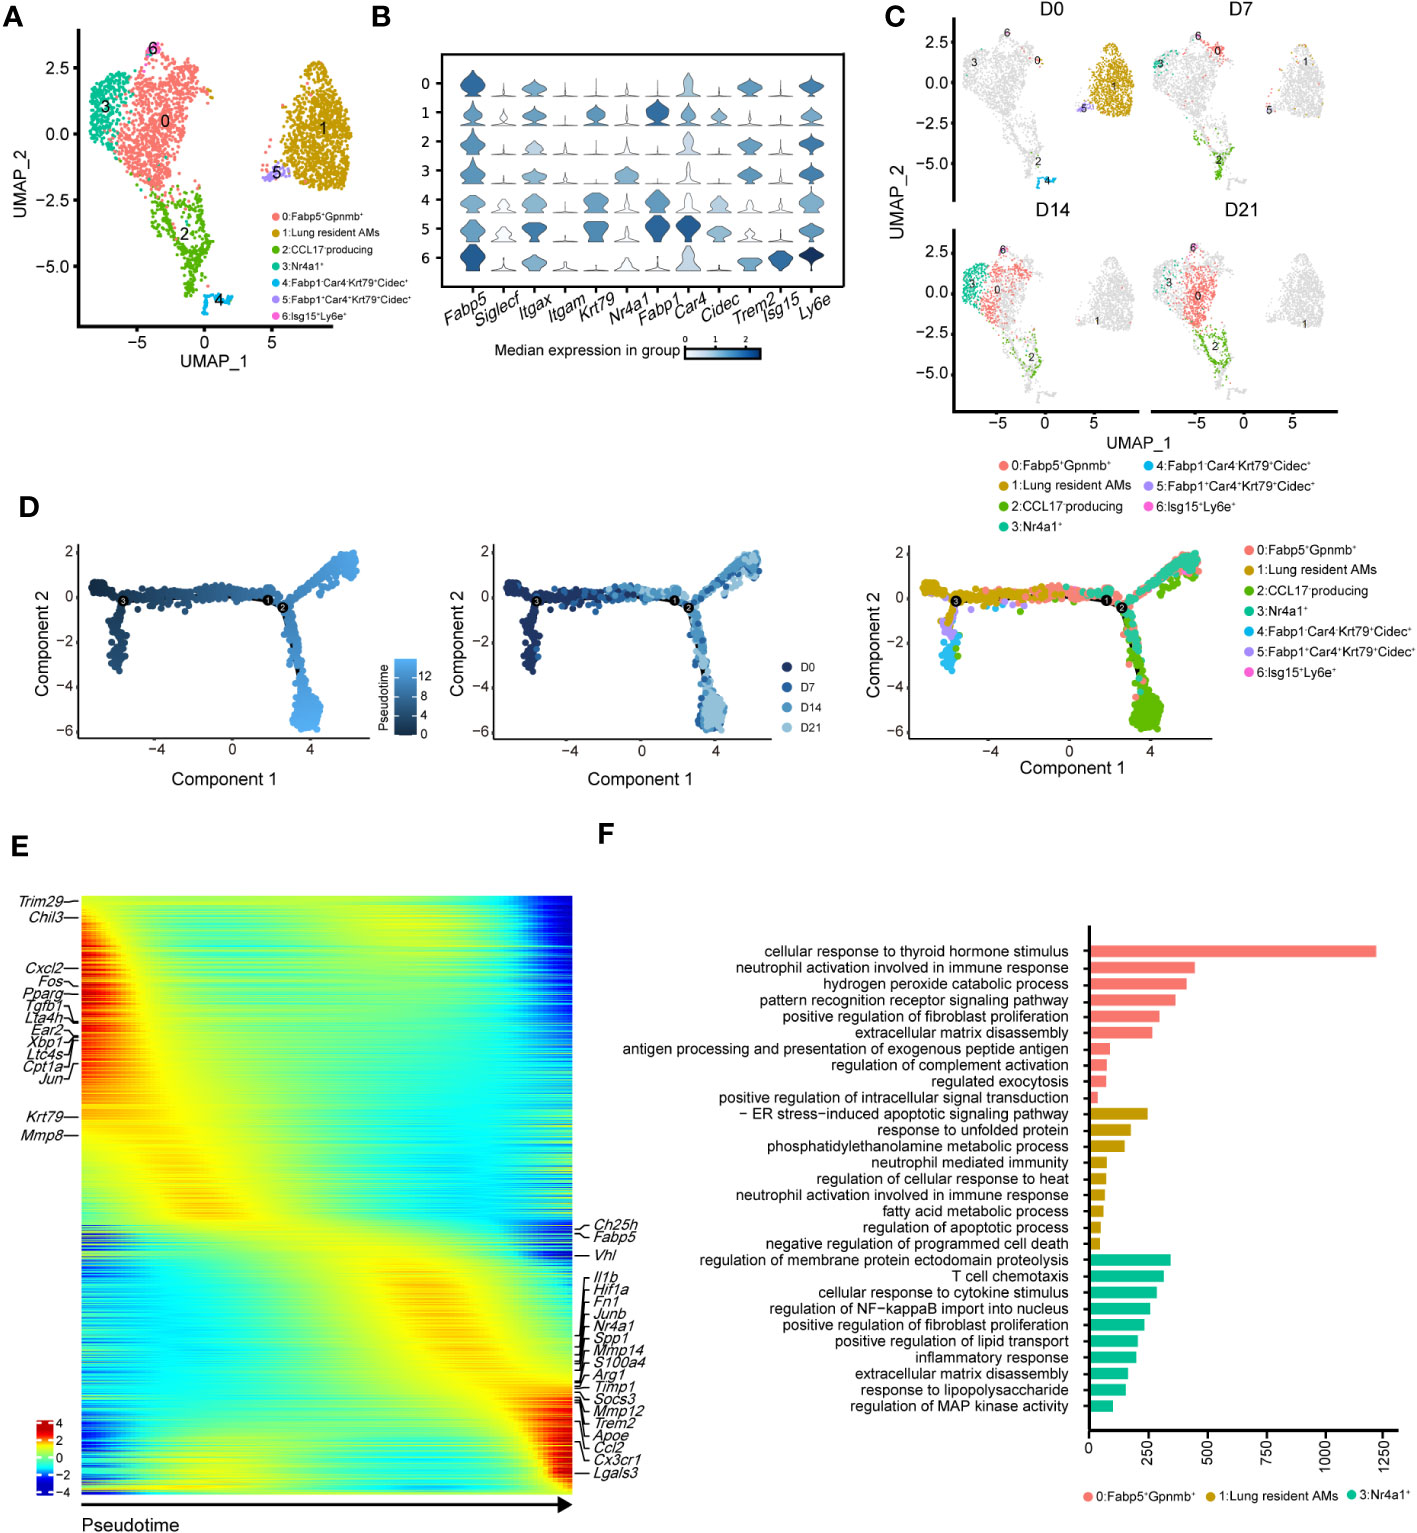
Figure 4 Heterogeneity of alveolar macrophages (AMs) during the progression of pulmonary fibrosis. (A) UMAP plots depicting the subcluster of AMs in the lungs with bleomycin-induced pulmonary fibrosis. (B) Violin plots comparing the expression levels of selected genes in each cluster of alveolar macrophages. (C) UMAP plots depicting the projection of AMs from different stages of pulmonary fibrosis on a 2D map. (D) DDRTree plot showing the trajectory development of AM; the plots are coloured by derived pseudotime (left), Seurat clustering result (middle), and sampling timepoint (right). (E) Gene expression profiles of AMs ordered according to the pseudotime trajectory, with the x-axis representing pseudotime. Fibrosis-related genes are labelled. (F) Functional enrichment analysis of GO biological processes, with significant marker genes of clusters 0, 1, and 3 of AMs.
We next performed pseudotime inference of AMs during pulmonary fibrosis progression (Figure 4D). Cells were clustered according to different pseudotime, sampling timepoints and clusters. The trajectory path of AMs started with lung-resident AMs (clusters 1, 4, and 5 on D0), and then bifurcated into proinflammatory and profibrotic AMs either in the profibrotic phase (clusters 0, 2, and 3 on D14) or in the later fibrotic phase (clusters 0 and 2 on D21; Figure 4D, middle and right). Our result might suggest that AMs population at homeostasis might exhibit self-renewal and differentiation properties. We also investigated changes in AM gene expression profiles and found that certain metabolism- and proliferation-related genes, such as Cpt1a and Krt79 (35), were highly expressed at the early pseudotime, while proinflammatory and profibrotic genes, such as Fn1 and Spp1, were upregulated later (Figure 4E). We also found that Trem2 was upregulated in AMs; however, its function in IPF remains unknown. These results further reflect the necessity of distinguishing AM subgroups and revealing their associations with fibrotic progression.
Using Gene Ontology (GO), we performed functional enrichment analysis on the major clusters 0, 1, and 3. Consistent with the gene expression profiles, the fatty acid metabolism pathway was enriched in cluster 1 (Figure 4F). By contrast, biological processes associated with fibrosis, including ‘positive regulation of fibroblast proliferation’ and ‘extracellular matrix disassembly’, were enriched in cluster 0 (Figure 4F). Cluster 3 harboured the functional pathways for regulating the immune response and promoting fibrosis. We also compared the expression of key functional genes and found that cluster 3 was expected to secrete more Cxcl2, Cxcl1, and Il1b than the other clusters (Supplementary Figure 3C). Together, these data described the dynamic changes in AM subclusters and identified cluster 0 with Gpnmb expression as a potential target in pulmonary fibrosis treatment.
3.5 Diverse clusters of monocyte-derived macrophages shows distinct functional features during pulmonary fibrosis progression
To better understand the pathological roles of mo-Mac, we identified five clusters using higher-resolution clustering (Figures 5A, B). Cluster 0, marked by high levels of Cx3cr1, was the primary population in the acute inflammatory phase (D7), expressing inflammation-related genes, such as Ccl4 and Tnf (Figures 5B, C). During the profibrotic phase (D14), cluster 0 was replaced by cluster 1, termed CD11c+CD11b+CD36high mo-Macs, which expressed higher levels of profibrotic genes, including Lpl, Mmp12, Mmp19, and Spp1 (Figures 5B–D). Cluster 2, termed C5ar1high mo-Macs, was a dominant population on D21 with a uniquely high expression of Ccl7, Pf4, Ccl2, and Arg1 and exhibited a strong ability to regulate leukocyte migration (Figures 5B–D). Meanwhile, the proportion of cluster 3 increased along with BIPF progression, expressing both monocyte markers (Ly6c2), and macrophage markers (F13a1; Figures 5B–D). We also identified a rare population in cluster 4, which expressed higher levels of Isg15, related to anti-virus responses (Figures 5B–D).
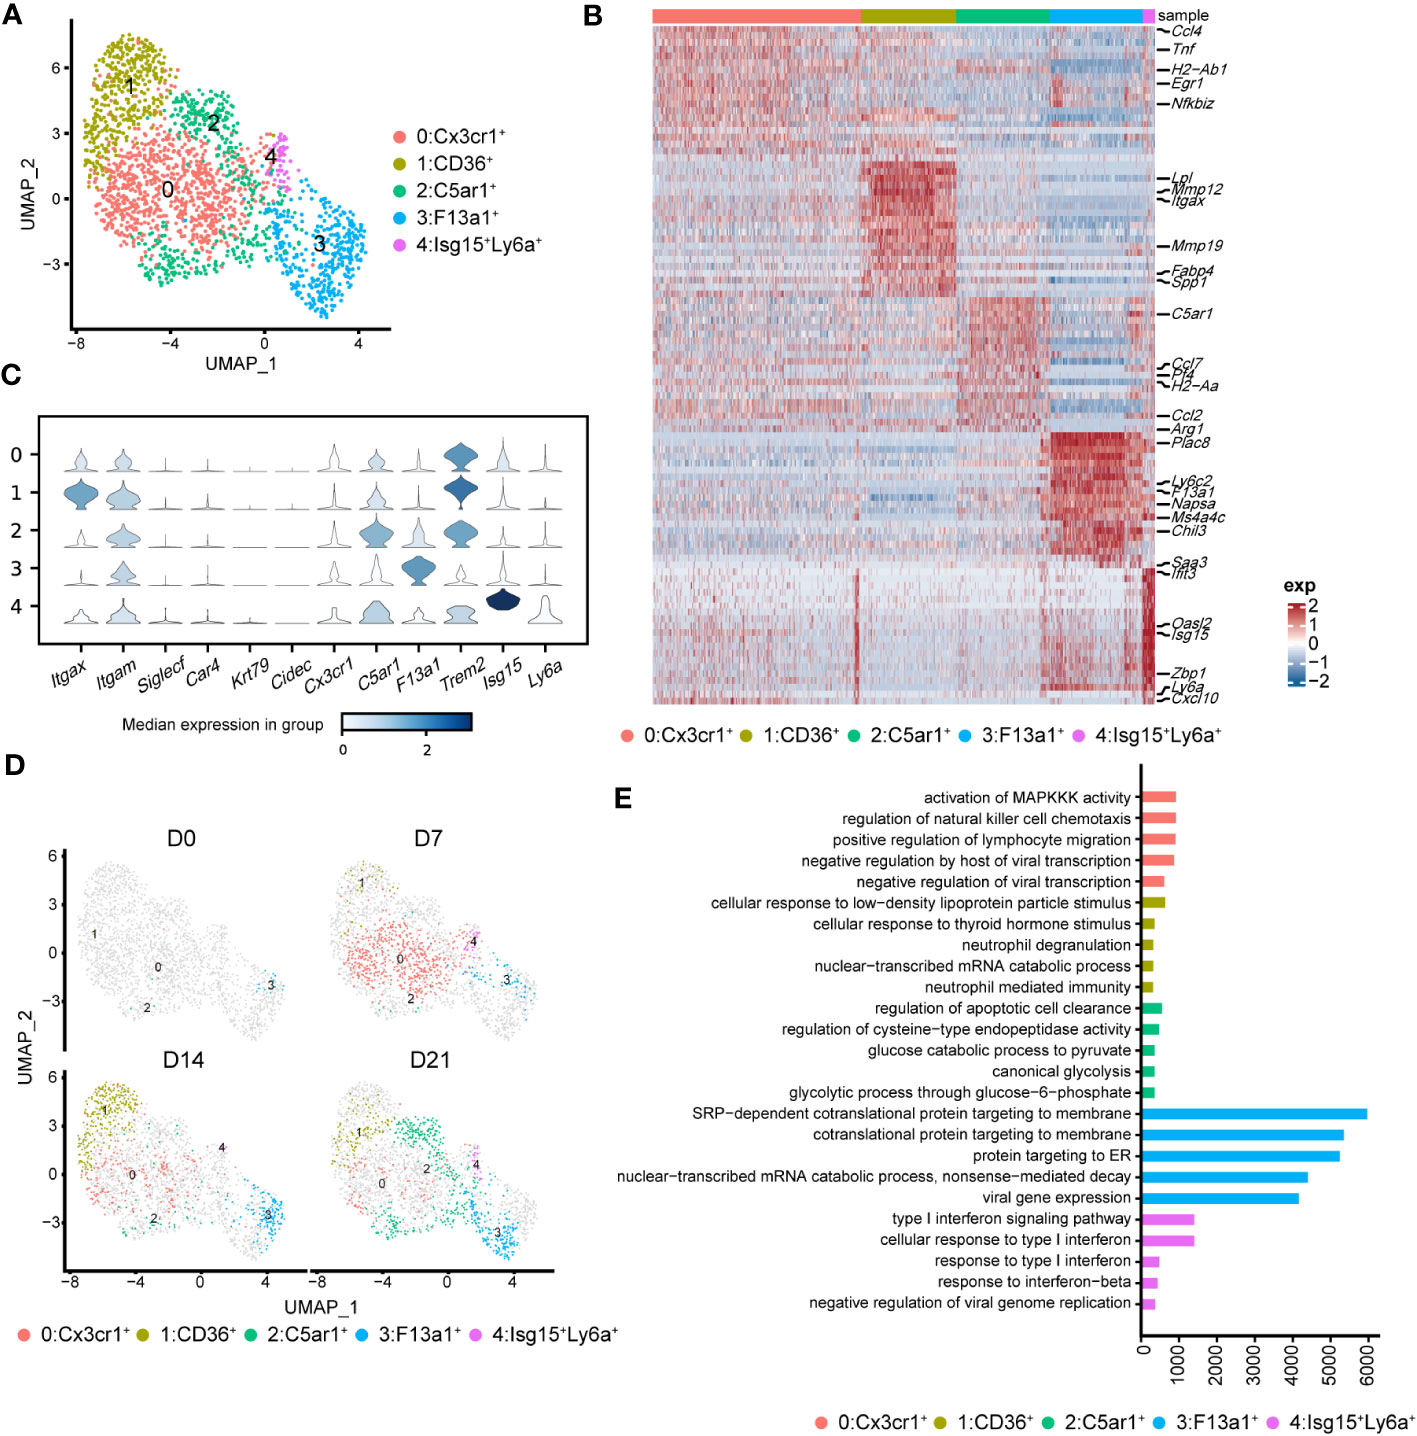
Figure 5 Heterogeneity of monocyte-derived macrophages (mo-Mac) during the progression of pulmonary fibrosis. (A) UMAP plots depicting the subcluster of mo-Mac in lung of bleomycin-induced pulmonary fibrosis. (B) Heatmap of the top 20 highly expressed genes of each cluster of mo-Mac; representative markers genes are labelled. (C) Violin plots comparing the expression level of selected genes in each cluster of alveolar macrophages. (D) UMAP plots deciphering the projection of mo-Mac from different stages of pulmonary fibrosis on a 2D map. (E) Functional enrichment analysis of GO biological processes with the significant marker genes of each cluster of mo-Mac.
We also performed pseudotime inference on mo-Macs. Unlike in AMs, cells from different timepoints could be found at the beginning and end of the trajectory, indicating a lack of obvious correlation among mo-Mac clusters (Supplementary Figure 4B). We also analysed the gene expression profiles and found that proinflammatory genes, such as Ccr2 and Il1b, tended to be expressed in the early phase, while profibrotic genes, such as Spp1 and Arg1, tended to be expressed in the later phase (Supplementary Figure 4C). Functional enrichment analysis of each cluster revealed more diverse roles for mo-Macs; cluster 0 had high levels of Ccl4 and was associated with immune responses, including the regulation of lymphocyte migration (Figure 5E; Supplementary Figure 3C). Meanwhile, cluster 1 expressed higher levels of Il1rn and Lgals3, participating in ‘neutrophil mediated immunity’ (36) and leading to tissue inflammation (Figure 5E; Supplementary Figure 3C). Cluster 2 was significantly correlated with glucose metabolism (Figure 5E). Taken together, these data identified CX3CR1+ mo-Macs (cluster 0) as the major proinflammatory population in the early phase of fibrosis (D7), whereas CD36+ mo-Macs (cluster 1) were the major profibrotic populations in later phases of fibrosis (D14, D21).
3.6 Metabolic features of macrophages change with pulmonary fibrosis progression
Cellular metabolism shapes macrophage phenotype and function (37), we would like to know if the metabolic features of immune cells, especially macrophages, were changed. To investigate the metabolic changes in immune cells during pulmonary fibrosis progression, we analysed the enrichment of metabolic pathways in different immune cells according to a published computational pipeline (18). Most of the 80 metabolic pathways were highly enriched and dynamic in macrophages compared to that in other immune cells (Supplementary Figure 5A). We noticed that biosynthesis of unsaturated fatty acid, fatty acid degradation, alpha-linolenic acid metabolism, and primary bile acid biosynthesis sharply decreased in macrophages during pulmonary fibrosis progression (Figure 6A). In addition, the citric acid cycle (TCA cycle) and glycolysis/gluconeogenesis process in macrophages changed with disease progression, reaching peak activity in the fibrotic phase (D21; Figure 6A). This likely indicates that during fibrosis, the metabolic status of macrophages transforms from lipid metabolism to glucose metabolism, consistent with the results of former study stating that glucose consumption is upregulated in an IPF mouse model (38). In addition, we noticed that arginine synthesis and metabolism were enhanced, which has been shown to correlate with lung fibrosis (39). Further quantification of the changes in metabolic pathways in macrophage subsets found that AMs and mo-Macs showed higher metabolic activity and diversity than did monocytes and IMs (Supplementary Figure 5B). Specifically, when fibrosis occurred, lipid-related-metabolism pathways firstly decreased and were then slightly recovered in AMs, such as fatty acid degradation and biosynthesis of unsaturated fatty acids. While some glucose-related-metabolism pathways increased in mo-Macs, especially for glycolysis/gluconeogenesis but not Oxidative phosphorylation. The activities of other types of metabolism pathway, like alpha-linolenic acid metabolism and primary bile acid biosynthesis were all lower under disease condition, which were primarily found in AMs (Figure 6B).
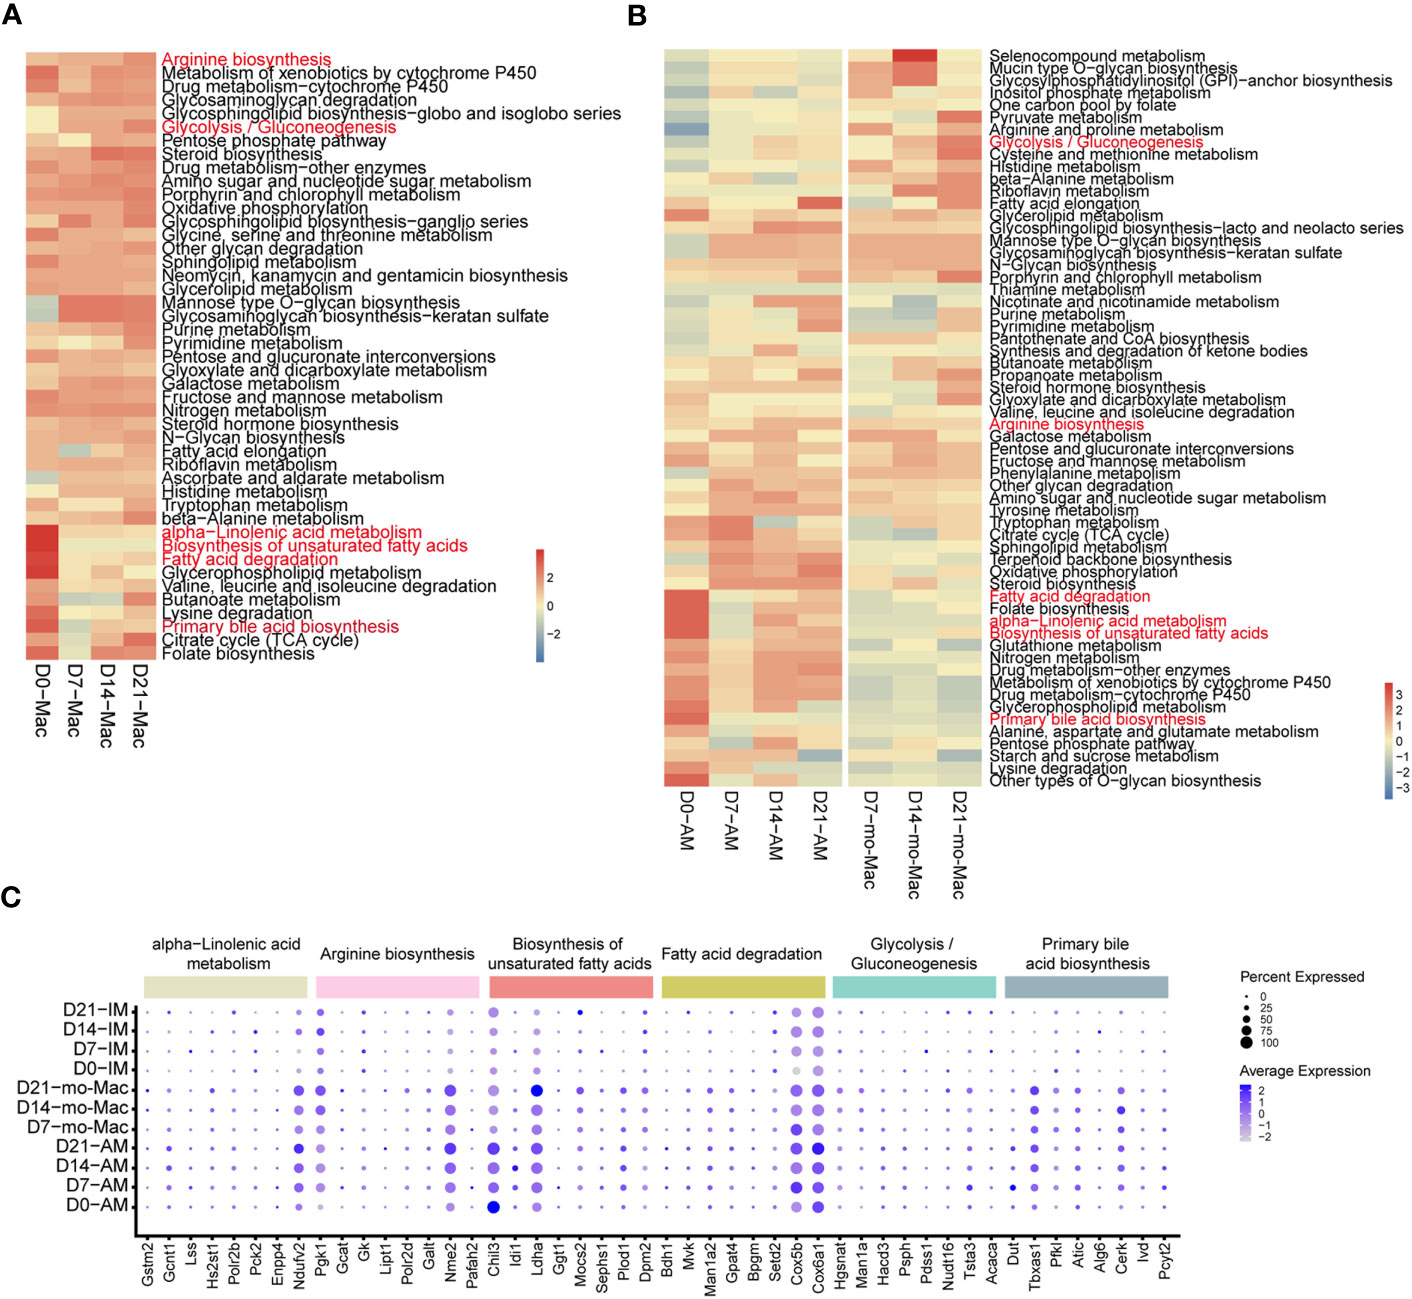
Figure 6 Single-cell RNA-seq analysis reveals specific metabolic signatures of macrophages in the progression of pulmonary fibrosis. (A) Heatmap showing the selected metabolic pathway activity of immune cell types at different stages of pulmonary fibrosis. Red indicates strong metabolic activity. (B) Heatmap showing the selected metabolic activity of the different subclusters of macrophages at different stages of pulmonary fibrosis. (C) Dot plot depicting the percentage of cells expressing the gene and the expression levels of genes in the cells expressing these genes. Genes with most variation level related to specific metabolic pathways were selected.
Since we quantified the metabolic feature by evaluating a series of gene expression profiles, we would like to investigate which gene changes are causing such results. We therefore analysed gene expression changes associated with the metabolic pathways mentioned above by selecting genes with the greatest variation in current metabolic pathway. Consistent with changes in metabolism, we observed decreased expression of genes associated with certain metabolic pathways, such as fatty acid degradation, and increased expression in other pathways, such as glycolysis/gluconeogenesis (Supplementary Figure 5C). Further characterisation of gene expression in macrophage subclusters revealed the different regulatory function of genes on distinct cells. To be specific, the expression of Chil3 related to the biosynthesis of unsaturated fatty acids decreased at D7 in AMs, but gradually increased from D7-D21 in mo-Macs, indicating a strong regulatory ability of Chil3 in macrophage metabolism (Figure 6C). All gene expression changes within clusters of interest are presented in Supplementary Figure 5.
3.7 Macrophage subsets with similar gene expression features occur during pulmonary fibrosis in mice and humans
To further evaluate our findings, we reanalysed published scRNA-seq data from patients with IPF (10). As expected, we identified several known major immune cell lineages: myeloid cells (neutrophils, DCs, and macrophages) and lymphocytes (T and NKT cells, NK cells, and B cells) (Supplementary Figure 6A). These human immune cell subsets exhibited strong similarities in gene expression profiles to those observed in mice (Supplementary Figure 6B).
By re-clustering human macrophages, we identified seven clusters based on their gene expression profiles (Supplementary Figure 6C; Figure 7A). Most lung-resident macrophages, proinflammatory macrophages, CLEC4E-high macrophages, and MT-high macrophages were from lungs of non-fibrosis donors (Figure 7B). These clusters were similar to those of mice on D0 and are likely associated with maintenance of lung homeostasis. Among them, proinflammatory macrophages expressed higher levels of chemokines, indicating an ability to recruit inflammatory cells (40). CLEC4E-high macrophages harboured high expression of CLEC4E, BCL2A1, and MDM2 (Supplementary Figure 6D), which are related to the cellular inflammatory response and inhibition of apoptosis (41). Interestingly, a new cluster expressing high levels of MT-related genes, termed MT-high macrophages, was primarily observed in the lungs of donors and may have anti-apoptotic effects (42); however, their roles in pulmonary fibrosis remain unclear (Supplementary Figure 6D).
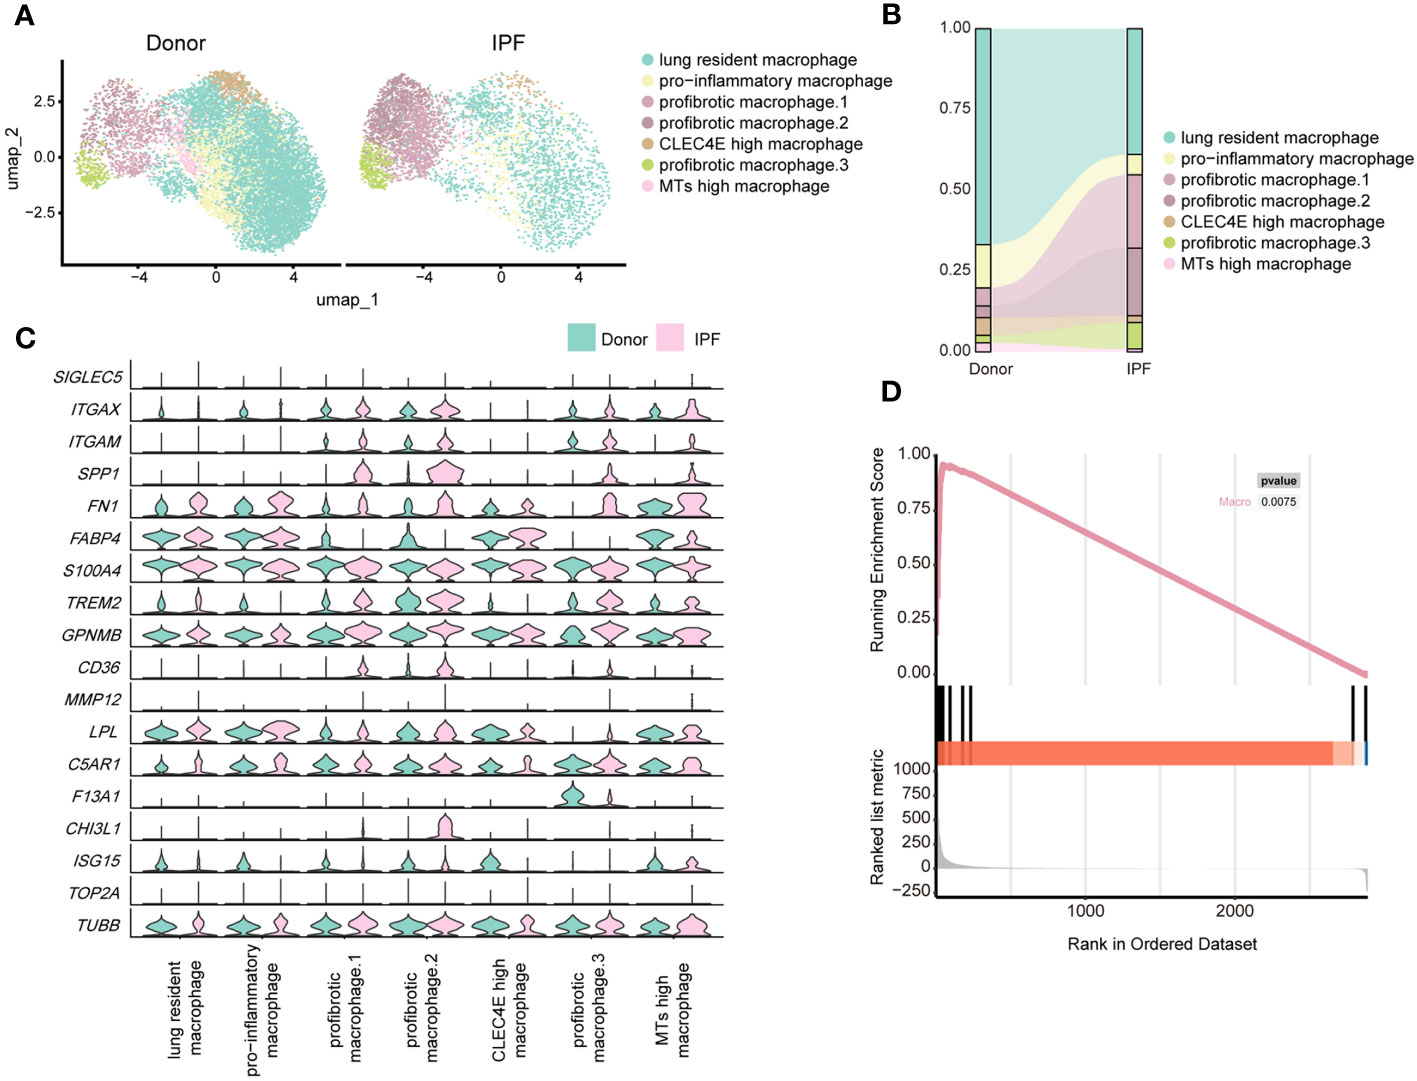
Figure 7 Single-cell RNA-seq analysis reveals similar profibrotic macrophage subclusters between the lungs of bleomycin-induced pulmonary fibrosis mouse models and those of patients with IPF. (A) UMAP plot depicting the subclusters of macrophages in patients with IPF and healthy donors. (B) Distribution of immune cells in normal and fibrotic lungs of mouse and humans. (C) Violin plots comparing the expression level of selected genes in each cluster of human macrophages. (D) Similarity score for comparing macrophages in the fibrotic mouse and patients with IPF.
Three subpopulations of macrophages were significantly increased in fibrotic lungs and shared similar profibrotic gene signatures, including SPP1, TIMP1, FN1, and CCL2 (Figure 7C; Supplementary Figure 6D), which resemble macrophages from the profibrotic and fibrotic phases of our mouse model (D14 and D21). Profibrotic mac.1 expressed high CCL2, indicating a strong ability to recruit monocytes/macrophages and mediate inflammatory response during IPF progression (Supplementary Figure 6D). Profibrotic mac.2 exhibited higher MMP9 and MMP7 expression (Supplementary Figure 6D), and had specific expression of CHI3L1, which are thought to play crucial roles in tissue remodelling (43, 44). In addition, both profibrotic mac.1 and 2 expressed high levels of TGFB1, further suggesting that they might have the characteristics of typical M2 macrophages. And profibrotic mac.2 were more similar to M2c macrophages given their expression of MMP genes (45). Similar to cluster 3 comprising mo-Macs in our mouse study, profibrotic mac.3 expressed high levels of F13A1, as well as MS4A6A, which are expressed by M2 macrophages with a highly active inflammatory response (46) (Figure 7C; Supplementary Figure 6D). Furthermore, we observed upregulated expression of GPNMB in all macrophage subsets and CHI3L1 in profibrotic mac.2, indicating their significant roles in IPF progression. We further analysed the upregulated genes in mouse macrophages and compared them with those in human IPF macrophages. We collected the up-regulated genes in mouse lung macrophages (Gene set A, D21 versus D0), and compared those with the up-regulated genes in human lung macrophages (Gene set B, IPF versus donor) by applying the GSEA. The result reflected that gene set B was enriched in Gene set A (P< 0.01), indicating the expression profiles change of mouse lung macrophages was similar to the expression profiles change of human macrophages (Figure 7D; Supplementary Table 7).
Moreover, in line with the metabolic features of macrophages in the mouse model, the metabolic activities of macrophages in human lungs were more vigorous compared with other immune cells. And more metabolic pathways were found to be up-regulated in macrophages of IPF patients, compared to other immune cells. (Supplementary Figure 7A). High consistency was also observed in the changes of the metabolic status of macrophages between humans and mice, as evidenced by similarly enhanced TCA cycle and glycolysis/gluconeogenesis activity and decreased alpha-linolenic acid metabolism (Supplementary Figure 7A). Analysis of macrophage subpopulations suggested these changes were attributed to profibrotic mac.2. (Supplementary Figure 7B). This finding suggests that similar metabolic alterations in lung macrophage subpopulations also exist in IPF patients, although this remains to be confirmed experimentally.
4 Discussion
IPF is a typically progressive interstitial lung disease with limited therapeutic strategies (47). Recently, new insights into the role of macrophages have highlighted their potential as anti-inflammatory therapeutic targets for IPF (48). However, it is crucial to understand how the immune microenvironment, especially macrophages, in the lungs changes with disease progression and to define optimal intervention timing and targets. In this study, we applied single-cell RNA-seq analysis to a BIPF mouse model to portray the immune cell landscape in the lungs at different stages of pulmonary fibrosis progression. Our analysis revealed distinct components of immune cells associated with different stages of pulmonary fibrosis progression. In particular, macrophages were the primary immune cells that exhibited close communication with other immune cells during disease progression. Moreover, Gpnmb and Trem2 upregulation in macrophages was found to potentially have important roles in the progression of pulmonary fibrosis. Meanwhile, changes in specific metabolic pathways of AMs and mo-Macs were also identified with disease progression. In line with the published data related to human IPF, macrophages in our mouse model shared similar gene expression features and metabolic features with the macrophages in lungs of patients with IPF. Hence, our scRNA-seq analysis of immune cells from the lungs during the different phases of pulmonary fibrosis provides a comprehensive dataset for better understanding the functions of immune cells in the disease process (http://dynamic-ipf.hupo.org.cn/). Indeed, the data generated in this study can be broadly adapted for biomedical and clinical research.
Macrophages are the primary profibrotic immune cells associated with pulmonary fibrosis (4). Moreover, they have been shown to direct the migration and function of other immune cells in different disease settings by producing various cytokines or chemokines (6). Ligand–receptor pair enrichment is an efficient means to analyse the interactions between immune cells during pulmonary fibrosis progression (49, 50). In this study, we showed that the frequencies of macrophage-related interactions were consistently highest and most dynamic during IPF progression, highlighting macrophages as the main component in the immune microenvironment. Further analysis of ligand–receptor pairs revealed that the kernel interaction types were FN1- and SPP1-linked profibrotic adhesion. Recently, the SPP1 and CD44 axes have been characterised for fibroblasts (51). Our results not only suggest this interaction in macrophages of fibrotic lungs but also extend to include FN1 and ITGAV/ITGB1. Our analysis also showed that T cells regulate macrophages through the CCL5-CCR5/CCR1 axis; although this axis is thought to play a significant role, it has not been thoroughly investigated (25). In summary, our results provide a more complete view of the interaction network in the IPF immune microenvironment, and suggest that blocking the interaction between macrophages and other cells may be a novel strategy for IPF treatment.
By examining macrophage subsets, we found that AM and mo-Mac made up the largest proportions and exhibited the greatest level of change during IPF. Further re-clustering results revealed changes other than expression profiles in these subpopulations. AMs were dominant in the healthy state, residing primarily in the lung and expressing metabolism-related genes such as Ear1 and Fabp1. After bleomycin infusion, the steady state AMs quickly disappeared and were replaced by proinflammatory and profibrotic AMs. Specifically, we identified an AM population with potential profibrotic function and Fabp5 and Gpnmb expression; targeting this population may help to provide therapeutic effect for pulmonary fibrosis. It is worth noting that, the AMs included two distinct subsets showed in Figure 3B. Through further expression profile analysis at different stage showed in Supplementary Figure 2A, we discovered that these two groups correspond to AM clusters 1,4,5 and 0,2,3, respectively. Conversely, mo-Macs were rarely detected in a healthy state and are more related to inflammation. They were observed to infiltrate the lung from D7 and express proinflammatory genes, while later expressing profibrotic genes. Although our results indicate that there are sporadic mo-Macs at D0, mo-Macs is generally considered non-existent at this time, which may be due to the inherent defects during sample preparation, and was left unexplored in the following analysis. Our gene expression profile analysis also revealed IM heterogeneity in healthy and diseased states, consistent with previous research that IM might have a distinct role in both healthy and diseased states, although their population is small (52).
By applying pseudotime analysis, our results suggest a differentiation trajectory in which the lung-resident AMs had the potential to differentiate into proinflammatory and profibrotic AM populations. Some studies indicate that monocytes are the source of AMs in inflammatory conditions (53, 54), and termed those AMs as mo-AMs (monocytes-derived AMs) to distinguish them from TR-AMs (tissue-resident AMs). Their data also showed that TR-AMs composed of large number of total AMs at late fibrosis, which might come from TR-AMs at steady state and consistent with our results. Our data supported that TR-AMs have self-renewal and differentiation properties during fibrosis progression, and these two ideas are not disparate and serve to support each other. This result provides further understanding of the source of proinflammatory and pro-fibrotic AMs during pulmonary fibrosis, which is crucial in exploring the mechanism of IPF. By contrast, we observed no clear internal differentiation pathway among mo-Mac clusters as they were primarily derived from circulating monocytes.
Assessing metabolic changes has attracted considerable research attention owing to their role in the pathogenesis of fibrosis in many organs (14, 55). Cellular metabolism is believed to play a vital role in shaping macrophage phenotype and function (37). Our study provides the first comprehensive description of the metabolic profile of different immune cells during pulmonary fibrosis. In general, more metabolic pathways were enhanced in macrophages of IPF patients, compared to other immune cells, further demonstrating the relationship between macrophage metabolism and pulmonary fibrosis progression. In particular, our results suggest a shift from lipid-related-metabolism to glucose-related-metabolism in macrophages during fibrosis. Since fatty acid metabolism is considered to be closely related to fibrosis (56), our findings support the perspective (57) that metabolic reprogramming, especially in macrophages, represents a potential novel therapeutic approach for IPF. We further confirmed that metabolic changes in macrophages were primarily attributed to AMs and mo-Macs and predicted Chil3 as a potential key regulatory gene. Meanwhile, certain genes, such as Cox5b and Cox6a1 appeared in different pathways, potentially because they are involved in the mitochondrial respiratory chain and participate in different metabolic pathways.
To relate our findings more closely to the treatment of human IPF, we analysed a published database to compare any similarities between macrophage populations in humans and mice (10). The clustering results differed slightly from previous articles, which may be because we refined the clustering methods to further eliminate the batch effect across different samples. We identified three profibrotic macrophage clusters that expressed similar profibrotic related gene signatures, including SPP1, FN1, CHI3L1, MMP9, MMP7, and CCL2. High expression of CD14 in these populations supports the theory that they originated from monocytes during IPF progression (58). Many similarities were observed between the clustering results for macrophages in humans and mice. For instance, we identified profibrotic mac.2 with high CHI3L1 expression in IPF patients, similar to that seen in mo-Macs in mice at D14 and D21. We also identified the F13a1-high cluster in mouse and human macrophages, as well as similarities among upregulated genes, such as TREM2 and GPNMB. In recent years, these two genes have received considerable research attention for their activity in tumours and Alzheimer’s disease. Our results suggest that they may also have a significant role in lung inflammation and fibrosis. In addition, we identified activity changes in alpha-linolenic acid metabolism and primary bile acid biosynthesis in human macrophages, which were also found in mice macrophages during fibrosis.
The past single-cell sequencing analysis for pulmonary fibrosis mainly focused on the changes of parenchymal cell function (59–61), while we focused more on immune cells, especially the subclusters of macrophages. We classified the macrophage subpopulation in a more detailed and scientific manner, provided a more comprehensive and in-depth transcriptome map, and suggested some regulatory genes that may be related to the fibrosis progression. However, there were certain limitations noted in this study. Due to the lack of IPF survival data, we were not able to further evaluate the mentioned genes and metabolic pathways for application in preclinical study use. Hence, studies using mouse models are required to determine their therapeutic potential on IPF.
In summary, this study used single-cell RNA-seq analysis to reveal comprehensive information on the dynamic changes of immune cells, particularly macrophages, during the progression of pulmonary fibrosis. To the best of our knowledge, this is the first study presenting such findings. Similarities in the changes of macrophages in human IPF were also observed. Collectively, this study provides new insights into the pathogenic mechanisms of IPF, which are crucial for identifying potential therapeutic targets and designing novel treatments for IPF.
Data availability statement
The datasets for this study are publicly accessible at https://ngdc.cncb.ac.cn/gsa with the identifier CRA011039. The code necessary to perform analysis and generate figures can be obtained from https://github.com/pluto-the-lost/IPF_immune_progression.
Ethics statement
The animal study was approved by The Institutional Animal Care and Use Committee of Tsinghua University. The study was conducted in accordance with the local legislation and institutional requirements.
Author contributions
JL, HG, JM, JCL conducted experiments, analysed data, and wrote the manuscript. YT conducted experiments. CY, ML, YZ, ZL analysed data. LW, JZ, YPZ, XZ conceptualised the project, designed the research, supervised experiments and data analysis, and wrote the manuscript. All authors contributed to the article and approved the submitted version.
Funding
This research was supported by the Ministry of Science and Technology of China (grant numbers 2019YFA0508502 to LW and 2021YFA1301603 to YPZ); the National Natural Science Foundation of China (grant numbers 31991174 to LW, 81971476 to JZ, 61721003 and 62250005 to XZ); and the Tsinghua-Peking Centre for Life Sciences (to LW).
Conflict of interest
YZ and ZL were employed by Annoroad Gene Technology Beijing Co., Ltd.
The remaining authors declare that the research was conducted in the absence of any commercial or financial relationships that could be construed as a potential conflict of interest.
Publisher’s note
All claims expressed in this article are solely those of the authors and do not necessarily represent those of their affiliated organizations, or those of the publisher, the editors and the reviewers. Any product that may be evaluated in this article, or claim that may be made by its manufacturer, is not guaranteed or endorsed by the publisher.
Supplementary material
The Supplementary Material for this article can be found online at: https://www.frontiersin.org/articles/10.3389/fimmu.2023.1230266/full#supplementary-material
References
1. Lederer DJ, Martinez FJ. Idiopathic pulmonary fibrosis. New Engl J Med (2018) 378(19):1811–23. doi: 10.1056/NEJMra1705751
2. Spagnolo P, Maher TM. Clinical trial research in focus: why do so many clinical trials fail in IPF? Lancet Respir Med (2017) 5(5):372–4. doi: 10.1016/S2213-2600(17)30122-4
3. Spagnolo P, Kropski JA, Jones MG, Lee JS, Rossi G, Karampitsakos T, et al. Idiopathic pulmonary fibrosis: Disease mechanisms and drug development. Pharmacol Ther (2021) 222:107798. doi: 10.1016/j.pharmthera.2020.107798
4. Wynn TA, Vannella KM. Macrophages in tissue repair, regeneration, and fibrosis. Immunity (2016) 44(3):450–62. doi: 10.1016/j.immuni.2016.02.015
5. Lech M, Anders HJ. Macrophages and fibrosis: How resident and infiltrating mononuclear phagocytes orchestrate all phases of tissue injury and repair. Biochim Biophys Acta (2013) 1832(7):989–97. doi: 10.1016/j.bbadis.2012.12.001
6. Murray PJ, Wynn TA. Protective and pathogenic functions of macrophage subsets. Nat Rev Immunol (2011) 11(11):723–37. doi: 10.1038/nri3073
7. Sica A, Mantovani A. Macrophage plasticity and polarization: in vivo veritas. J Clin Invest (2012) 122(3):787–95. doi: 10.1172/JCI59643
8. Murray LA, Chen Q, Kramer MS, Hesson DP, Argentieri RL, Peng X, et al. TGF-beta driven lung fibrosis is macrophage dependent and blocked by Serum amyloid P. Int J Biochem Cell Biol (2011) 43(1):154–62. doi: 10.1016/j.biocel.2010.10.013
9. Kim KK, Sisson TH, Horowitz JC. Fibroblast growth factors and pulmonary fibrosis: it's more complex than it sounds. J pathol (2017) 241(1):6–9. doi: 10.1002/path.4825
10. Reyfman PA, Walter JM, Joshi N, Anekalla KR, McQuattie-Pimentel AC, Chiu S, et al. Single-cell transcriptomic analysis of human lung provides insights into the pathobiology of pulmonary fibrosis. Am J Respir Crit Care Med (2019) 199(12):1517–36. doi: 10.1164/rccm.201712-2410OC
11. Kang YP, Lee SB, Lee JM, Kim HM, Hong JY, Lee WJ, et al. Metabolic profiling regarding pathogenesis of idiopathic pulmonary fibrosis. J Proteome Res (2016) 15(5):1717–24. doi: 10.1021/acs.jproteome.6b00156
12. Kottmann RM, Kulkarni AA, Smolnycki KA, Lyda E, Dahanayake T, Salibi R, et al. Lactic acid is elevated in idiopathic pulmonary fibrosis and induces myofibroblast differentiation via pH-dependent activation of transforming growth factor-β. Am J Respir Crit Care Med (2012) 186(8):740–51. doi: 10.1164/rccm.201201-0084OC
13. Zhao YD, Yin L, Archer S, Lu C, Zhao G, Yao Y, et al. Metabolic heterogeneity of idiopathic pulmonary fibrosis: a metabolomic study. BMJ Open Respir Res (2017) 4(1):e000183. doi: 10.1136/bmjresp-2017-000183
14. Zhao X, Kwan JYY, Yip K, Liu PP, Liu FF. Targeting metabolic dysregulation for fibrosis therapy. Nat Rev Drug discovery (2020) 19(1):57–75. doi: 10.1038/s41573-019-0040-5
15. Lara-Reyna S, Scambler T, Holbrook J, Wong C, Jarosz-Griffiths HH, Martinon F, et al. Metabolic reprograming of cystic fibrosis macrophages via the IRE1α Arm of the unfolded protein response results in exacerbated inflammation. Front Immunol (2019) 10:1789. doi: 10.3389/fimmu.2019.01789
16. Aridgides DS, Mellinger DL, Armstrong DA, Hazlett HF, Dessaint JA, Hampton TH, et al. Functional and metabolic impairment in cigarette smoke-exposed macrophages is tied to oxidative stress. Sci Rep (2019) 9(1):9624. doi: 10.1038/s41598-019-46045-7
17. Wang Y, Wang R, Zhang S, Song S, Jiang C, Han G, et al. iTALK: an R package to characterize and illustrate intercellular communication. bioRxiv (2019), 507871. doi: 10.1101/507871
18. Xiao Z, Dai Z, Locasale JW. Metabolic landscape of the tumor microenvironment at single cell resolution. Nat Commun (2019) 10(1):3763. doi: 10.1038/s41467-019-11738-0
19. Subramanian A, Tamayo P, Mootha VK, Mukherjee S, Ebert BL, Gillette MA, et al. Gene set enrichment analysis: a knowledge-based approach for interpreting genome-wide expression profiles. Proc Natl Acad Sci U S A (2005) 102(43):15545–50. doi: 10.1073/pnas.0506580102
20. Yu G, Wang LG, Yan GR, He QY. DOSE: an R/Bioconductor package for disease ontology semantic and enrichment analysis. Bioinf (Oxford England) (2015) 31(4):608–9. doi: 10.1093/bioinformatics/btu684
21. Armingol E, Officer A, Harismendy O, Lewis NE. Deciphering cell-cell interactions and communication from gene expression. Nat Rev Genet (2021) 22(2):71–88. doi: 10.1038/s41576-020-00292-x
22. Li Y, Jiang D, Liang J, Meltzer EB, Gray A, Miura R, et al. Severe lung fibrosis requires an invasive fibroblast phenotype regulated by hyaluronan and CD44. J Exp Med (2011) 208(7):1459–71. doi: 10.1084/jem.20102510
23. Frank JW, Seo H, Burghardt RC, Bayless KJ, Johnson GA. ITGAV (alpha v integrins) bind SPP1 (osteopontin) to support trophoblast cell adhesion. Reprod (Cambridge England) (2017) 153(5):695–706. doi: 10.1530/REP-17-0043
24. Capelli A, Di Stefano A, Gnemmi I, Donner CF. CCR5 expression and CC chemokine levels in idiopathic pulmonary fibrosis. Eur Respir J (2005) 25(4):701–7. doi: 10.1183/09031936.05.00082604
25. Ishida Y, Kimura A, Kondo T, Hayashi T, Ueno M, Takakura N, et al. Essential roles of the CC chemokine ligand 3-CC chemokine receptor 5 axis in bleomycin-induced pulmonary fibrosis through regulation of macrophage and fibrocyte infiltration. Am J pathol (2007) 170(3):843–54. doi: 10.2353/ajpath.2007.051213
26. Allard B, Panariti A, Martin JG. Alveolar macrophages in the resolution of inflammation, tissue repair, and tolerance to infection. Front Immunol (2018) 9:1777. doi: 10.3389/fimmu.2018.01777
27. Strobel B, Klein H, Leparc G, Stierstorfer BE, Gantner F, Kreuz S. Time and phenotype-dependent transcriptome analysis in AAV-TGFβ1 and Bleomycin-induced lung fibrosis models. Sci Rep (2022) 12(1):12190. doi: 10.1038/s41598-022-16344-7
28. Zhang GL, Zou YF, Feng XL, Shi HJ, Du XF, Shao MH, et al. Association of the NFKBIA gene polymorphisms with susceptibility to autoimmune and inflammatory diseases: a meta-analysis. Inflammation Res (2011) 60(1):11–8. doi: 10.1007/s00011-010-0216-2
29. Na YR, Jung D, Stakenborg M, Jang H, Gu GJ, Jeong MR, et al. Prostaglandin E(2) receptor PTGER4-expressing macrophages promote intestinal epithelial barrier regeneration upon inflammation. Gut (2021) 70(12):2249–60. doi: 10.1136/gutjnl-2020-322146
30. Griffith JW, Sokol CL, Luster AD. Chemokines and chemokine receptors: positioning cells for host defense and immunity. Annu Rev Immunol (2014) 32:659–702. doi: 10.1146/annurev-immunol-032713-120145
31. Meziani L, Mondini M, Petit B, Boissonnas A, Thomas de Montpreville V, Mercier O, et al. CSF1R inhibition prevents radiation pulmonary fibrosis by depletion of interstitial macrophages. Eur Respir J (2018) 51(3):1702120. doi: 10.1183/13993003.02120-2017
32. Shi T, Denney L, An H, Ho LP, Zheng Y. Alveolar and lung interstitial macrophages: Definitions, functions, and roles in lung fibrosis. J leukoc Biol (2021) 110(1):107–14. doi: 10.1002/JLB.3RU0720-418R
33. Chen L, Chou CL, Knepper MA. Targeted single-cell RNA-seq identifies minority cell types of kidney distal nephron. J Am Soc Nephrol JASN (2021) 32(4):886–96. doi: 10.1681/ASN.2020101407
34. Perng YC, Lenschow DJ. ISG15 in antiviral immunity and beyond. Nat Rev Microbiol (2018) 16(7):423–39. doi: 10.1038/s41579-018-0020-5
35. Veniaminova NA, Vagnozzi AN, Kopinke D, Do TT, Murtaugh LC, Maillard I, et al. Keratin 79 identifies a novel population of migratory epithelial cells that initiates hair canal morphogenesis and regeneration. Dev (Cambridge England) (2013) 140(24):4870–80. doi: 10.1242/dev.101725
36. Bhaumik P, St-Pierre G, Milot V, St-Pierre C, Sato S. Galectin-3 facilitates neutrophil recruitment as an innate immune response to a parasitic protozoa cutaneous infection. J Immunol (Baltimore Md 1950) (2013) 190(2):630–40. doi: 10.4049/jimmunol.1103197
37. Biswas SK, Mantovani A. Orchestration of metabolism by macrophages. Cell Metab (2012) 15(4):432–7. doi: 10.1016/j.cmet.2011.11.013
38. Xie N, Tan Z, Banerjee S, Cui H, Ge J, Liu RM, et al. Glycolytic reprogramming in myofibroblast differentiation and lung fibrosis. Am J Respir Crit Care Med (2015) 192(12):1462–74. doi: 10.1164/rccm.201504-0780OC
39. Endo M, Oyadomari S, Terasaki Y, Takeya M, Suga M, Mori M, et al. Induction of arginase I and II in bleomycin-induced fibrosis of mouse lung. Am J Physiol Lung Cell Mol Physiol (2003) 285(2):L313–21. doi: 10.1152/ajplung.00434.2002
40. De Filippo K, Dudeck A, Hasenberg M, Nye E, van Rooijen N, Hartmann K, et al. Mast cell and macrophage chemokines CXCL1/CXCL2 control the early stage of neutrophil recruitment during tissue inflammation. Blood (2013) 121(24):4930–7. doi: 10.1182/blood-2013-02-486217
41. Vogler M. BCL2A1: the underdog in the BCL2 family. Cell Death differentiation (2012) 19(1):67–74. doi: 10.1038/cdd.2011.158
42. Si M, Lang J. The roles of metallothioneins in carcinogenesis. J Hematol Oncol (2018) 11(1):107. doi: 10.1186/s13045-018-0645-x
43. Zhao T, Su Z, Li Y, Zhang X, You Q. Chitinase-3 like-protein-1 function and its role in diseases. Signal Transduct Target Ther (2020) 5(1):201. doi: 10.1038/s41392-020-00303-7
44. Craig VJ, Zhang L, Hagood JS, Owen CA. Matrix metalloproteinases as therapeutic targets for idiopathic pulmonary fibrosis. Am J Respir Cell Mol Biol (2015) 53(5):585–600. doi: 10.1165/rcmb.2015-0020TR
45. Shapouri-Moghaddam A, Mohammadian S, Vazini H, Taghadosi M, Esmaeili SA, Mardani F, et al. Macrophage plasticity, polarization, and function in health and disease. J Cell Physiol (2018) 233(9):6425–40. doi: 10.1002/jcp.26429
46. Wang J, Zhang L, Luo L, He P, Xiong A, Jiang M, et al. Characterizing cellular heterogeneity in fibrotic hypersensitivity pneumonitis by single-cell transcriptional analysis. Cell Death discovery (2022) 8(1):38. doi: 10.1038/s41420-022-00831-x
47. Richeldi L, Collard HR, Jones MG. Idiopathic pulmonary fibrosis. Lancet (London England) (2017) 389(10082):1941–52. doi: 10.1016/S0140-6736(17)30866-8
48. Heukels P, Moor CC, von der Thüsen JH, Wijsenbeek MS, Kool M. Inflammation and immunity in IPF pathogenesis and treatment. Respir Med (2019) 147:79–91. doi: 10.1016/j.rmed.2018.12.015
49. Joost S, Jacob T, Sun X, Annusver K, La Manno G, Sur I, et al. Single-cell transcriptomics of traced epidermal and hair follicle stem cells reveals rapid adaptations during wound healing. Cell Rep (2018) 25(3):585–97.e7. doi: 10.1016/j.celrep.2018.09.059
50. Boisset JC, Vivié J, Grün D, Muraro MJ, Lyubimova A, van Oudenaarden A. Mapping the physical network of cellular interactions. Nat Methods (2018) 15(7):547–53. doi: 10.1038/s41592-018-0009-z
51. Misra S, Hascall VC, Markwald RR, Ghatak S. Interactions between hyaluronan and its receptors (CD44, RHAMM) regulate the activities of inflammation and cancer. Front Immunol (2015) 6:201. doi: 10.3389/fimmu.2015.00201
52. Chakarov S, Lim HY, Tan L, Lim SY, See P, Lum J, et al. Two distinct interstitial macrophage populations coexist across tissues in specific subtissular niches. Sci (New York NY) (2019) 363(6432). doi: 10.1126/science.aau0964
53. Woo YD, Jeong D, Chung DH. Development and functions of alveolar macrophages. Mol Cells (2021) 44(5):292–300. doi: 10.14348/molcells.2021.0058
54. Misharin AV, Morales-Nebreda L, Reyfman PA, Cuda CM, Walter JM, McQuattie-Pimentel AC, et al. Monocyte-derived alveolar macrophages drive lung fibrosis and persist in the lung over the life span. J Exp Med (2017) 214(8):2387–404. doi: 10.1084/jem.20162152
55. Suryadevara V, Ramchandran R, Kamp DW, Natarajan V. Lipid mediators regulate pulmonary fibrosis: potential mechanisms and signaling pathways. Int J Mol Sci (2020) 21(12):4257. doi: 10.3390/ijms21124257
56. Kang HM, Ahn SH, Choi P, Ko YA, Han SH, Chinga F, et al. Defective fatty acid oxidation in renal tubular epithelial cells has a key role in kidney fibrosis development. Nat Med (2015) 21(1):37–46. doi: 10.1038/nm.3762
57. Gaugg MT, Engler A, Bregy L, Nussbaumer-Ochsner Y, Eiffert L, Bruderer T, et al. Molecular breath analysis supports altered amino acid metabolism in idiopathic pulmonary fibrosis. Respirol (Carlton Vic) (2019) 24(5):437–44. doi: 10.1111/resp.13465
58. Ohishi K, Varnum-Finney B, Serda RE, Anasetti C, Bernstein ID. The Notch ligand, Delta-1, inhibits the differentiation of monocytes into macrophages but permits their differentiation into dendritic cells. Blood (2001) 98(5):1402–7. doi: 10.1182/blood.V98.5.1402
59. Strunz M, Simon LM, Ansari M, Kathiriya JJ, Angelidis I, Mayr CH, et al. Alveolar regeneration through a Krt8+ transitional stem cell state that persists in human lung fibrosis. Nat Commun (2020) 11(1):3559. doi: 10.1038/s41467-020-17358-3
60. Peyser R, MacDonnell S, Gao Y, Cheng L, Kim Y, Kaplan T, et al. Defining the activated fibroblast population in lung fibrosis using single-cell sequencing. Am J Respir Cell Mol Biol (2019) 61(1):74–85. doi: 10.1165/rcmb.2018-0313OC
Keywords: macrophages, single-cell RNA sequencing, pulmonary fibrosis, dynamic atlas, pathogenesis
Citation: Lv J, Gao H, Ma J, Liu J, Tian Y, Yang C, Li M, Zhao Y, Li Z, Zhang X, Zhu Y, Zhang J and Wu L (2023) Dynamic atlas of immune cells reveals multiple functional features of macrophages associated with progression of pulmonary fibrosis. Front. Immunol. 14:1230266. doi: 10.3389/fimmu.2023.1230266
Received: 28 May 2023; Accepted: 24 August 2023;
Published: 13 September 2023.
Edited by:
Chun Geun Lee, Brown University, United StatesReviewed by:
Jarrod Wesley Barnes, University of Alabama at Birmingham, United StatesHye-Ryun Kang, Seoul National University Hospital, Republic of Korea
Copyright © 2023 Lv, Gao, Ma, Liu, Tian, Yang, Li, Zhao, Li, Zhang, Zhu, Zhang and Wu. This is an open-access article distributed under the terms of the Creative Commons Attribution License (CC BY). The use, distribution or reproduction in other forums is permitted, provided the original author(s) and the copyright owner(s) are credited and that the original publication in this journal is cited, in accordance with accepted academic practice. No use, distribution or reproduction is permitted which does not comply with these terms.
*Correspondence: Li Wu, d3VsaUB0c2luZ2h1YS5lZHUuY24=; Jianhong Zhang, emhhbmdqaWFuaG9uZ0B0c2luZ2h1YS5lZHUuY24=; Yunping Zhu, emh1eXVucGluZ0BuY3BzYi5vcmcuY24=; Xuegong Zhang, emhhbmd4Z0B0c2luZ2h1YS5lZHUuY24=
†These authors have contributed equally to this work