 Hortensia Álvarez1,2*
 Alicia Gutiérrez-Valencia3
 Ana Mariño1
 Abraham Saborido-Alconchel3
 Beatriz Calderón-Cruz4
 Alexandre Pérez-González4Jacobo Alonso-Domínguez4Inés Martínez-Barros4María Gallego-Rodríguez4
 Santiago Moreno5Teresa Aldamiz6
 Marta Montero-Alonso7Enrique Bernal8Carlos Galera9Josep M. Llibre10†
 Eva Poveda4† on behalf of the CoRIS Study Group
- 1Infectious Diseases Unit, Department of Internal Medicine, Complexo Hospitalario Universitario de Ferrol, Servicio Galego de Saúde (SERGAS)-A Coruña, A Coruña, Spain
- 2Department of Biochemistry, Genetics and Immunology, Universidade de Vigo, Vigo, Spain
- 3Clinical Unit of Infectious Diseases and Microbiology, Institute of Biomedicine of Seville (IBiS), Virgen del Rocío University Hospital, Spanish National Research Council (CSIC), University of Seville, Seville, Spain
- 4Galicia Sur Health Research Institute (IIS Galicia Sur)-Complexo Hospitalario Universitario de Vigo, Servicio Galego de Saúde-Universidade de Vigo (SERGAS-U, Vigo), Vigo, Spain
- 5Infectious Diseases Department, Hospital Universitario Ramón y Cajal, Madrid, Spain
- 6Infectious Diseases Unit, Hospital General Universitario Gregorio Marañón, Madrid, Spain
- 7Infectious Diseases Unit, Hospital Universitario y Politécnico La Fe, Valencia, Spain
- 8Infectious Diseases Unit, Hospital General Universitario Reina Sofía, Murcia, Spain
- 9Internal Medicine Department, Hospital Universitario Virgen de la Arrixaca, Murcia, Spain
- 10Infectious Diseases Division and Fight Infections Foundation, University Hospital Germans Trias i Pujol, Badalona, Barcelona, Spain
Background: Interferon-inducible protein-10 (IP-10) and monokine induced by interferon-gamma (MIG) are chemokines recognized as inflammatory biomarkers during HIV-1 infection. We assessed their early and long-term dynamics after initiation of antiretroviral treatment (ART).
Methods: Persons with HIV-1 (PWH) aged>18 years starting their first ART in 2015-2021 in a prospective cohort (n=73) were included. IP-10 and MIG plasma levels were quantified using a multiplexed bead-based assay.
Results: IP-10 and MIG plasma levels showed a significant and consistent reduction following ART (80% integrase inhibitor [INSTI]-based) initiation, starting at day 20 and maintained throughout the study period (48 months), paralleling the HIV-1 RNA decay and CD4+ count recovery (p<0·001). At baseline, PWH≥ 50 years, CDC stage C and CD4+ count<350cells/mm3 had higher levels of IP-10 (p=0·022, p=0·001 and p=0·002, respectively) and MIG (p<0·001, p=0·024 and p=0·069, respectively). All of them matched their counterparts several months following ART initiation. MIG levels showed a greater decrease at day 10 in those treated with INSTI (p=0·038). Low-level HIV-1 viremia did not impact MIG or IP-10 levels.
Conclusion: Plasma IP-10 and MIG showed an early significant decline following ART initiation, with greater early declines in MIG levels in INSTI-based regimens. These findings suggest a strong impact of HIV-1 viremia on IP-10 and MIG levels.
Introduction
Chronic immune activation underlies multiple pathways along the course of HIV-1 infection, and a persistent inflammatory state is considered a driver of morbidity (cardiovascular, neurocognitive, and pulmonary diseases, neoplasia, genomic instability, immunosenescence, and premature aging) and mortality (1, 2). Interferon-inducible protein-10 (IP-10), also known as C-X-C motif chemokine ligand (CXCL)-10, and monokine induced by interferon-gamma (MIG), also known as CXCL-9, are pro-inflammatory chemokines originated from circulating myeloid cells (mainly monocytes and dendritic cells) and lymphoid organs (largely from the small intestine) in response to interferon. Both cytokines are ligands for the C-X-C chemokine receptor (CXCR)3, which is highly expressed on memory CD4+ T cells, a major cell target for HIV-1 (3). In addition, IP-10 can recruit susceptible T cells to lymph nodes, contributing to immune activation and dysfunction as well as helping to establish viral reservoirs (4–6). These chemokines have been previously explored in persons with HIV-1 (PWH) both in early and chronic infection (4–15). IP-10 and MIG are upregulated early after primary HIV-1 infection. IP-10 begins to increase on approximately day 6 after the first positive viral load assessment, which is a more rapid response than that observed for MIG (levels increase one month after infection) (7, 8, 11, 12). Indeed, IP-10 has been assessed as an accurate screening tool to detect acute HIV-1 infection in resource-limited settings (8). Elevated IP-10 levels are associated with rapid loss of CD4+ T cells upon HIV-1 infection and faster disease progression, even in individuals with CD4+ T cell count above 500 cells/mm3 (4, 11, 12, 16). Interestingly, we previously observed higher IP-10 and MIG levels in elite controllers who later lost viral control compared with persistent controllers, highlighting the interest of these cytokines as potential biomarkers to predict loss of viremic control (17).
After HIV-1 infection, a strong positive correlation of IP-10 with HIV-1 RNA and a negative correlation with CD4+ T cell count has been reported (4, 18). In turn, after antiretroviral treatment (ART) initiation, there is significant parallelism of plasma IP-10 and MIG levels decrease with HIV-1-RNA suppression and CD4 cell count recovery (15), in such a way that persistent levels of IP-10 can be associated with a CD4+ T cell count that fails to recover (19). However, no studies have assessed their dynamics after treatment initiation with integrase inhibitors.
We aimed to assess the dynamics in plasma IP-10 and MIG levels throughout the study period in a well-characterised cohort of PWH initiating current antiretroviral regimens including integrase inhibitors. Analyses were focused on particular scenarios of interest, stratifying according to age, AIDS-defining events, and CD4+ T cell count at baseline and HIV-1 RNA at month 12 after ART initiation.
Materials and methods
Samples
We used frozen plasma samples stored at -80°C that were prospectively collected from 32 HIV-1-infected treatment-naïve individuals in clinical follow-up at the Spanish HIV-1/AIDS Research Network Cohort (CoRIS), a nationwide multicentre cohort launched in 2004, including individuals with confirmed HIV-1 infection who were recruited in 46 HIV-1 care units of the Spanish Public Health System. A complete description of CoRIS has been published previously (20). Samples were provided by the HIV-1 BioBank integrated into the Spanish AIDS Research Network (RIS).
In addition, we used plasma samples that were prospectively collected from 41 HIV-1-infected treatment-naïve individuals in clinical follow-up at the Complexo Hospitalario Universitario de Ferrol, A Coruña, Galicia, Spain (Ferrol Cohort), who started ART in April 2017. Blood samples were processed at the Galicia Sur Health Research Institute to obtain plasma and peripheral blood mononuclear cells and stored at the Biobank of Vigo for subsequent analysis. Overall, 73 individuals aged > 18 years and who initiated ART from February 2015 to July 2021 were included in the current analysis according to their sample availability in the time points of interest for plasma cytokine measurements.
Ethical considerations
All individuals participating in the study gave their informed consent and protocols were approved by institutional ethical committees.
Chemokine measurement
We assessed changes in plasma chemokine profiles (IP-10 and MIG) pre- and post-ART initiation in the study population, at the following sampling time points: baseline and months 6 and 12 after ART initiation. For the Ferrol cohort, it was possible to assess earlier time points including day 10, day 20, and months 1 and 3 after ART initiation. In turn, within the CoRIS cohort, it was also possible to evaluate longer time points including months 24, 36, and 48 after ART initiation. Plasma chemokine changes were compared with HIV-1 RNA and CD4+-T cell dynamics. Several particular scenarios were assessed: the subset of individuals aged ≥50 or <50 years, baseline CDC category (defining C as having an AIDS-defining event, at HIV-1 diagnosis), baseline CD4+ T count <350 cells/mm3 vs. CD4+ T count ≥350 cells/mm3, and the initial antiretroviral (ARV) regimen (two nucleos[t]ide reverse transcriptase inhibitors [NRTIs] plus a third drug including boosted-protease inhibitors [b-PI] or integrase strand transfer inhibitors [INSTI]).
In addition, within the Ferrol cohort, we were able to explore the IP-10 and MIG levels in individuals with low-level viremia (defined as HIV-1 RNA 20-199 copies/mL), and target detected (TD) or not detected (TND) HIV-1 RNA below 20 copies/mL, at month 12 after ART initiation.
Determinations of IP-10 and MIG (pg/mL) were performed using a multiplex bead-based immunoassay (MILLIPLEX® MAP human high-sensitivity T cell magnetic bead panel; Merck EMD Millipore, Billerica, MA, US).
Statistical analysis
Statistical significance was determined using Friedman, Wilcoxon, Kruskal-Wallis, Spearman´s correlation, and Mann-Whitney tests. All statistical analyses were two-tailed, with an alpha of 0.95; values were considered significant at p <0·05. In the multiple comparisons, all p-values were adjusted using the Bonferroni correction. Analyses were performed using SPSS, IBM, version 19.0.
Descriptive statistics were calculated based on their distributions among the quantitative variables. The normality of these variables was calculated with the Shapiro-Wilk test. Regarding the categorical variables, frequencies and proportions were determined.
The Friedman test was used to estimate differences in medians and interquartile range (IQR) among continuous variables (cytokines, CD4, and HIV-1 RNA plasma concentrations) at different time points. We used the Mann-Whitney U test to compare the median concentrations of plasma determinations among groups. In addition, we utilized Spearman’s correlation coefficient to correlate quantitative variables.
Finally, we used a logistic regression model to assess the impact of multiple baseline predictor variables on high concentrations of plasma IP-10 and MIG at month 12 after ART initiation, defined as >370pg/mL and >955pg/mL, respectively, based on cutoffs used in a previous analysis (15). Values were expressed as adjusted odds ratios (aORs) and 95% confidence intervals (CIs). Baseline variables were defined a priori, before the ART initiation date. Models were adjusted for sex, age, comorbidities, CD4 cell count <350 cells/mm3 at ART initiation, and CDC stage C at HIV infection.
Results
Characteristics of the study population
The baseline characteristics of participants are shown in Table 1. Overall, we included 73 ART-naïve individuals, of which 83.6% were men, 80.8% were individuals from Spain, and 60.2% were men who had sex with other men or declared themselves as being bisexual. The median age was 37 (IQR 31-49) years and 18 (24·6%) individuals were aged 50 years or older. The median CD4+ count was 332 (IQR 149-672) cells/mm3, 36 (49.3%) participants had CD4+ counts <350 cells/mm3, 38.3% had HIV-1 RNA >100,000 copies/mL at ART initiation, and 80.8% had initiated an INSTI-based regimen.
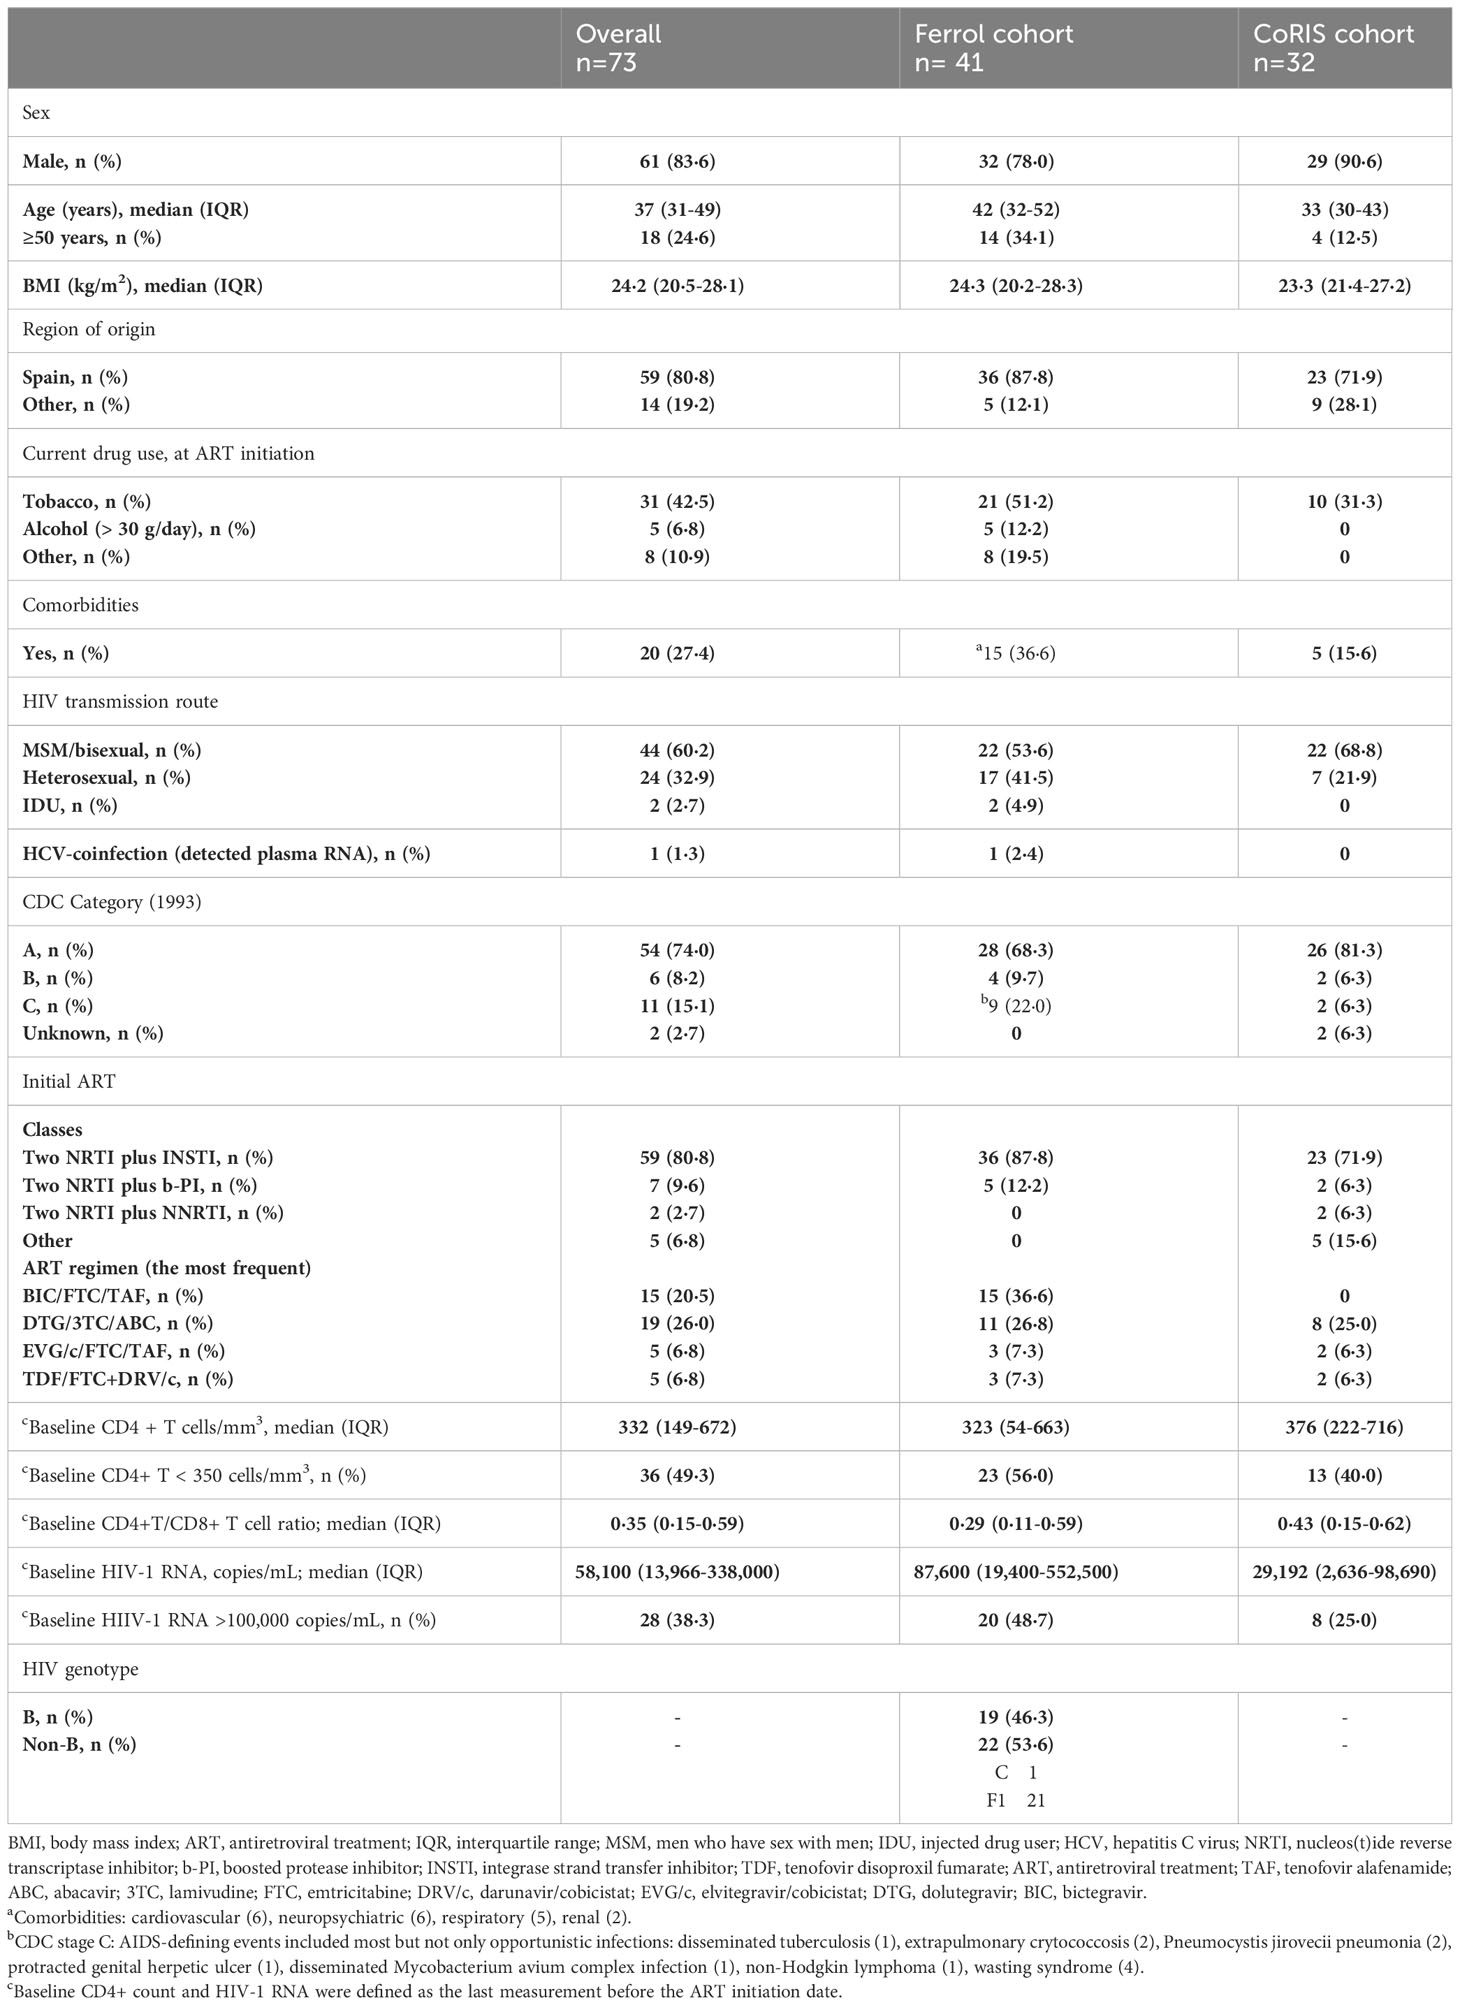
Table 1 Demographic and clinical characteristics of the study cohort.
IP-10 and MIG dynamics after ART initiation
IP-10 and MIG plasma levels showed a significant and consistent decrease vs. baseline throughout the study period following ART initiation (p<0·001) (Figures 1, 2). This decline was consistently and significantly seen in early time points (day 20) for IP-10 (p=0·007) (Figure 2A) and throughout 12 months for both IP-10 and MIG (p<0·001) (Figure 1) after ART initiation. In addition, this trend was confirmed throughout 36 months (for both IP-10 and MIG, p=0·042 and p=0·001, respectively) but only for MIG (p<0·001) at 48 months (for IP-10, p=1·000 at 48 months) (Figure 2B).
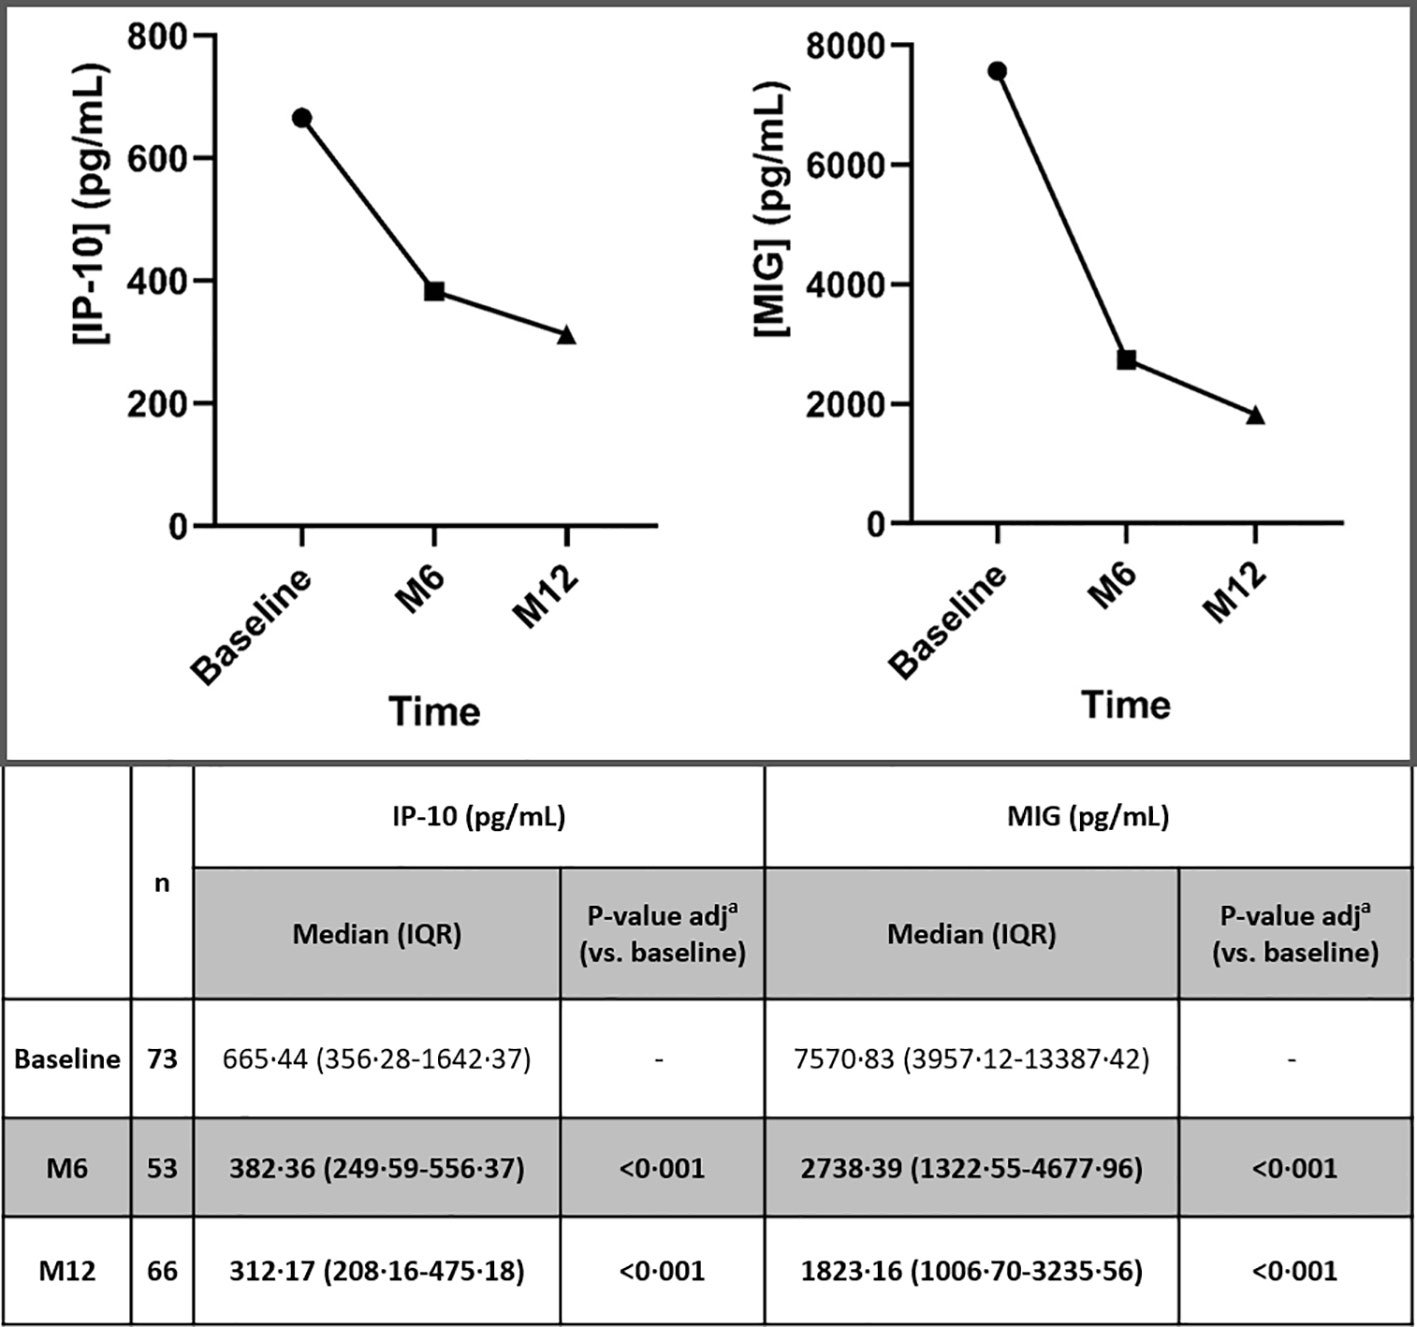
Figure 1 Dynamic changes in IP-10 and MIG levels throughout 12 months, after ART initiation. IP-10, Interferon-inducible protein-10; MIG, Monokine induced by interferon-gamma; ART, antiretroviral treatment; n, number of participants; M6, month 6; M12, month 12; IQR, interquartile range. Statistically significant values of variables are highlighted in bold. IP-10 and MIG plasma levels are represented as plasma concentrations median values. ap-value adjusted by the Bonferroni correction.
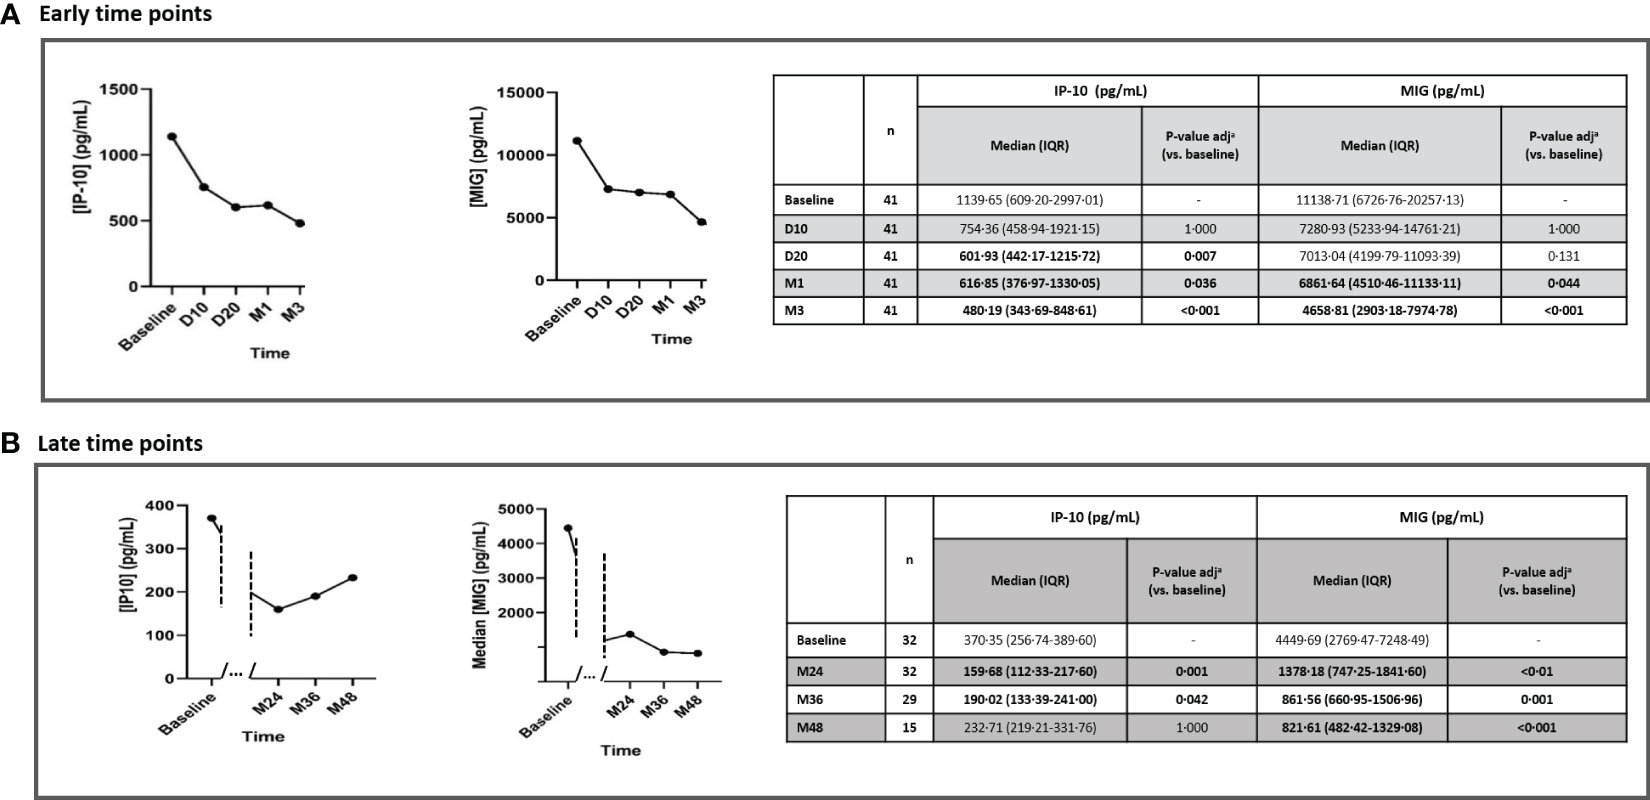
Figure 2 Dynamic changes in IP-10 and MIG levels throughout early time points (A) and late time points (B), after ART initiation. IP-10, Interferon-inducible protein-10; MIG, Monokine induced by interferon-gamma; n, number of participants; ART, antiretroviral treatment; D10, day 10; D20, day 20; M1, month 1; M3, month 3; M24, month 24; M36, month 36; M48, month 48; IQR, interquartile range. Statistically significant values of variables are highlighted in bold. IP-10 and MIG plasma levels are represented as plasma concentrations median values. ap-value adjusted by the Bonferroni correction.
The earlier decay in HIV-1 RNA (month 1, p<0·001) preceded the CD4 cell count increase (month 6, p<0·001) (Table S1).
Overall, there was a significant (p<0·001) parallelism of IP-10 and MIG decrease with CD4+ count recovery (p<0·001) and the HIV-1-RNA decay (p<0·001) at month 12 (Figure S1) and in early time points specifically (Figures 3, 4). Moreover, we observed a positive correlation between IP-10 and MIG plasma levels and HIV-1 RNA, which was more concordant in early time points. Likewise, there was a negative correlation between IP-10 and MIG plasma levels and CD4+ count, which was both overall throughout 12 months (Figures S2, S3) and in early time points (Figures S4, S5).
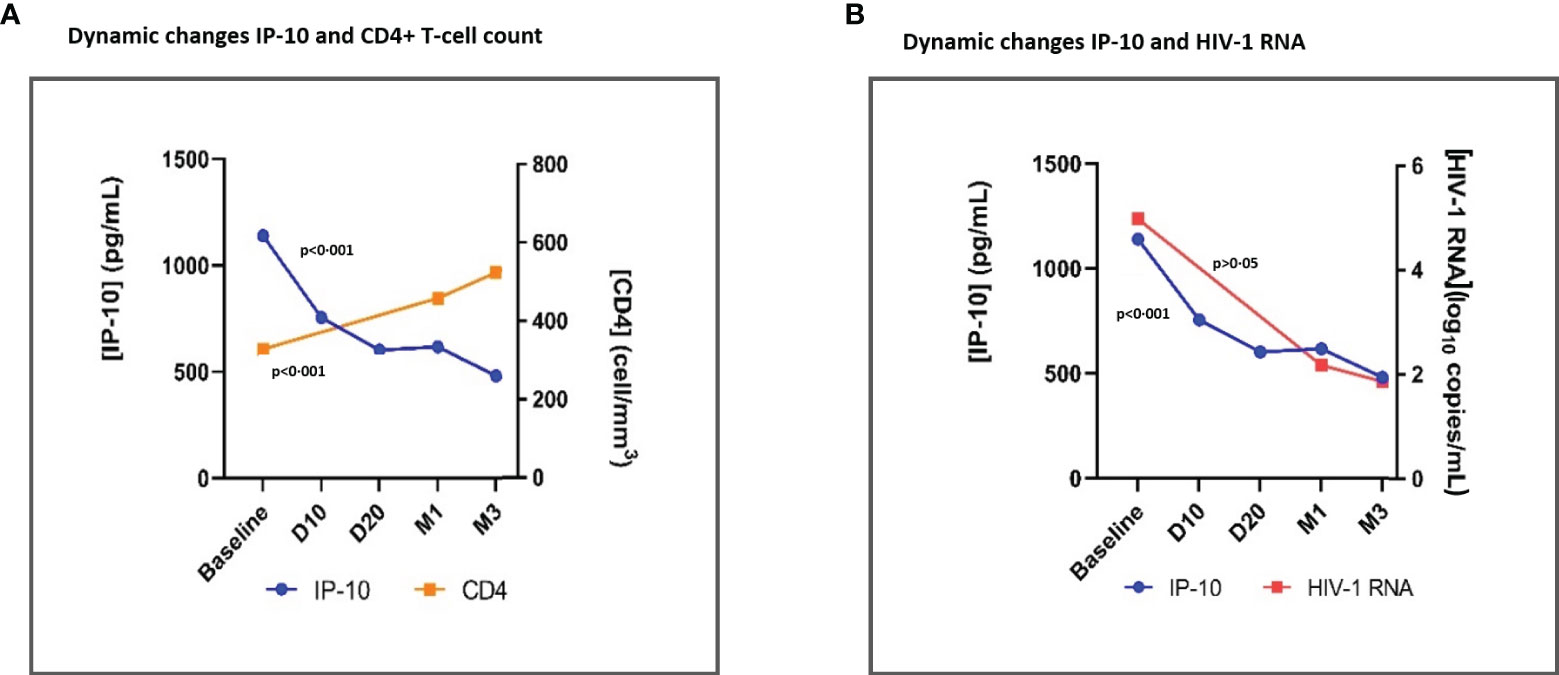
Figure 3 Dynamic changes in IP-10 levels and CD4+ T-cell count (A) and dynamic changes in IP-10 plasma levels and HIV-1 RNA (B), throughout early time points after ART initiation. IP-10, Interferon-inducible protein-10; ART, antiretroviral treatment; D10, day 10; D20, day 20; M1, month 1. Global tendency (throughout all time points represented in the graph) p-value, calculated with the Friedman Test. IP-10, CD4+ T cell count and HIV-1 RNA plasma levels are represented as plasma concentrations median values.
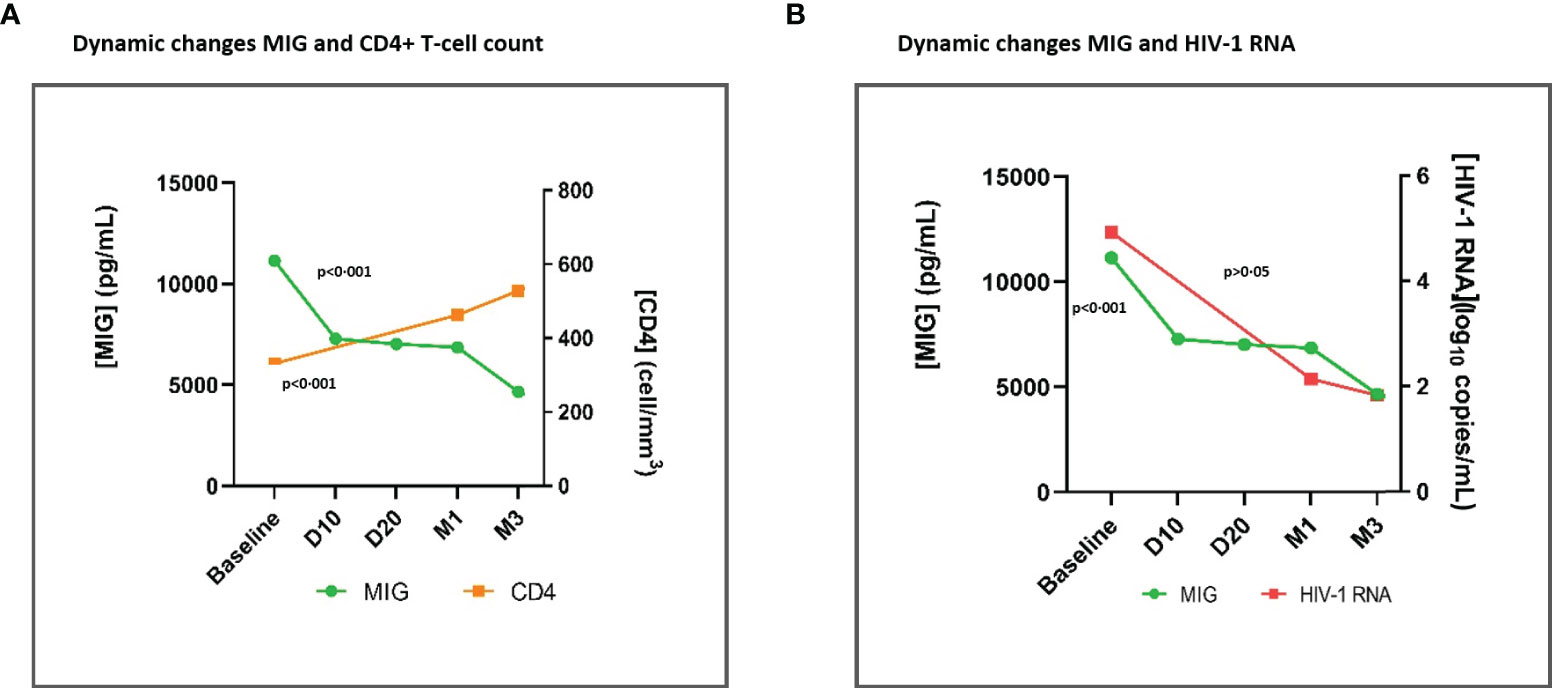
Figure 4 Dynamic changes in MIG levels and CD4+ T-cell count (A) and dynamic changes in MIG levels and HIV-1 RNA (B), throughout early time points after ART initiation. MIG, Monokine induced by interferon-gamma;ART, antiretroviral treatment; D10, day 10; D20, day 20; M1, month 1. Global tendency (throughout all time points represented in the graph) p-value, calculated with the Friedman Test. MIG, CD4+ Tcell count, and HIV-1 RNA plasma levels are represented as plasma concentrations median values.
Impact of age, baseline CDC stage, CD4+ count, and initial third drug of ART on IP-10 and MIG levels
At baseline, PWH aged ≥ 50 years had significantly higher levels of IP-10 (p=0·022) and MIG (p<0.001) than PWH aged <50 years. Upon ART initiation, IP-10 levels in PWH aged ≥50 years showed a sharp reduction and at month 12, IP-10 levels matched PWH aged <50 years. Similarly, MIG levels showed a sharp decrease in PWH aged ≥50 years, but the late decline was slower, and at month 12, differences were still significant vs. PWH aged <50 years (p=0·021) (Figure 5A). However, it´s worth noting that age at ART initiation ≥50 years was not associated with high levels of IP-10 and MIG at month 12 after ART initiation, in the multivariate analysis (Table 2).
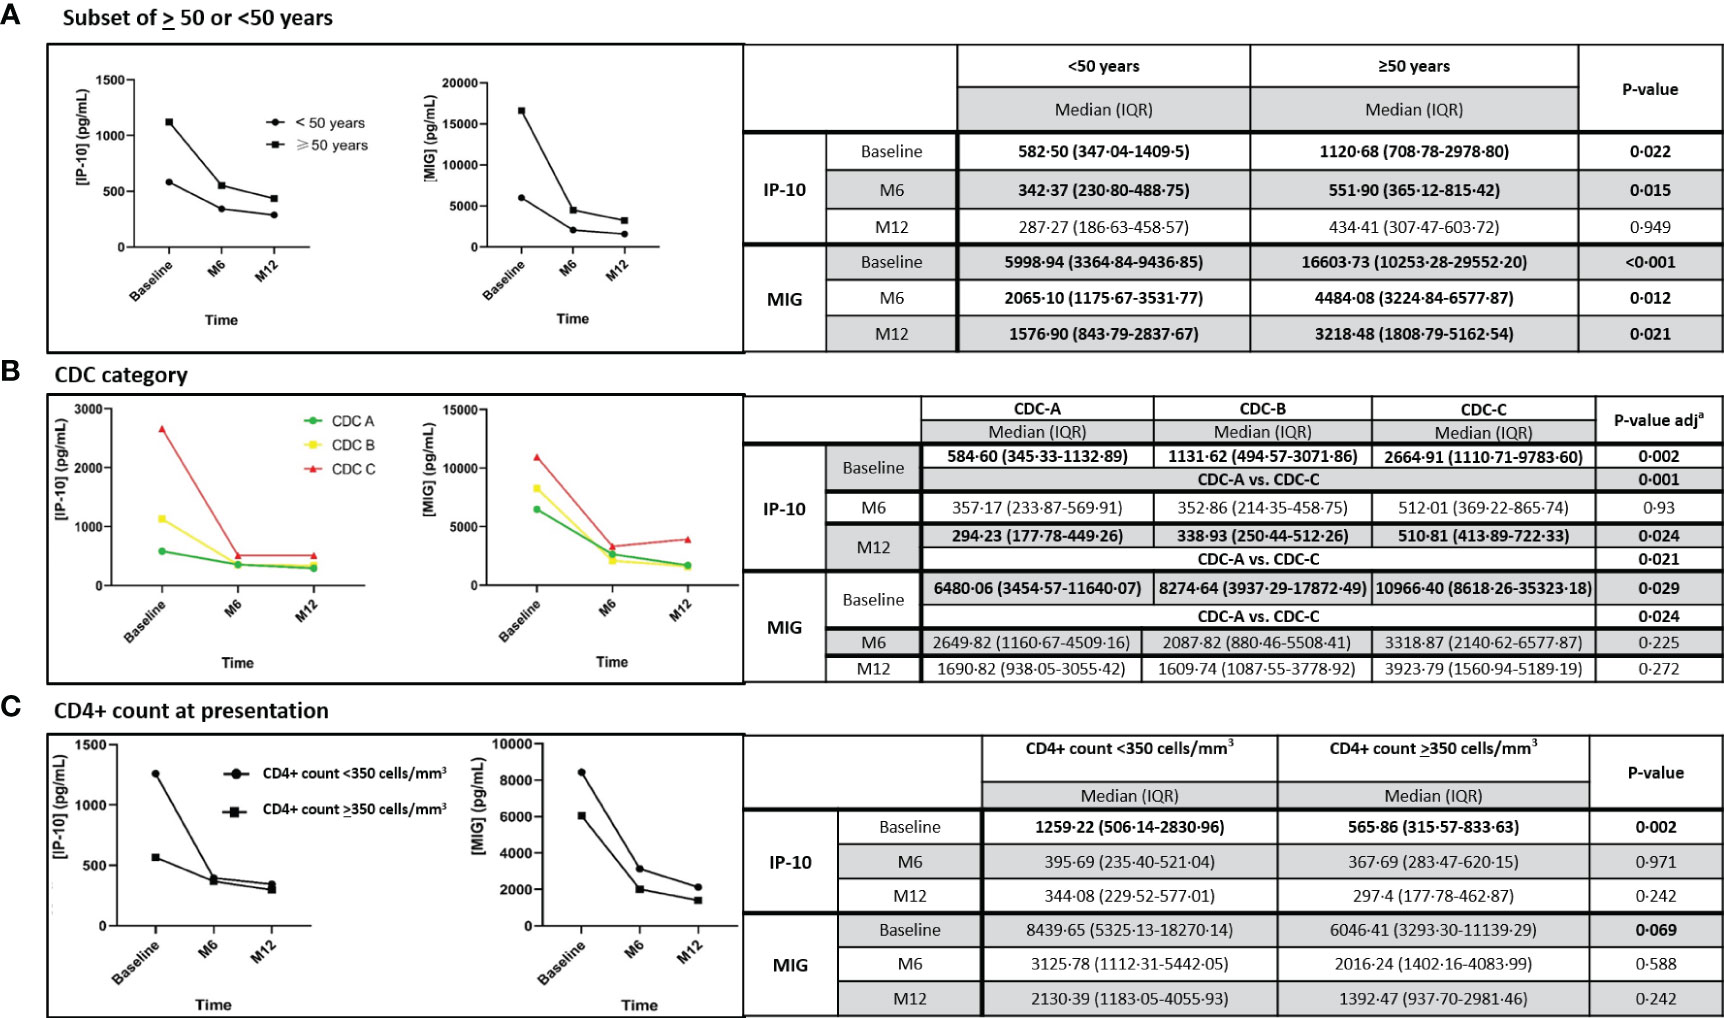
Figure 5 Dynamic changes in IP-10 and MIG levels, in the subset of individuals aged ≥ 50 or <50 years (A), according to the CDC category (B) and to the CD4+ count (C) at ART initiation, throughout 12 months after ART initiation. IP-10, Interferon-inducible protein-10; MIG, Monokine induced by interferon-gamma; M6, month 6; M12, month 12; IQR, interquartile range. Statistically significant values of variables are highlighted in bold. IP-10 and MIG plasma levels are represented as plasma concentrations median values. In Figure 5B, ap-value is adjusted by the Bonferroni correction.
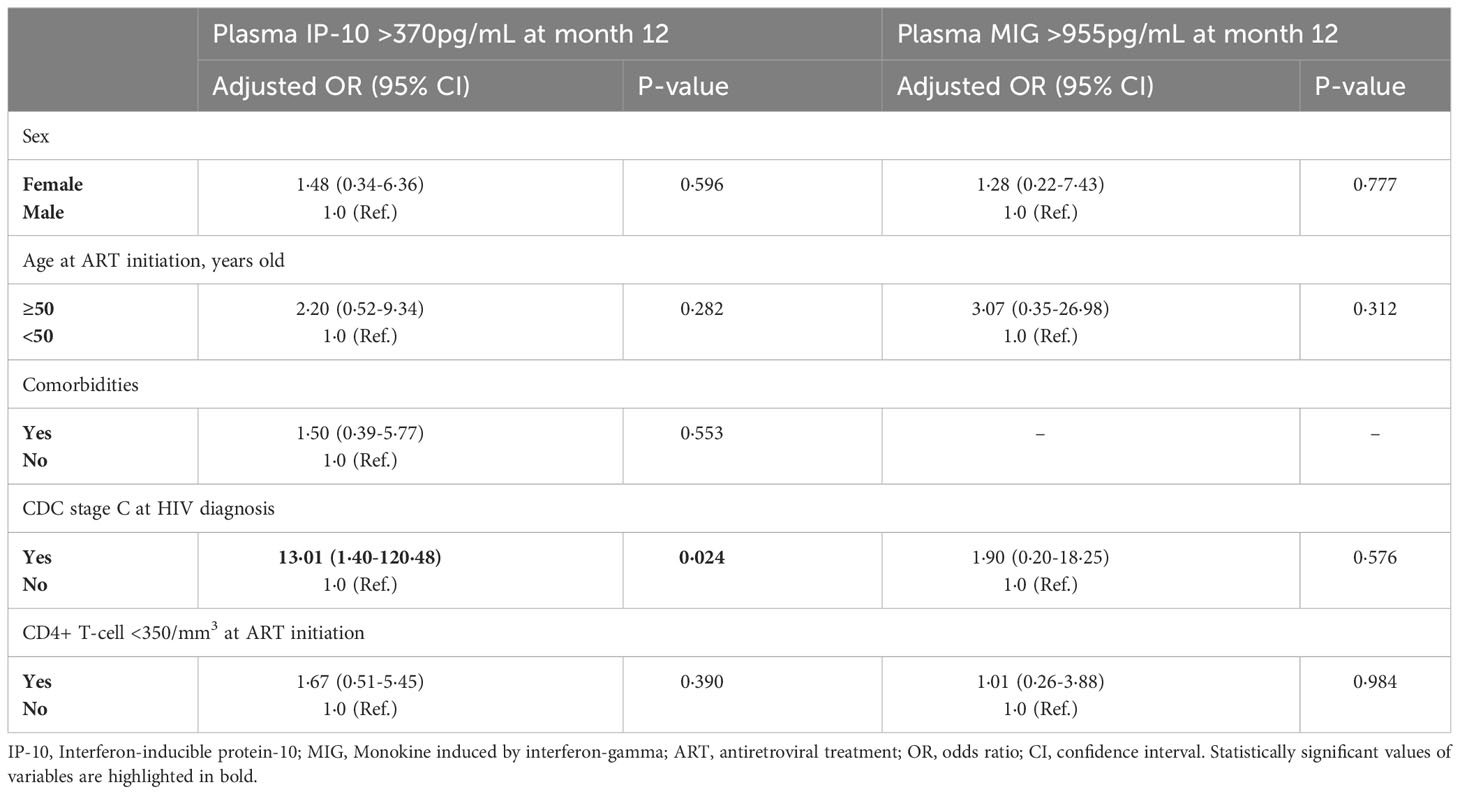
Table 2 Logistic regression analysis (multivariate) of factors associated with high levels of IP-10 and MIG levels at month 12 after ART initiation.
Interestingly, the median CD4+ T count was <350 cells/mm3 regardless if individuals were aged >50 or <50 years (192 vs. 347 cells/mm3, p=0·145). Although, the median time from HIV diagnosis until ART initiation was higher in individuals who were aged ≥50 years than in individuals with ages <50 years, this difference was not statistically significant (66 vs. 44 days, respectively, p= 0.446).PWH with CDC stage C had higher baseline IP-10 levels (p=0·001) and MIG levels (p=0·024) than those with a CDC stage A. After ART initiation, both cytokines decreased, and no significant differences were observed among PWH with a CDC stage C vs. A after month 6 for MIG. However, IP-10 levels were higher in PWH with CDC stage C vs. A at month 12 (p=0·021) (Figure 5B). Indeed, a CDC stage C at ART initiation was identified as the only independent variable associated with having high levels of IP-10 at month 12 (aOR 13·01;95%CI:1·40-120·48, p=0·024), but not with high levels of MIG at month 12, in the multivariate analysis (Table 2).
PWH with CD4+ T count <350 cells/mm3 at ART initiation had higher IP-10 (p=0·002) and MIG levels (p=0·069, borderline significance) than those with CD4+ T count ≥350 cells/mm3. Subsequently, both cytokines decreased and matched those with CD4+ count ≥350 cells/mm3 at month 6 (Figure 5C). CD4+ T count <350 cells/mm3 neither was associated with high levels of IP-10 or MIG at month 12, in the multivariate analysis (Table 2).
Impact of low-level viremia, TD or TND below 20 copies/mL on IP-10 and MIG levels, at month 12 after ART initiation
There were no differences in IP-10 and MIG plasma levels among individuals with TD or TND HIV-1 RNA below 20 copies/mL, or those with low-level viremia (HIV-1 RNA 20-199 copies/mL) at month 12 after ART initiation (Table S2).
Impact of ARV regimen on IP-10 and MIG plasma levels
At day 10 after ART initiation, we found MIG levels significantly lower (in contrast with IP-10) in individuals who initiated two NRTIs plus INSTI vs. two NRTIs plus b-PI (p=0·038) (Figure 6A). No significant impact on IP-10 and MIG plasma levels was identified over time after day 10, regardless of the initial ART (Figure 6B).
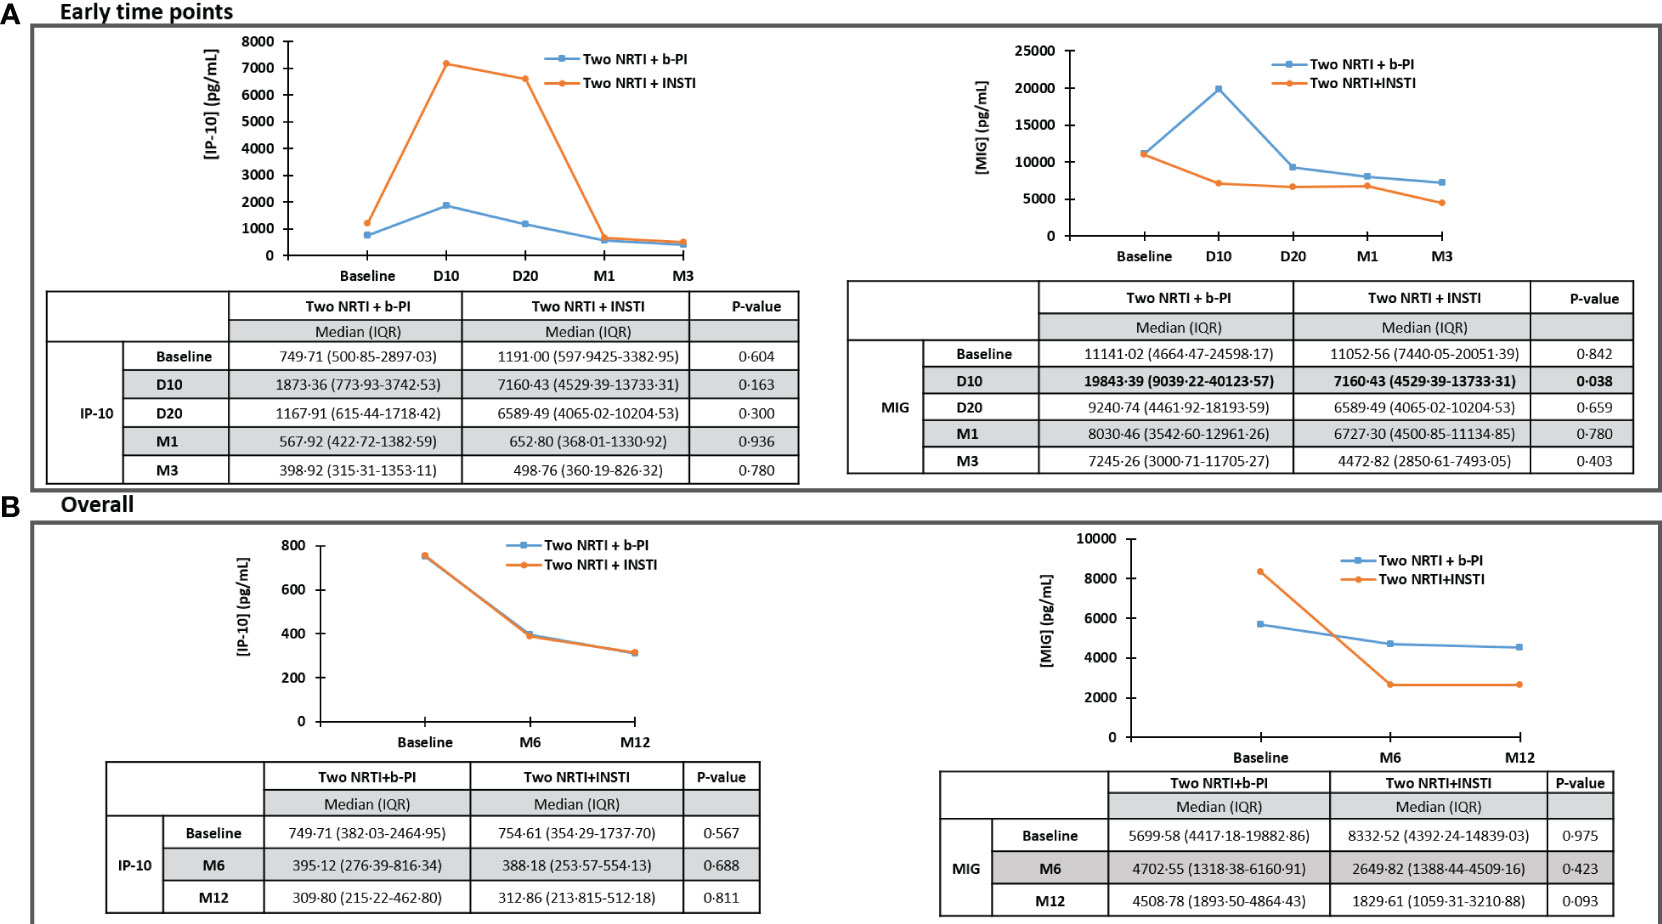
Figure 6 Impact of ARV regimen on IP-10 and MIG, throughout early time points (A) and overall (throughout 12 months) (B). IP-10, Interferon-inducible protein-10; MIG, Monokine induced by interferon-gamma; ARV, antiretroviral; D10, day 10; D20, day 20; M1, month 1; M3, month 3; M6, month 6; M12, month 12; NRTI, nucleos(t)ide reverse transcriptase inhibitors; b-PI, boosted-protease inhibitor; INSTI, integrase strand transfer inhibitor. Statistically significant values of variables are highlighted in bold. IP-10 and MIG plasma levels are represented as plasma concentrations median values.
Discussion
In this prospective cohort analysis, IP-10 and MIG plasma levels showed an early, significant, and consistent decline just a few days after ART initiation and throughout 48 months.
There was significant global parallelism of plasma IP-10 and MIG decreases with HIV-1-RNA suppression and CD4+ T cell count recovery.
These findings are concordant with those previously reported in a French cohort of ART-naïve individuals, but where IP-10 and MIG plasma levels were measured only at baseline and 24 months after ART initiation (15). We were able, in addition, to show a significant reduction of these biomarkers at very early time points (20 days, specifically for IP-10), therefore recognizing both IP-10 and MIG as early ART response surrogate biomarkers. This strongly suggests that these biomarkers are impacted mainly by unsuppressed HIV-1 viremia and they decrease rapidly paralleling the significant HIV-1 RNA decay seen in this cohort just 1 month after ART initiation. The CD4 + T cell count recovery took a longer time, approximately 6 months.
At baseline, we found significantly higher IP-10 and MIG levels in PWH aged ≥ 50 years. A French cohort (n=139) reported similar baseline levels of IP-10 and MIG among age strata, but groups were defined as those aged ≤35 years, those with ages ranging from 35 to 44 years, and those aged ≥44 years (15). Of note, the number of individuals aged ≥50 years included in the upper stratum (>44 years) is unknown. Thus, the inclusion of individuals with ages ranging from 44 to 49 years in the same group could have biased the overall analysis. In our study, after ART initiation, both cytokines showed a sharp reduction in PWH aged ≥50 years, and at month 12, IP-10 levels matched those of PWH aged <50 years. However, the MIG level decline was slower and differences were still significant at month 12. Older age was associated with higher levels of IP-10 at month 24 after ART initiation (OR 1·6 per 10 years older, p=0·047, in multivariate analysis) in the previous French cohort (15). In addition, in an Australian cohort, plasma IP-10 levels were more likely to remain higher in older individuals with comorbidities (frailty, hypertension, and coronary heart disease), which correlates with other traditional cardiovascular disease surrogate plasma biomarkers, including C-reactive protein, IL-6, and fibrinogen (21). Importantly, older age ranges were not defined in either of these cohorts. Although these data could suggest that persistent increases in IP-10 would not be impacted by age by itself, but by existing comorbidities, in our multivariate analysis, older age (≥50 years) and comorbidities were not associated with persistent high levels of IP-10 at month 12 after ART initiation, and neither was it associated with high levels of MIG. The higher rates of HIV-1 RNA suppression achieved with current ART regimens could therefore overcome baseline differences seen in previous cohorts.
In our study, PWH with CDC stage C had higher baseline IP-10 and MIG levels than those with CDC stage A. According to our data, IP-10 increases have been described in PWH with opportunistic infections (tuberculosis and cryptosporidiosis) (7). Baseline levels of IP-10 (but not MIG) were significantly higher in individuals with AIDS-defining events in the aforementioned French cohort, and this condition was not associated with subsequent persistently elevated levels of both cytokines (non-adjusted analysis) at month 24 after ART initiation (15). In our cohort, we were able to find a sharp decrease in both cytokines upon ART initiation in PWH with baseline CDC stage C, and no significant differences were subsequently observed between CDC stages C vs. A, at month 6 after ART initiation. However, CDC stage C was identified as an independent variable associated with a risk of having high levels of IP-10 at month 12 after ART initiation, in the adjusted multivariate analysis.
Interestingly, we observed that PWH with CD4+ count <350 cells/mm3 at ART initiation had higher baseline IP-10 and MIG levels than those with CD4+ count ≥350 cells/mm3. The difference was significant for IP-10 and borderline significant for MIG. Upon ART initiation, both cytokine levels decreased and matched those of PWH with CD4+ count ≥350 cells/mm3 at month 6 and thereafter. A Brazilian cohort found that individuals with CD4+ count <350 cells/mm3 at ART initiation showed higher IP-10 levels compared to those with CD4+ count >350 cells/mm3. In that cohort, individuals who initiated ART with CD4+ count >350 cells/mm3 achieved normalization of plasma IP-10 to levels similar to those of healthy individuals after undergoing ART for a median of 12 months. However, the evolution of IP-10 at 12 months was not compared between PWH with CD4+ count < or > 350 cells/mm3 at ART initiation (22).
In our study, there were no differences in IP-10 and MIG plasma levels among individuals with TND or TD HIV-1 RNA below 20 copies/mL or those with low-level viremia (20-199 copies/mL) at month 12 after ART initiation. This is in agreement with data retrieved from a Swedish case-control study, where IP-10 did not show significant differences between individuals with detected viremia (50-999 copies/mL) and those with persistent virological suppression (HIV-1 RNA <50 copies/mL) after 12 months following ART initiation (23). However, we had limited power in the number of individuals with these characteristics, which precludes a stronger conclusion regarding this association.
Interestingly, on day 10 after ART initiation, MIG (but not IP-10) levels showed a significant decrease in individuals who initiated an INSTI-based regimen (vs. a b-PI-based one). This could be influenced by the well-documented significantly faster initial HIV-1 RNA decay kinetics of INSTIs (24, 25). Importantly, this suggests that MIG is more impacted than IP-10 by this initial plasma HIV-1 RNA decay under INSTIs, and more influenced by that than by the CD4+ T cell count recovery or homeostasis. Even though the differences were only significant at day 10, we saw slower decreases in MIG values with b-PI, which remained numerically higher than those in INSTI-treated individuals up to 12 months. In a French cohort, the decline in IP-10 and MIG levels was significantly smaller with ritonavir-boosted atazanavir than with efavirenz, while no significant difference was found between ritonavir-boosted lopinavir and efavirenz at 24 months after initiating ART (26). However, data were lacking regarding currently recommended INSTI as a third drug. In this regard, in an Italian cohort that divided the individuals into groups according to the third drug at the time of enrollment, the decline in IP-10 plasma levels was significantly lower among individuals receiving non-nucleoside reverse transcriptase inhibitors compared to the b-PI and INSTI group after at least 12 months following ART initiation (27).
Despite both IP-10 and MIG being pro-inflammatory biomarkers, the subtle differences found in their plasma dynamics in the present study could suggest potentially diverse pathophysiological underlying mechanisms. In contrast to MIG, IP-10 (known as being impacted as prematurely as 6 days after primary HIV-1 infection) showed significant declines as early as 20 days after ART initiation. Intriguingly, IP-10 levels remained high at month 12 in PWH with CDC-stage C at HIV diagnosis. A higher reservoir size (partly mediated by IP-10) (6, 28) could contribute to these high IP-10 levels in this subset of individuals. In this regard, it has been postulated that IP-10 could be produced as part of a second wave of cytokine responses, following toll-like receptor (TLR)7/8 stimulation and activation of antigen-presenting cells, though not to the same extent as following primary virus stimulation (12).
Altogether, these results suggest PWH who start ART on time (CD4+ T cell count ≥350 cells/mm3) and achieve levels of HIV-1 viremia below 200 copies/mL after undergoing ART for 12 months, have limited levels of chronic inflammation to impact MIG and IP-10 12 months after ART initiation. Nearly half of PWH in this cohort had CD4+ counts <350 cells/mm3 at baseline. Initiating ART during the first year of HIV infection reduces numerous biomarkers of inflammation and immune activation that are impacted by different inflammatory pathways. This response is more remarkable during acute HIV infection, potentially because of an early effect on attaining a smaller HIV-1 latent reservoir (partly mediated through IP-10) (6) and viral diversity (28). A baseline CDC-stage C is associated with a greater HIV reservoir and higher levels of persistent inflammation, with high IP-10 levels at month 12 after ART initiation in our study. These data suggest that IP-10 would be more impacted than MIG by a greater HIV reservoir. In turn, MIG seems to be more impacted than IP-10 by initial plasma HIV-1 RNA decay, as evidenced by a greater decline with INSTI-based regimens (vs. a b-PI-based one).
Overall, these findings reinforce the recommendation of early ART, prioritizing INSTI-based regimens, resulting in a decrease in chronic immune activation and inflammation.
At baseline, PWH aged >50 years, a CDC-stage C, or CD4+ T count <350 cells/mm3 had higher levels of both IP-10 and MIG levels. All these variables are associated with late HIV diagnosis. This finding reinforces the need to achieve timely diagnosis of individuals with occult or unknown HIV infection. This study adds information regarding early and late time points in the dynamics of IP-10 and MIG plasma levels, as well as in current scenarios in clinical practice: PWH aged ≥50 years, INSTI-based ART, and low-level and TND viremia.
Further analyses are required on the potential impact on plasma IP-10 and MIG and subsequent chronic immune dysfunction of new ART regimens, including dolutegravir-based two-drug regimens and long-acting formulations, as well as in people with persistent immune discordance.
Our study has limitations. The small sample size could underpower some of the analyses, especially those evaluating particular scenarios. Despite internal quality control and the prospective design, in a real-life cohort study, errors and heterogeneity in data gathering and recording cannot be ruled out. Finally, IP-10 and MIG could be impacted by other simultaneous uncontrolled conditions, such as viral or bacterial coinfections, which could act as potential confounding factors.
In conclusion, in this prospective cohort, IP-10 and MIG arise as soluble plasma biomarkers that showed an early, significant, and consistent decline in their plasma levels just a few days after ART initiation, paralleling the HIV-1 RNA decay and CD4+ T cell recovery. PWH with ages ≥50 years, CDC stage C, or PWH with CD4+ count <350 cells/mm3 had higher baseline IP-10 and MIG levels, with sharp subsequent declines. All of them matched their counterparts several months following ART initiation. PWH treated with INSTI-based regimens had faster declines of MIG as early as day 10. Overall, these findings suggest that both IP-10 and MIG are sensitive biomarkers of early antiretroviral treatment response, and are mainly impacted by plasma HIV-1 viremia, low CD4+ counts, and late ART initiation. Starting ART with CD4+ T cell count >350 cells/mm3 had limited impact on MIG or IP-10 levels. Once ART has been initiated, having TD HIV-1 RNA below 20 copies/mL or even low-level viremia (<200 copies/mL) did not impact MIG or IP-10 levels. These issues merit further investigation in larger cohorts and evaluation of new antiretroviral treatment strategies.
Data availability statement
The original contributions presented in the study are included in the article/Supplementary Material. Further inquiries can be directed to the corresponding author.
Ethics statement
The study was approved by the regional Ethic Committee (CAEIG), an external scientific and ethics committee of the HIV Biobank (Spanish HIV/AIDS Research Network).The studies were conducted in accordance with the local legislation and institutional requirements. The participants provided their written informed consent to participate in this study.
Author contributions
HÁ: Conceptualization, Writing – original draft, Writing – review & editing. AG-V: Writing – review & editing. AM: Writing – review & editing. AS-A: Writing – review & editing. BC-C: Methodology, Writing – review & editing. AP-G: Writing – review & editing. JA-D: Methodology, Writing – review & editing. IM-B: Methodology, Writing – review & editing. MG-R: Writing – review & editing. SM: Writing – review & editing. TA: Writing – review & editing. MM-A: Writing – review & editing. EB: Writing – review & editing. CG: Writing – review & editing. JML: Conceptualization, Writing – original draft, Writing – review & editing. EP: Conceptualization, Writing – original draft, Writing – review & editing.
Centers and investigators involved in CoRIS
Please see the Supplementary file Data Sheet 2 for the full list of members.
Funding
The author(s) declare financial support was received for the research, authorship, and/or publication of this article. This study has been funded by Instituto de Salud Carlos III [PI16/02159, BA18/00034, PI19/00747, PI22/01341, CM20/00243] and cofunded by the European Regional Development Fund, “A way to make Europe”; Red Española de Investigación en SIDA; Xunta de Galicia-Axencia Galega de Innovación (IN606A-2022/019); INVESTIGO Next GenerationEU Program TR349V-2022-10000052-00; Intramural Grant Program Galicia Sur Health Research Institute (CI22-A-2).
Acknowledgments
We want to particularly acknowledge the patients in this study for their participation and to the HIV-1 BioBank integrated into the Spanish AIDS Research Network and collaborating Centres for the generous gifts of clinical samples used in this work. The HIV-1 BioBank, integrated into the Spanish AIDS Research Network, is supported by Instituto de Salud Carlos III, Spanish Health Ministry (Grant n° RD06/0006/0035, RD12/0017/0037 and RD16/0025/0019) as part of the Plan Nacional I+D+i and cofinanced by ISCIII- Subdirección General de Evaluación y el Fondo Europeo de Desarrollo Regional (FEDER)”. This study would not have been possible without the collaboration of all the patients, the medical and nursing staff, and the data managers who have taken part in the project. The RIS Cohort (CoRIS) is funded by the Instituto de Salud Carlos III through the Red Temática de Investigación Cooperativa en SIDA (RIS C03/173, RD12/0017/0018 and RD16/0002/0006) as part of the Plan Nacional I+D+i and cofinanced by ISCIII-Subdirección General de Evaluacion and the Fondo Europeo de Desarrollo Regional (FEDER)”.
Conflict of interest
The authors declare that the research was conducted in the absence of any commercial or financial relationships that could be construed as a potential conflict of interest.
Publisher’s note
All claims expressed in this article are solely those of the authors and do not necessarily represent those of their affiliated organizations, or those of the publisher, the editors and the reviewers. Any product that may be evaluated in this article, or claim that may be made by its manufacturer, is not guaranteed or endorsed by the publisher.
Supplementary material
The Supplementary Material for this article can be found online at: https://www.frontiersin.org/articles/10.3389/fimmu.2023.1257725/full#supplementary-material
Supplementary Figure S1 | Dynamic changes in IP-10 plasma levels and CD4+ T-cell (A); dynamic changes in IP-10 plasma levels and HIV-1 RNA (B); dynamic changes in MIG plasma levels and CD4+ T-cell (C); dynamic changes in MIG plasma levels and HIV-1 RNA (D), throughout 12 months after ART initiation. IP-10, Interferon-inducible protein 10; MIG, Monokine induced by interferon-gamma; ART, antiretroviral treatment; M6, month 6; M12, month 12. Global tendency (throughout all time points represented in graph) p value, calculated with the Friedman Test. IP-10, MIG, CD4+ T-cell count and HIV-1 RNA plasma levels are represented as plasma concentrations median values.
Supplementary Figure S2 | Correlation between IP-10 plasma levels and CD4+ T-cell count (A) and correlation between IP-10 plasma levels and HIV-1 RNA (B), throughout 12 months after ART initiation. IP-10, Interferon-inducible protein-10; ART, antiretroviral treatment; r, correlation coefficient Spearman. Statistically significant values of variables are highlighted in bold.
Supplementary Figure S3 | Correlation between MIG plasma levels and CD4+ T-cell count (A) and correlation between MIG plasma levels and HIV-1 RNA (B), throughout 12 months after ART initiation. MIG, Monokine induced by interferon-gamma; ART, antiretroviral treatment; r, correlation coefficient Spearman. Statistically significant values of variables are highlighted in bold.
Supplementary Figure S4 | Correlation between IP-10 plasma levels and CD4+ T-cell count (A) and correlation between IP-10 plasma levels and HIV-1 RNA (B), throughout early time points after ART initiation. IP-10, Interferon-inducible protein-10; ART, antiretroviral treatment; r, correlation coefficient Spearman. Statistically significant values of variables are highlighted in bold.
Supplementary Figure S5 | Correlation between MIG plasma levels and CD4+ T-cell count (A) and correlation between MIG plasma levels and HIV-1 RNA (B), throughout early time points after ART initiation. MIG, Monokine induced by interferon-gamma; ART, antiretroviral treatment; r, correlation coefficient Spearman. Statistically significant values of variables are highlighted in bold.
Supplementary Table S1 | Dynamic changes in CD4+ T-cell count and HIV-1 RNA after ART initiation overall (throughout 12 months) (A). Dynamic changes in CD4+ T-cell count and HIV-1 RNA after ART initiation throughout early time points (B). ART, antiretroviral treatment; D10, day 10; D20, day 20; M1, month 1; M3, month 3; M6, month 6; M12, month 12; IQR, interquartile range. Statistically significant values of variables are highlighted in bold.
Supplementary Table S2 | Impact of low-level viremia, target detected or target not detected below 20 copies/mL on IP-10 and MIG plasma levels, 12 months after ART initiation. IP-10, Interferon-inducible protein-10; MIG, Monokine induced by interferon-gamma; M12, month 12; n, number of individuals. Statistically significant values of variables are highlighted in bold. * Low-level viremia is defined as HIV-1 RNA 20-199copies/mL.
Supplementary Data Sheet 2 | Centres and investigators involved in CoRIS.
References
1. Hunt PW, Lee SA, Siedner MJ. Immunologic biomarkers, morbidity, and mortality in treated HIV-1 infection. J Infect Dis (2016) 214(Suppl 2):S44–50. doi: 10.1093/infdis/jiw275
2. Ellwanger JH, Kulmann-Leal B, Ziliotto M, Bogo Chies JA. HIV infection, chromosome instability, and micronucleus formation. Viruses (2023) 15(1):155. doi: 10.3390/v15010155
3. Padovan E, Spagnoli GC, Ferrantini M, Heberer M. IFN-alpha2a induces IP-10/CXCL10 and MIG/CXCL9 production in monocyte-derived dendritic cells and enhances their capacity to attract and stimulate CD8+ effector T cells. J Leukoc Biol (2002) 71(4):669–76. doi: 10.1189/jlb.71.4.669
4. Ploquin MJ, Madec Y, Casrouge A, Huot N, Passaes C, Lécuroux C, et al. Elevated basal pre-infection CXCL10 in plasma and in the small intestine after infection are associated with more rapid HIV-1/SIV disease onset. PloS Pathog (2016) 12(8):e1005774. doi: 10.1371/journal.ppat.1005774
5. Foley JF, Yu C-R, Solow R, Yacobucci M, Peden KWC, Farber JM. Roles for CXC chemokine ligands 10 and 11 in recruiting CD4+ T cells to HIV-1-infected monocyte-derived macrophages, dendritic cells, and lymph nodes. J Immunol (2005) 174(8):4892–900. doi: 10.4049/jimmunol.174.8.4892
6. Wang Z, Yin X, Ma M, Ge H, Lang B, Sun H, et al. IP-10 promotes latent HIV infection in resting memory CD4+ T cells via LIMK-cofilin pathway. Front Immunol (2021) 12:656663. doi: 10.3389/fimmu.2021.656663
7. Yin X, Wang Z, Wu T, Ma M, Zhang Z, Chu Z, et al. The combination of CXCL9, CXCL10 and CXCL11 levels during primary HIV-1 infection predicts HIV-1 disease progression. J Transl Med (2019) 17(1):417. doi: 10.1186/s12967-019-02172-3
8. Jiao Y, Zhang T, Wang R, Zhang H, Huang X, Yin J, et al. Plasma IP-10 is associated with rapid disease progression in early HIV-1 infection. Viral Immunol (2012) 25(4):333–7. doi: 10.1089/vim.2012.0011
9. Pastor L, Casellas A, Carrillo J, Alonso S, Parker E, Fuente-Soro L, et al. IP-10 levels as an accurate screening tool to detect acute HIV-1 infection in resource-limited settings. Sci Rep (2017) 7(1):8104. doi: 10.1038/s41598-017-08218-0
10. Pastor L, Urrea V, Carrillo J, Parker E, Fuente-Soro L, Jairoce C, et al. Dynamics of CD4 and CD8 T-cell subsets and inflammatory biomarkers during early and chronic HIV-1 infection in mozambican adults. Front Immunol (2018) 8:1925. doi: 10.3389/fimmu.2017.01925
11. Lei J, Yin X, Shang H, Jiang Y. IP-10 is highly involved in HIV-1 infection. Cytokine (2019) 115:97–103. doi: 10.1016/j.cyto.2018.11.018
12. Simmons RP, Scully EP, Groden EE, Arnold KB, Chang JJ, Lane K, et al. HIV-1 infection induces strong production of IP-10 through TLR7/9-dependent pathways. AIDS (2013) 27(16):2505–17. doi: 10.1097/01.aids.0000432455.06476.bc
13. Castley A, Berry C, French M, Fernandez S, Krueger R, Nolan D. Elevated plasma soluble CD14 and skewed CD16+ monocyte distribution persist despite normalisation of soluble CD163 and CXCL10 by effective HIV-1 therapy: a changing paradigm for routine HIV-1 laboratory monitoring? PloS One (2014) 9(12):e115226. doi: 10.1371/journal.pone.0115226
14. Reepalu A, Arimide DA, Balcha TT, Björkman P, Medstrand P. Brief report: interferon-γ-inducible protein 10-A potential marker for targeted viral load monitoring of antiretroviral treatment? J Acquir Immune Defic Syndr (2020) 83(5):475–8. doi: 10.1097/QAI.0000000000002292
15. Hattab S, Guiguet M, Carcelain G, Fourati S, Guihot A, Autran B, et al. Soluble biomarkers of immune activation and inflammation in HIV-1 infection: impact of 2 years of effective first-line combination antiretroviral therapy. HIV-1 Med (2015) 16(9):553–62. doi: 10.1111/hiv.12257
16. Oliver BG, Price P, Wand H, French MA. Increased plasma CXCL10 may be a marker of increased risk of immune restoration disease associated with nonviral pathogens. J Acquir Immune Defic Syndr (2012) 59(3):e47–9. doi: 10.1097/QAI.0b013e3182427796
17. Poveda E, Fitzgerald W, Reglero C, Crespo M, Mariño A, Álvarez H, et al. (2021). “Elevated plasma cytokines in elite control: IP-10 and MIG predict loss of control,” in Conference on retroviruses and opportunistic infections. [United States: International Antiviral Society (IAS)]. Available at: https://user-degqumh.cld.bz/vCROI-2021-Abstract-eBook.
18. Keating SM, Golub ET, Nowicki M, Young M, Anastos K, Crystal H, et al. The effect of HIV-1 infection and HAART on inflammatory biomarkers in a population-based cohort of women. AIDS (2011) 25(15):1823–32. doi: 10.1097/QAD.0b013e3283489d1f
19. Stiksrud B, Aass HC, Lorvik KB, Ueland T, Trøseid M, Dyrhol-Riise AM. Activated dendritic cells and monocytes in HIV-1 immunological nonresponders: HIV-1-induced interferon-inducible protein-10 correlates with low future CD4+ recovery. AIDS (2019) 33(7):1117–29. doi: 10.1097/QAD.0000000000002173
20. Sobrino-Vegas P, Gutiérrez F, Berenguer J, Labarga P, García F, Alejos-Ferreras B, et al. The Cohort of the Spanish HIV Research Network (CoRIS) and its associated biobank; organizational issues, main findings and losses to follow-up. Enferm Infecc Microbiol Clin (2011) 29(9):645–53. doi: 10.1016/j.eimc.2011.06.002
21. Angelovich TA, Hearps AC, Maisa A, Martin GE, Lichtfuss GF, Cheng W-J, et al. Viremic and virologically suppressed HIV-1 infection increases age-related changes to monocyte activation equivalent to 12 and 4 years of aging, respectively. J Acquir Immune Defic Syndr (2015) 69(1):11–7. doi: 10.1097/QAI.0000000000000559
22. Valverde-Villegas JM, de Medeiros RM, Ellwanger JH, Santos BR, de Melo MG, de Matos Almeida SE, et al. High CXCL10/IP-10 levels are a hallmark in the clinical evolution of the HIV-1 infection. Infect Genet Evol (2018) 57:51–8. doi: 10.1016/j.meegid.2017.11.002
23. Elvstam O, Medstrand P, Jansson M, Isberg PE, Gisslén M, Björkman P. Is low-level HIV-1 viraemia associated with elevated levels of markers of immune activation, coagulation and cardiovascular disease? HIV-1 Med (2019) 20(9):571–80. doi: 10.1111/hiv.12756
24. Clotet B, Feinberg J, van Lunzen J, Khuong-Josses MA, Antinori A, Dumitru I, et al. Once-daily dolutegravir versus darunavir plus ritonavir in antiretroviral-naive adults with HIV-1 infection (FLAMINGO): 48 week results from the randomised open-label phase 3b study. Lancet (2014) 383(9936):2222–31. doi: 10.1016/S0140-6736(14)60084-2
25. Walmsley SL, Antela A, Clumeck N, Duiculescu D, Eberhard A, Gutiérrez F, et al. Dolutegravir plus abacavir-lamivudine for the treatment of HIV-1 infection. N Engl J Med (2013) 369(19):1807–18. doi: 10.1056/NEJMoa1215541
26. Hattab S, Guihot A, Guiguet M, Fourati S, Carcelain G, Caby F, et al. Comparative impact of antiretroviral drugs on markers of inflammation and immune activation during the first two years of effective therapy for HIV-1 infection: an observational study. BMC Infect Dis (2014) 4(14):122. doi: 10.1186/1471-2334-14-122
27. Maritati M, Alessandro T, Zanotta N, Comar M, Bellini T, Sighinolfi L, et al. A comparison between different anti-retroviral therapy regimes on soluble inflammation markers: a pilot study. AIDS Res Ther (2020) 17(1):61. doi: 10.1186/s12981-020-00316-w
Keywords: antiretroviral treatment, IP-10, MIG, biomarkers, HIV-1 viral decay
Citation: Álvarez H, Gutiérrez-Valencia A, Mariño A, Saborido-Alconchel A, Calderón-Cruz B, Pérez-González A, Alonso-Domínguez J, Martínez-Barros I, Gallego-Rodríguez M, Moreno S, Aldamiz T, Montero-Alonso M, Bernal E, Galera C, Llibre JM and Poveda E (2023) IP-10 and MIG are sensitive markers of early virological response to HIV-1 integrase inhibitors. Front. Immunol. 14:1257725. doi: 10.3389/fimmu.2023.1257725
Received: 12 July 2023; Accepted: 12 September 2023;
Published: 18 October 2023.
Edited by:
Lisardo Bosca, Autonomous University of Madrid, SpainReviewed by:
Joel Henrique Ellwanger, Federal University of Rio Grande do Sul, BrazilMariza Gonçalves Morgado, Oswaldo Cruz Foundation (Fiocruz), Brazil
Copyright © 2023 Álvarez, Gutiérrez-Valencia, Mariño, Saborido-Alconchel, Calderón-Cruz, Pérez-González, Alonso-Domínguez, Martínez-Barros, Gallego-Rodríguez, Moreno, Aldamiz, Montero-Alonso, Bernal, Galera, Llibre and Poveda. This is an open-access article distributed under the terms of the Creative Commons Attribution License (CC BY). The use, distribution or reproduction in other forums is permitted, provided the original author(s) and the copyright owner(s) are credited and that the original publication in this journal is cited, in accordance with accepted academic practice. No use, distribution or reproduction is permitted which does not comply with these terms.
*Correspondence: Hortensia Álvarez, aG9ydGVuc2lhLmFsdmFyZXouZGlhekBzZXJnYXMuZXM=
†These authors have contributed equally to this work and share senior authorship